Materials Processing
| Fluid Dynamics & Materials Processing |
DOI: 10.32604/fdmp.2021.015200
ARTICLE
Haemodynamic Analysis of the Relationship between the Morphological Alterations of the Ascending Aorta and the Type A Aortic-Dissection Disease
1Key Laboratory of Ocean Energy Utilization and Energy Conservation of Ministry of Education Affiliation, Dalian University of Technology, Dalian, 116024, China
2Department of Anesthesiology, The First Affiliated Hospital of Dalian Medical University, Dalian, 116011, China
*Corresponding Author: Lizhong Mu. Email: muliz@dlut.edu.cn
Received: 01 December 2020; Accepted: 01 March 2021
Abstract: Type A aortic dissection (AD) is one of the most serious cardiovascular diseases, whose risk predictors are controversial. The purpose of this research was to investigate how elongation accompanied by dilation of the ascending aorta (AAo) affects the relevant haemodynamic characteristics using image-based computational models. Five elongated AAos with different levels of dilation have been reconstructed based on the centerlines data of an elderly and an AD patient. Numerical simulations have been performed assuming an inflow waveform and a Windkessel model with three elements for all outflow boundaries. The numerical results have revealed that the elongation of AAo can disturb the systolic helical flow pattern between the root of AAo and the aortic arch. The helical flow inside the AAo starts to develop into a vortex flow when the elongated AAo becomes dilated. The vortex gives rise to a localized oscillatory shear index at the ostia of the brachiocephalic artery (BA) and the inner curve of the aortic arch. This study suggests that abnormal growth of AAo, especially accompanied by its moderate dilation, can be considered as morphological risk factors of AD.
Keywords: Type A aortic dissection; morphological alterations; oscillatory shear index; helical flow; vortex flow
Aortic dissection (AD) is an acute and severe cardiovascular disease, whose pathogenesis is still unclear [1,2]. Degeneration of the media, intramural haematoma in the ascending aorta (AAo), and intimal atherosclerosis are all considered to participate in the progression of AD [3–5]. An aorta that suffers from dissection experiences separation of the lumen into a true one and a false one. The true lumen is the original aortic vessel, while the false lumen is the newly developed passageway inside the media layer of the aortic wall. AD with involvement of the AAo or the aortic arch are classified as Stanford type A AD [6,7], which has a high mortality rate [8–10].
Studies have shown that the incidence of AD is strongly correlated with its morphological variation, such as the increasing aortic diameter [11–13]. Pilot studies have reported that the 6-cm diameter of AAo may be an indicative risk factor of AD. In contrast, a 5.5-cm diameter was frequently adopted as the threshold in current guidelines for aortic repair [11]. However, recent study argued that the aortas in most of the AD patients show little differences in diameter [14]. Thus, the diameter threshold to be considered as a risk factor for type A AD is currently controversial [15,16]. Other morphological alterations of AAo, such as its elongation and dilation, have also been pointed out to be significantly correlated with the risk of AD [17,18]. Elongation and dilation of the AAo are related to increasing age or hypertension [19]. The length of the AAo increases by 12% every 10 years [20], and the changes in aortic morphology caused by hypertension are similar to those of age increase for an additional 2–7 years. Kim et al. identified 4,654 nonsyndromic adults with the diameters of AAo within 40 to 55 mm and then summarized that the risks of type A AD were significantly correlated with two factors, the dilation of maximum aortic diameter and the increasing age of patients whose AAo became moderately dilated [17]. Meanwhile, based on computed tomography (CT) data obtained before the onset of AD, Heuts et al. [18] suggested that two more factors should be alert, they are aortic volume and the length of AAo.
Variations in the aortic morphology induce changes in the haemodynamic parameters and the endothelial layer, consequently, resulting in the remodeling of the vascular wall [21–24]. An elevated wall shear stress (WSS) is correlated with the reduction of elastic fibers in the AAo, while a larger WSS gradient can induce dysfunction of the endothelium in areas that effected by disturbed flow [21,23,24]. Meanwhile, low WSS and high oscillatory shear index (OSI) may be related to the development and rupture of large atherosclerotic aneurysms [22]. The morphological factors, such as elongation and dilation of the AAo, may play an essential role in the progress of AD. Unfortunately, the haemodynamic changes caused by the elongation and dilation of the AAo are still unknown.
In this study, numerical researches were carried out to quantitatively discuss the relationship between morphological alterations of AAo and type A AD. Based on the geometric features of the AAo of a healthy subject (C1), an elderly healthy subject (C2), and a patient with type A AD (AD case), multiple aortic models with elongated, dilated and elongated AAo were reconstructed, respectively. Flow rate waveform and three-element Windkessel model were applied as the inlet and outlet boundary conditions. Flow patterns, including WSS-related numerical results and streamlines, were then compared in detail.
2.1 Image Acquisition and Structural Feature Statistics
To obtain the morphological characteristics for the elongating and dilating AAo that may be related to the onset of AD, the image sequence acquisition, aortic model reconstruction and the geometric structure characteristics statistics were carried out, respectively.
In this study, we collected CT image data of 15 aortas including 10 AD cases and 5 healthy cases, which were reconstructed to obtain detailed data of AAo elongation and dilation. At the same time, the position of the aortic sinus with age was obtained. The in-plane resolution of the sequential CT images is 0.84 mm per pixel, with an interslice distance of 0.5 mm. Fig. 1a shows the identifiable true and false lumens in the cross-sectional image.
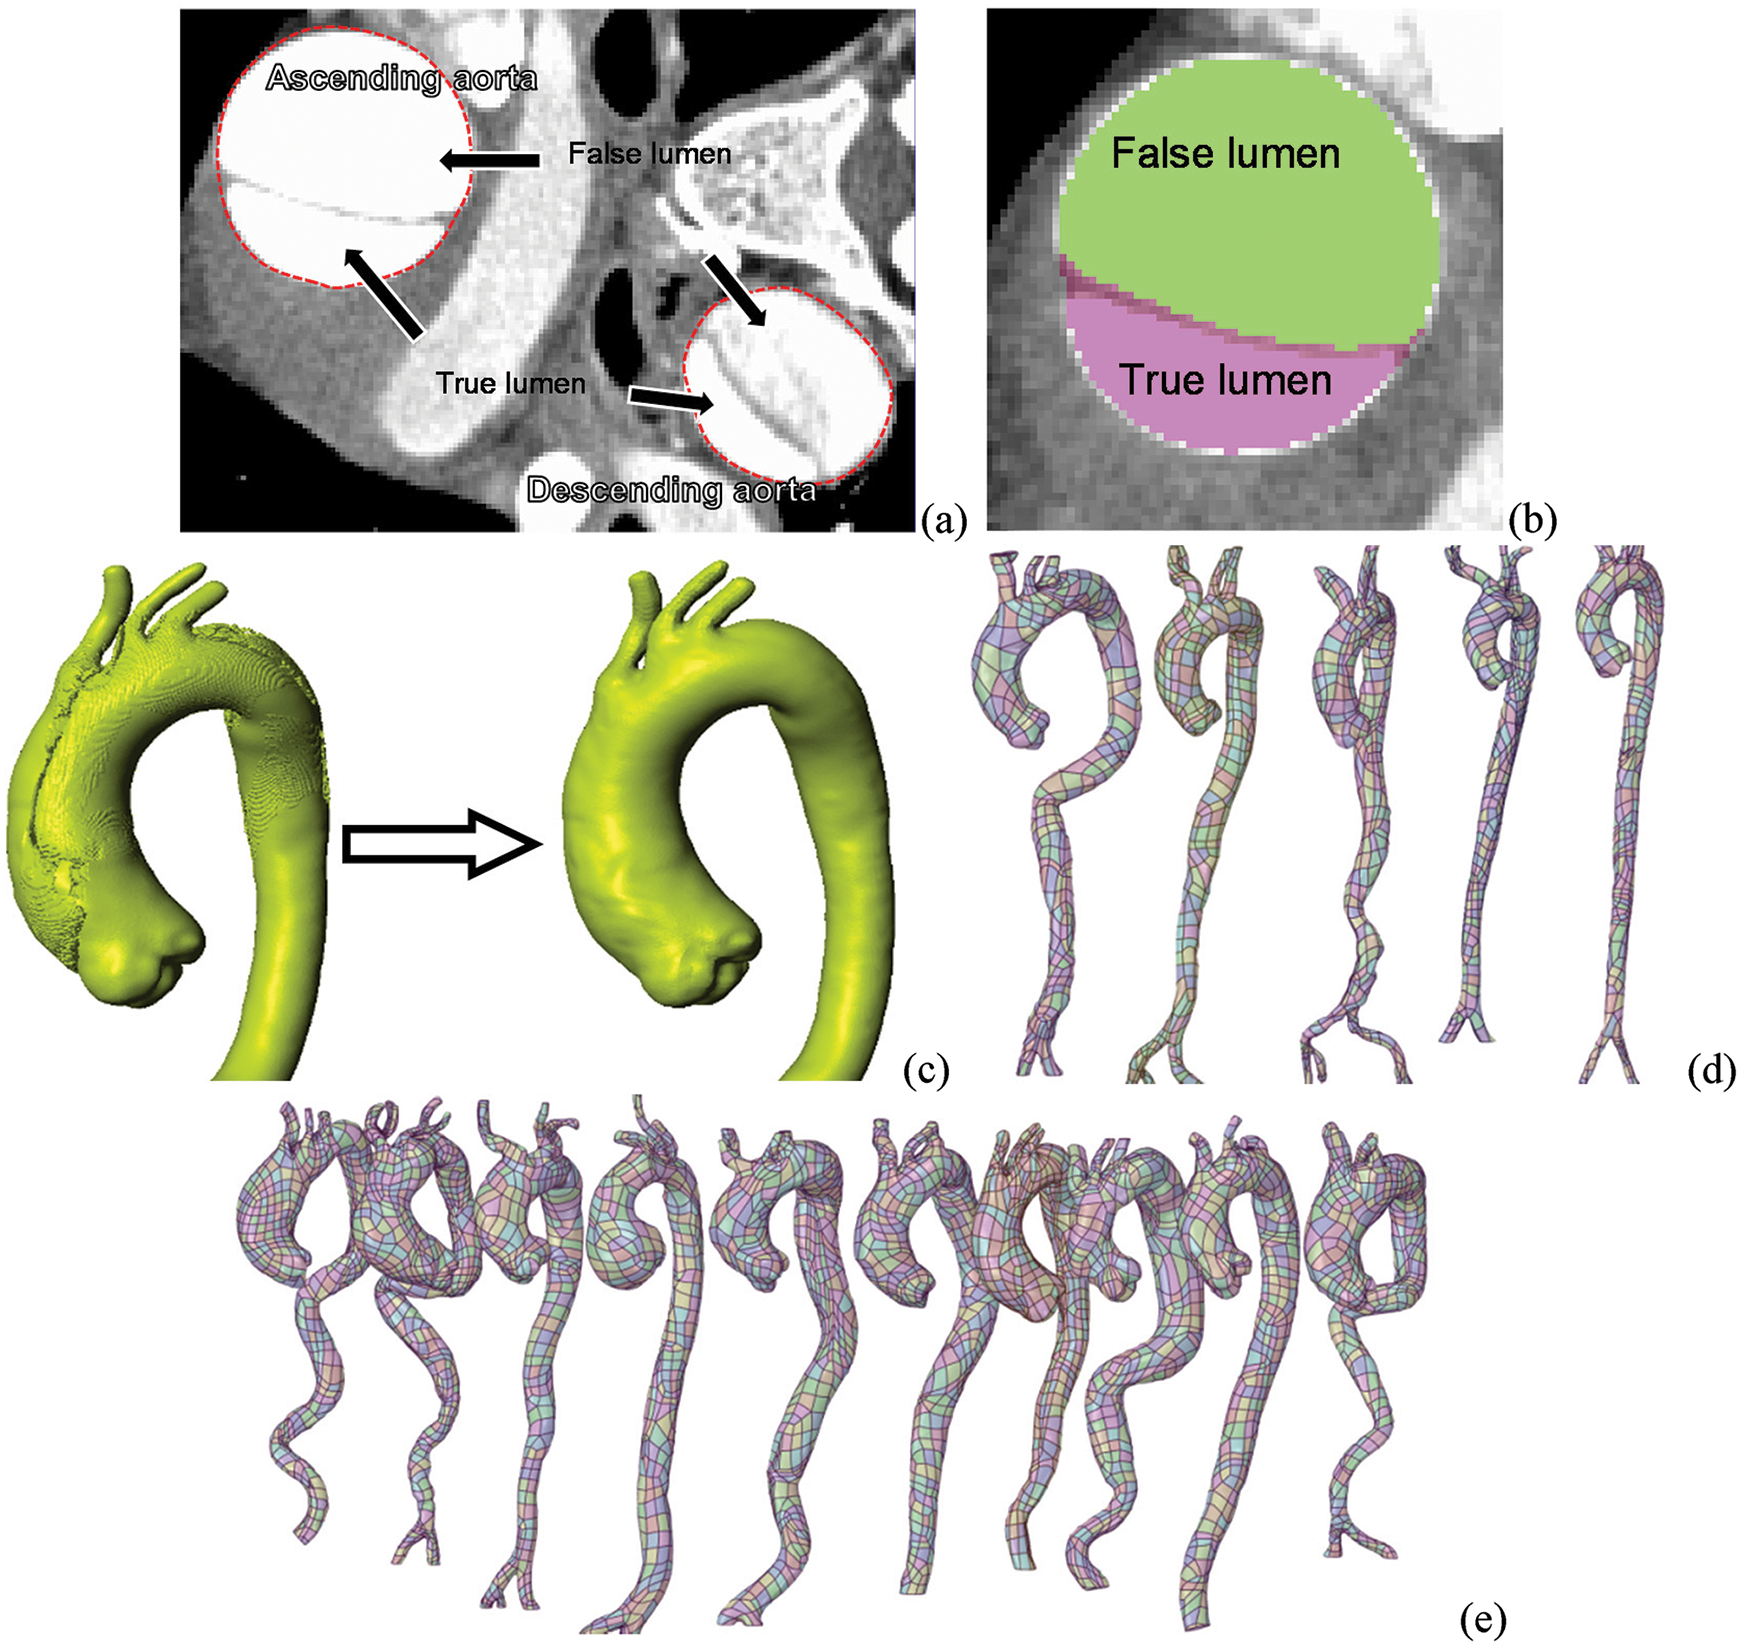
Figure 1: The progress of patient-specific geometric reconstruction. (a) Cross-sectional image with of the chest. (b) A vascular cross-section containing the true lumen, the false lumen, and the region between them. (c) AAo of type A AD patient and its estimated geometry before the dissection. (d–e) Reconstructed aortic models of control cases and AD cases, respectively
Because the onset of type A AD is often acute, it is challenging to collect CT data before the dissection occurs. Thus, an imaging-based estimation method based on the post-dissection CT data is needed to reconstruct an approximate pre-tear aortic geometry [25,26]. In this study, we assumed that the changes of aortic morphology after the tear occurring were limited. Thus, the CT data for diagnosis was used to reconstruct the pre-dissection aorta by ‘repairing’ the tear in the ScanIP, an image processing passage (Simpleware, Ltd., Exeter, UK).
To estimate the pre-dissection aortic model based on CT images, there are three main processing steps preformed in ScanIP. First, the areas of all the dissected regions containing the true and false lumen were identified (Fig. 1b). The Boolean sum of the true, false lumen and the gap area was then carried out, and the pre-tear aortic lumen was obtained. Finally, after a filtering operation was conducted to remove the image noise, the approximate 3D model of the pre-dissection aorta was reconstructed (Fig. 1c). The overall aortic geometries of the control cases and pre-AD cases are presented in Figs. 1d and 1e, respectively. The computational domain was considered to be from the aortic sinus to the distal of descending aorta (DAo). And all aortic branches were considered. They are brachiocephalic artery (BA), left common carotid artery (LCCA), and left subclavian artery (LSA), respectively, as shown in Fig. 2.
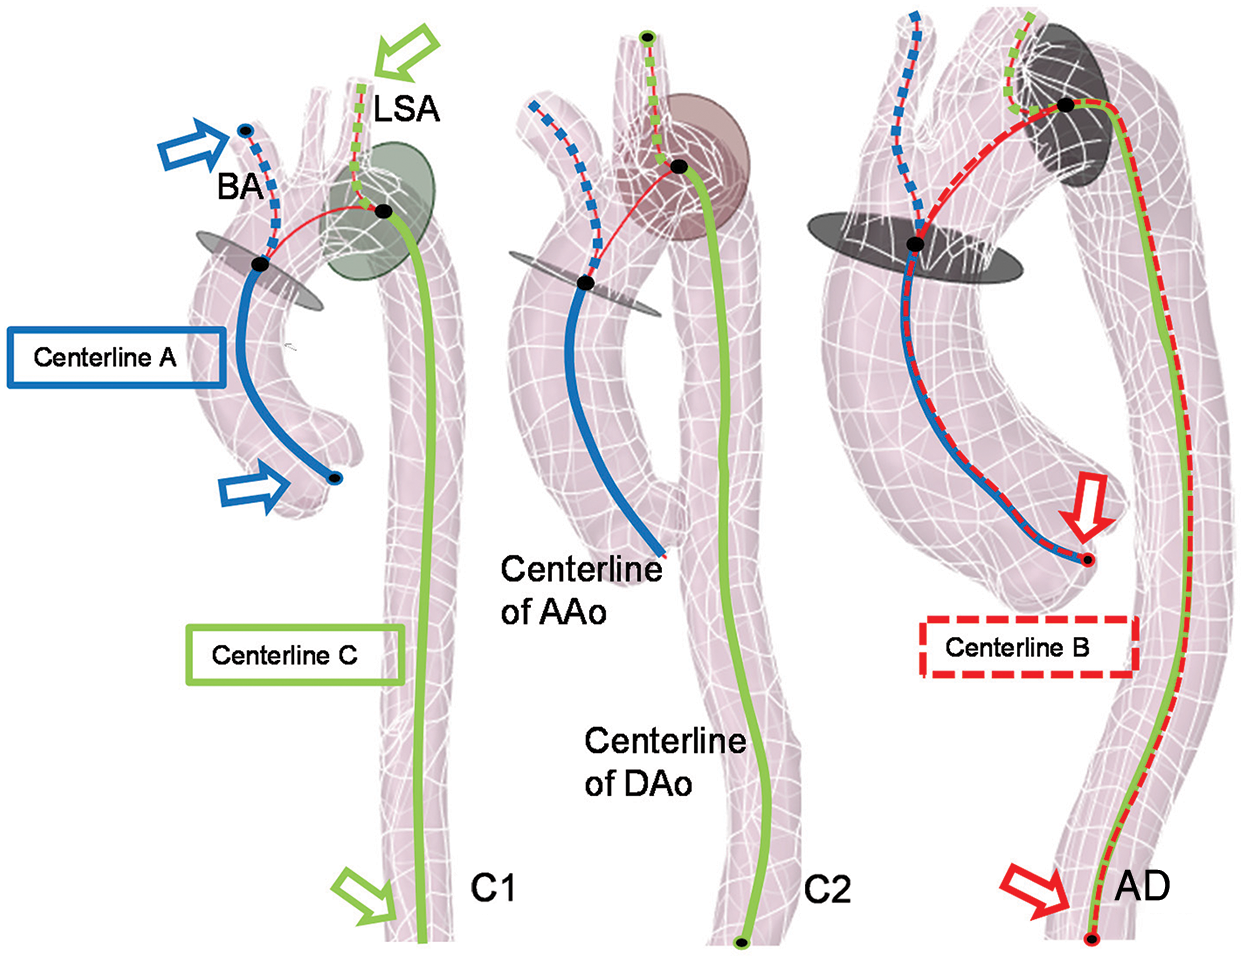
Figure 2: Centrelines of different vascular branches detected in the software of VMTK
The geometric structure characteristics statistics, including radius and length of segmental vessels of aorta (AAo, arotic arch, and DAo) and position of aortic sinus, was then obtained based on 3D reconstructed aortic models. All the aortic models (Figs. 1d and 1e) were saved as STL (Stereolithography) files and imported into the software of Vascular Modelling Toolkit (VMTK). The centrelines data of the aortic models was extracted, which are from the aortic sinus to the BA (Centreline A, as the blue solid and dashed line shown in Fig. 2), and to the end of the abdominal aorta (Centreline B, as the red dashed line shown in Fig. 2), and the centreline from the LSA to the end of the DAo (Centreline C, the green solid the dashed line in Fig. 2). The shared part between Centreline A and B was considered as the AAo segment. Meanwhile, the shared centreline in Centreline B and C presents the DAo segment. Fig. 2 presents the aortic models of a young control case (C1), an elderly control case (C2), and an AD case (case AD). The radius and the length of the AAo, the aortic arch, and the DAo were obtained by VMTK.
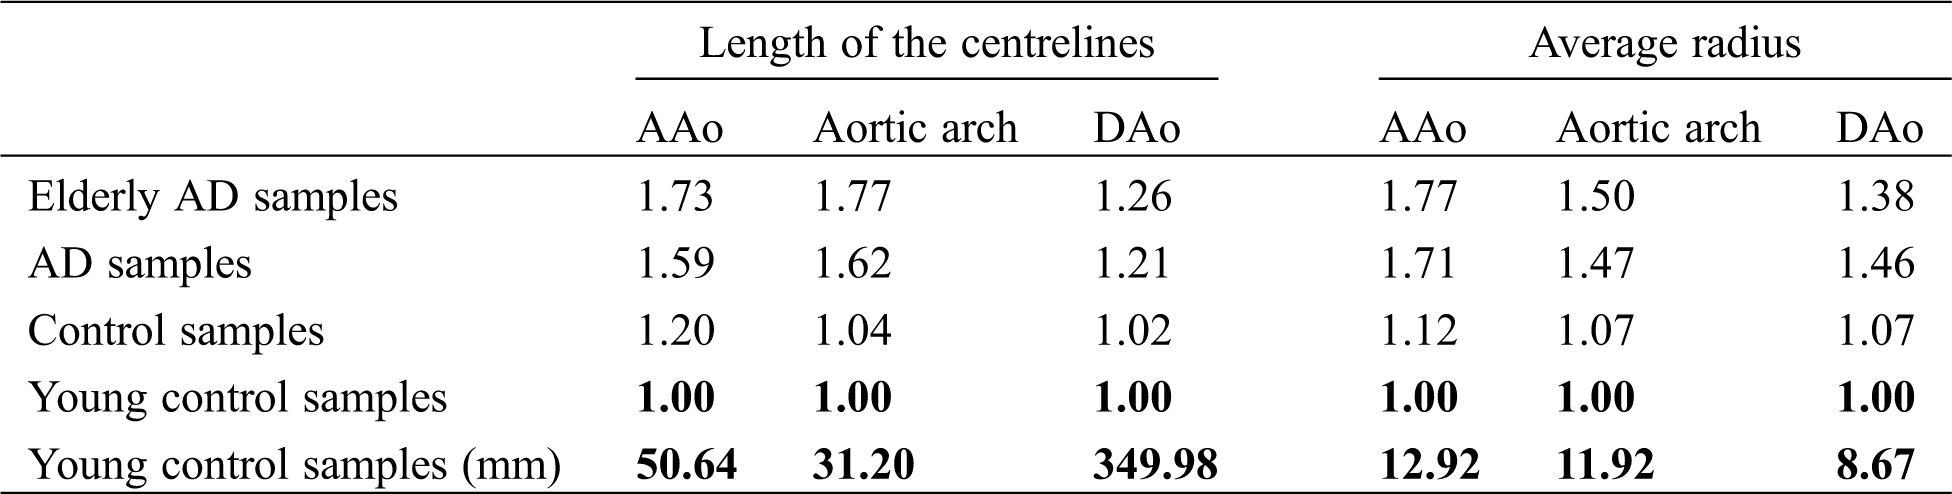
Tab. 1 shows the relative changes of length and average radius between AD and control groups in different segments of the aorta, which was normalized by the young control group’s value. The average length of the centerlines and radius in AAo, aortic arch, and DAo data from young control samples were adopted as the benchmark value, as shown in Tab. 1. The elderly pre-AD samples are the AD patients over 60 years old, and the young control samples are the healthy ones with age less than 60 years old. It can be seen that the length and average radius of AAo in the AD group is larger than of the control group, which is in agreement with the previous research [18]. Meanwhile, the length and average radius of AAo in the elderly AD group is significantly larger than that in the young control group. It meant that the topological structure correlates with age like it is reported in the work of Kim et al. [17]. According to the follow-up research of Barker et al. [25], when the AAo becomes longer with aging, the position of the aortic arch remains unchanged. Besides, it was found that the change in the length of the AAo and the arch is relatively large, and the diameter of the AAo also changes greatly. At the same time, CT data showed that the locations of a tear in most of the AD samples included in this study happened in the range of AAo.
Table 1: The relative length and average radius of the AAo, aortic arch, and DAo of each group
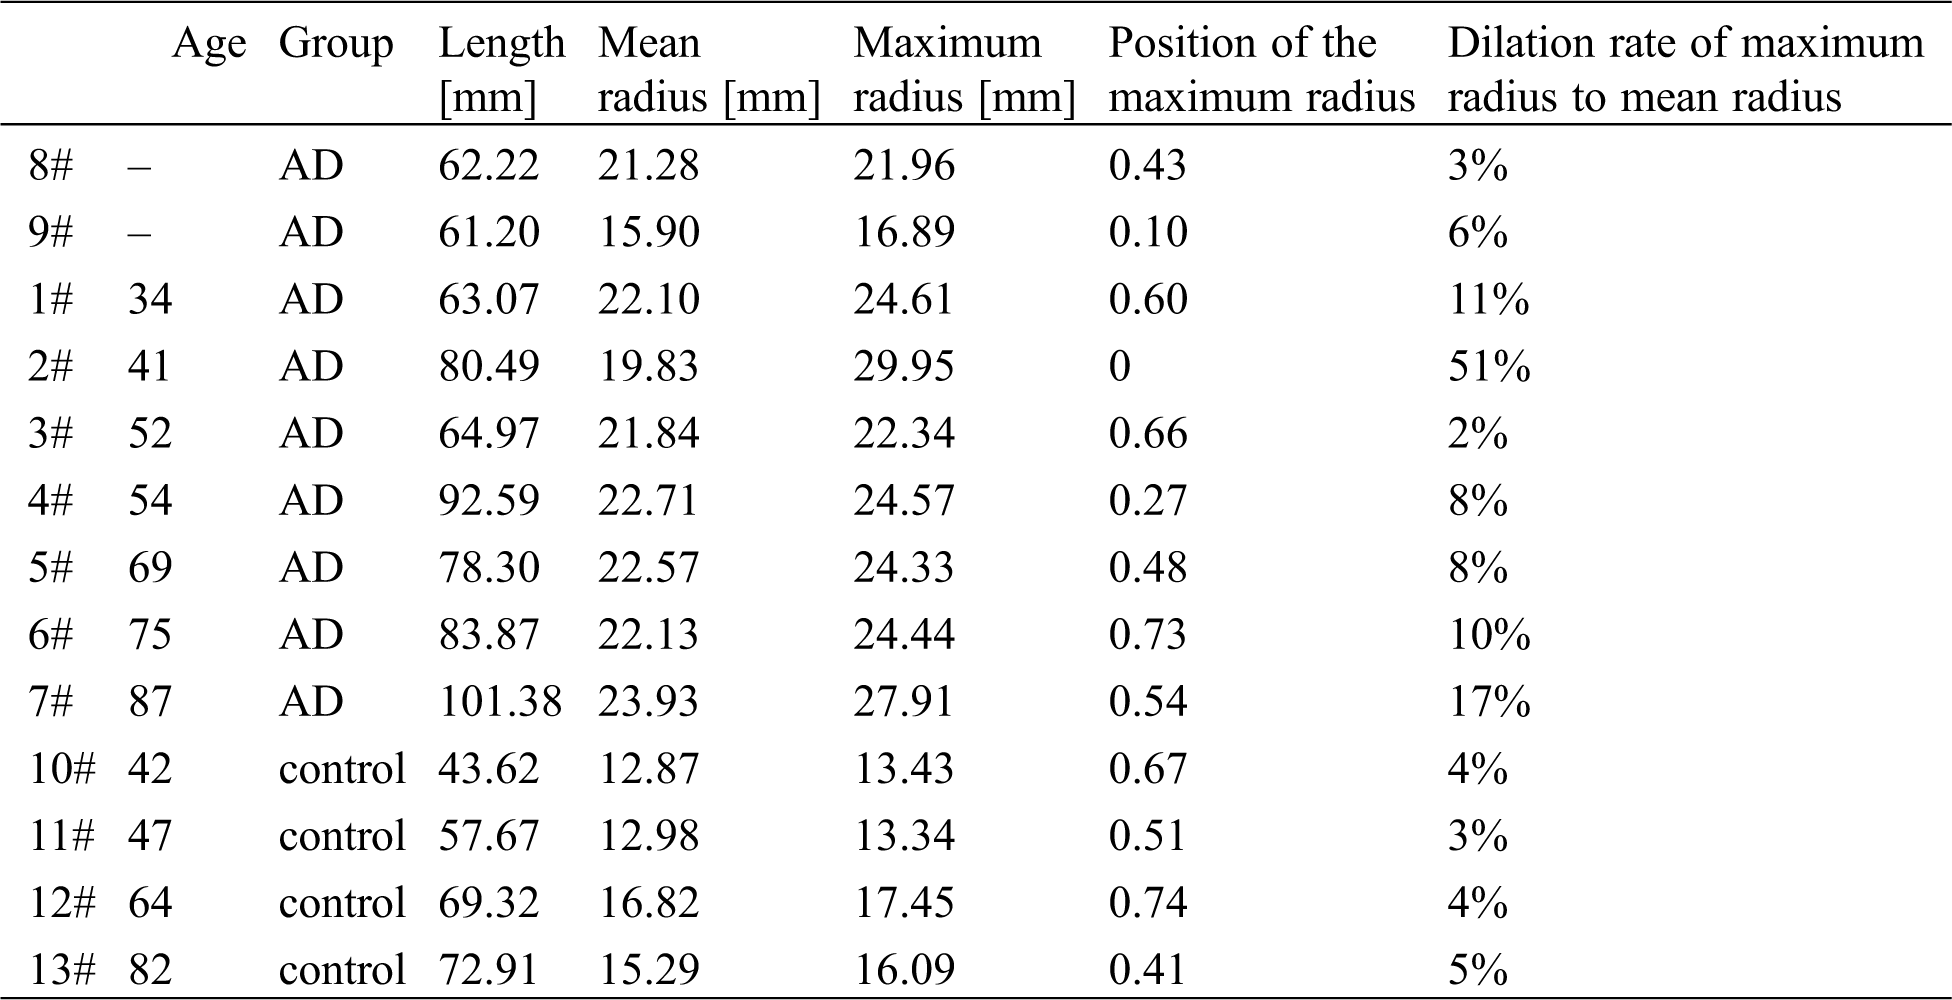
Tab. 2 shows the detailed data on the AAo segment. The dilation rate of AAo is about 10% on average and could be increased to 17% in an elderly AD sample. The maximum radius presents in the middle of the AAo (the average position on AAo is almost 0.54 from the beginning point to the end of the AAo centreline in Fig. 2).
Table 2: Detailed data of the AAo segment
For furtherly analyzing the direction alteration of AAo with the ages, position alterations of aortic sinus among different samples were extracted from the centerline data. As Fig. 3a illustrated, the direction of DAo (vector CD) was adopted as the reference direction, line BB’ is parallel to the vector CD. BA’ and AA’ are the parallel and vertical components of the direction of AAo (vector BA) related vector CD, respectively. From Figs. 3b and 3c, it can be seen that the ratio of BA’ and AA’ is obviously increased with the age. It means that the aortic sinus will present drooping along the direction of DAo, which is agreement with the previous studies [3,4]. Geiger et al. [27] also reported that the aortic sinus will correspondingly downward shift, but its orientation still consistent with the direction of the AAo. The directions of AAo and DAo were assumed in the same plane in this study.
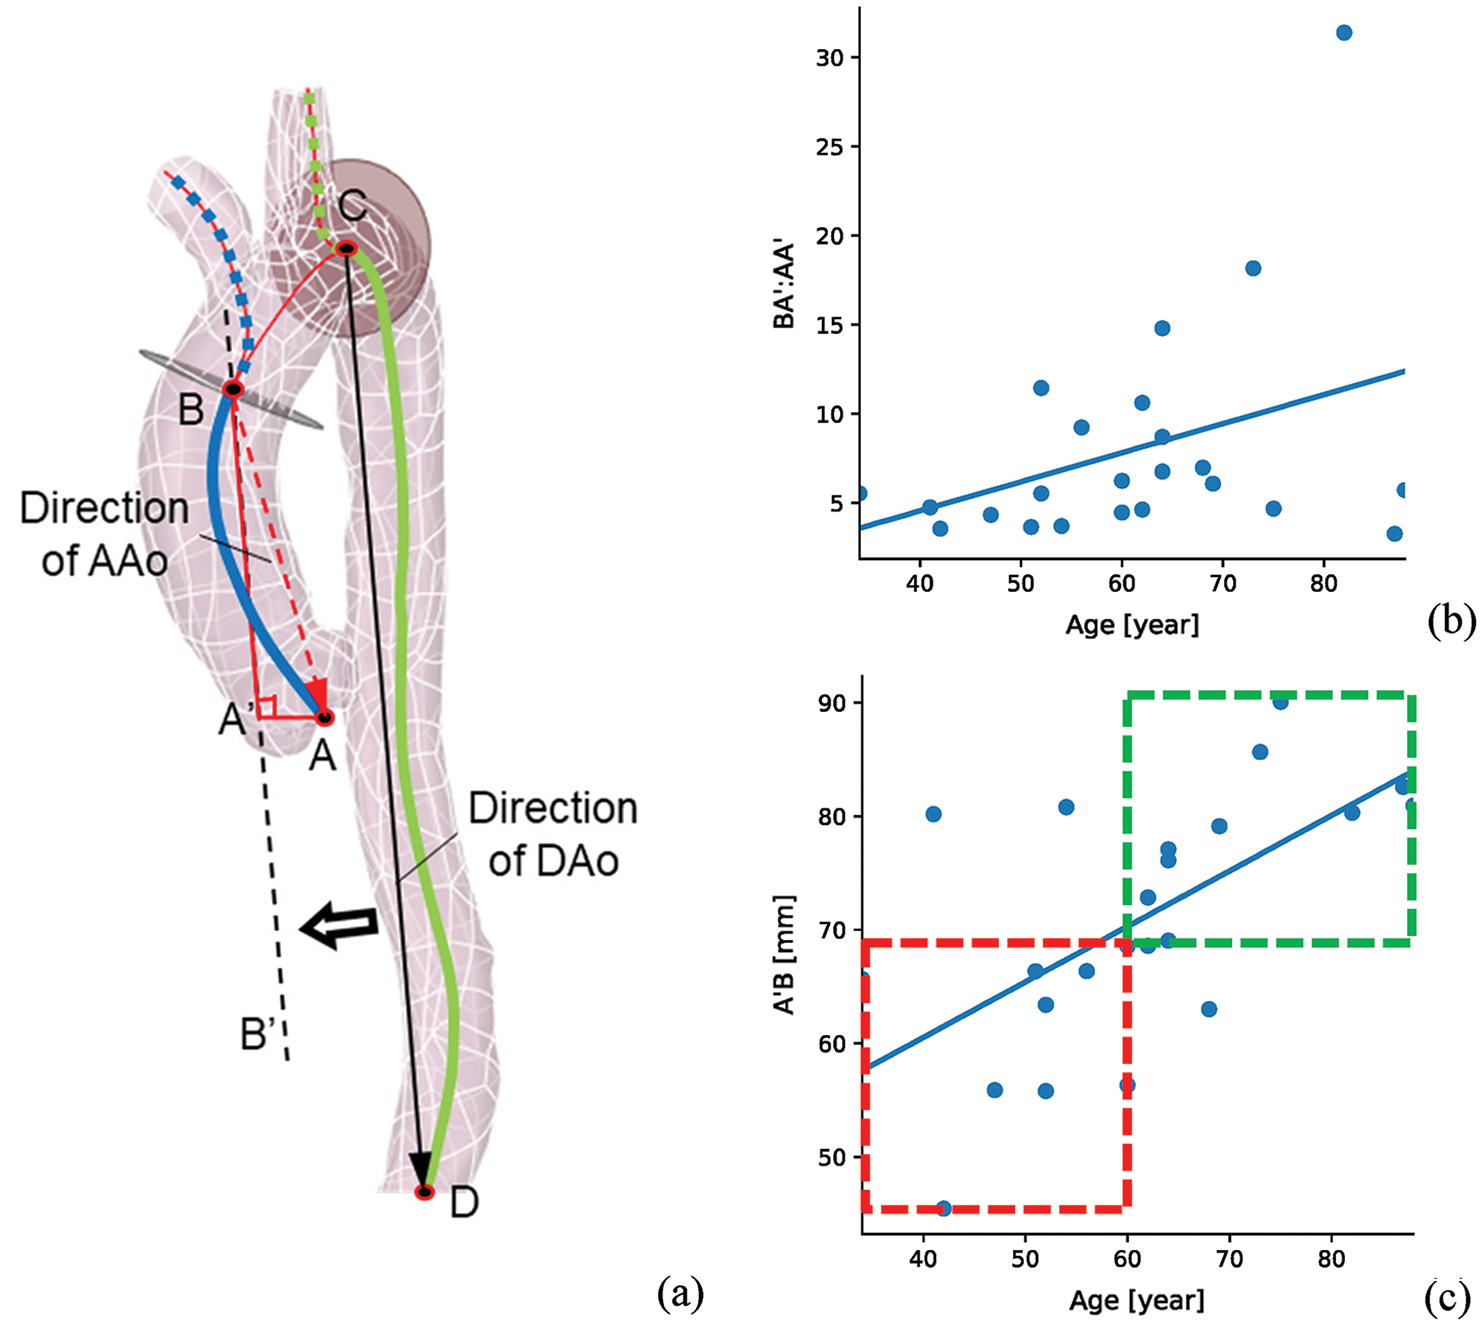
Figure 3: The AAo direction statistics of all the samples (a) the schematic diagram of the direction of AAo, (b) the ratio of BA’ and AA’ changes with age, (c) the BA’ changes with age. Vector CD and vector BA are the directions of DAo and AAo. BA’ and AA’ are the parallel and vertical components of BA with DAo direction
Hence, to highlight the influence of AAo structural variation on the hemodynamic characteristics of the aorta, our work focuses on the elongation and dilation of AAo, while the structural changes of the aortic arch and DAo were neglected. The centerline of AAo in a control sample was replaced with the one in an elderly control sample and a pre-AD sample and then the direction of AAo and DAo were kept in the same plane. For reconstructing the dilated structure of AAo, the dilation rate of 10% or 20% of maximum radius in AAo was applied. And the location of the maximum radius was set in the middle of AAo. It can reproduce the elongation, and dilation of AAo and prolapse of the aortic sinus.
An auxiliary computing domain was established to enhance the physiological flow pattern in AAo [28–30]. The auxiliary computational field at the aortic valve was created by “Blending” the shape of the aortic valve (peak systole) with a circular face of 30 mm in diameter at a distance of 200 mm (Fig. 4). A distance of 200 mm was prepared for the full development of the injecting flow. At the same time, to ensure the consistency of the inflow rate between different calculation samples, a circle of 30 mm in diameter was selected as the distal end of the “Blending” operation. The orientation of this truncated auxiliary computational domain was further adjusted according to the direction of the outer contour of the aortic sinus, as depicted in the upper subview of Fig. 4. Meanwhile, four auxiliary computational domains were established at the truncated sections of every outlet boundary, including three outlets on aortic bifurcations and one at the abdominal outlet, which has been depicted in Fig. 4 (body in blue).
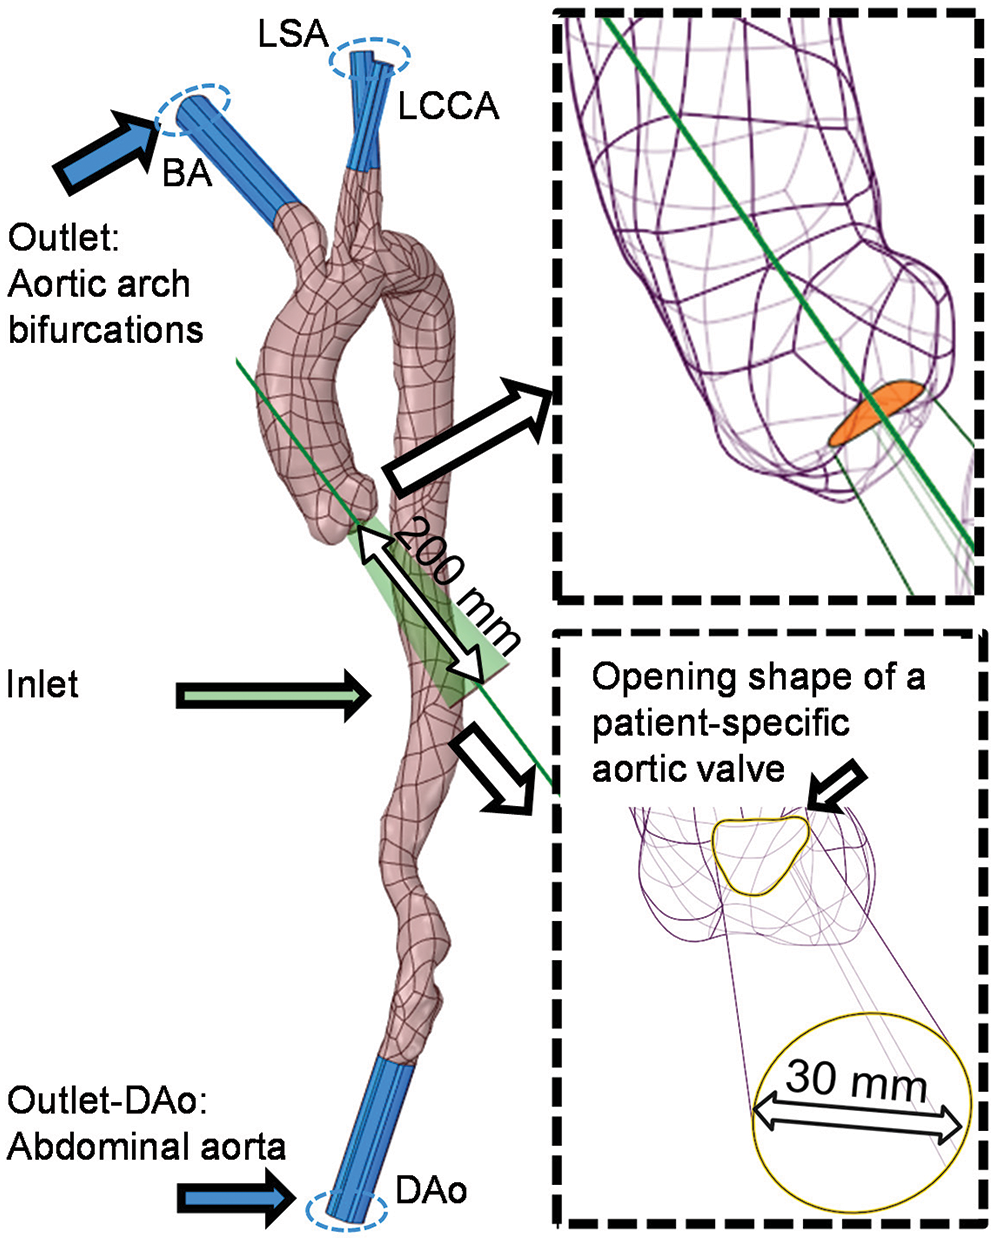
Figure 4: Design and establishment processes of the auxiliary entrance and outlets with the details illustrated by two partially enlarged views
The operations for elongating and dilating the AAo were divided into two steps. In the first step, the AAo of C1 was elongated by replacing its centreline with the ones of C2 and the AD case. In the second step, based on the elongated aortic model, the morphological operations were performed to enlarge the diameter of specific cross-section of AAo. It can reproduce the morphological changes of the AAo during aging or pre-AD according to these remodeling process.
The reconstruction processes for elongating the AAo of C1 are shown in Fig. 5. The process begins with obtaining the centreline of the AAo of each case (there are C2 and C1 in Fig. 5a). The beginning and ending points of the centreline were determined by VMTK and have been introduced in Fig. 2. This centreline was divided into segments by five evenly distributed green dots whose tangential directions were depicted by black arrows (Fig. 5b). The AAo was then truncated by sections which are vertical to the tangential direction at each point of the centreline. The body between the sections was furtherly removed, leaving the segmented faces only whose normal directions were consistent with black arrows (Fig. 5b). After the original AAo was removed, the centreline of C1 was replaced with that of C2 according to the connecting point of AAo and aortic arch and the tangential direction of it [19,27]. More importantly, an adjustment will be carried out by spinning the centerline around the connecting point to ensure the position of the new aortic sinus is in the same plane with the orientation of the DAo. Correspondingly, the replaced centreline was also evenly divided into five parts by red dots whose tangential direction was illustrated by blue arrows (Fig. 5c). The locations and directions of segmented faces and the body of the auxiliary entrance and aortic sinus were redistributed according to the replaced centreline’s tangential direction at the five points (the black arrow matches with the blue arrow, as depicted in EC2 of Fig. 5d). The “Blending” operation was finally applied to conduct the aortic model (Fig. 5d).
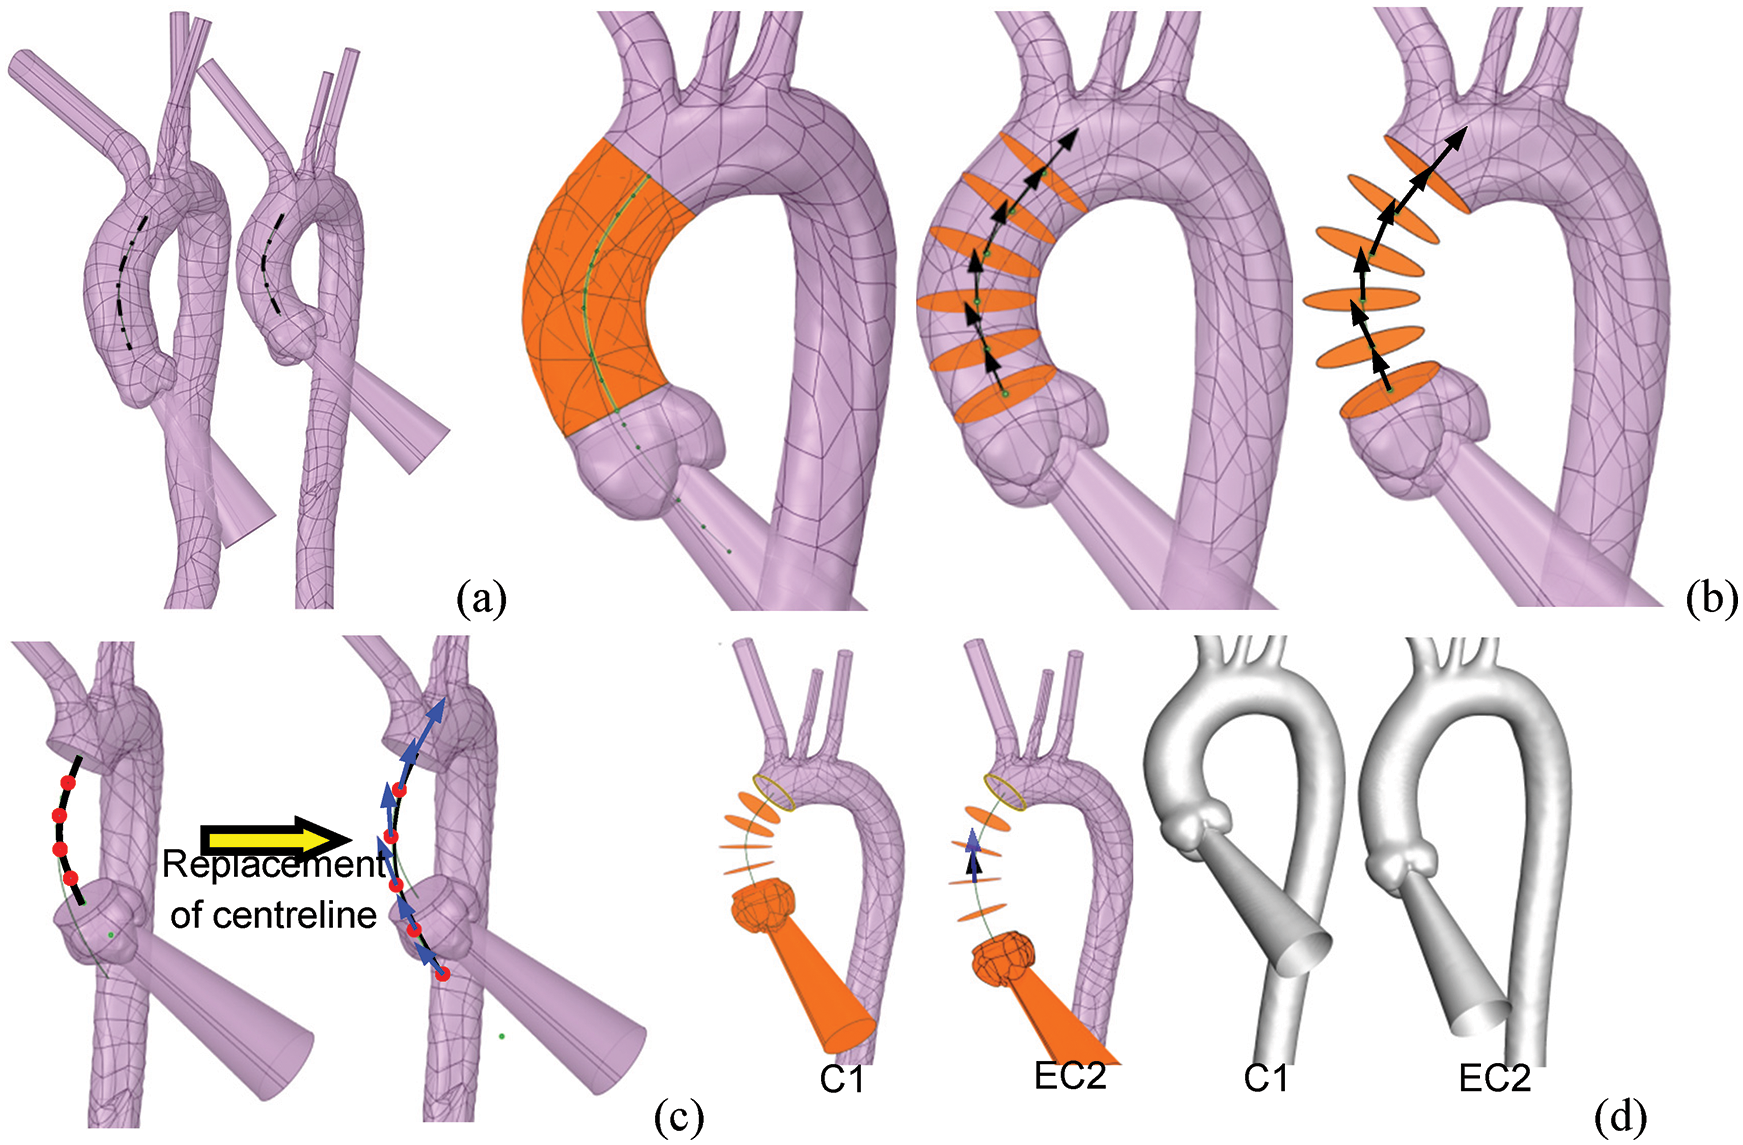
Figure 5: The process of reconstruction of the elongated aortic model. (a) The centrelines of the AAo of all subjects were extracted. (b) The AAo was cut according to the tangential direction (black arrows) of the five evenly distributed points. (c) The AD case’s centreline replaced the centreline of C1 according to the position and orientation of the distal end of the original centreline. (d) The entrance and the various segments were redistributed along the centreline’s tangential direction of the AD case. The normal vector of the cross-sections was depicted by the black arrows, while the blue arrows represented the tangential vector directions
In order to obtain the computational model with the dilation of AAo, the dilating operation will be carried out based on the elongated C1. As it is depicted in Fig. 6, the radius of the third and fourth segment faces was enlarged by 10% by means of multi-section “Blending”, the aortic model with an elongated and dilated AAo was conducted (Fig. 6).
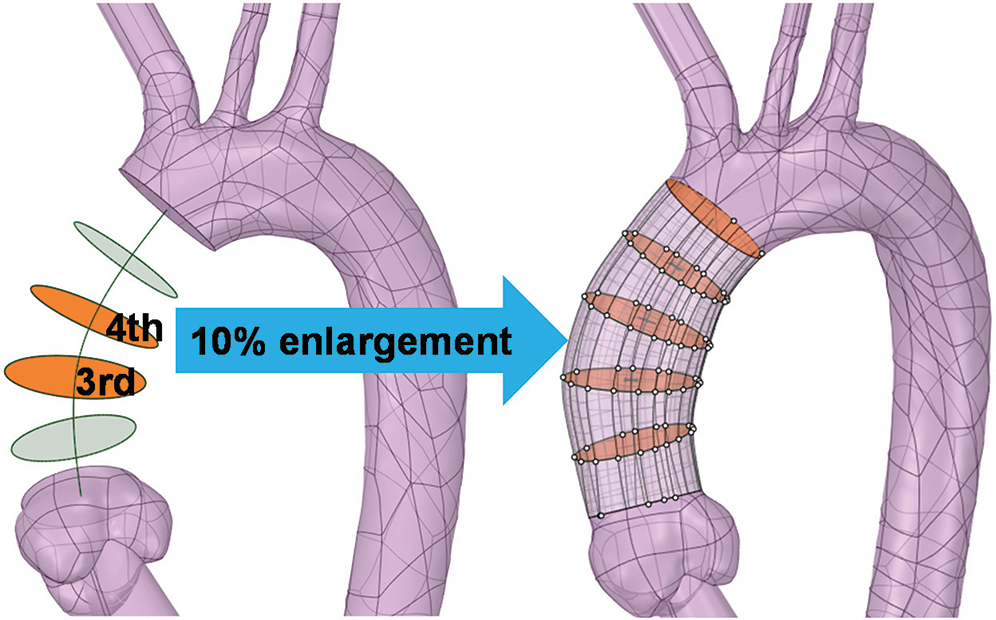
Figure 6: The diameter of the third and fourth sections is enlarged by 10% to create a dilated AAo by blending all redistributed sections
Five models with morphological alterations of the AAo were established (Fig. 7a). Models EC2 and EAD represent the aortic model have an elongated AAo, which were developed based on the centrelines of C2 and the AD case, respectively. Meanwhile, EC2_D10 and EAD_D10 reflect a 10% dilation in the middle of AAo, and EAD_D20 means the model with a 20% dilation (Fig. 7b).
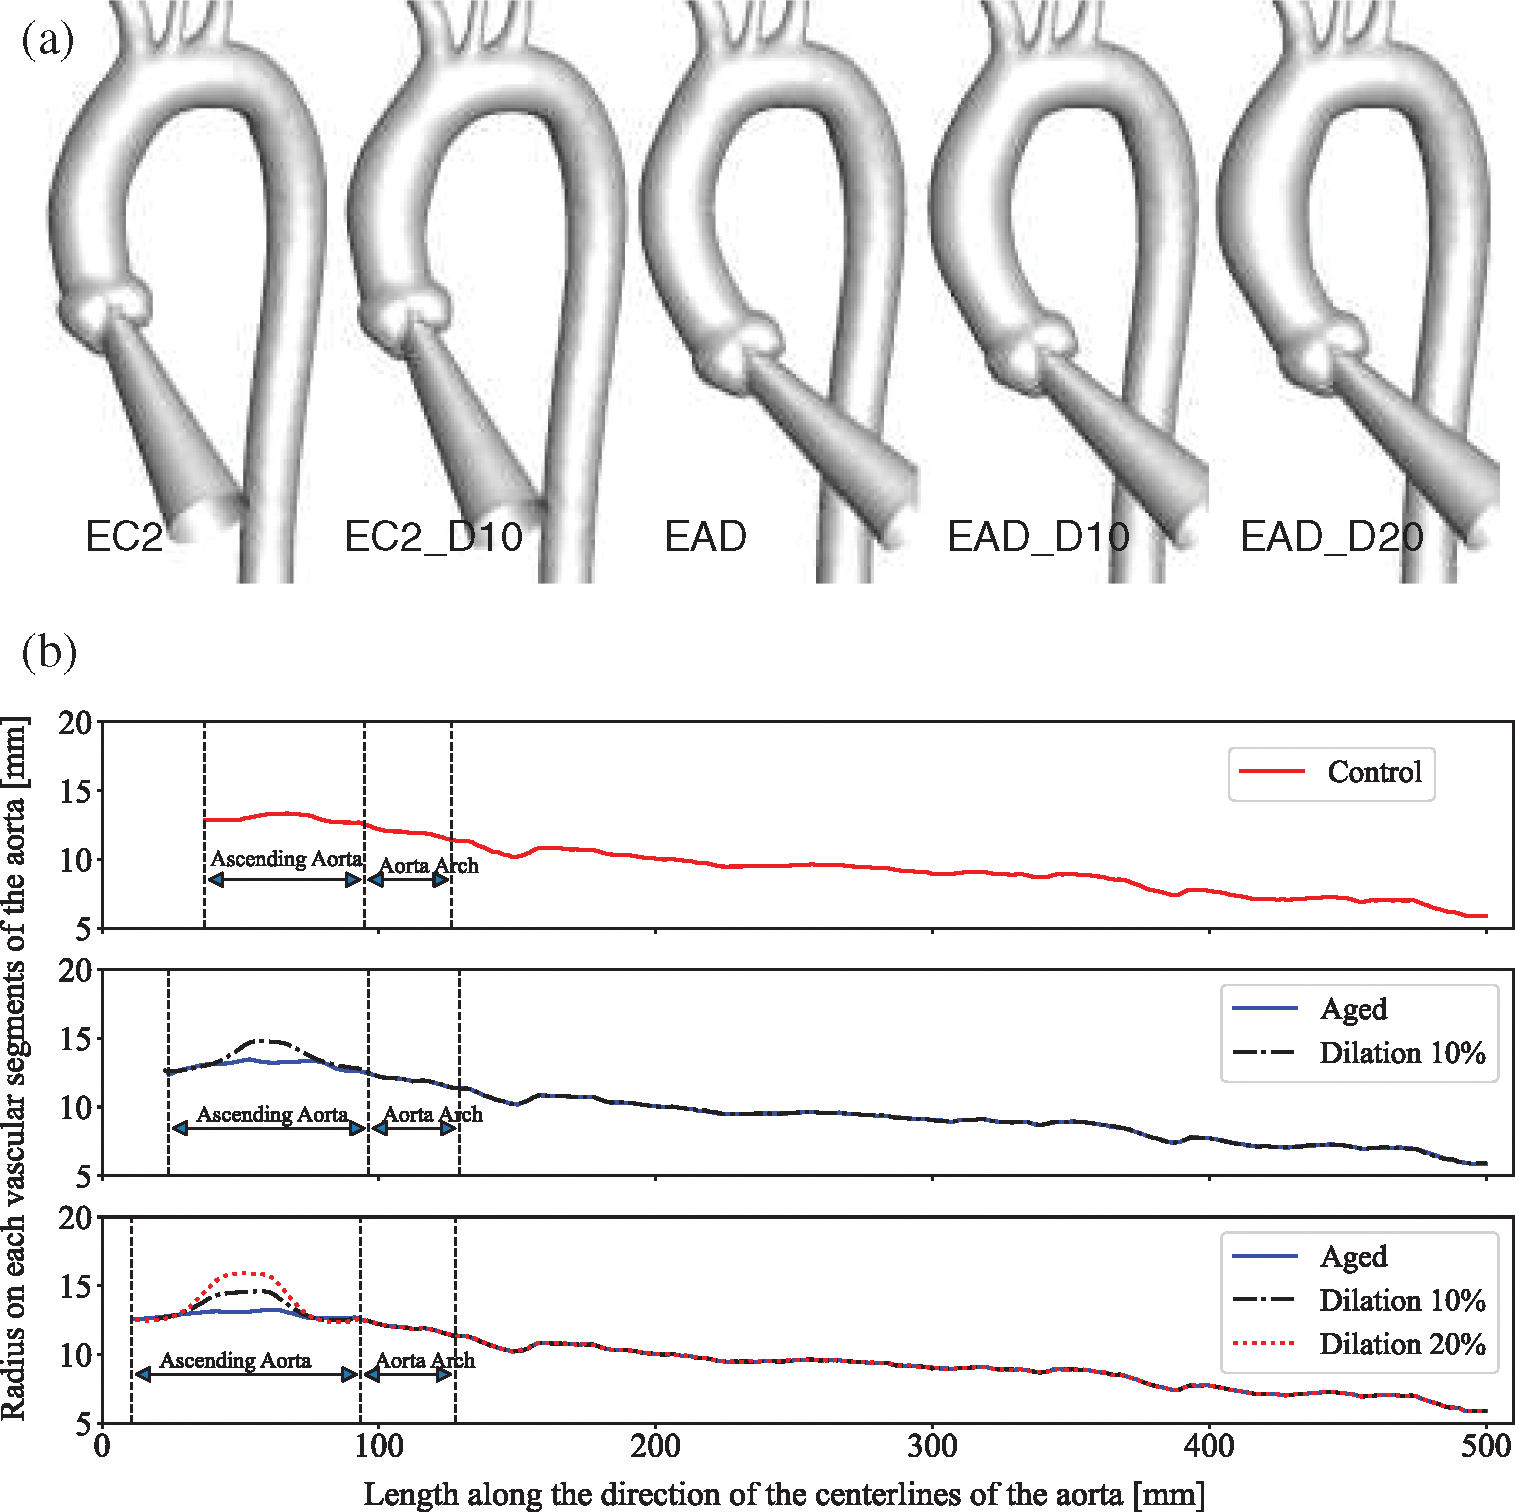
Figure 7: Newly generated aortic models with morphological changes of AAo. (a) Geometric models with different degrees of elongation and dilation of the ascending aorta. (b) The diameter changes along the centreline of each model, with the end of the descending aorta as the longitudinal alignment
2.3 Boundary Conditions and CFD Simulations
The Fluent Meshing ver. 17.2 was adopted for mesh generation. Multiple sizing scales of polyhedral mesh with ten prismatic layers near the wall were generated for the mesh sensitivity test. The adequate density of the boundary layers was firstly taken into consideration to meet the conditions of the turbulence model used in this study. Mesh independent computational experiments were performed on C1. A relatively coarse mesh and a fine mesh with 100% refinement, which containing 240,000 and more than 700,000 polyhedral cells, respectively, were included for the sensitivity test. The relative changes in facet maximum WSS were less than 6% with regard to the second-order truncation error in this numerical experiment. The relatively coarse scheme was adopted for its lower computing cost. However, due to the difference in body size, the sizing of all the aortic models was basically between 300,000 and 600,000 cells.
Based on the laws of motion (momentum equation) and conservation of mass, the condition of 3D fluid flow can be sufficiently calculated by the Navier-Stokes equations [31]. The blood is considered as Newtonian fluid and the flow simulations are conducted based on the following governing equations. For the three-dimensional incompressible Newtonian fluid Navier-Stokes and continuity equations are written as follows:
where
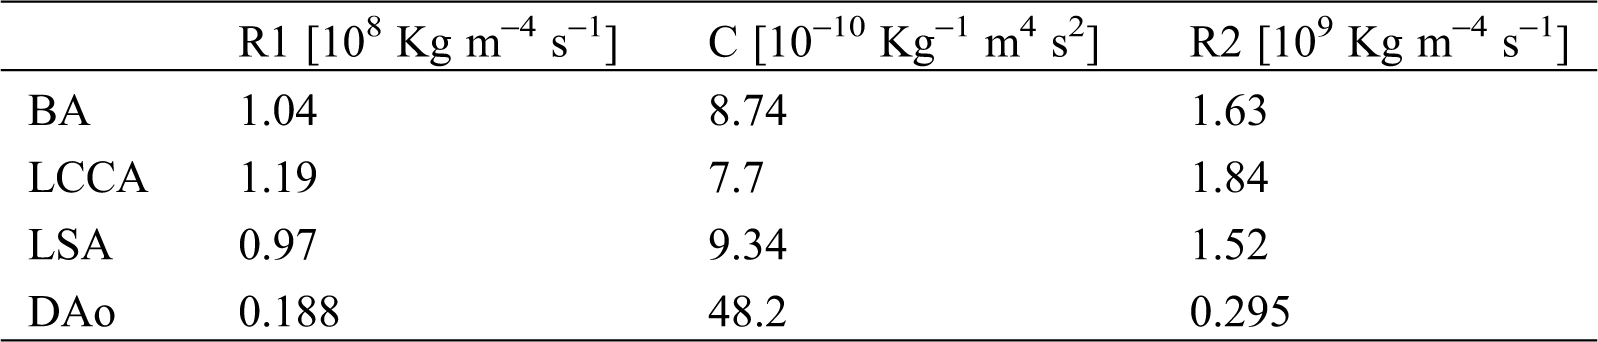
Uniform boundary conditions settings were adopted in all models to achieve consistency across all samples. A flow waveform reported by Morbiducci et al. was specified at the auxiliary entrance [38]. The cardiac cycle was 1.0 s, with a peak systole mass flow rate of 510 g/s (Fig. 8a). Investigation of haemodynamic alterations is conducted on four key time points, namely mid-acceleration (t1 = 80 ms), peak systole (t2 = 130 ms), post-peak systole (t3 = 180 ms) and mid-deceleration (t4 = 260 ms), which were marked under their time sequences (Fig. 8a). A Windkessel model was implemented to account for the influence of compliance from the computational domain outlets to the distal vasculature. The three-element Windkessel model (3-EWM) contains a resistance R1, a compliance C, and a resistance R2, representing the natural resistance from the outlets of the computing domain to the distal vasculature, the capacitance, and the distal resistance, respectively. R1 and C are parallel-connected and then connected in series with R2 (Fig. 8b). During a computational time step, the 3D domain reserves the inflow data from the inlet wave (Fig. 8c), and the Fluent solver provides the flow data and pressure data of the 3D domain to the 3-EWM. The corresponding pressure for the next iteration that considers effective vascular compliance is sent back by the user-defined functions in Fluent. Many studies have provided details on obtaining patient-specific parameters such as the terminal resistance Rt (Fig. 8b) or R1 using clinical data [39–42]. In this research, well-adjusted parameters of the 3-EWM presented by Kim et al. (Tab. 3) were adopted [43].
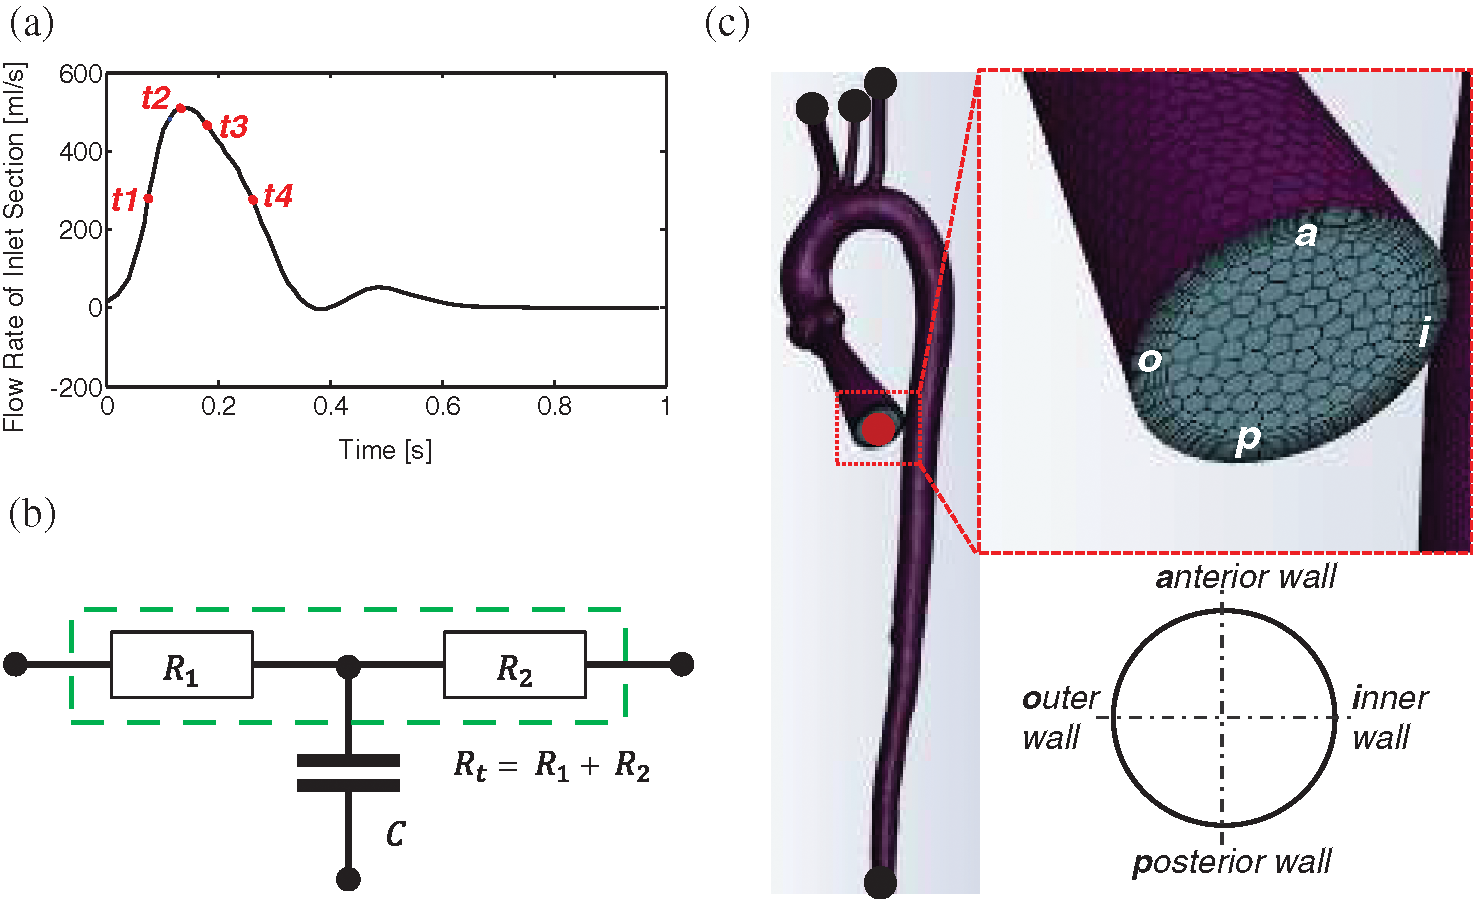
Figure 8: Settings of flow boundary conditions. (a) The waveform of the inlet boundary and four essential time instants. (b) Schematic diagram of the 3-EWM. (c) The layout of polyhedral mesh and an example using the entrance section to indicate the view for the flow pattern presentation
Table 3: Values of the 3-EWM that adopted from Kim et al. [43]
2.4 Data Extraction and Analysis
The shear stress at each calculating point on the vascular wall is quantified in a cardiac cycle by the time-averaged wall shear stress (TAWSS), expressed as:
where
And the OSI is introduced to measure the degree of change of the
In the simulation, seven cardiac cycles were needed until the simulation reached convergence. The convergence was judged when the residuals of the mass and momentum conservation equations both went below 10−3. One additional cardiac cycle was calculated for data extraction. A second-order implicit time-stepping scheme was adopted with the fixed time-discrete scheme. In order to pass the time-step independent test, each cycle is divided into a fixed time step of 0.005 s. For every two-time step, the WSS in Cartesian coordinates was extracted for the calculation of TAWSS and OSI maps. A computational cycle contains 200-time steps and will generate 100 sets of output data.
In this section, flow patterns in all patient-specific models (C1, C2, and AD), in subjects with elongated AAo (EC2 and EAD), and with dilated and elongated AAo (EC2_D10, EAD_D10, and EAD_D20) are compared in detail.
3.1 Validation of Numerical Simulation Results
In order to analyze the benchmark method in our research, the 4D-MRI (4D phase contrast Magnetic Resonance Imaging) result in healthy and AD case were compared with our numerical results of heathy case (C1) and AAo elongated and dilated model (EAD_D20). An auxiliary entrance and 3-EWM were adopted in the current numerical simulation. For better description of flow pattens in AAo, vortex flow was defined as revolving particles around an axis in orthogonal to the vessel centreline and helical flow was considered a rotational motion around the longitudinal axis of the vessel centreline [44].
Fig. 9 indicates that the streamline and velocity distribution in C1 and EAD_D20. It can be seen that the velocity gradually decreases along the outer wall of the AAo and a helical flow was driven inside of AAo with consideration the auxiliary calculation domain in model C1. In the AAo elongated and dilated model, the position of inflow impingement shifts down and a large recirculating vortex was formed. The flow pattern in AAo of this research is highly similar to the 4D-MRI measurement result [45]. Comparison of previous study without the auxiliary calculation domain [46], the flow field in AAo is different from the physiological environment in terms of flow state and impact region. With consideration of the aortic sinus and auxiliary calculation domain, it can better solve the problem of the physiological authenticity of the AAo in the flow simulation. Although valves were still not considered in the current study, the auxiliary entrance and 3-EWM can significantly improve the physiology of the flow in AAo and make the simulation study in AAo much more credibility comparing with the results in previous researches [28–30,46].
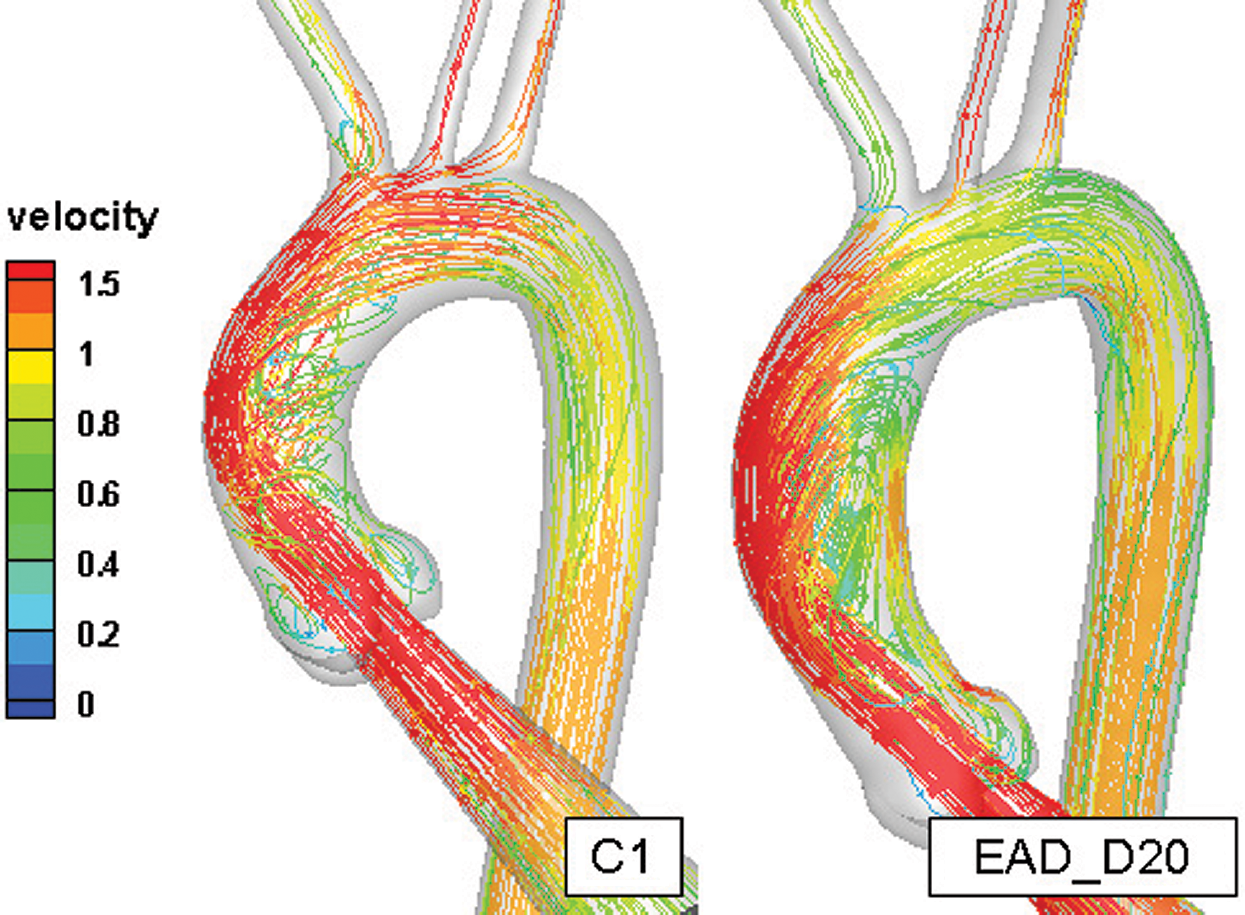
Figure 9: The comparison of the flow field in the healthy aortic model and AAo elongated and dilated model
As it is depicted in Figs. 10a and 10b, the phase difference of inflow and pressure can be observed. About 30% of the flow leaves through the branches of the aortic arch which is similar to the distribution of aortic blood flow under the physiological conditions. In addition, the physiological characteristics such as the phase difference and the reflux can also be reproduced. Meanwhile, the amplitude of pressure at all boundaries was larger than that of the physiological range. It may be related to the rigid wall assumption.
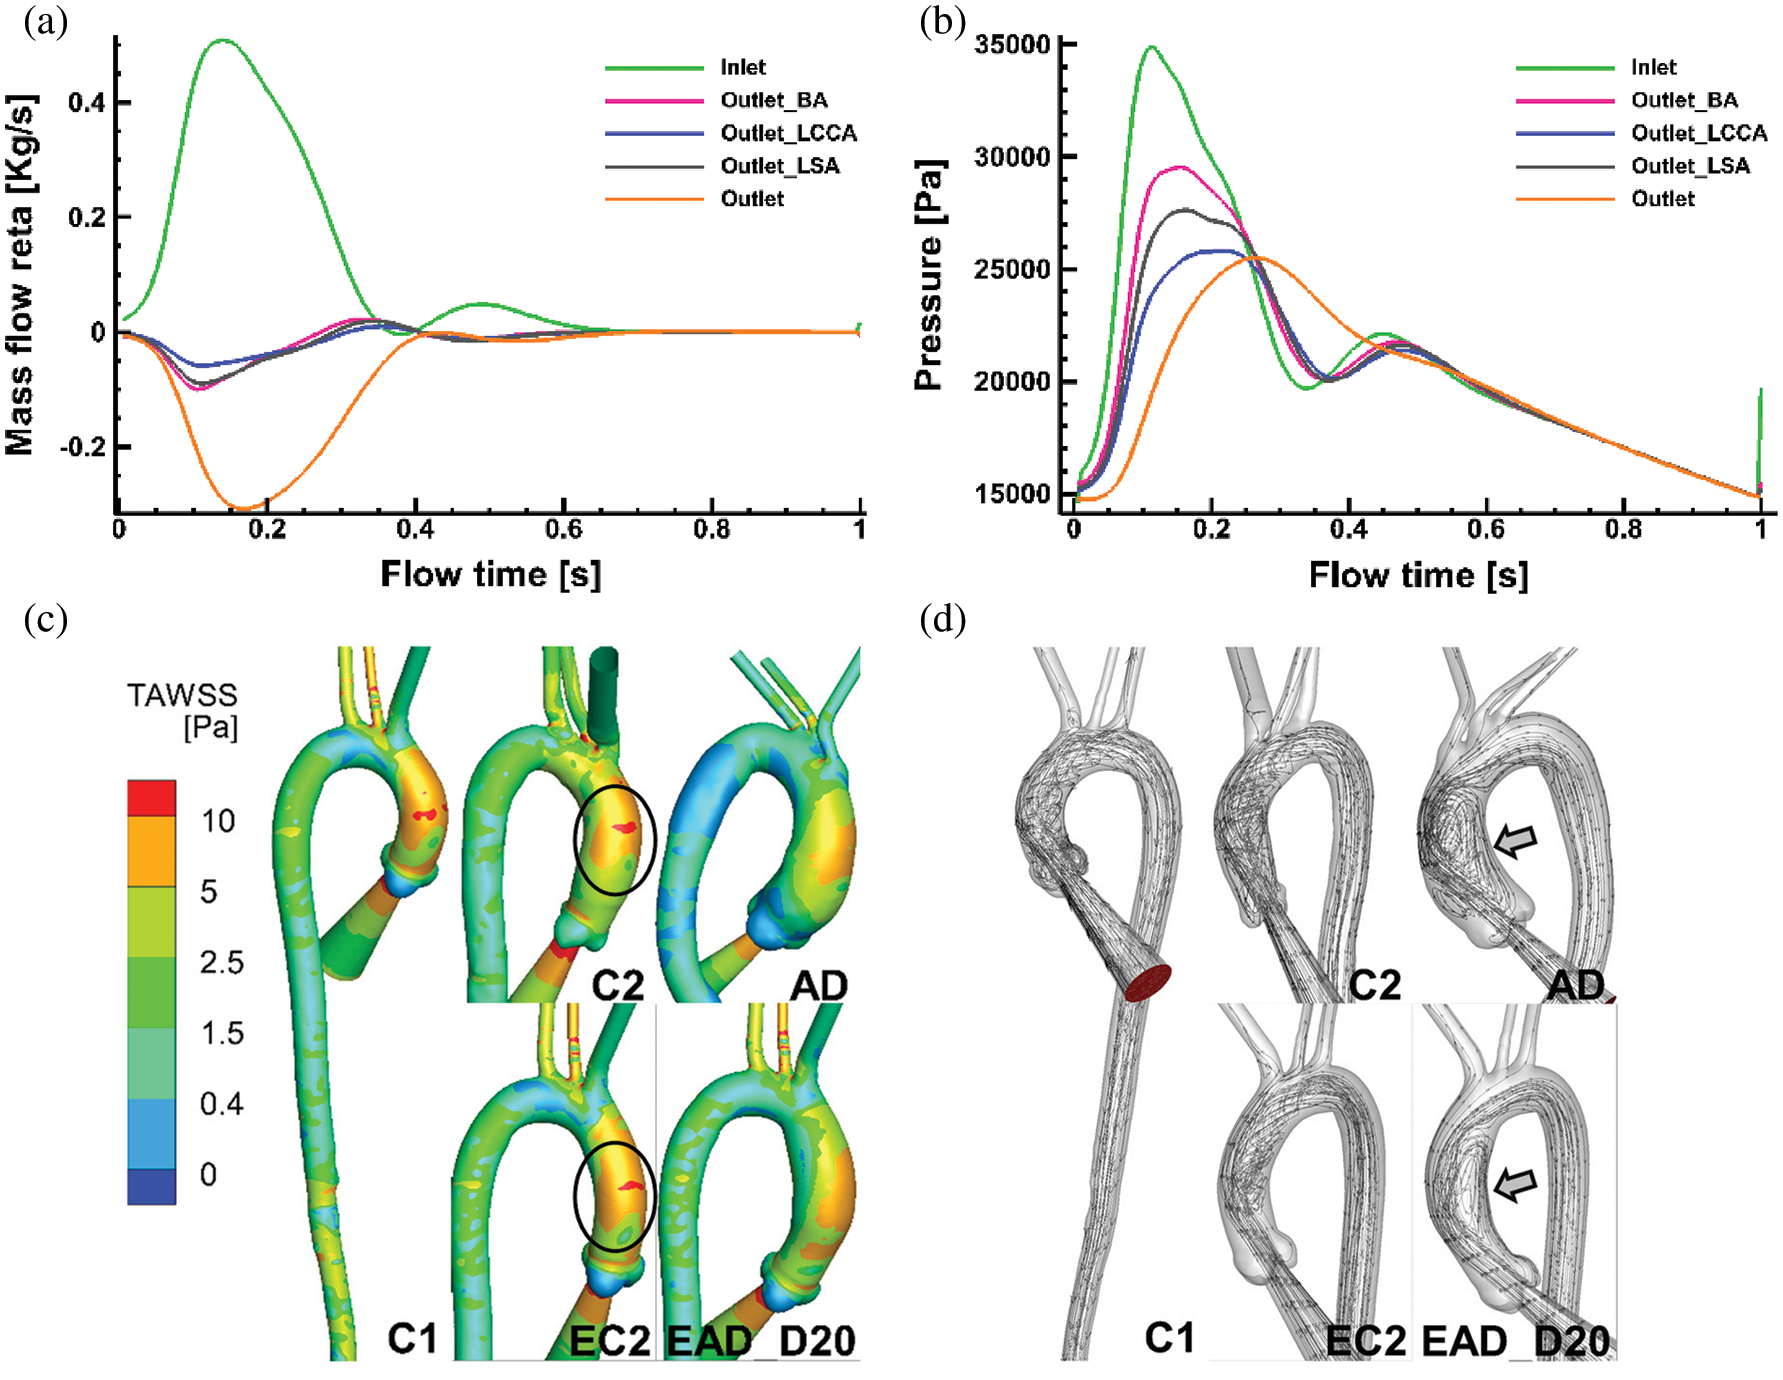
Figure 10: Numerical results on all the flowing boundaries of C1 and the flow pattern of C1, C2, and AD. (a) The mass flow rate of all the flow boundaries of case C1. (b) The pressure at all flow boundaries in case C1. (c–d) TAWSS and flow pattern comparisons of specific aortic model of C1, C2, AD and the reconstructed aortic model of EC2, and EAD_D20
Figs. 10c and 10d show TAWSS and flow pattern comparisons between the patient-specific models (C1, C2, and AD) and the artificial reconstructed models (EC2 and EAD_D20). As it is depicted in Fig. 10c, TAWSS distribution in AAo of C2 is highly similar with that in related artificial model EC2. At the same time, streamlines data of the AAo in AD and the EAD_D20 present a similar flow pattern (Fig. 10d). It means that the artificial reconstructed models can reproduce the physiological flow characteristics of patient-specific models.
3.2 Flow Characteristics in Subjects with Elongated AAo
This chapter will present the effect of AAo elongation on its haemodynamics. To better highlight the distribution of WSS, the range of WSS magnitude has been rescaled into 0 Pa to 30 Pa. WSS and the streamline in C1, EC2, and EAD at flowing instants of t1 to t4 are depicted in Figs. 11a, 11b, respectively.
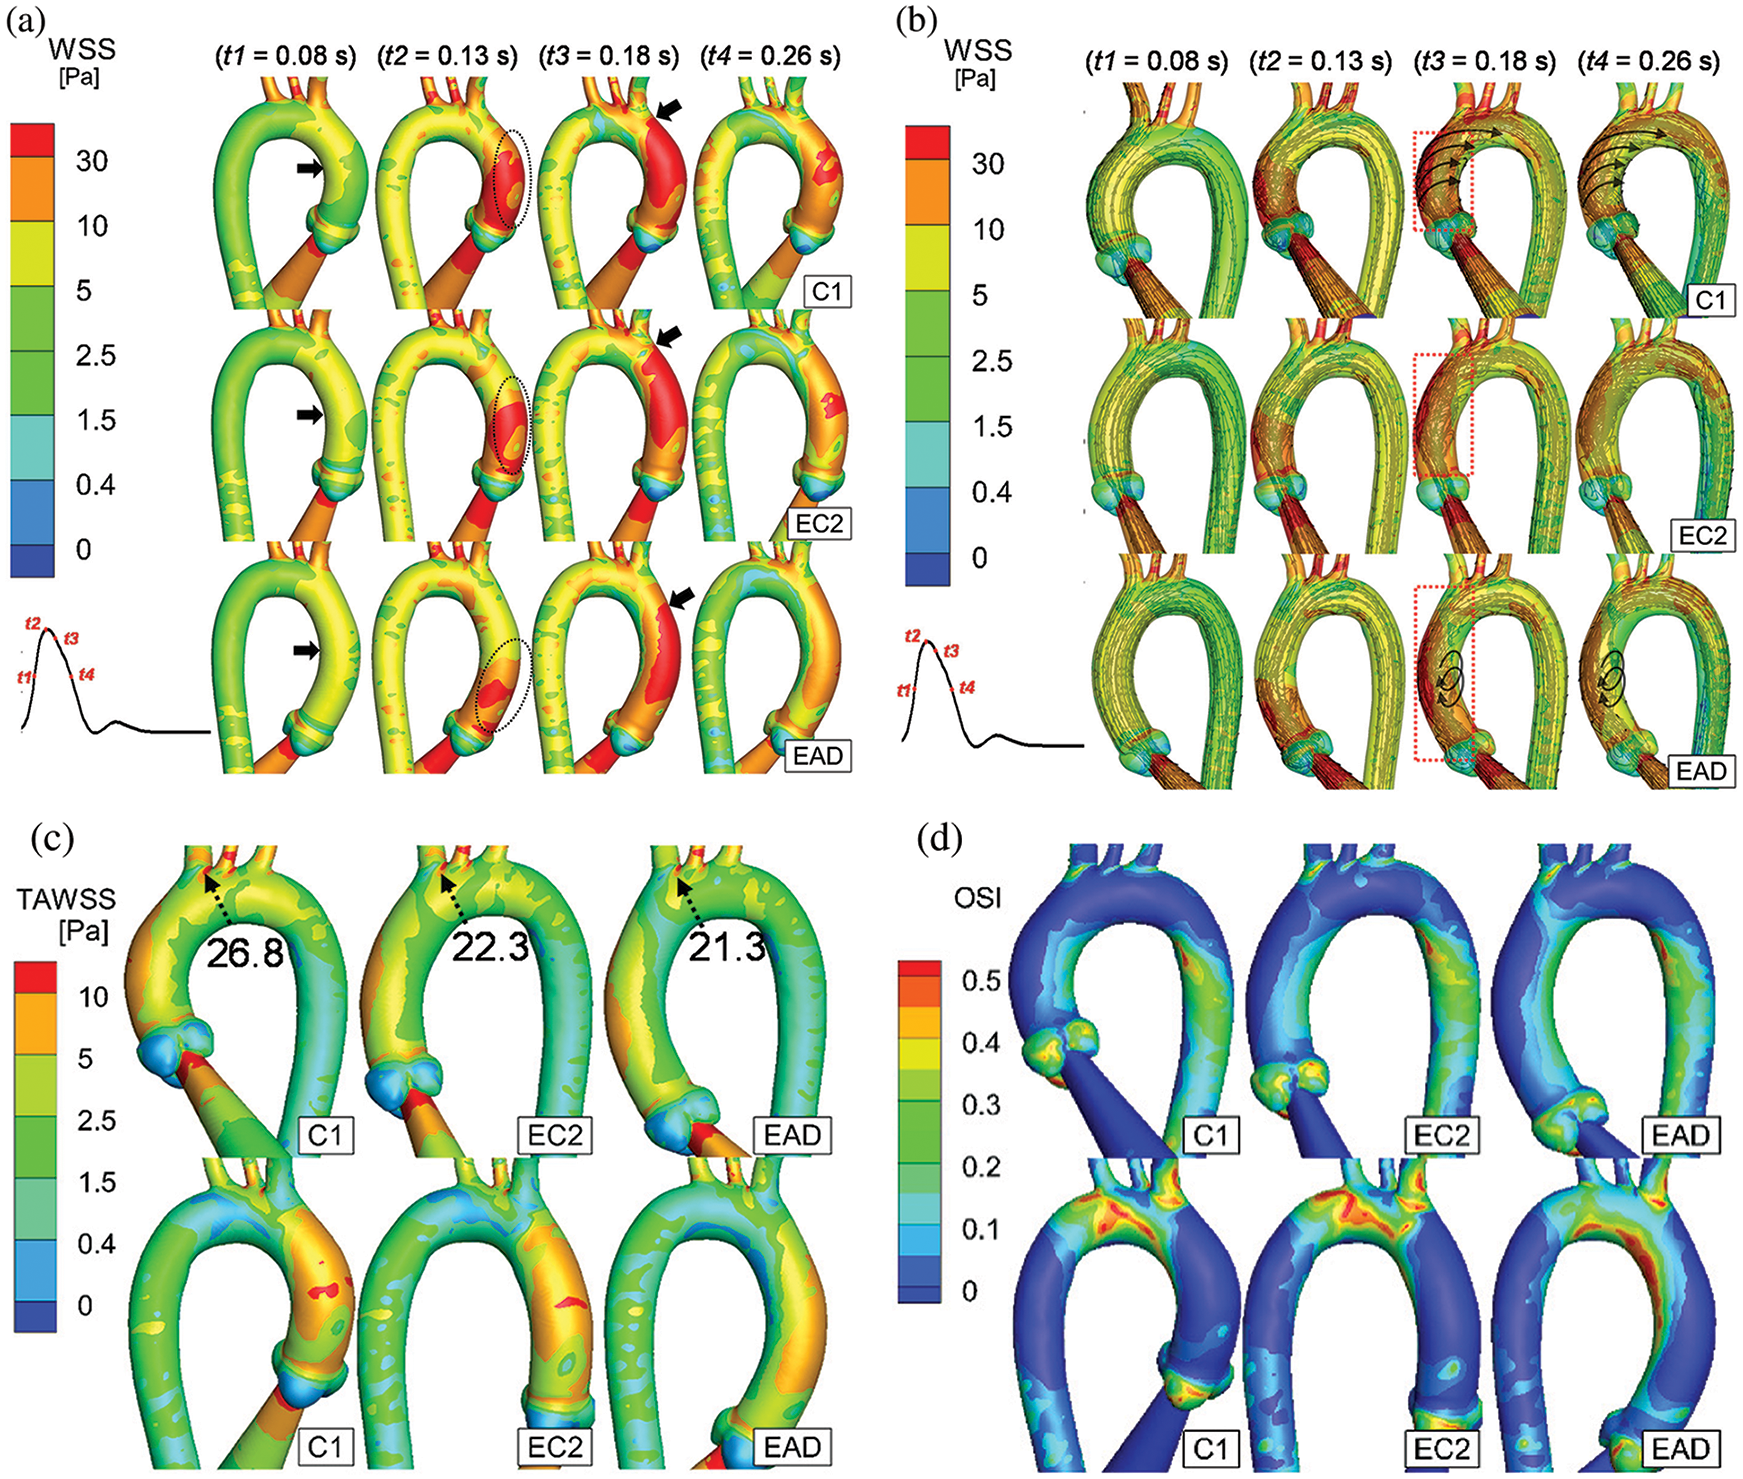
Figure 11: Numerical results of C1, EC2, and EAD. (a–b) WSS distribution and streamline of the AAo and aortic arch of C1, EC2, and EAD at the time instants of t1 to t4. t1 = 80 ms (mid-acceleration), t2 = 130 ms (peak systole), t3 = 180 ms (post-peak systole) and t4 = 260 ms (mid-deceleration) (c–d) The anterior and posterior views of TAWSS and OSI. According to the streamlines, the flow fields with helical flow and vortex flow characteristics are marked using black arrows
As it is depicted in Fig. 11a, the WSS in the inner curve of the AAo is first elevated at t1 (black arrows). At the peak systole (t2), an increased WSS is observed at the beginning of the outer curve of the AAo (black circles, Fig. 11a). Notably, when the AAo elongates, the area of elevated WSS reduces (EAD case at t2 of Fig. 11a). And the area of the elevated WSS starts increasing and reaches its maximum at t3, as depicted by the black arrows in the column of t3 in Fig. 11a. It should be noticed that the elevated WSS hardly reaches the aortic arch in the EAD case. Meanwhile, the flow pattern also indicates the different haemodynamic alteration which is taking place in the AAo of EAD case (Fig. 11b red box at t3). It seems that a larger elongation of AAo will cause a small vortex flow occurring around the inner curve of the middle of AAo. Finally, at the instant of t4, the amplitude of WSS decreases gradually. The WSS at the aortic bifurcations is still elevated, and the growth of the AAo weakens the WSS on the AAo and the aortic arch (the t4 column in Fig. 11a).
Comparison of the TAWSS, as it is depicted in Fig. 11c, demonstrates that a weakened distribution of WSS is observed on the outer curve of the AAo and the aortic arch in elongated case. Although consistent with the WSS pattern in the peak systole, the TAWSS on the distal end of the BA bifurcation is abnormally high (>10 Pa). Considering that the WSS on the aortic arch of the EAD case has a lower amplitude than that of the C1 and EC2 cases, the WSS gradient on the bifurcation in the EAD case may be higher. Meanwhile, the OSI distribution shows that the shear oscillation is higher on the inner curve of the AAo and the aortic arch in the EAD case (Fig. 11d), which is different from the C1 and EC2 cases, but it is similar to that of the patient-specific AD case (AD sample in Fig. 10d).
3.3 Flow Characteristics in Subjects with Dilated and Elongated AAo
Fig. 12 depicts the numerical result of streamline and WSS distribution at different moments in one cycle. A high-WSS distribution was observed on the inner curve of the aortic arch in the dilated samples (black arrows on the inner curve of EAD, EAD_D10, and EAD_D20 in Fig. 12a) due to the narrowing of the AAo. At the moment of t3, a noticeable difference in streamline can be observed (red box in and Fig. 12b). A flow field with a helical pattern was observed in the AAo in C1, EC2, and EC2_D10. It can be seen that, for the flow pattern in AAo segment, the helical flow is dominant in the control model C1 and the vortex flow occurs near the region of the aortic sinus. With the growth and dilation of AAo, vortex flow and helical flow coexist in AAo, and the region affected by vortex flow became larger. However, when the subject was AD-centreline-related, the helical pattern was weakened (Fig. 12b). Correspondingly, the flow was injected directly along the outside of the AAo, and then resulting in a vortex flow pattern inside the dilated vascular lumen which led to an elevated WSS distribution on the inner side of the AAo (red arrows in EAD_D20). Similar vortex flow was also observed in the patient-specific sample (sample AD in Fig. 10d). However, according to the streamline data, the elevated WSS is generated by the vortex pattern which will surely contribute to the local alteration of OSI.
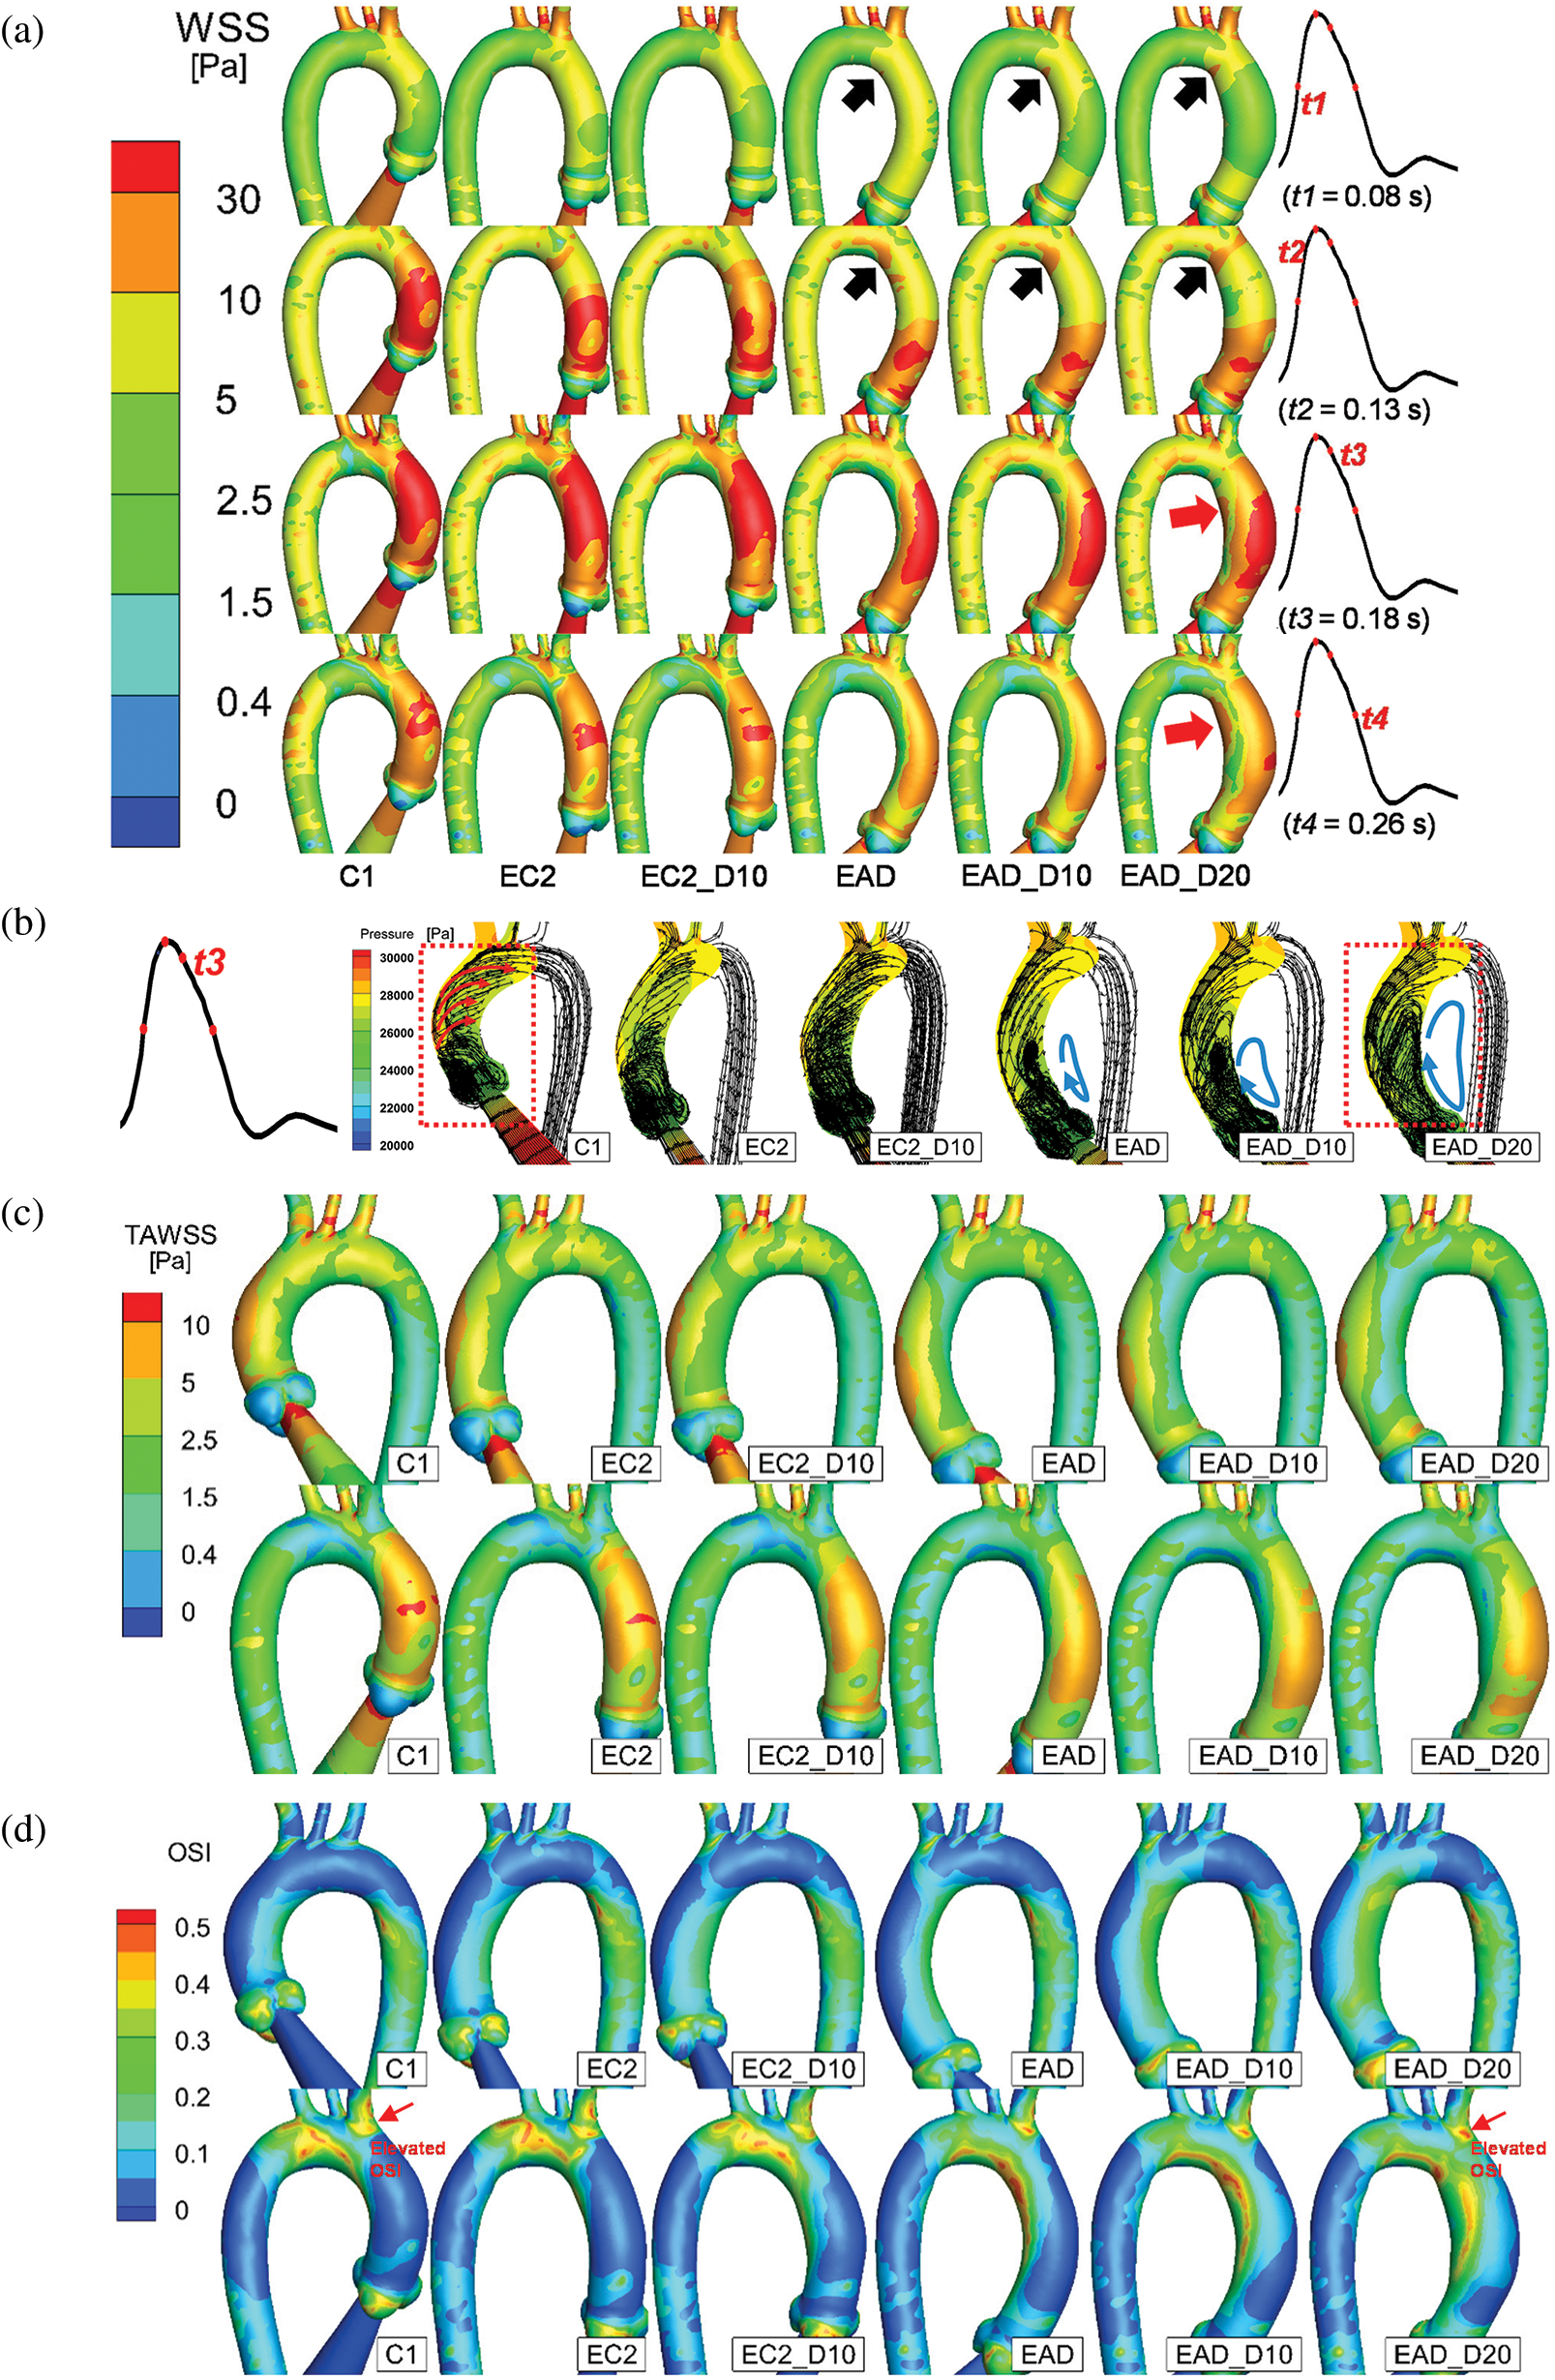
Figure 12: Numerical results of the baseline subject C1 and all the artificial models. (a) The posterior views of the AAo and aortic arch at the time points of t = 80 ms, 130 ms, 180 ms, and 260 ms, respectively. (b) Streamline and pressure on a slice of the AAo at 180 ms. (c–d) The anterior and posterior views of TAWSS and OSI distributions of all samples. According to the streamlines, the dominant flow state is indicated by arrows
The difference in flow patterns will lead to a different TAWSS and OSI outcome. Figs. 12c and 12d provide a detailed layout of TAWSS and OSI of all subjects. As the keyframes indicate, the cases with a dilated AAo share a similar but lower TAWSS distribution. Meanwhile, a concentrated region of OSI was observed in all AD-centreline-related subjects on the inner and outer sides (proximal side of the BA bifurcation) of the distal end of the AAo. Additionally, when the elongated aorta became dilated, the elevation and concentration of OSI around the ostia of the BA and the inner curve of the aortic arch increased correspondingly (red arrows in Fig. 12d).
WSS in the region with elevated OSI (red arrows in Fig. 12d) and streamline on the longitudinal section of AAo of the C1 and EAD_D20 cases were shown in Figs. 13a and 13b. WSS distribution shows an obvious oscillation in the cardiac period from 0.15 s to 0.45 s in the EAD_D20 case. While WSS in the control case decrease after reaching the second peak (t = 0.20 s). The streamline diagrams in the longitudinal section of AAo were extracted in which plane the OSI is elevated (red arrows in Fig. 12d). It was found that the obvious vortex flow patterns were observed in the EAD_D20 sample in Fig. 13b). And there is a small vortex occurring at the BA branch (red arrows in Fig. 13b) at the peak moments of the WSS of the EAD_D20 sample between 0.15 s and 0.45 s (Fig. 13a). Its disturbance of the local flow direction may be the reason for the increase in OSI at ostia of BA.
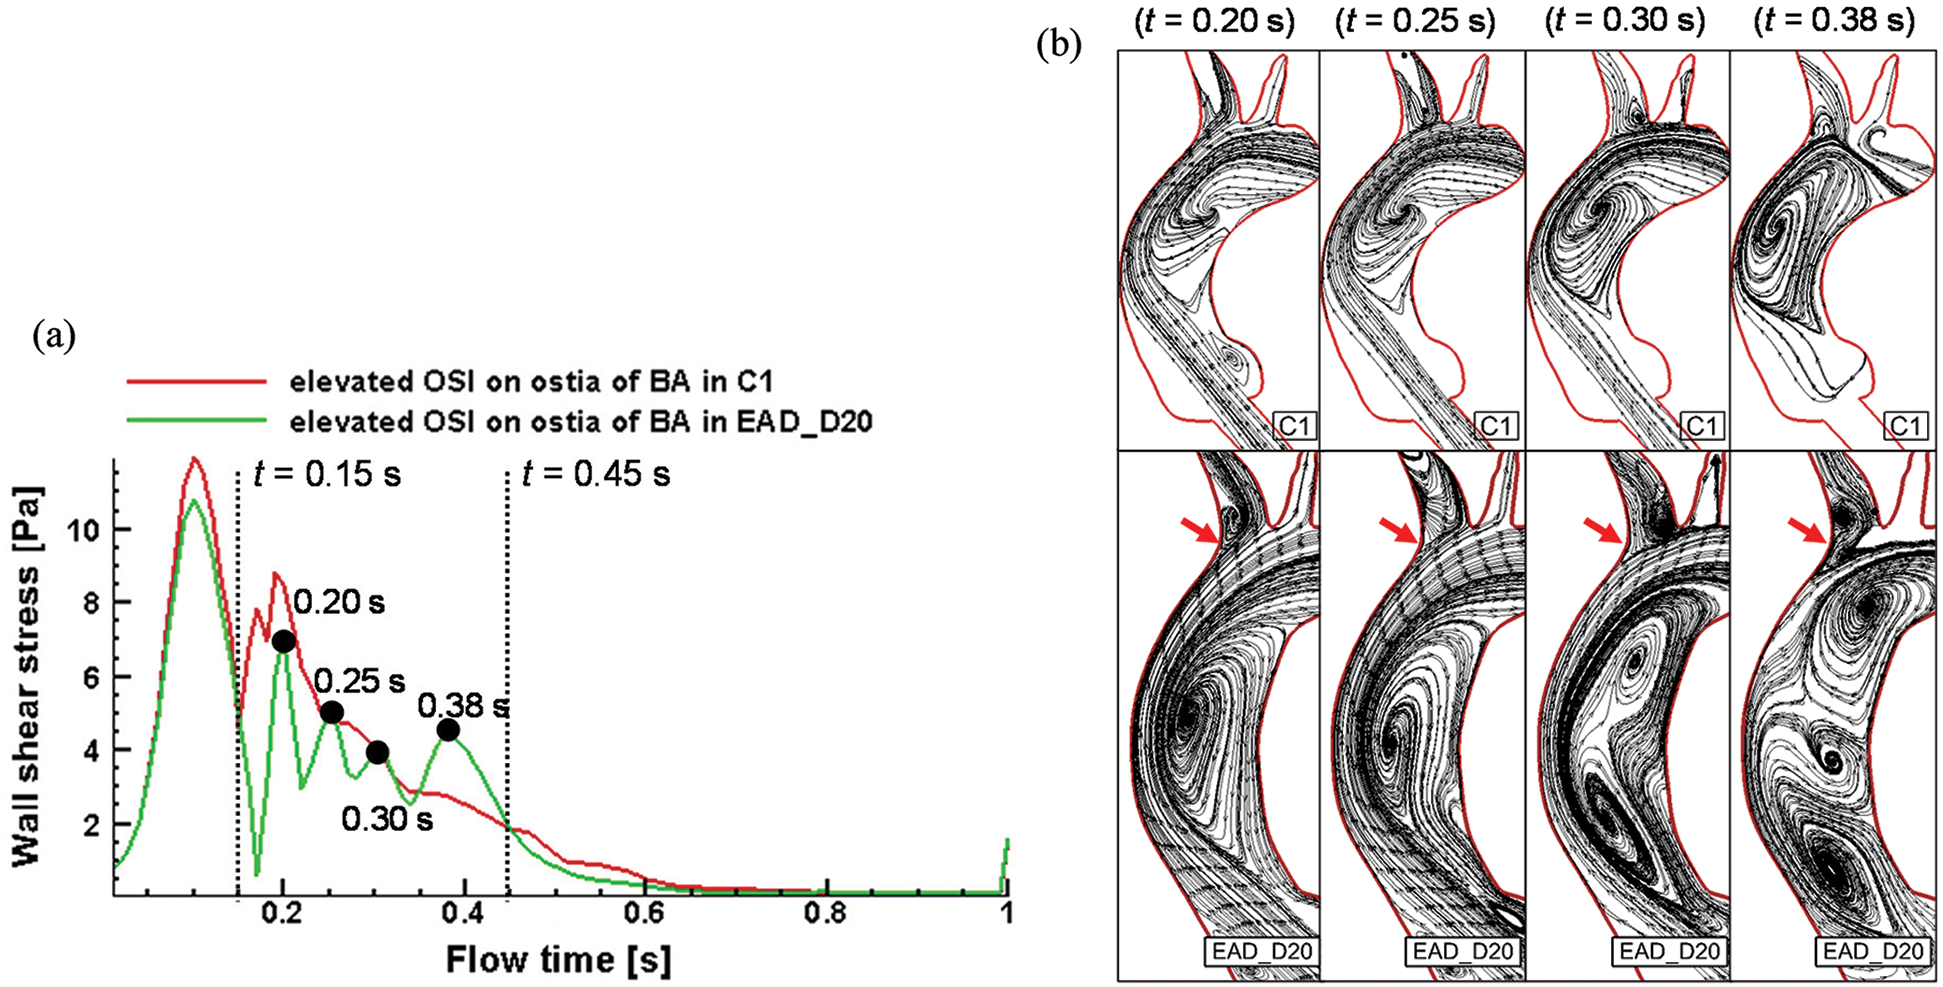
Figure 13: WSS Changes and streamline of C1 sample and EAD sample at high OSI region of the proximal ostia of BA. (a) WSS alterations over time during the cardiac cycle with the time incidents of 0.15 s and 0.45 s highlighted. (b) Streamline diagrams on the longitudinal section of AAo of C1 and EAD_D20
Several studies have reported that the aorta before the dissection could have a morphological alteration. The maximum diameter of the AAo, i.e., the widely accepted threshold for indicating the risk of AD, remains controversial. Besides the maximum diameter of the AAo, other morphological patterns, including the elongation and moderate dilation during aging or hypertension, have been proposed to indicate the risk of AD. Morphological changes may lead to the alteration of haemodynamic parameters. Computational methods, which are valuable for evaluating the role of haemodynamic parameters in vascular diseases, such as the complex phenomena involved in dissection development and progression [36,46,47], have been widely accepted to investigate the morphology-related haemodynamic alterations [48]. In this study, by replacing the centreline of the AAo of a healthy subject with the ones of an aged sample and an AD sample, five models of the elongated and dilated AAo were developed. The effects of morphological changes on aortic haemodynamic parameters were studied.
Based on the patient-specific aortic model, the influence of morphological alterations of AAo caused by age and AD on the flow field of the AAo and aortic arch can be observed in. As shown in Fig. 10, the distribution of the TAWSS on the outer curve of the AAo, the impingement region of inflow in the model of C1, is similar to that of the AD sample, but its area is reduced. At the same time, the distribution of OSI in model C1 is significantly different from that in pre-AD sample. However, for the patient-specific aortic samples, the morphological differences are not only reflected in the structure of AAo, but also presented by the angles of its aortic arch and branch vessels. These structural alterations will limit the study which focus on the influence of AAo’s morphological changes only on the haemodynamics characteristic of aortic model.
The effect of age increase and hypertension on the morphology of the AAo has been well studied, that is, AAo increases by 12% every ten years [19]. It can be seen that the elongation of the aorta is a long-term process. On the other hand, studies have pointed out that the AAo of AD patients will be extra longer [18]. However, it is a challenge to obtain CT images for the elongated process of an AAo clinically. In this case, the method to replace the centerline of AAo of healthy, elderly, or AD samples may be one of the feasible modeling methods at present. By the structure statistics of collected AD and healthy samples in this study, the morphological changes of AAo were obtained, such as the position of the maximum radius, the dilation rate of maximum radius to mean radius, the position of the aortic sinus, and the spatial position relation of AAo direction and DAo direction. With consideration of these morphological information of AAo, the grafting operation of the centerline of AAo is feasible to reproduce the physiological structure and haemodynamics state of AAo.
The accurate estimation of WSS is usually used to predict the specific tear locations, whereas abnormal WSS and WSS gradients are often discussed to investigate biological processes that may result in vascular wall remodeling [21–24,49–52]. A high WSS (10 to 30 Pa) may result in a unique expression of the endothelial layer that may participate in the arterial remodeling [53]. Besides that, an elevated WSS was found to correspond with elastic fiber degeneration [23,24]. It is worth noting that the expansive remodeling and degeneration of elastic fibers in the aorta appear to be related to AD onset. In consist with our early studies, the elevated WSS was also observed at vascular branches (Fig. 10c) [46]. In that study, the entrance of the dissection in three of five subjects was located at bifurcations on the aortic arch, where the elevated WSS was also observed. However, the entry boundary of early research still has insufficient. Early studies involving aortic valves and aortic root have reported many advantages [28–30,54]. The discreet design of the valve could enhance structural and hemodynamic performances [54]. At the same time, the aortic sinus or valve involved auxiliary computing domain is helpful to improve the authenticity of CFD calculation in the AAo [27,30,55]. Accordingly, regarding the previous works [28,29], an auxiliary blood injection model was established at the aortic sinus in this study to close the physiological situation. At the same time, a uniform entrance (Fig. 4) was conducted to avoid the inlet area alterations between different samples. As depicted by the streamlines in Fig. 9, the numerical results of C1 and EAD_D20 share highly similar flow patterns with the 4D flow MRI results (the control and dilated aortas reported by Markl et al. [45]). More importantly, together with the 3-EWM, this numerical research could reproduce the physiological flow rate in each blood vessel branch (Fig. 10a). Meanwhile, the amplitude of the pressure changes at all boundaries have exceed the physiological range which may partly due to the assumption of a rigid wall and the absence of other branch vessels, such as the coeliac trunk, and superior mesenteric aorta.
As Kim et al. reported, aging and hypertension are the risk factors for AD in patients with moderate dilation of the AAo. On the one hand, one of the most critical alterations related to elongation is the helical flow inside the AAo (Fig. 12b). As reported by Liu et al. [56], the helical flow derived from the injection flow could generate a protective flow pattern in the aortic arch. Some qualitative suggestions that the difference was provided in the helical flow pattern related to the healthy and AD patients’ aortic arches because the location of the inlet boundary was deployed inside the AAo [46]. In contrast, in the current study, the streamlined data were close to physiological authenticity. It was observed that the helical flow pattern, which should be occupying the entire AAo during the peak systole (C1 in Fig. 11b), was disturbed in the EAD case and then gradually developed into vortex flow pattern which is dominant when the dilation of the AAo occurred (cases EAD, EAD_D10, and EAD_D20 in Fig. 12b). Similar helical and vortex patterns in cases of dilated and healthy aortas have been found in 4D flow MRI detection [44].
On the other hand, when the AAo became longer, the TAWSS on the AAo and aortic arch also decreased (Fig. 11c). Meanwhile, consistent with the results of earlier studies, a region with increased WSS distribution was also presented at the distal end of BA and LCCA bifurcations [46]. In addition, abnormally low WSS occurred on the proximal side of the ostia of BA, where a larger OSI distribution was also found on the inner curve of the AAo and on the proximal side of the ostia of BA. As reported by Dolan et al. in 2011, a positive WSS gradient may be related to the pathological remodeling of aneurysm formation at vascular bifurcations [21,57]. While low WSS ( 0 Pa to 0.4 Pa) is considered to be prevalent at atherosclerosis-prone sites [58] and high OSI triggers inflammatory cell-mediated pathways, which may be related to the onset and outbreak of giant atherosclerotic aneurysms [22]. Considering these haemodynamic alterations, the elongation of the AAo may cause pathological vascular remodeling around the ostia of BA.
In addition, two elongated and dilated AAo models were generated in this study. As revealed by the numerical results, the OSI distribution of EAD_D20 was obviously different from that of the C1. The highest OSI was found on the both sides (inner and outer curves) of the distal end of the AAo (case EAD_D20 in Fig. 12d), which increases the risk of pathological remodeling of the vascular wall locally. When comparing the flow fields of the C1 and EAD_20 samples at the high OSI position, we noticed that WSS distribution shows an obvious oscillation in the EAD_D20 case. And there are obvious vortex flow patterns in the plane which is close to the location of elevated OSI. Oscillating shear stress activates monocytes and increases platelet activation. These alterations are followed by the loss and dysfunction of endothelial cells, lipid accumulation, and platelet aggregation, which may lead to acute aortic syndrome or the onset of initial tear [58–61].
However, this study still has some limitations. The first one is related to the simplified model of valve leaflets. In this study, the blood vessel was considered as rigid wall neglecting the fluid-structure interaction including the movement of aortic valve and the compliance of aortic model. The structure of valve leaflets helps to improve the outcomes of numerical results compared with the MRI-based inlet velocity profile [45,62]. Studies on the bicuspid aortic valve have also reported a difference in WSS distribution-related aortic geometry alterations [25,63]. Secondly, fluid-structure interaction is essential to obtain the low oscillatory shear stress distribution and may produce different WSS and pressure drop compared to the rigid aorta case [37,64]. In this case, the aortic valve should be involved using an FSI method in our further research. In addition, the method for distinguishing the segment of AAo, aortic arch, and DAo used in this study needs to be improved. When the angle between the proximal of the BA and the AAo becomes smaller, the bifurcated site will move forward, which may cause the length of the aortic arch to increase and the one of AAo to decrease. Moreover, it is the lack of experimental verification of the outcome of different fluid patterns in the AAo in current work. In the further study, an in vitro experiment base on a compliant aortic model will be done to investigate the influence of the wall properties on the fluid patterns. Besides that, considering that the changes in vascular structure will bring the tissue temperature variation, under the periodic blood pressure conditions [65]. The aortic structure changes would lead the variation of its surrounding tissue temperature distribution, which maybe another factor worth to be investigate.
This study revealed that abnormal elongation accompanied by moderate dilation of AAo could be morphological risk factors of type A AD, which affects haemodynamic factors at the ostia of BA. The elongation of the AAo disturbs the helical flow pattern derived from the injection flow during the systole period, which resulted in significantly different OSI distribution on the AAo. The results also presented that when an elongated AAo becomes dilated, the region effected by vortex flow became larger, which gives rise to a localized OSI concentration at the distal end of the inner and outer curves of the AAo. Considering that the ostia of the BA and its inner curve are at locations vulnerable to type A AD, it will suggest that clinicians should be alert if an elderly or hypertensive patient’s AAo has an elongated trend with dilation.
Funding Statement: This research was funded by the National Natural Science Foundation of China [No. 51976026], Dalian Innovative Funding of Science and Technology [No. 2018J12SN076], and the Fundamental Research Funds for the Central Universities [DUT20GJ203].
Conflicts of Interest: The authors declare that they have no conflicts of interest to report regarding the present study.
1. Larson, E. W., Edwards, W. D. (1984). Risk factors for aortic dissection: A necropsy study of 161 cases. American Journal of Cardiology, 53(6), 849–855. DOI 10.1016/0002-9149(84)90418-1. [Google Scholar] [CrossRef]
2. Prêtre, R., Von Segesser, L. K. (1997). Aortic dissection. Lancet, 349(9063), 1461–1464. DOI 10.1016/S0140-6736(96)09372-5. [Google Scholar] [CrossRef]
3. Macura, K. J., Corl, F. M., Fishman, E. K., Bluemke, D. A. (2003). Pathogenesis in acute aortic syndromes: Aortic dissection, intramural hematoma, and penetrating atherosclerotic aortic ulcer, 181, 309–316. [Google Scholar]
4. Von Kodolitsch, Y., Csösz, S. K., Koschyk, D. H., Schalwat, I., Loose, R. et al. (2003). Intramural hematoma of the aorta. Circulation, 107(8), 1158–1163. DOI 10.1161/01.CIR.0000052628.77047.EA. [Google Scholar] [CrossRef]
5. Golledge, J., Eagle, K. A. (2008). Acute aortic dissection. Lancet, 372(9632), 55–66. DOI 10.1016/S0140-6736(08)60994-0. [Google Scholar] [CrossRef]
6. Mehta, R. H., Suzuki, T., Hagan, P. G., Bossone, E., Gilon, D. et al. (2002). Predicting death in patients with acute type A aortic dissection. Circulation, 105(2), 200–206. DOI 10.1161/hc0202.102246. [Google Scholar] [CrossRef]
7. Conzelmann, L. O., Hoffmann, I., Blettner, M., Kallenbach, K., Karck, M. et al. (2012). Analysis of risk factors for neurological dysfunction in patients with acute aortic dissection type A: Data from the German Registry for Acute Aortic Dissection Type A. European Journal of Cardio-Thoracic Surgery, 42(3), 557–565. DOI 10.1093/ejcts/ezs025. [Google Scholar] [CrossRef]
8. Kallenbach, K. (2004). Evolving strategies for treatment of acute aortic dissection type A. Circulation, 110(suppl II), II-243–II-249. [Google Scholar]
9. Olsson, C., Thelin, S., Ståhle, E., Ekbom, A., Granath, F. (2006). Thoracic aortic aneurysm and dissection. Circulation, 114(24), 2611–2618. DOI 10.1161/CIRCULATIONAHA.106.630400. [Google Scholar] [CrossRef]
10. Parolari, A., Tremoli, E., Songia, P., Pilozzi, A., Di Bartolomeo, R. et al. (2013). Biological features of thoracic aortic diseases. Where are we now, where are we heading to: Established and emerging biomarkers and molecular pathways. European Journal of Cardio-Thoracic Surgery, 44(1), 9–23. DOI 10.1093/ejcts/ezs647. [Google Scholar] [CrossRef]
11. Coady, M. A., Rizzo, J. A., Hammond, G. L., Mandapati, D., Darr, U. et al. (1997). What is the appropriate size criterion for resection of thoracic aortic aneurysms? Journal of Thoracic and Cardiovascular Surgery, 113(3), 476–491. DOI 10.1016/S0022-5223(97)70360-X. [Google Scholar] [CrossRef]
12. Davies, R. R., Goldstein, L. J., Coady, M. A., Tittle, S. L., Rizzo, J. A. et al. (2002). Yearly rupture or dissection rates for thoracic aortic aneurysms: Simple prediction based on size. Annals of Thoracic Surgery, 73(1), 17–28. DOI 10.1016/S0003-4975(01)03236-2. [Google Scholar] [CrossRef]
13. Davies, R. R., Gallo, A., Coady, M. A., Tellides, G., Botta, D. M. et al. (2006). Novel measurement of relative aortic size predicts rupture of thoracic aortic aneurysms. Annals of Thoracic Surgery, 81(1), 169–177. DOI 10.1016/j.athoracsur.2005.06.026. [Google Scholar] [CrossRef]
14. Tozzi, P., Gunga, Z., Niclauss, L., Delay, D., Roumy, A. et al. (2021). Type A aortic dissection in aneurysms having modelled pre-dissection maximum diameter below 45 mm: Should we implement current guidelines to improve the survival benefit of prophylactic surgery? European Journal of Cardio-Thoracic Surgery, 59(2), 473–478. DOI 10.1093/ejcts/ezaa351. [Google Scholar] [CrossRef]
15. Pape, L. A., Tsai, T. T., Isselbacher, E. M., Oh, J. K., O’Gara, P. T. et al. (2007). Aortic diameter ≥5.5 cm is not a good predictor of type A aortic dissection. Circulation, 116(10), 1120–1127. DOI 10.1161/CIRCULATIONAHA.107.702720. [Google Scholar] [CrossRef]
16. Kim, E. K., Choi, S. H., Sung, K., Kim, W. S., Choe, Y. H. et al. (2014). Aortic diameter predicts acute type A aortic dissection in patients with Marfan syndrome but not in patients without Marfan syndrome. Journal of Thoracic and Cardiovascular Surgery, 147(5), 1505–1510. DOI 10.1016/j.jtcvs.2013.05.025. [Google Scholar] [CrossRef]
17. Kim, J. B., Spotnitz, M., Lindsay, M. E., MacGillivray, T. E., Isselbacher, E. M. et al. (2016). Risk of aortic dissection in the moderately dilated ascending aorta. Journal of the American College of Cardiology, 68(11), 1209–1219. DOI 10.1016/j.jacc.2016.06.025. [Google Scholar] [CrossRef]
18. Heuts, S., Adriaans, B. P., Rylski, B., Mihl, C., Bekkers, S. C. A. M. et al. (2020). Evaluating the diagnostic accuracy of maximal aortic diameter, length and volume for prediction of aortic dissection. Heart, 106(12), 892–897. DOI 10.1136/heartjnl-2019-316251. [Google Scholar] [CrossRef]
19. Craiem, D., Chironi, G., Casciaro, M. E., Redheuil, A., Mousseaux, E. et al. (2013). Three-dimensional evaluation of thoracic aorta enlargement and unfolding in hypertensive men using non-contrast computed tomography. Journal of Human Hypertension, 27(8), 504–509. DOI 10.1038/jhh.2012.69. [Google Scholar] [CrossRef]
20. Sugawara, J., Hayashi, K., Yokoi, T., Tanaka, H. (2008). Age-associated elongation of the ascending aorta in adults. JACC: Cardiovascular Imaging, 1(6), 739–748. DOI 10.1016/j.jcmg.2008.06.010. [Google Scholar] [CrossRef]
21. DePaola, N., Gimbrone, M. A., Davies, P. F., Dewey, C. F. (1992). Vascular endothelium responds to fluid shear stress gradients. Arteriosclerosis and Thrombosis: A Journal of Vascular Biology, 12(11), 1254–1257. DOI 10.1161/01.ATV.12.11.1254. [Google Scholar] [CrossRef]
22. Meng, H., Tutino, V. M., Xiang, J., Siddiqui, A. (2014). High WSS or low WSS? Complex interactions of hemodynamics with intracranial aneurysm initiation, growth, and rupture: Toward a unifying hypothesis. American Journal of Neuroradiology, 35(7), 1254–1262. DOI 10.3174/ajnr.A3558. [Google Scholar] [CrossRef]
23. Guzzardi, D. G., Barker, A. J., van Ooij, P., Malaisrie, S. C., Puthumana, J. J. et al. (2015). Valve-related hemodynamics mediate human bicuspid aortopathy. Journal of the American College of Cardiology, 66(8), 892–900. DOI 10.1016/j.jacc.2015.06.1310. [Google Scholar] [CrossRef]
24. Adriaans, B. P., Wildberger, J. E., Westenberg, J. J. M., Lamb, H. J., Schalla, S. (2019). Predictive imaging for thoracic aortic dissection and rupture: moving beyond diameters. European Radiology, 29(12), 6396–6404. DOI 10.1007/s00330-019-06320-7. [Google Scholar] [CrossRef]
25. Barker, A. J., Markl, M., Bürk, J., Lorenz, R., Bock, J. et al. (2012). Bicuspid aortic valve is associated with altered wall shear stress in the ascending aorta. Circulation: Cardiovascular Imaging, 5(4), 457–466. DOI 10.1161/CIRCIMAGING.112.973370. [Google Scholar] [CrossRef]
26. Dillon-Murphy, D., Noorani, A., Nordsletten, D., Figueroa, C. A. (2016). Multi-modality image-based computational analysis of haemodynamics in aortic dissection. Biomechanics and Modeling in Mechanobiology, 15(4), 857–876. DOI 10.1007/s10237-015-0729-2. [Google Scholar] [CrossRef]
27. Geiger, J., Hirtler, D., Gottfried, K., Rahman, O., Bollache, E. et al. (2017). Longitudinal evaluation of aortic hemodynamics in Marfan syndrome: New insights from a 4D flow cardiovascular magnetic resonance multi-year follow-up study. Journal of Cardiovascular Magnetic Resonance, 19(1), 2516. DOI 10.1186/s12968-017-0347-5. [Google Scholar] [CrossRef]
28. Boccadifuoco, A., Mariotti, A., Celi, S., Martini, N., Salvetti, M. V. (2018). Impact of uncertainties in outflow boundary conditions on the predictions of hemodynamic simulations of ascending thoracic aortic aneurysms. Computers & Fluids, 165(3), 96–115. DOI 10.1016/j.compfluid.2018.01.012. [Google Scholar] [CrossRef]
29. Bruening, J., Hellmeier, F., Yevtushenko, P., Kelm, M., Nordmeyer, S. et al. (2018). Impact of patient-specific LVOT inflow profiles on aortic valve prosthesis and ascending aorta hemodynamics. Journal of Computational Science, 24(3), 91–100. DOI 10.1016/j.jocs.2017.11.005. [Google Scholar] [CrossRef]
30. Mendez, V., Di Giuseppe, M., Pasta, S. (2018). Comparison of hemodynamic and structural indices of ascending thoracic aortic aneurysm as predicted by 2-way FSI, CFD rigid wall simulation and patient-specific displacement-based FEA. Computers in Biology and Medicine, 100(9), 221–229. DOI 10.1016/j.compbiomed.2018.07.013. [Google Scholar] [CrossRef]
31. Caballero, A. D., Laín, S. (2013). A review on computational fluid dynamics modelling in human thoracic aorta. Cardiovascular Engineering and Technology, 4(2), 103–130. DOI 10.1007/s13239-013-0146-6. [Google Scholar] [CrossRef]
32. Patankar, S. V., Spalding, D. B. (1972). Calculation procedure for heat, mass and momentum transfer in three-dimensional parabolic flows. International Journal of Heat and Mass Transfer, 15(10), 1787–1806. DOI 10.1016/0017-9310(72)90054-3. [Google Scholar] [CrossRef]
33. Kousera, C. A., Wood, N. B., Seed, W. A., Torii, R., O’Regan, D. et al. (2013). A numerical study of aortic flow stability and comparison with in vivo flow measurements. Journal of Biomechanical Engineering, 135(1), 179. DOI 10.1115/1.4023132. [Google Scholar] [CrossRef]
34. Menter, F. R., Langtry, R., Völker, S. (2006). Transition modelling for general purpose CFD codes. Flow, Turbulence and Combustion, 77(1–4), 277–303. DOI 10.1007/s10494-006-9047-1. [Google Scholar] [CrossRef]
35. Langtry, R. B., Menter, F. R. (2009). Correlation-based transition modeling for unstructured parallelized computational fluid dynamics codes. AIAA Journal, 47(12), 2894–2906. DOI 10.2514/1.42362. [Google Scholar] [CrossRef]
36. Cheng, Z., Tan, F. P. P., Riga, C. V., Bicknell, C. D., Hamady, M. S. et al. (2010). Analysis of flow patterns in a patient-specific aortic dissection model. Journal of Biomechanical Engineering, 132(5), 897. [Google Scholar]
37. Alimohammadi, M., Sherwood, J. M., Karimpour, M., Agu, O., Balabani, S. et al. (2015). Aortic dissection simulation models for clinical support: fluid-structure interaction vs. rigid wall models. BioMedical Engineering OnLine, 14(1), 1661. DOI 10.1186/s12938-015-0032-6. [Google Scholar] [CrossRef]
38. Morbiducci, U., Ponzini, R., Gallo, D., Bignardi, C., Rizzo, G. (2013). Inflow boundary conditions for image-based computational hemodynamics: Impact of idealized versus measured velocity profiles in the human aorta. Journal of Biomechanics, 46(1), 102–109. DOI 10.1016/j.jbiomech.2012.10.012. [Google Scholar] [CrossRef]
39. Reymond, P., Merenda, F., Perren, F., Rüfenacht, D., Stergiopulos, N. (2009). Validation of a one-dimensional model of the systemic arterial tree. American Journal of Physiology-Heart and Circulatory Physiology, 297(1), H208–H222. DOI 10.1152/ajpheart.00037.2009. [Google Scholar] [CrossRef]
40. LaDisa, J. F., Alberto Figueroa, C., Vignon-Clementel, I. E., Jin, K. H., Xiao, N. et al. (2011). Computational simulations for aortic coarctation: Representative results from a sampling of patients. Journal of Biomechanical Engineering, 133(9), 281. DOI 10.1115/1.4004996. [Google Scholar] [CrossRef]
41. Liu, X., Fan, Y., Deng, X., Zhan, F. (2011). Effect of non-Newtonian and pulsatile blood flow on mass transport in the human aorta. Journal of Biomechanics, 44(6), 1123–1131. DOI 10.1016/j.jbiomech.2011.01.024. [Google Scholar] [CrossRef]
42. Pirola, S., Cheng, Z., Jarral, O. A., O’Regan, D. P., Pepper, J. R. et al. (2017). On the choice of outlet boundary conditions for patient-specific analysis of aortic flow using computational fluid dynamics. Journal of Biomechanics, 60, 15–21. DOI 10.1016/j.jbiomech.2017.06.005. [Google Scholar] [CrossRef]
43. Kim, H. J., Vignon-Clementel, I. E., Figueroa, C. A., LaDisa, J. F., Jansen, K. E. et al. (2009). On coupling a lumped parameter heart model and a three-dimensional finite element aorta model. Annals of Biomedical Engineering, 37(11), 2153–2169. DOI 10.1007/s10439-009-9760-8. [Google Scholar] [CrossRef]
44. Bürk, J., Blanke, P., Stankovic, Z., Barker, A., Russe, M. et al. (2012). Evaluation of 3D blood flow patterns and wall shear stress in the normal and dilated thoracic aorta using flow-sensitive 4D CMR. Journal of Cardiovascular Magnetic Resonance, 14(1), 1–11. DOI 10.1186/1532-429X-14-1. [Google Scholar] [CrossRef]
45. Markl, M., Kilner, P. J., Ebbers, T. (2011). Comprehensive 4D velocity mapping of the heart and great vessels by cardiovascular magnetic resonance. Journal of Cardiovascular Magnetic Resonance, 13(1), 197. DOI 10.1186/1532-429X-13-7. [Google Scholar] [CrossRef]
46. Chi, Q., He, Y., Luan, Y., Qin, K., Mu, L. (2017). Numerical analysis of wall shear stress in ascending aorta before tearing in type A aortic dissection. Computers in Biology and Medicine, 89(6), 236–247. DOI 10.1016/j.compbiomed.2017.07.029. [Google Scholar] [CrossRef]
47. Cheng, Z., Juli, C., Wood, N. B., Gibbs, R. G. J., Xu, X. Y. (2014). Predicting flow in aortic dissection: Comparison of computational model with PC-MRI velocity measurements. Medical Engineering & Physics, 36(9), 1176–1184. DOI 10.1016/j.medengphy.2014.07.006. [Google Scholar] [CrossRef]
48. Pirola, S., Guo, B., Menichini, C., Saitta, S., Fu, W. et al. (2019). 4-D flow MRI-based computational analysis of blood flow in patient-specific aortic dissection. IEEE Transactions on Biomedical Engineering, 66(12), 3411–3419. DOI 10.1109/TBME.2019.2904885. [Google Scholar] [CrossRef]
49. Dolan, J. M., Kolega, J., Meng, H. (2013). High wall shear stress and spatial gradients in vascular pathology: a review. Annals of Biomedical Engineering, 41(7), 1411–1427. DOI 10.1007/s10439-012-0695-0. [Google Scholar] [CrossRef]
50. Doyle, B. J., Norman, P. E. (2016). Computational biomechanics in thoracic aortic dissection: Today’s approaches and tomorrow’s opportunities. Annals of Biomedical Engineering, 44(1), 71–83. DOI 10.1007/s10439-015-1366-8. [Google Scholar] [CrossRef]
51. Arzani, A., Shadden, S. C. (2016). Characterizations and correlations of wall shear stress in aneurysmal flow. Journal of Biomechanical Engineering, 138(1), 323. DOI 10.1115/1.4032056. [Google Scholar] [CrossRef]
52. Geers, A. J., Morales, H. G., Larrabide, I., Butakoff, C., Bijlenga, P. et al. (2017). Wall shear stress at the initiation site of cerebral aneurysms. Biomechanics and Modeling in Mechanobiology, 16(1), 97–115. DOI 10.1007/s10237-016-0804-3. [Google Scholar] [CrossRef]
53. Dolan, J. M., Meng, H., Singh, S., Paluch, R., Kolega, J. (2011). High fluid shear stress and spatial shear stress gradients affect endothelial proliferation. Annals of Biomedical Engineering, 39(6), 1620–1631. DOI 10.1007/s10439-011-0267-8. [Google Scholar] [CrossRef]
54. Zhu, G., Ismail, M. B., Nakao, M., Yuan, Q., Yeo, J. H. (2019). Numerical and in-vitro experimental assessment of the performance of a novel designed expanded-polytetrafluoroethylene stentless bi-leaflet valve for aortic valve replacement. PLoS One, 14(1), e0210780. DOI 10.1371/journal.pone.0210780. [Google Scholar] [CrossRef]
55. Boufi, M., Guivier-Curien, C., Loundou, A. D., Deplano, V., Boiron, O. et al. (2017). Morphological analysis of healthy aortic arch. European Journal of Vascular and Endovascular Surgery, 53(5), 663–670. DOI 10.1016/j.ejvs.2017.02.023. [Google Scholar] [CrossRef]
56. Liu, X., Pu, F., Fan, Y., Deng, X., Li, D. et al. (2009). A numerical study on the flow of blood and the transport of LDL in the human aorta: the physiological significance of the helical flow in the aortic arch. American Journal of Physiology-Heart and Circulatory Physiology, 297(1), H163–H170. DOI 10.1152/ajpheart.00266.2009. [Google Scholar] [CrossRef]
57. Dolan, J. M., Sim, F. J., Meng, H., Kolega, J. (2012). Endothelial cells express a unique transcriptional profile under very high wall shear stress known to induce expansive arterial remodeling. American Journal of Physiology-Cell Physiology, 302(8), C1109–C1118. DOI 10.1152/ajpcell.00369.2011. [Google Scholar] [CrossRef]
58. Malek, A. M. (1999). Hemodynamic shear stress and its role in atherosclerosis. Jama, 282(21), 2035–2042. DOI 10.1001/jama.282.21.2035. [Google Scholar] [CrossRef]
59. Langille, B., O’Donnell, F. (1986). Reductions in arterial diameter produced by chronic decreases in blood flow are endothelium-dependent. Science, 231(4736), 405–407. DOI 10.1126/science.3941904. [Google Scholar] [CrossRef]
60. Nadaud, S., Philippe, M., Arnal, J. F., Michel, J. B., Soubrier, F. (1996). Sustained increase in aortic endothelial Nitric Oxide synthase expression in vivo in a model of chronic high blood flow. Circulation Research, 79(4), 857–863. DOI 10.1161/01.RES.79.4.857. [Google Scholar] [CrossRef]
61. Mussa, F. F., Horton, J. D., Moridzadeh, R., Nicholson, J., Trimarchi, S. et al. (2016). Acute aortic dissection and intramural hematoma. Jama, 316(7), 754–763. DOI 10.1001/jama.2016.10026. [Google Scholar] [CrossRef]
62. Goubergrits, L., Mevert, R., Yevtushenko, P., Schaller, J., Kertzscher, U. et al. (2013). The impact of MRI-based inflow for the hemodynamic evaluation of aortic coarctation. Annals of Biomedical Engineering, 41(12), 2575–2587. DOI 10.1007/s10439-013-0879-2. [Google Scholar] [CrossRef]
63. Garcia, J., Barker, A. J., Collins, J. D., Carr, J. C., Markl, M. (2017). Volumetric quantification of absolute local normalized helicity in patients with bicuspid aortic valve and aortic dilatation. Magnetic Resonance in Medicine, 78(2), 689–701. DOI 10.1002/mrm.26387. [Google Scholar] [CrossRef]
64. Zakaria, M. S., Abdullah, H., Nordin, A., Zaki, S. A. (2021). Effect of patient-specific aorta wall properties on hemodynamic parameters. Fluid Dynamics & Materials Processing, 17(1), 171–179. DOI 10.32604/fdmp.2021.010974. [Google Scholar] [CrossRef]
65. Tang, Y., Mu, L., He, Y. (2020). Numerical simulation of fluid and heat transfer in a biological tissue using an immersed boundary method mimicking the exact structure of the microvascular network. Fluid Dynamics & Materials Processing, 16(2), 281–296. DOI 10.32604/fdmp.2020.06760. [Google Scholar] [CrossRef]
 | This work is licensed under a Creative Commons Attribution 4.0 International License, which permits unrestricted use, distribution, and reproduction in any medium, provided the original work is properly cited. |