Materials Processing
| Fluid Dynamics & Materials Processing |
DOI: 10.32604/fdmp.2021.014651
ARTICLE
CFD Analysis and Optimization of an Engine with a Restrictor Valve in the Intake System
Guilin University of Aerospace Technology, Guilin, 541004, China
*Corresponding Authors: Huali Guo. Email: guohuali@guat.edu.cn; Zhilong Zhang. Email: zhangzhilong@guat.edu.cn
Received: 16 October 2020; Accepted: 15 January 2021
Abstract: In some competitions the rules clearly state that all participating cars must install a restrictor valve structure in the intake system of the engine. The intake air volume of the engine is considerably affected due to the existence of such a valve. Indeed, a small interface diameter through which gas flows can lead to considerable flow resistance and loss. In this study, a four-cylinder engine for FSC racing is analyzed using a combined method based on numerical simulation and experiments. The analysis reveals that the main factors affecting the intake air volume are the intake manifold and the volume of the resonance chamber. The influence of such factors is assessed using a single variable method and an optimal model and parameters are obtained accordingly. Comparison of different results show that the maximum torque for the optimized system is increased from the original 42.6 N·m to 46.9 N·m, thus demonstrating an increase of 10.6%. These findings provide a theoretical basis for the design of the intake system and the improvement of engine performance.
Keywords: Optimisation analysis; restrictor valve structure; intake system; CFD
Formula Student China (FSC) follows the requirement of the rules, that is, Zhang et al. [1] all participating cars must install a 20 mm diameter current limiting structure in the engine air intake system. The restrictor valve will directly affect the total intake mass of the engine, which leads to a reduction in engine power and torque, thereby ultimately affecting the comprehensive performance of the car. Various colleges and universities have proposed many methods of improvements and optimisation designs for engine performance, especially the intake system, to increase the amount of intake air mass, thereby improving the engine power [2]. These methods also aim to enhance the competitiveness of various colleges and universities in the competition.
Domestic and foreign studies on air intake systems mainly focused on ordinary car engines whose speed is generally lower than 6000 rpm [3]. Some scholars investigated the influence of manifold length or pressure chamber change on engine performance. Their research mainly focused on theoretical simulation analysis, which often lacks experimental verification [4,5]. This article combines theoretical simulation and experimental data comprehensively, which is practical and innovative. Analysis revealed that the main factors that affect the intake air volume are the intake manifold and the volume of the surge chamber. The single variable method is adopted to complete the effect of the resonance chamber volume and intake manifold size on the engine performance, and the optimal model and parameters are obtained.
2 Structure and Basic Parameters of the Intake System
2.1 Basic Structure of Air Intake Systems with Restrictor Valves
The quality of the intake system has a substantial impact on engine performance. The best layout for the intake system uses the front overhead arrangement based on the race rules and the overall layout of the car [2]. Thus, the system maximises the use of the air collision volume and the large windward area of high-speed driving, and the end is connected with the centre of the pressure stabilising cavity. Adopting a symmetrical arrangement is preferred to ensure uniform intake of the four cylinders. The basic structure of the engine intake flow line is presented in Fig. 1 as follows: air filter, throttle valve, intake limiter, resonance chamber, intake manifold, intake duct and cylinder.
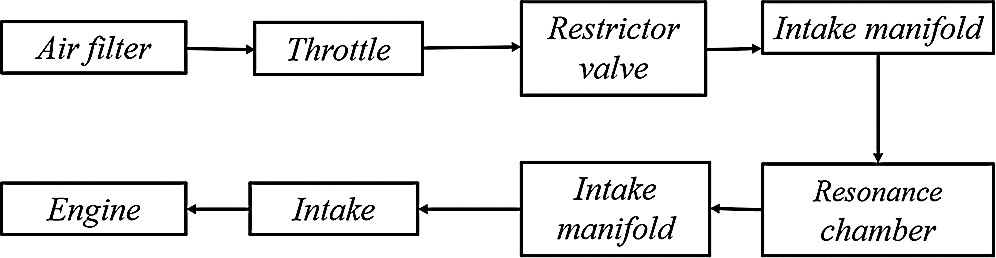
Figure 1: Schematic of the restrictor valve intake system
2.2 Basic Parameters of the Intake System
Related literature indicates that the intake restrictor valve belongs to the venturi tube [6]. A 14° divergent angle can reduce the loss caused by large-area instability in the internal flow process of the air intake manifold and the transition to turbulence. Therefore, the optimal divergence angle of 14° is initially selected as the diffusion angle after the current limitation. Considering the structural arrangement of the intake system, the total length of the intake pipe is set to 260 mm. The inlet diameter is determined by the outlet diameter of the throttle valve as 28 mm. The length of the cylinder section is 20 mm which is met the requirements of the restrictive valve diameter of the competition rules. The tapered angle length is 21.5 and the tapered angle is 22°, which are used to satisfy less intake air flow resistance. The restrictor valve length is 5 mm, which is mainly meet the competition rules and processing requirements. The taper angle is 7°, which can be obtained the maximum intake air flow. The basic size and structure of the intake manifold are shown in Fig. 2.
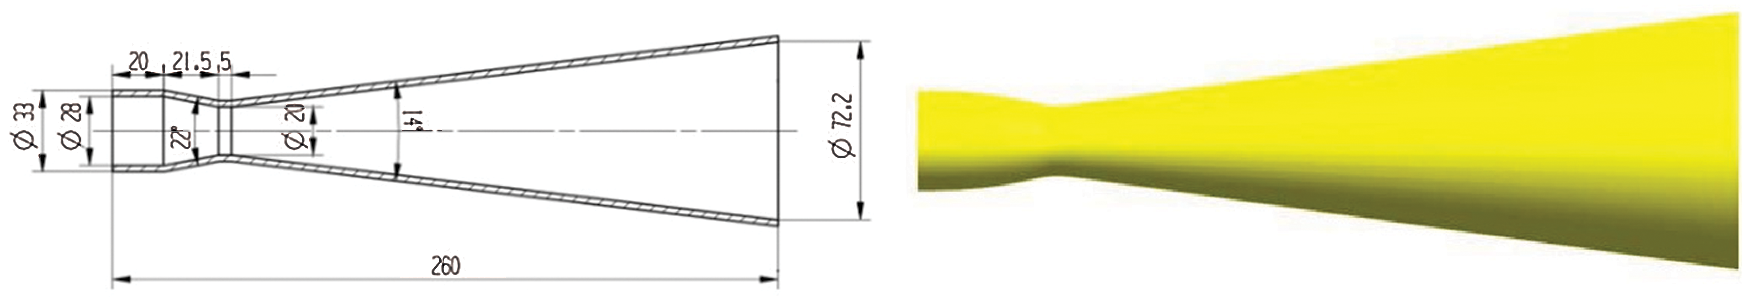
Figure 2: Schematic of the intake structure
2.2.2 Length of the Intake Manifold
The wave and inertial effects of the gas can be used to generate a large value pressure wave at a specific speed stage to increase the intake air volume. The calculation of the intake manifold length is based on the fluctuation effect.
In the equation above, q is the number of fluctuations, taking 4.5, c is the speed of sound under normal temperature conditions, which is 345 m/s, n is the engine speed, taking 8500 r/min, and L is calculated as 0.2706 m.
The total tube length is finally determined to be 270 mm. The calculated intake manifold length L includes the engine intake port length. Therefore, the CBR600 intake port length is 100 mm, the original engine throttle length is 75 mm and the final intake manifold length is
2.2.3 Volume of the Resonance Chamber
The volume of the resonance chamber also affects the intake air volume. If the volume is substantially large, then the pressure fluctuation in the resonance chamber will be reduced, the resonance effect will be weakened and the throttle response time will be prolonged. If the volume is substantially small, then the pressure fluctuation in the resonance chamber will increase, which cannot meet the high-load air intake requirements of the engine. The volume of the resonance chamber is generally four to seven times the total displacement of the engine. The displacement of the CBR600 engine is 0.6 L. Therefore, the volume of the resonance chamber is initially set to be five times the displacement, which is 3 L.
The structural parameters of the engine with a restrictor valve based on the above calculation data are shown in Tab. 1.
Table 1: Structural parameters of the engine after intake airflow limitation
The above calculation results reveal that the UG three-dimensional modelling software is used to establish a three-dimensional model of the intake system, as shown in Fig. 3.
Figure 3: Three-dimensional model diagram of air intake system with restrictor valve
2.3 Basic Parameters of FSC Engine
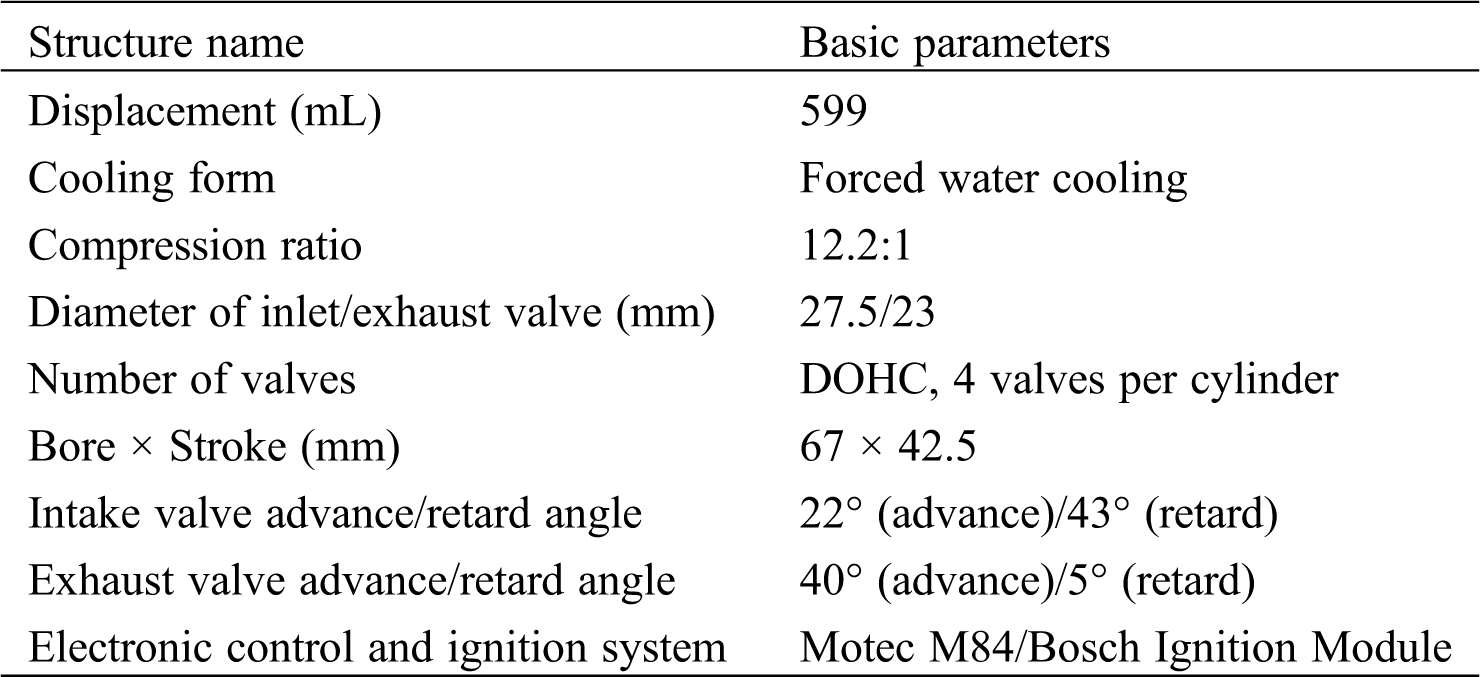
The competition rules require that the engine displacement must not exceed 610 mL. Therefore, the engine displacement used is 599 mL, and some of the engine’s structural parameters are shown in Tab. 2.
Table 2: Basic parameters of FSC engine
3 GT-Power Model and Simulation Analysis
3.1 GT-Power Model of Engine Working
GT-Power, which is a software that simulates and calculates the working process of the engine, performs a one-dimensional simulation analysis on the flow of the intake port. The simulation software uses numerical simulation methods to solve the mass, momentum and energy conservation equations to address the problem of unstable and compressible gas flows in the intake system. The flow state of gas in the air duct is remarkably complex [7]. Thus, the following assumptions are provided when establishing the equation of the intake pipe.
1. The fluid state in the tube is similar in the same section, which conforms to the ideal gas state equation.
2. The state of the working fluid in the cylinder is uniform. That is to say, the pressure, temperature and concentration of all points in the cylinder are equal everywhere at the same instant.
3. The fresh charge entering the cylinder through the system boundary and the residual exhaust gas in the cylinder achieve instantaneous and complete mixing during the intake period.
The flow in the engine intake and exhaust pipes is simplified to a one-dimensional unsteady flow, that is, the flow parameters only change with the x axial coordinate and time (t). The finite volume method is used to analyse the following governing equations.
In the above formula, u is the air velocity, ρ is the gas density, p is the gas pressure, F is the pipe section area, f is the frictional resistance, D is the equivalent diameter, a is the gas flow acceleration, k is the heat transfer coefficient, q is the radiant energy.
The engine combustion model selects the Wiebe model, and its heat release law is the load Wiebe function. The relationship is presented as follows:
In the above formula, Q is the total energy of combustion, a0 is the angle of burning start, m is the shape factor and Δac is the burning duration.
This study chooses the Woschni model as the in-cylinder heat transfer model in the absence of the in-cylinder eddy current data. The thermal conductivity of the fluid to the wall is calculated by Colburn’s similarity theory. The calculation formula is as follows:
In the above formula, Cf is the friction factor, Cp is the gas specific heat capacity, Ueff is the effective velocity outside the boundary layer, Pr is the Planck number.
3.2 Establishment of the Engine Model
A one-dimensional GT-Power simulation model of the CBR600 engine, which is based on the introduction of the restricted flow intake system, is established. The model includes basic parameters, such as intake environment, air filter, throttle valve, resonance chamber, engine intake port, intake and exhaust valves, cylinder, crankcase and intake and exhaust pipes. The GT-Power model is shown in Fig. 4.
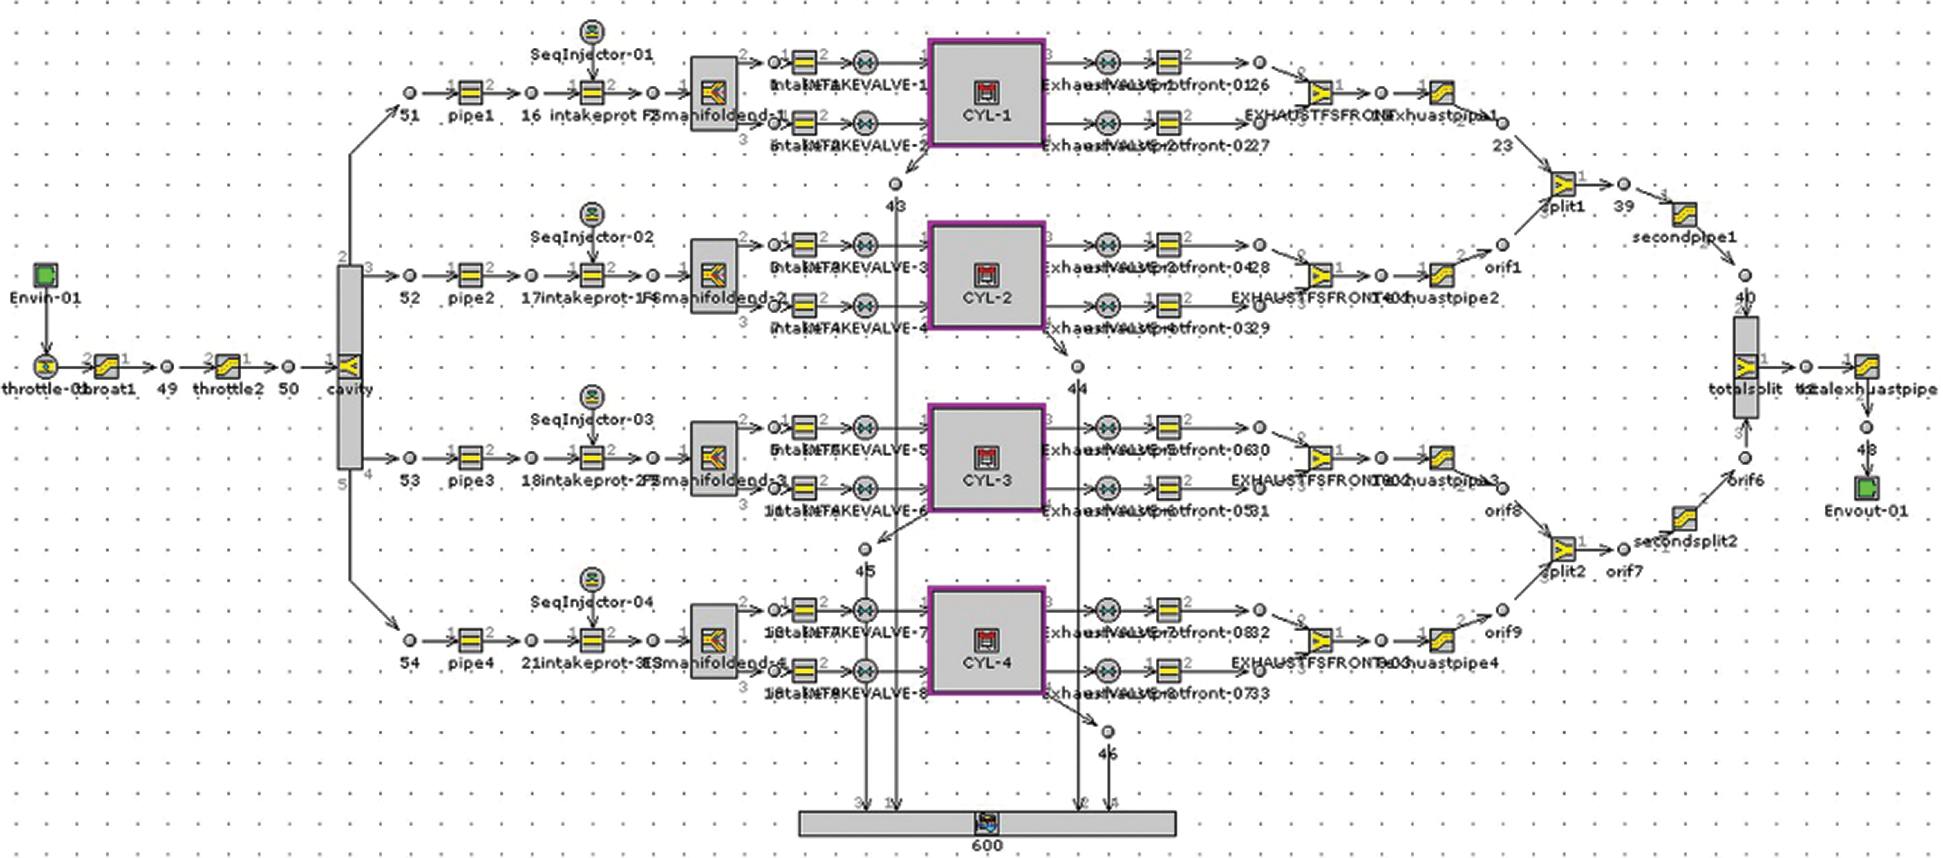
Figure 4: GT-Power simulation model of CBR engine
In the engine model, the intake and exhaust ports are the boundaries of the model, and the boundary conditions are all set to standard atmospheric temperature and pressure (298 K and 100 kPa, respectively) [8]. The fuel injector flow rate in the fuel injection parameters is 8.28 g/s as measured through experiments. The air–fuel ratio is set to 12.936 for the power mixture when the coefficient is Φa = 0.88. The Wiebe combustion model is used to simulate combustion with the heat release law, and the ignition advance angle refers to the ignition MAP in Motec M84. This model only investigates the influence of the resonance chamber volume and intake manifold size as single variables, and other electronic control parameters of the engine remain unchanged. An engine performance test was conducted to verify the accuracy of the model and complete the measurement of engine characteristics.
3.3 Design of Engine Performance Experiment with Limited Flow Intake
The intake system with a restrictor valve shown in Fig. 3 is manufactured and equipped on the CBR engine for engine. The performance experiment is shown in Fig. 5. A total of 27 operating points were measured in the experiment when the throttle was fully opened (the engine speed was increased from 2000 rpm to 15,000 rpm each time by 500 rpm). The experimental and simulation data are shown in Fig. 6.
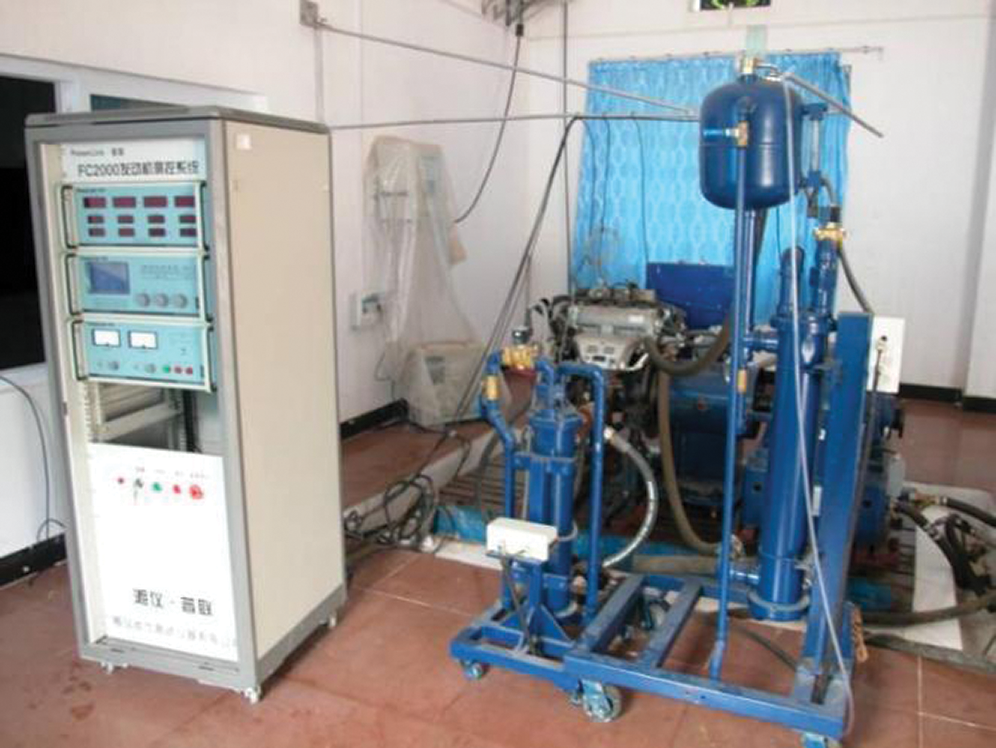
Figure 5: Test equipment of engine performance
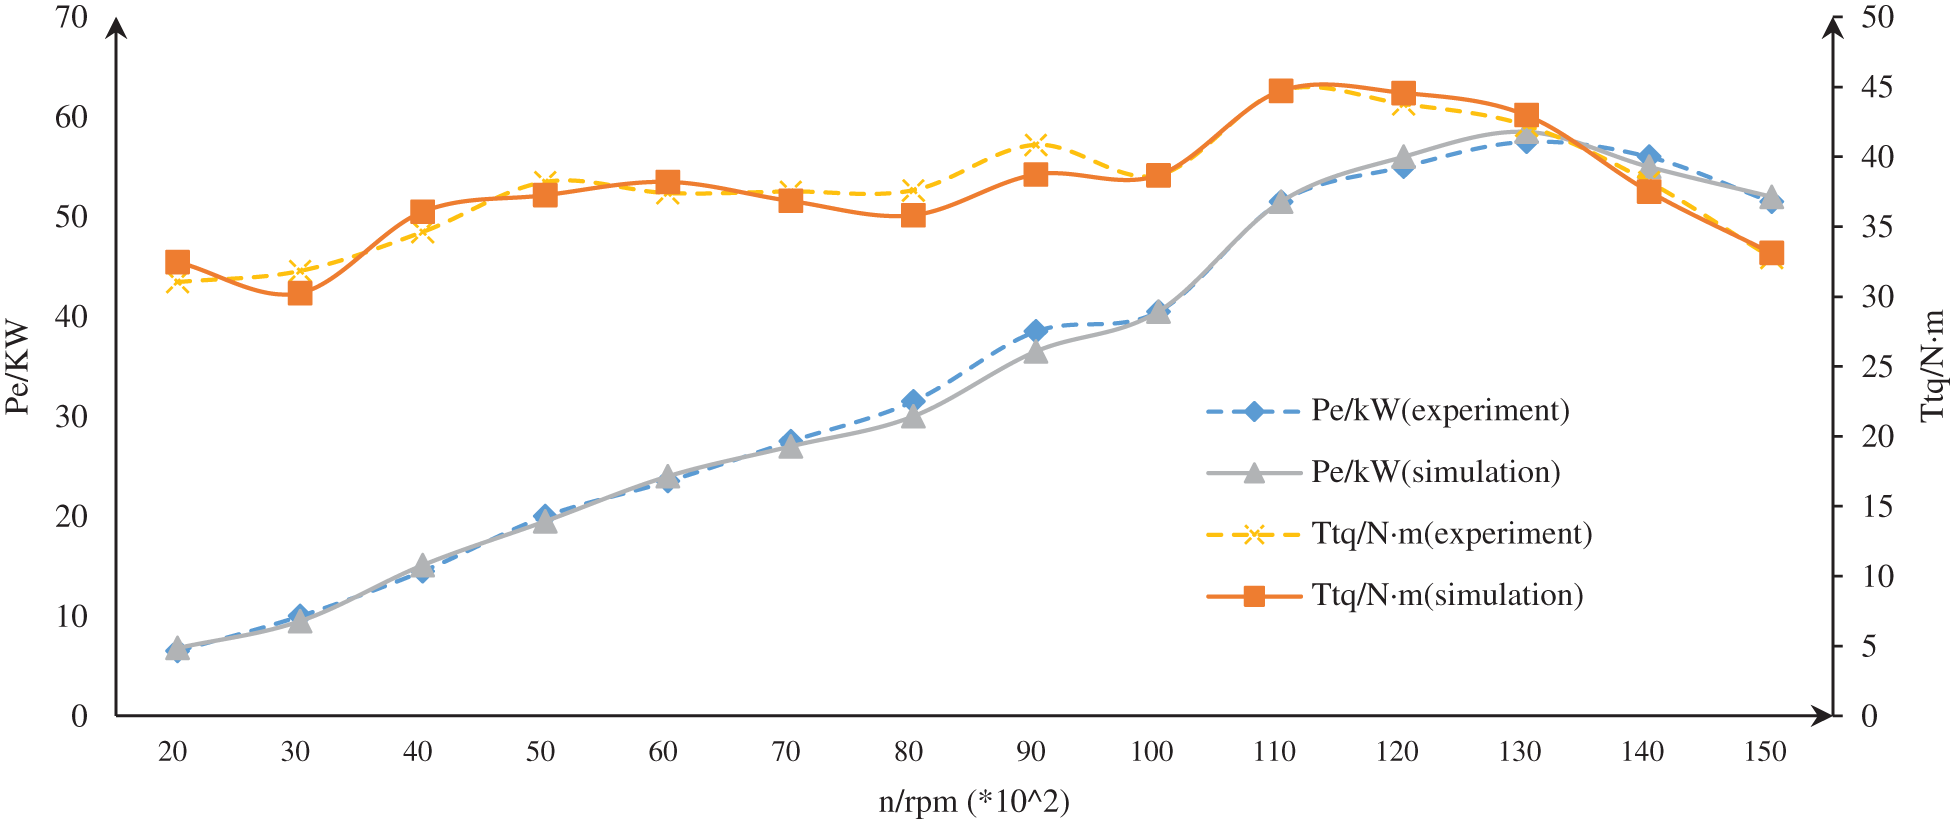
Figure 6: Comparative analysis diagram of experiment and simulation
The curve of the above figure reveals that the analysis results of the simulation model and the external characteristic data of the bench test can be compared and analysed. Comparing the torque and power of all other corresponding operating conditions, the maximum error is approximately 4.8%, which is lower than the 5% error range required by the project. Therefore, the GT-Power model simulation modelling is reasonable, and the analysis results demonstrate a certain degree of credibility.
4 Comparative Analysis of Simulation Models
4.1 Volume Change Influence of Resonance Chamber
The analysis of the influence of resonance chamber volume change on the dynamic performance of the engine is also studied by taking the full load characteristic simulation as a research method. When the volume of the resonance chamber is taken as a single variable, the length of the intake manifold is 95 mm to maintain a constant, and the variable is set at four to seven times the engine displacement, that is, the volume of the resonance chamber is 2.4, 3.0, 3.6 and 4.2 L. The torque (Ttq)–speed (n) and power (Pe)–speed (n) curves obtained by model simulation are respectively shown in Figs. 7 and 8.
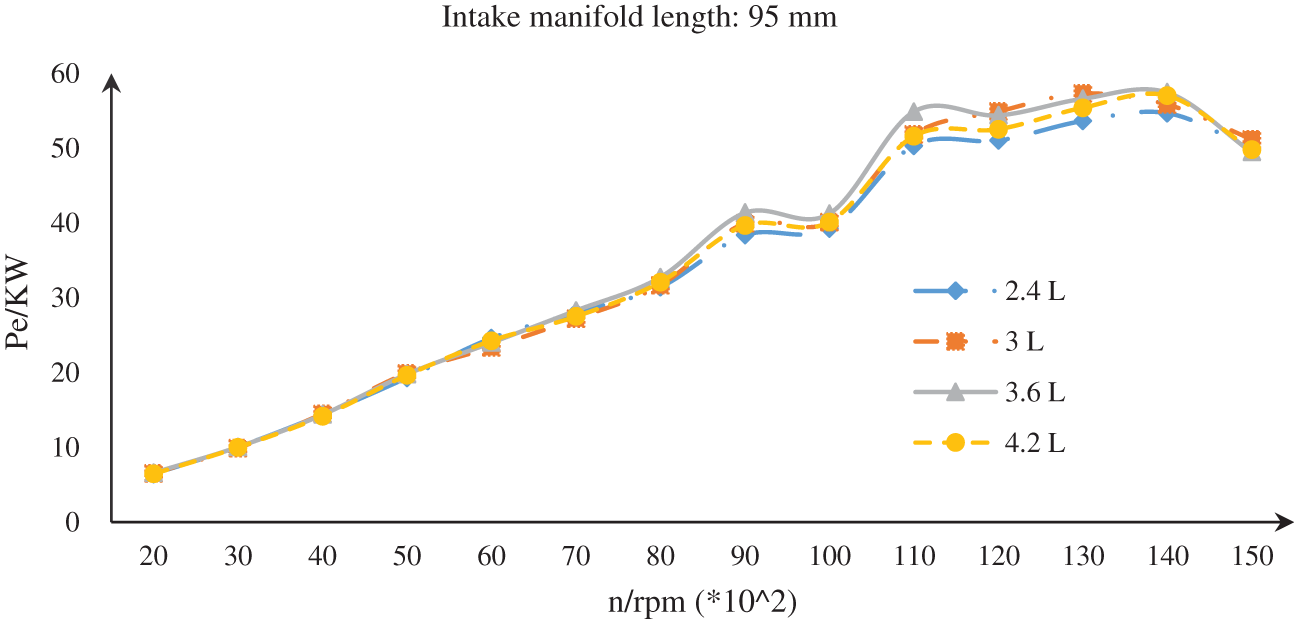
Figure 7: Characteristic curve of Pe–n under different resonance chamber volumes
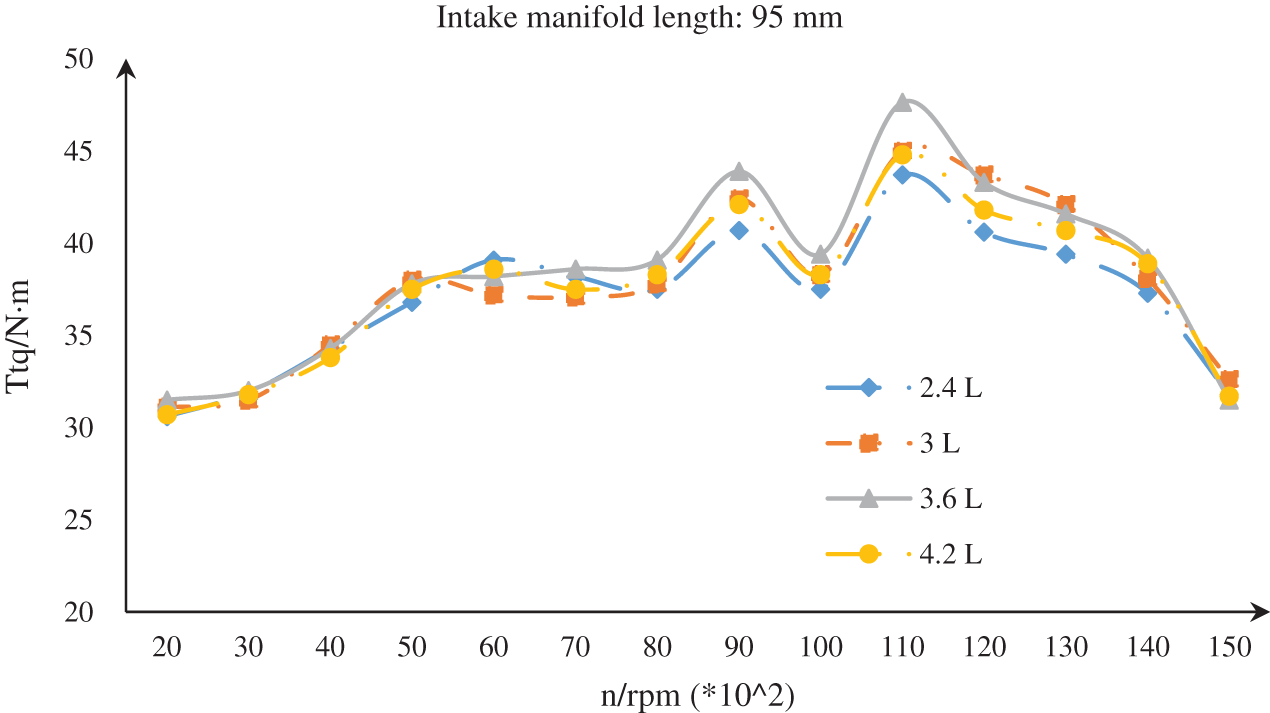
Figure 8: Characteristic curve of Ttq–n under different resonance chamber volumes
4.2 Influence of the Intake Manifold Length
Assuming that the length of the intake manifold is 95 mm and kept as a fixed constant, the length of 20 mm is set as the gradient of change, and the main analysis manifold length parameters are 55, 75, 115 and 135 mm. The analysis results from intake manifold length variation of the engine under full load are used to examine the law of its influence on engine power. When the length of the intake manifold is taken as a single variable, the volume of the resonance chamber remains unchanged at 3 L, and the change curve is obtained as shown in Figs. 9 and 10.
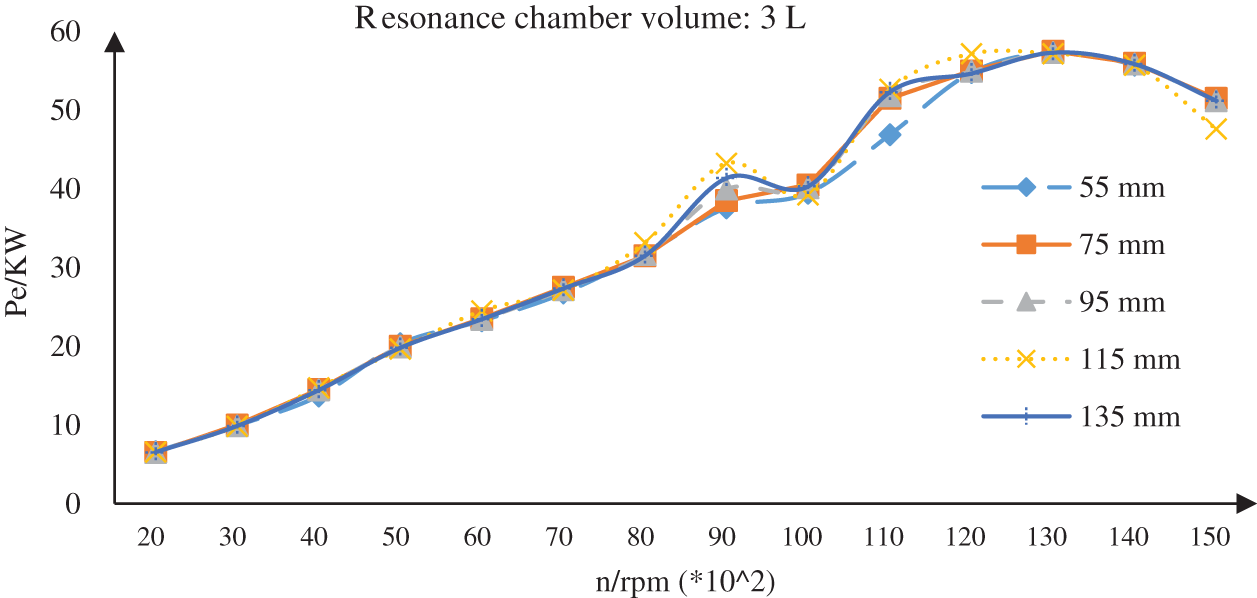
Figure 9: Characteristic curve of Pe–n under different intake manifold lengths
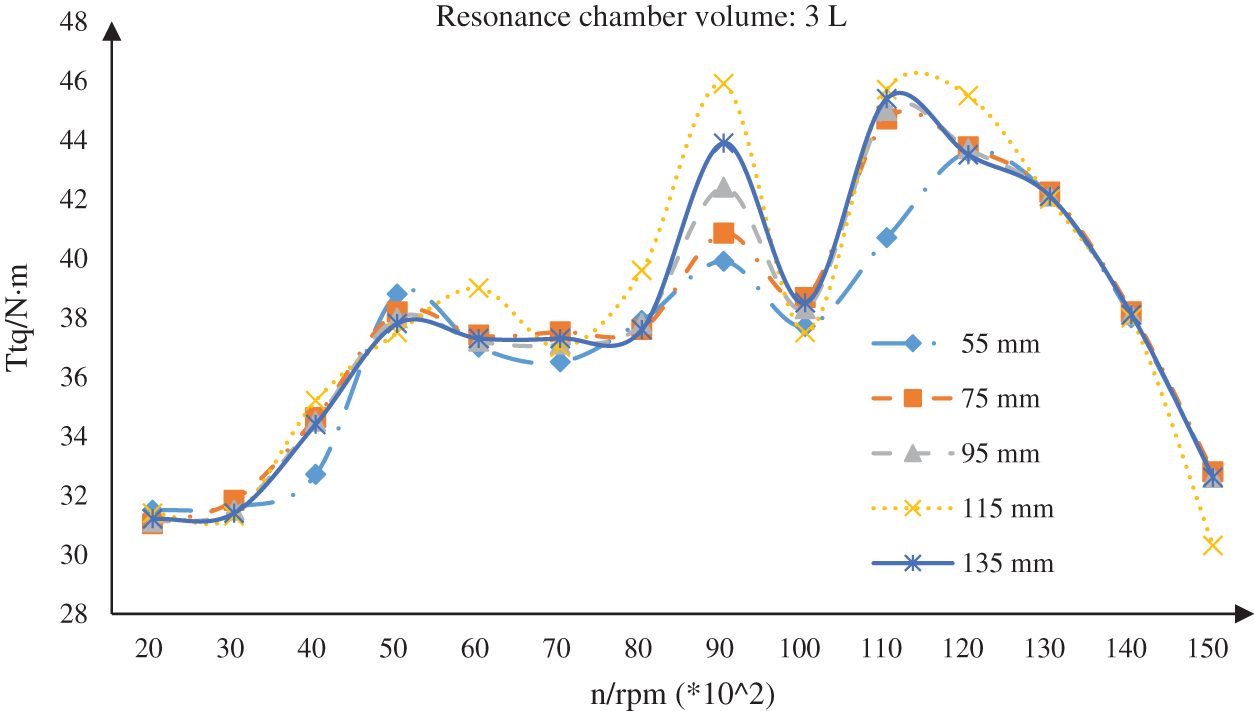
Figure 10: Characteristic curve of Ttq–n under different intake manifold lengths
4.3 Final Design Plan of the Restricted Air Intake System
The analysis in Figs. 7–10 revealed the following four comparison schemes as shown in Tab. 3 to assess the influence of different manifold lengths and resonant chamber volumes on power torque effectively.
Table 3: Comparison table of different manifold lengths and resonance chamber volumes
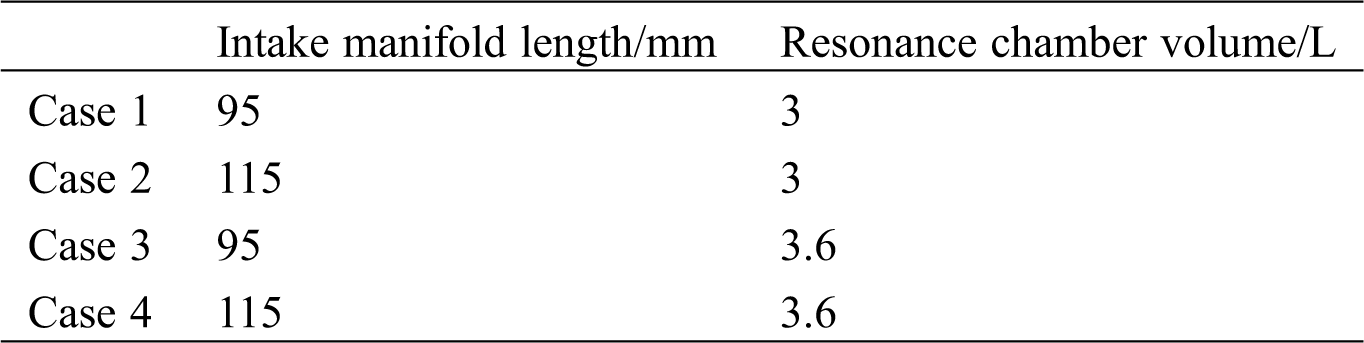
The data of Pe–n and Ttq–n are sorted into characteristic curves according to the case requirements in the above representation, as shown in Figs. 11 and 12.
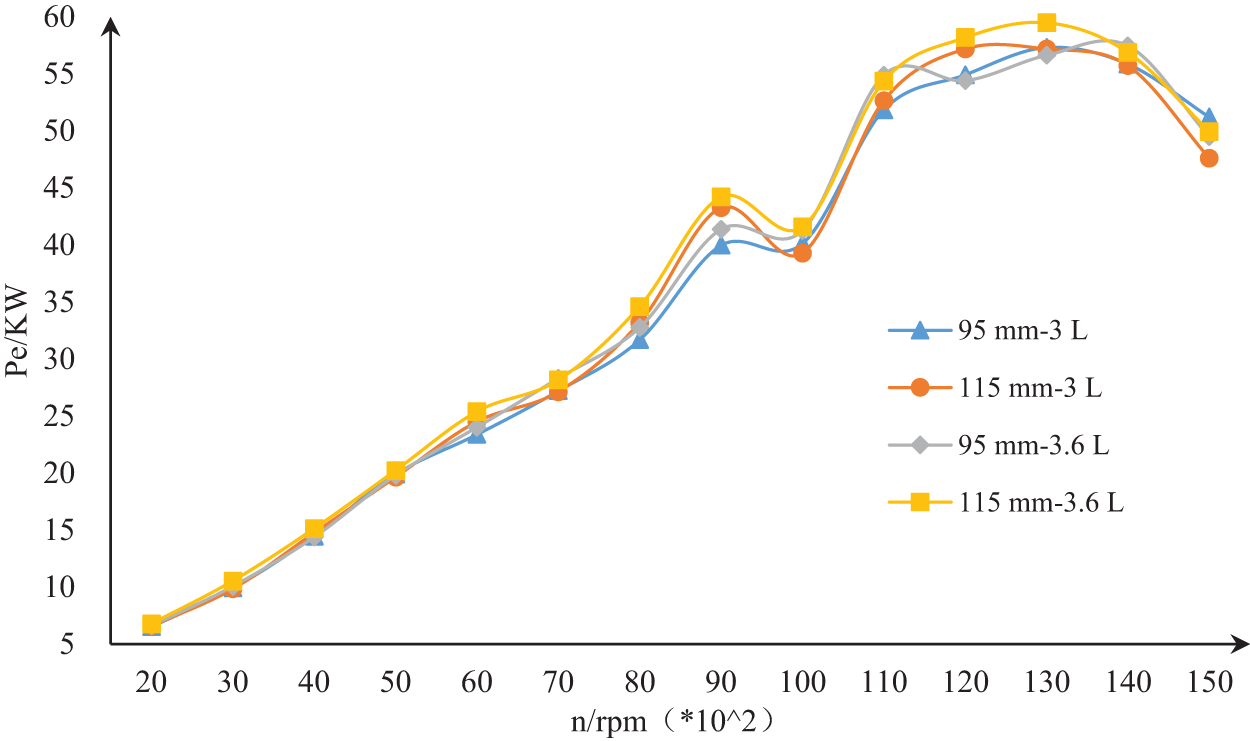
Figure 11: Pe–n characteristic curves of different cases
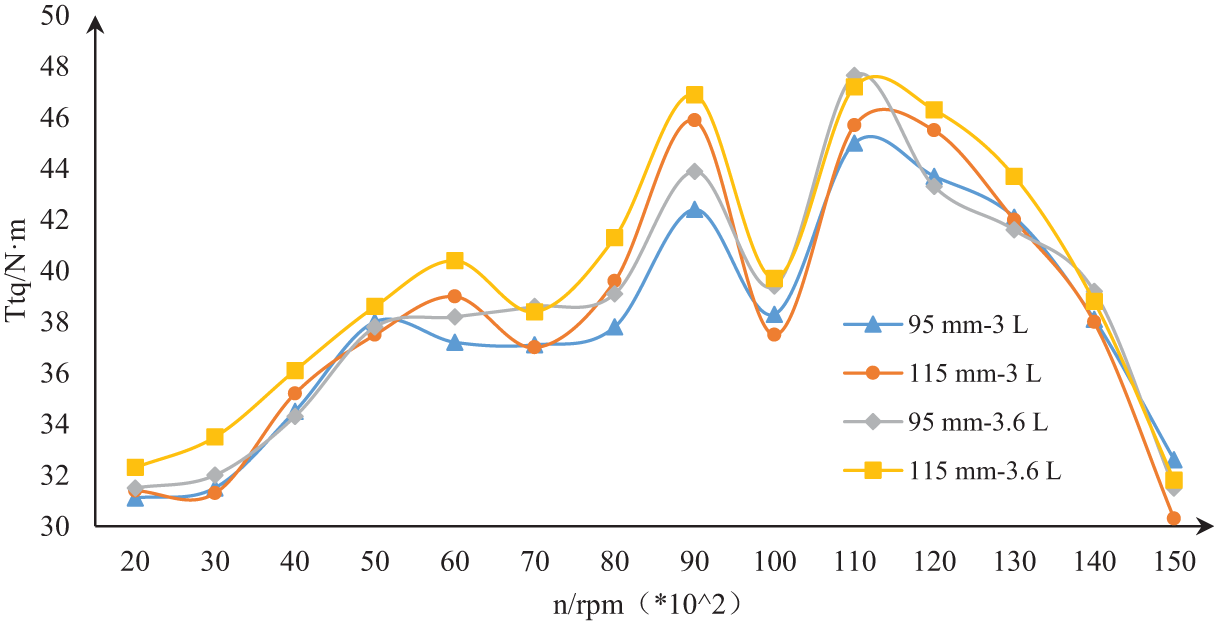
Figure 12: Ttq–n characteristic curves of different cases
Considering the overall layout design of the vehicle, the above analysis results indicate that the optimised intake manifold length is set to 115 mm, the volume of the surge tank is 3.6 L and the Pe–n and Ttq–n characteristic curves are shown in Fig. 13. The optimisation results are generally consistent with the simulation analysis results, and the power performance is significantly improved. The maximum engine torque is increased to 46.9 N·m, revealing an increase of 10.6%.
Figure 13: Characteristic diagram of the original and optimised parameters on Pe and Ttq
5 CFD Simulation Analysis of Intake System after Optimisation
5.1 Model of the Optimised Intake System
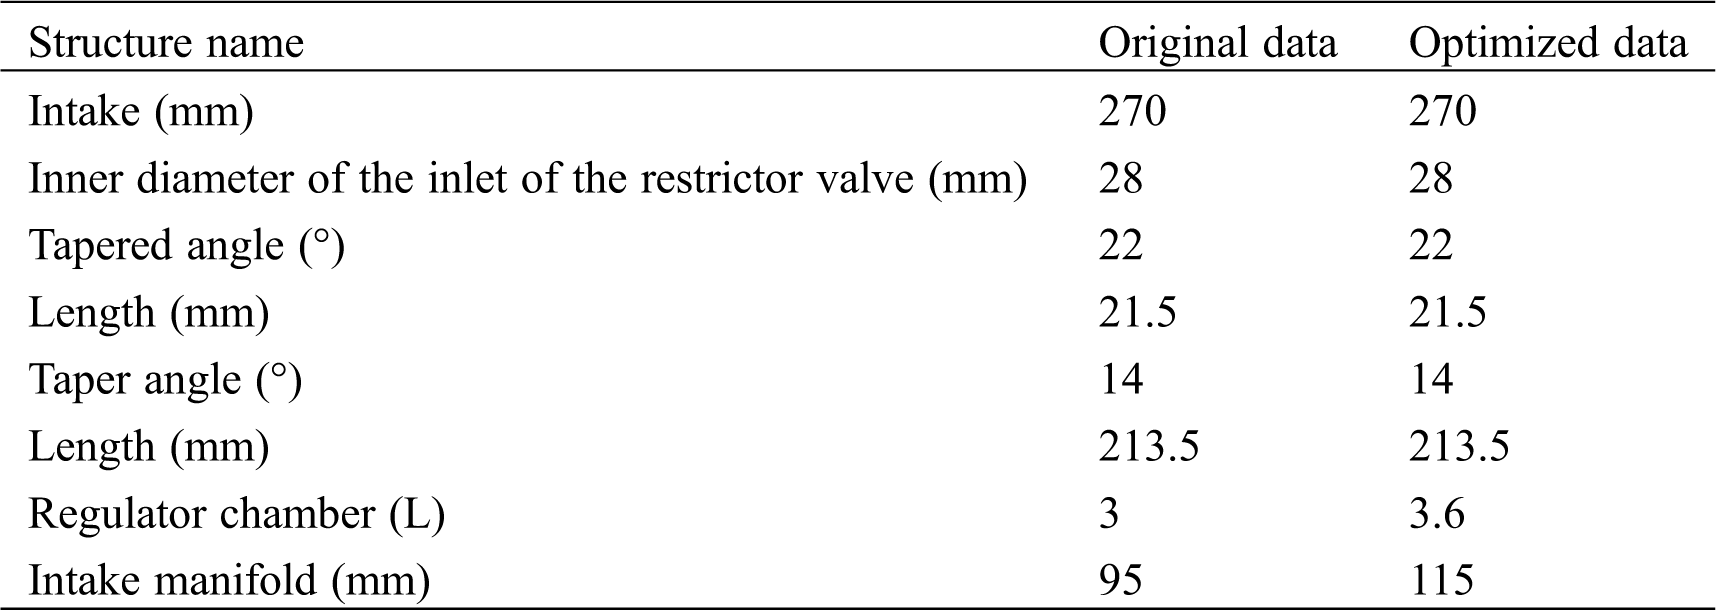
Combined with the previous comparative analysis data, the optimised intake system model is designed using UG as shown in Fig. 14. The comparison between the original and the optimised data is shown in the Tab. 4 below.
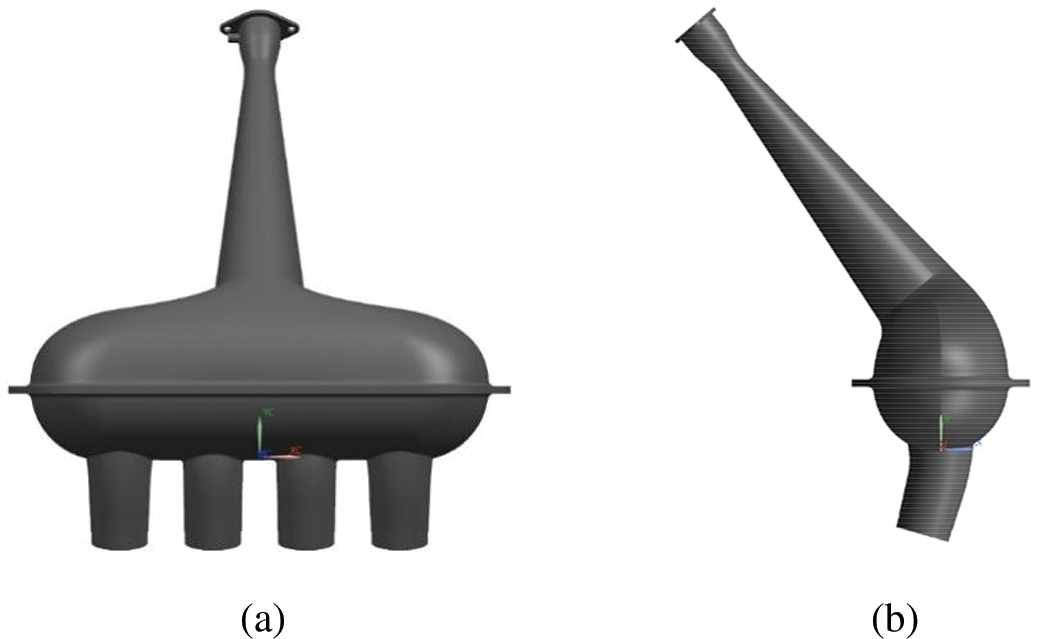
Figure 14: Model of the optimised intake system (a) Front view of restricted flow intake system (b) Side view of restricted air intake system
Table 4: Comparison table of original and optimised data of the intake system
5.2 Flow Field Analysis of the Optimized Intake System
The analysed air is considered to be compressible fluid, and the gas is easily converted from laminar to turbulent flow in the actual intake process. Therefore, the simulation analysis using the turbulence model is performed as the analysis model [9]. The finite element model is completed by using the meshing in CFD software. In order to better fit the complex and irregular boundaries of the intake duct, an unstructured grid is used. The maximum grid cell size at the wall is 2 mm, and the maximum internal flow field grid cell size is 1 mm. After appropriate adjustments, the grid becomes smooth and the grid quality of the entire intake system is above 0.4. The numerical simulation calculation is worked by using the CFD simulation analysis software, the relevant parameters are set as follows: the model adopts the k-ε standard equation, the pressure inlet is used as the inlet boundary condition, the inlet pressure is set to an atmospheric pressure (101,325 Pa), the pressure outlet is used as the outlet boundary condition and the outlet pressure is set to 97,870 Pa. The other walls are the patch wall conditions, and the iteration steps are 200 steps. The calculation process is based on the pressure solver; thus, the SIMPLE algorithm is used [10].
Completing the flow field analysis of the intake limit flow through CFD analysis software is necessary to analyse the airflow movement of the intake system between the original and the optimised intake systems effectively. The velocity cloud and the gas flow diagrams of the intake system before and after optimisation are respectively shown in Figs. 15 and 16.
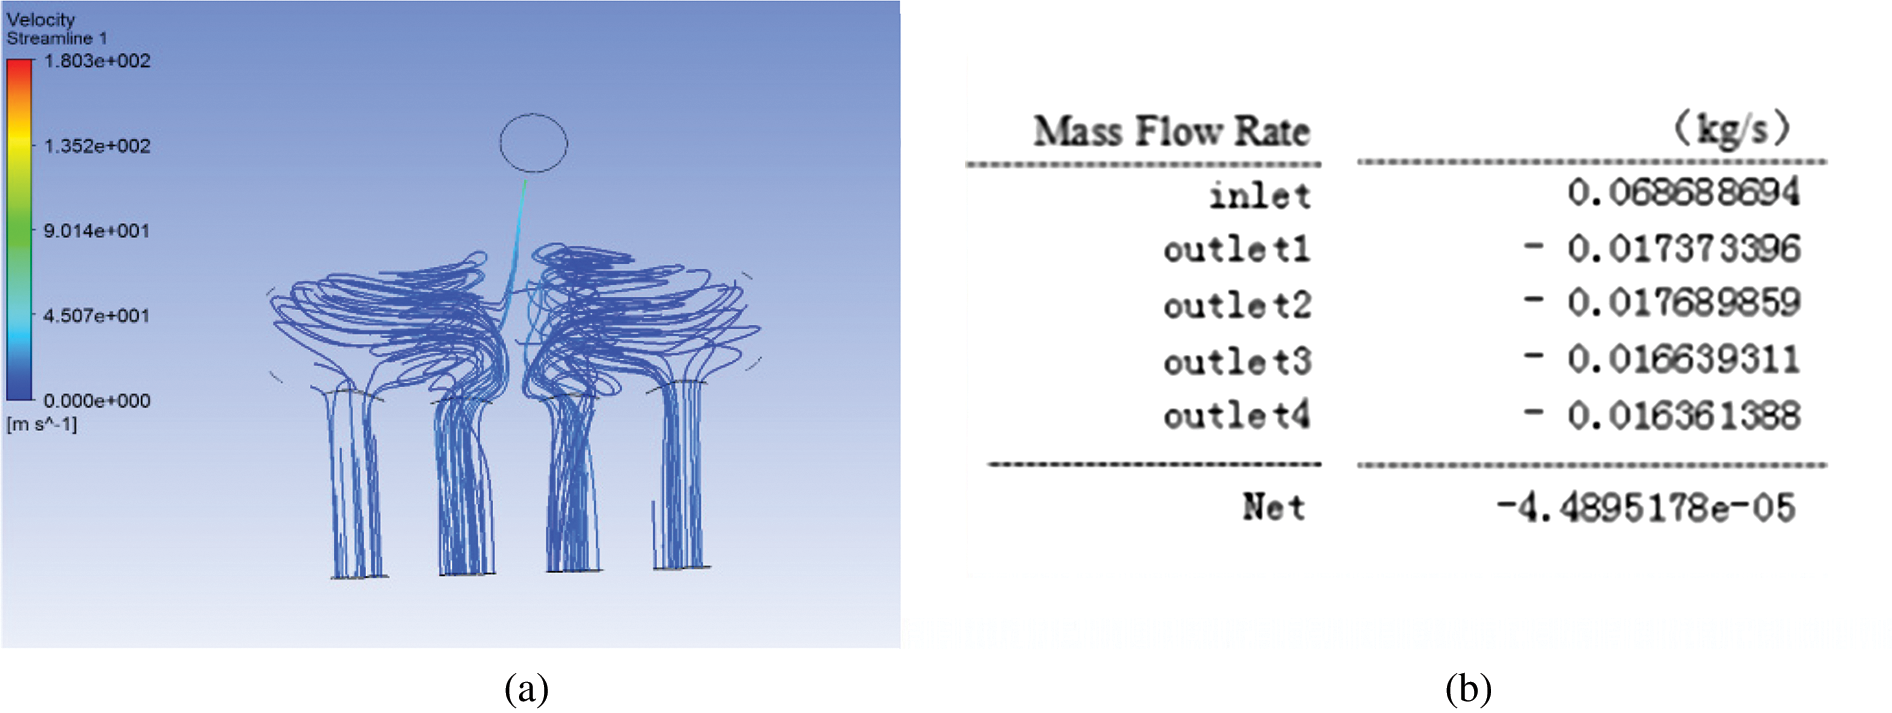
Figure 15: Velocity cloud diagram and mass flow of the original intake system (a) Velocity cloud diagram (b) Mass flow diagram
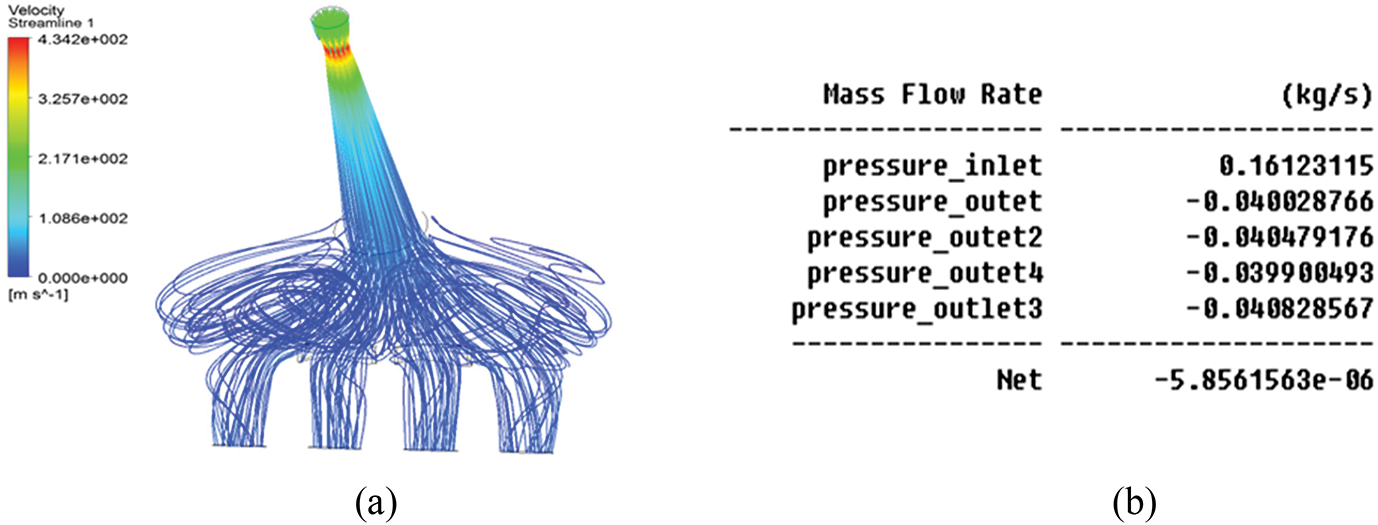
Figure 16: Velocity cloud map and flow data of the optimised intake system (a) Velocity cloud diagram (b) Mass flow diagram
Comparing Figs. 15a and 16a, the streamline of the optimised inlet velocity cloud diagram is relatively stable, and its flow velocity increased from 18.03 m/s to 43.42 m/s. Similarly, comparing Figs. 15b and 16b, the flow rate of the optimised intake manifolds is increased compared with the original under the premise of maintaining uniform intake air. Moreover, the flow rate increased from the original 4.4895 kg/s to 5.8562 kg/s, which shows an increase of 30.44%.
This study takes the intake system of the FSC engine as the research object. A research method combining simulation and experiment is used to analyse the influence of the intake restrictor valve structure on the engine performance to explore the engine performance completely. Using the principle of a single variable, the influence on the engine is analysed by changing the parameters of the intake manifold length and resonance chamber volume, and the following conclusions are obtained.
Increasing the length of the intake manifold when the intake manifold is within 115 mm can improve the engine performance at medium and high speeds. However, the intake resistance is increased when the length of the intake manifold exceeds 115 mm. This phenomenon affects the increase in the intake air volume, which results in a decrease in power torque. The power and torque of the resonance chamber increase with volume, whereas those with volume exceeding 4.2 L relatively decrease to 3.6 L. Combining the analysis results and comparing them with the original intake system, the change form of the external characteristic curve reveals that the maximum torque of the engine increased from the original 42.6 N·m to 46.9 N·m, thus showing an increase of 10.6%.
The paper carries on CFD simulation analysis to the original intake system and the optimized system. By analyzing the velocity vector cloud diagram and mass flow diagram of the original intake model and the optimized intake model, it can be seen that the optimized intake model changes the mass flow from 4.4895 kg/s increased to 5.8562 kg/s, which is an increase of 30.44%. Therefore, the analysis method that combines experiment and simulation has certain promotion and helpful significance for research on engine performance optimization.
Funding Statement: This works was financially supported by Guangxi colleges and universities young and middle-aged teachers basic ability improvement project, which is called “Optimization Analysis of Gasoline Engine Performance Based on the Inlet Throttle for FSC Intake System” (No. 2018KY0654).
Conflicts of Interest: The authors declare that they have no conflicts of interest to report regarding the present study.
1. Zhang, J., Lv, X., Lv, Y. (2021). Research on vehicle control strategy and hardware in loop for pure electric FSAE vehicle. Journal of Physics, 1732(1), 012172. [Google Scholar]
2. Du, J., Wu, X., Li, R., Cheng, R. (2019). Numerical simulation and optimization of mid-temperature heat pipe exchanger. Fluid Dynamics & Materials Processing, 15(1), 77–87. DOI 10.32604/fdmp.2019.05949. [Google Scholar] [CrossRef]
3. Chandekar, A. C., Debnath, B. K. (2020). Effect of intake manifold design on the mixing of air and bio-CNG in a port-injected dual fuel diesel engine. Journal of Thermal Analysis and Calorimetry, 141(2), 2295–2309. DOI 10.1007/s10973-020-09591-1. [Google Scholar] [CrossRef]
4. Ilardo, R., Williams, C. B. (2010). Design and manufacture of a formula SAE intake system using fused deposition modeling and fiber-reinforced composite materials. Rapid Prototyping Journal, 16(3), 174–179. DOI 10.1108/13552541011034834. [Google Scholar] [CrossRef]
5. Ryad, C., Sadaoui, D., Sahi, A., Mouloud, S. (2019). Numerical simulation of double diffusive mixed convection in a horizontal annulus with finned inner cylinder. Fluid Dynamics & Materials Processing, 15(2), 153–169. DOI 10.32604/fdmp.2019.04294. [Google Scholar] [CrossRef]
6. Chandekar, A. C., Debnath, B. K. (2020). Effect of intake manifold design on the mixing of air and bio-CNG in a port-injected dual fuel diesel engine. Journal of Thermal Analysis and Calorimetry, 141(2), 2295–2309. DOI 10.1007/s10973-020-09591-1. [Google Scholar] [CrossRef]
7. García, A., Monsalve-Serrano, J., Sari, R., Dimitrakopoulos, N., Tunér, M. et al. (2019). Performance and emissions of a series hybrid vehicle powered by a gasoline partially premixed combustion engine. Applied Thermal Engineering, 150(1), 564–575. DOI 10.1016/j.applthermaleng.2019.01.035. [Google Scholar] [CrossRef]
8. Chen, Y., Xu, Z., Deng, B., Hou, K., Fu, J. (2020). Effects of intake fluctuation and chemical reaction on operating stability of a small displacement gasoline engine: An experimental and numerical study. Fuel, 277(1), 118189. DOI 10.1016/j.fuel.2020.118189. [Google Scholar] [CrossRef]
9. Liu, S., Zhang, Y. (2020). Research on the integrated intercooler intake system of turbocharged diesel engine. International Journal of Automotive Technology, 21(2), 339–349. DOI 10.1007/s12239-020-0032-9. [Google Scholar] [CrossRef]
10. Sun, K., Li, D., Liu, H., Bai, S. (2020). Influence of diesel engine intake throttle and late post injection process on the rise of temperature in the diesel oxidation catalyst. Fluid Dynamics & Materials Processing, 16(3), 573–584. DOI 10.32604/fdmp.2020.09591. [Google Scholar] [CrossRef]
 | This work is licensed under a Creative Commons Attribution 4.0 International License, which permits unrestricted use, distribution, and reproduction in any medium, provided the original work is properly cited. |