Materials Processing
| Fluid Dynamics & Materials Processing |
DOI: 10.32604/fdmp.2021.013425
ARTICLE
Thermal Analysis of a Novel Oil Cooled Piston Using a Fluid-Solid Interaction Method
1State Key Laboratory of Engine Reliability, Weifang, 261061, China
2Weichai Power Co., Ltd., Weifang, 261061, China
3School of Energy and Power Engineering, Shandong University, Jinan, 250061, China
*Corresponding Author: Yuping Hu. Email: huyp@sdu.edu.cn
Received: 06 August 2020; Accepted: 06 February 2021
Abstract: Thermal load has a vital influence on the normal operation and service life of diesel engines. In this study, the thermal load and oil-cooling effect on diesel engine pistons were investigated by means of computational fluid dynamics. In particular, the flow and heat transfer characteristics of the cooling gallery were determined during the oscillation of the piston. Moreover, the temperature field distribution of the piston with and without the cooling gallery were compared. The results revealed that the cooling gallery has a prominent effect on reducing the thermal load on the piston crown and piston lands. To fully understand the oscillating heat transfer effect related to the cooling gallery and verify the accuracy of the calculation, the numerical results were also compared with temperature values experimentally measured at key positions of the piston. The measurements were found to be consistent with the calculation results within an acceptable error range, which proves the rationality and accuracy of the mathematical and numerical models used.
Keywords: Diesel engine piston; thermal load; cooling gallery; CFD; oscillating cooling
As the power of internal combustion engines continues to increase, the thermal load on pistons is also getting higher. Consequently, piston cooling has become a very important topic in the internal combustion engine industry. As an efficient method of enhancing heat transfer [1], oscillating cooling has been widely used in most modern diesel pistons [2,3]. Oil-cooled pistons utilize the oscillating cooling method, which can remove a huge amount of heat transferred to the piston by the working of the cooling gallery, thereby greatly reducing the thermal load of the piston [4].
Because the cooling of the piston is affected by many factors, such as the shape of the cooling gallery, the diameter of the nozzle hole, and the engine speed [5–8], performing experiment research can entail considerable expenses in terms of labor and hardware resources, as well as take a very long time, slowing the progress of product development. With the development of computer technology, numerical simulation calculations have become a common tool to provide guidance and reference for design and experiments [9–11].
In the past, for calculating the temperature field of a piston with a cooling gallery, empirical formulas were mostly used for the heat transfer coefficient of the cooling gallery surface. However, in the actual cooling process, the heat transfer coefficient of the cooling gallery surface varies with the movement of the piston, and the distribution is extremely uneven [12–15]. Therefore, if only an empirical formula is used to calculate the convective heat transfer coefficient of the cooling gallery in the piston, the calculated temperature field may be quite different from the actual one. As such, the heat transfer coefficient and the temperature of the cooling gallery in the piston were averaged in time and space. The averaged heat transfer coefficient and boundary temperature were used as the third boundary conditions for the calculation of the piston temperature field [16]. However, a spatial average of different areas of the cooling gallery cannot accurately explain the heat exchange conditions at a specific location of the cooling gallery.
The dynamic mesh method and the volume of fluid (VOF) method are now widely used in computational fluid dynamics (CFD) calculations [17–19]. This study uses the Fluent dynamic mesh method and the VOF multiflow model to perform transient simulations on the oscillating cooling of a diesel piston, and the flow and heat transfer of the cooling oil can be obtained when the piston is located at different positions. Meanwhile, the transient heat transfer coefficient of the cooling gallery is extracted as a time average value, and it is projected onto the finite element of the piston as the heat transfer boundary condition to determine the temperature inside the solid parts. Finally, the temperature is measured by thermocouples at key positions of this piston, and the oscillating heat transfer effect of the cooling gallery is validated using test data. Fig. 1 shows a flow-process diagram of the fluid–solid interaction method used in this study.
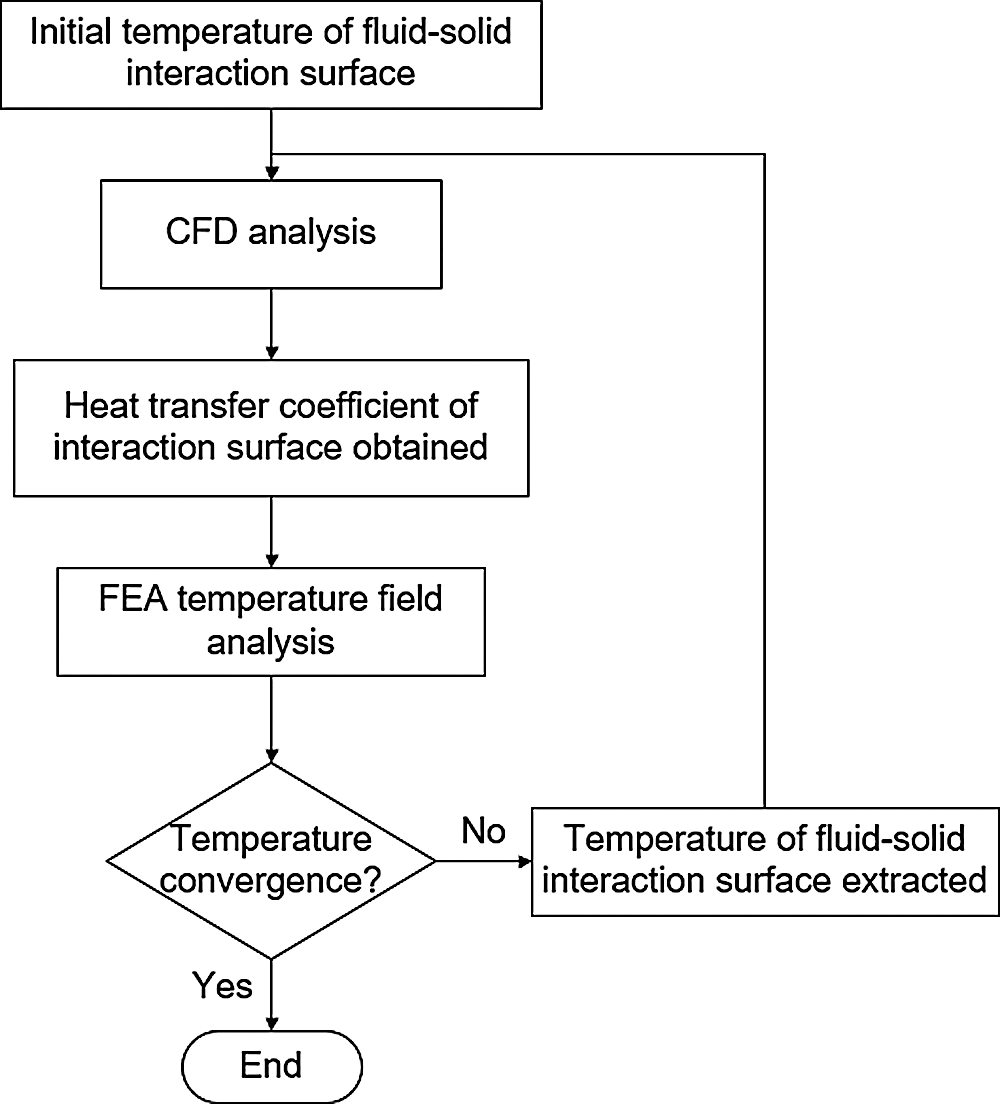
Figure 1: Flow-process diagram of the fluid–solid interaction method
2 Implementation of the Calculation Model
2.1 Geometric Model and Meshing
Fig. 2 shows a schematic of a certain type of diesel engine piston with a cooling gallery using oscillating cooling. Piston oscillating cooling means that a cooling gallery is cast in the piston head. Cooling oil is injected at a high speed from an oil injector fixed on the body. The oil is injected into the cooling gallery through the inlet of the cooling gallery, causing oscillation during the movement of the piston to cool the piston [20,21].
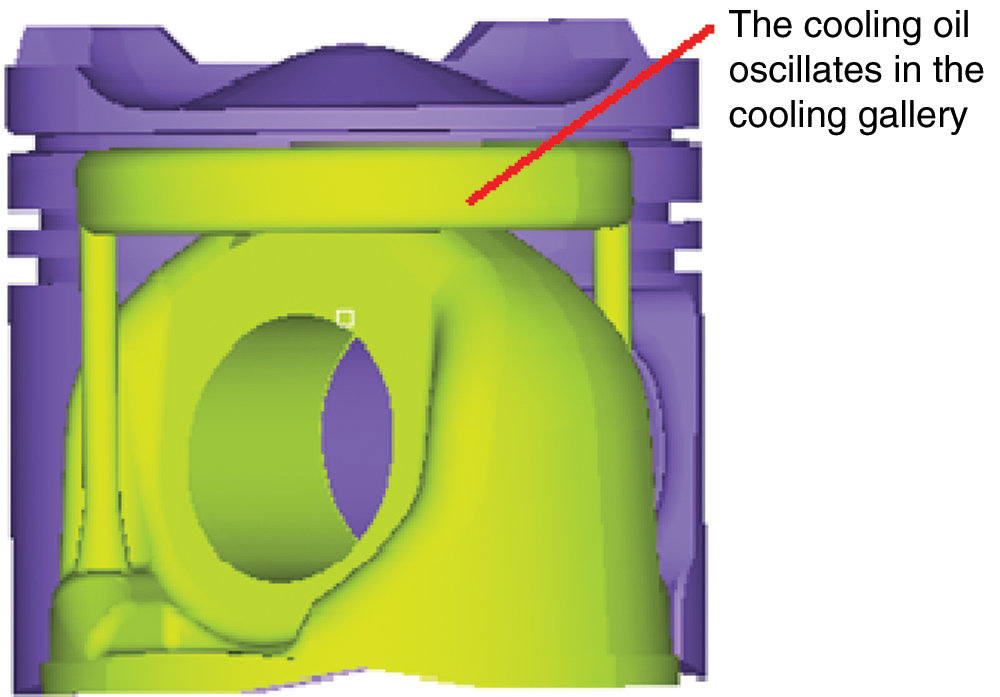
Figure 2: Geometric model of the cooling gallery
To accurately simulate the movement of the piston, the Fluent dynamic mesh method was used in this study for the fuel injection flow field. Fig. 3 shows the mesh of the piston passing through 90° crank angle (CA). To simplify the model and obtain a hexahedral mesh suitable for calculation, the fluid space area below the nozzle was simplified to a cylinder. Because the velocity and temperature near the wall of the cooling gallery may change drastically, the mesh near the wall was refined and the enhanced wall treatment provided in Fluent was used.
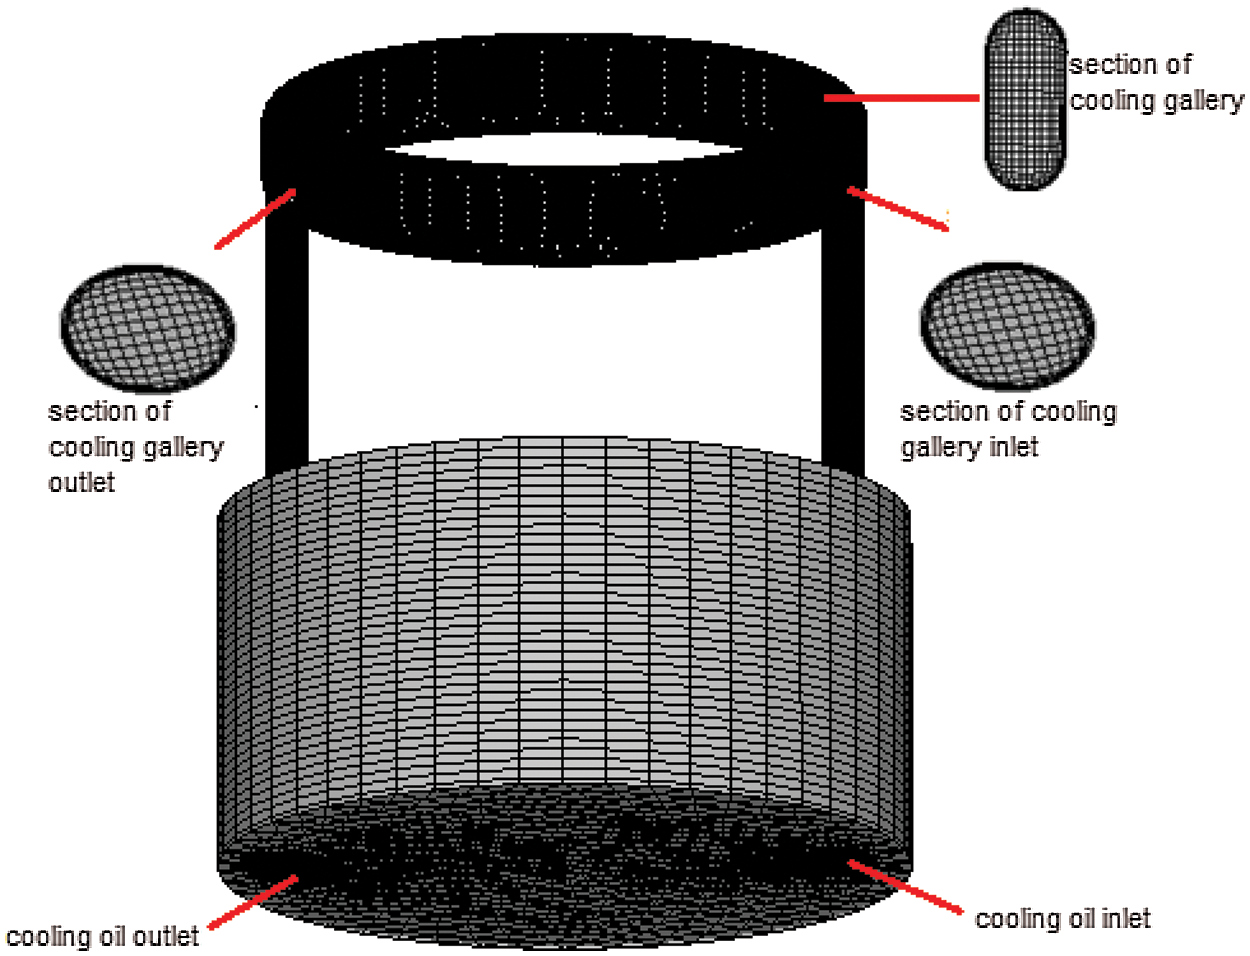
Figure 3: CFD mesh model of a piston at 90° CA
The violent oscillation of the cooling oil in the cooling gallery can enhance heat transfer. Assessing whether the cooling effect of the cooling gallery meets the requirement requires calculation of the piston temperature field [22–24]. The mesh was implemented according to the geometrical shape of the piston, as shown in Fig. 4, which is tetrahedral.
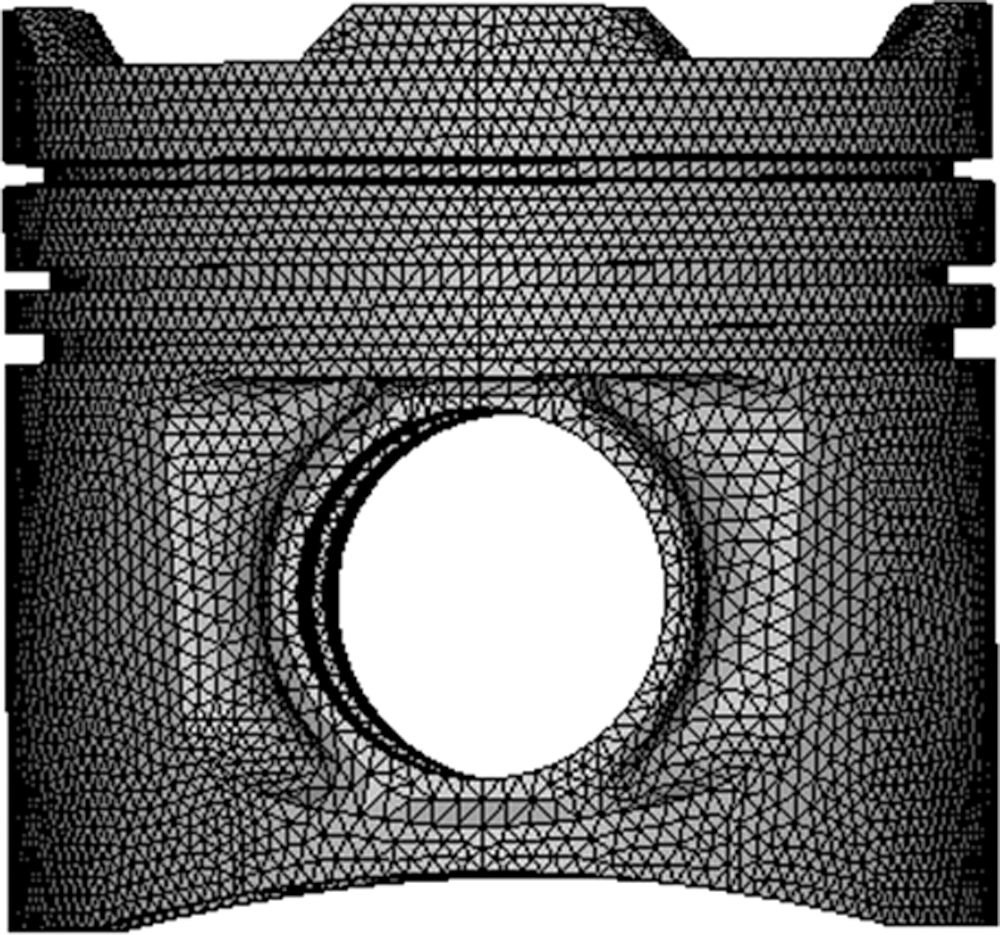
Figure 4: Piston mesh model
2.2 CFD Method and the VOF Model
Mass, momentum, and energy conservation are the three basic laws that address the problems of flow and heat transfer. The expressions for mass, momentum, and energy conservation, respectively, are as follows:
Mass conservation:
Momentum conservation:
Energy conservation:
where Φ = 2
The multiflow model used in this calculation was the implicit VOF model provided in Fluent, and the discretization model was activated. A clear interface between immiscible liquids can be obtained by using this model. In this model, each phase of the fluid shares a set of momentum equations, and the governing equations are as follows [25]:
where
The volume fraction of each phase of the fluid is calculated in each unit of the flow field and the sum of the volume fractions for all phases is equal to 1. During the piston-cooling process, the air and the cooling oil do not mix with each other. The clear boundary between them is a layered free surface flow. Therefore, the VOF model was used for the calculation in this analysis.
When the turbulence is fully developed, the turbulent stress equation and the turbulent kinetic energy equation can be obtained through the k-ε equations:
where
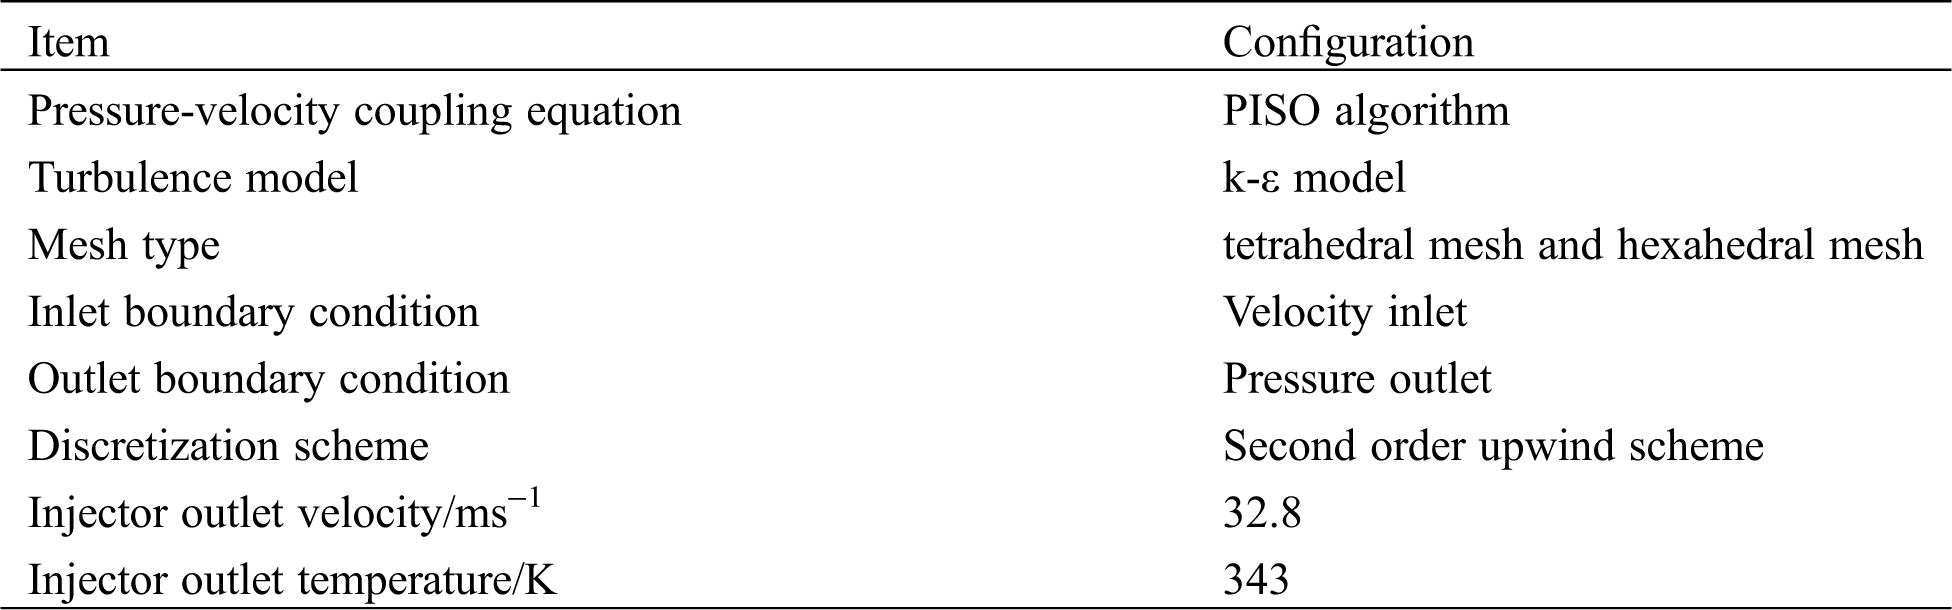
The PISO algorithm was used in the simulation [26]. The time step was confirmed according to the minimum grid size and flow rate. The mathematical models, numerical methods, and boundary conditions are listed in Tab. 1. At the beginning, the calculation area was all an air medium. The thermophysical properties of oil and air were fitted to temperature T because they vary with temperature. The velocity inlet and the pressure outlet were set as the inlet and outlet, respectively, in the simulation. The injector outlet velocity was 32.8 m/s, and the temperature was 343 K. The wall temperature of the cooling gallery can be obtained from the simulation results, as shown in Fig. 5.
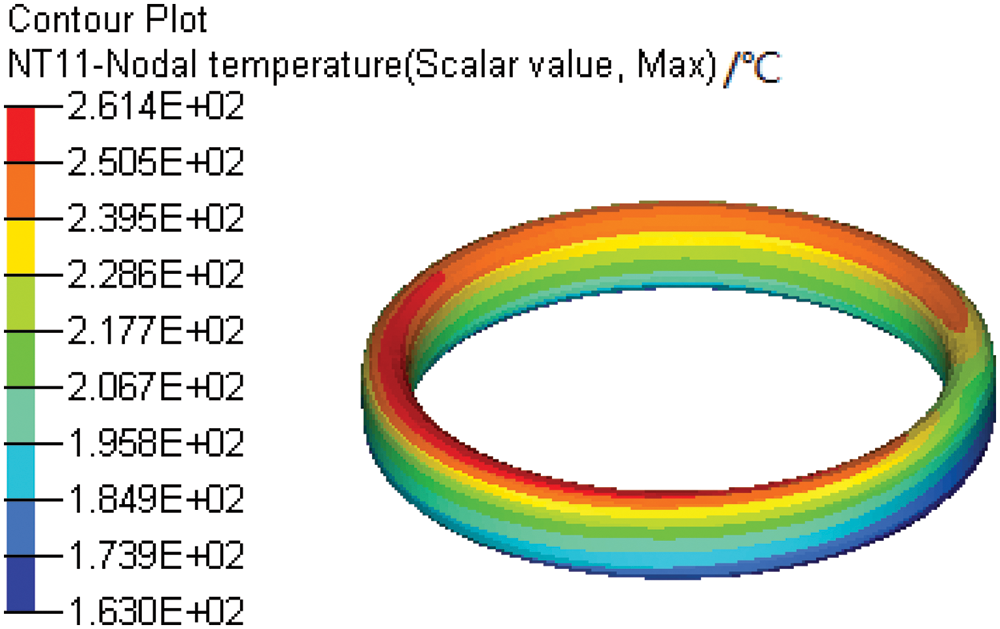
Figure 5: Wall temperature of the cooling gallery
Table 1: The mathematical models, numerical methods and boundary conditions
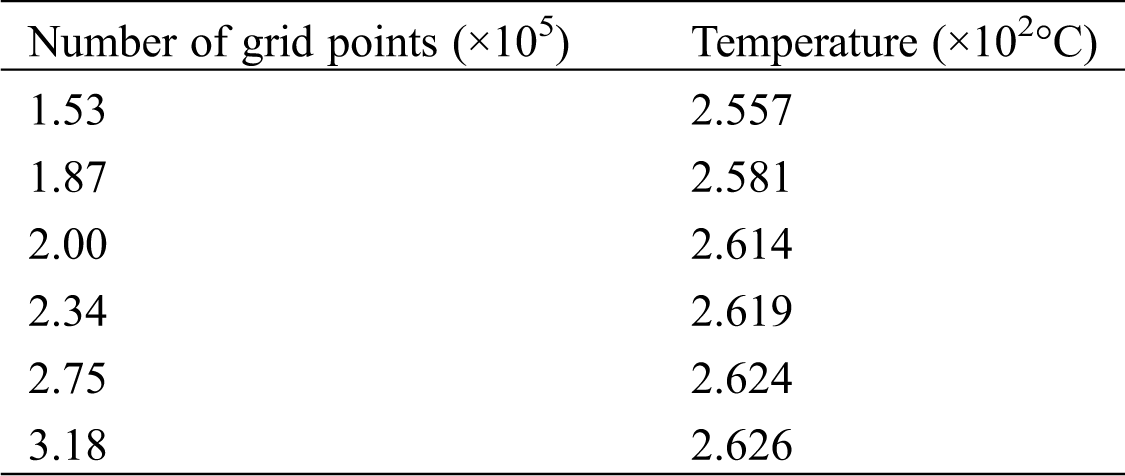
The maximum temperature of the cooling gallery was selected as a physical variable to observe the effect of the change in the number of grid points on the results of the calculation, as given in Tab. 2.
Table 2: Mesh sensitivity analysis
2.3 Boundary Conditions for the Finite Element Calculation
The finite element method was used to determine the temperature field inside the solid parts. Generally, third boundary conditions were used, which means that the temperature and the heat transfer coefficient at the piston boundary are known. The temperature and the equivalent heat transfer coefficient of the piston ring area, the outside of the piston skirt, and the piston cavity were derived from the experiment. The gas side of the piston crown was simulated by using three-dimensional numerical simulation software to simulate the working process in the cylinder. The simulation result of the transient heat transfer of the wall was averaged over a period and then projected to the finite element mesh. The temperature and heat transfer coefficient of the cooling gallery were time-integrated and averaged from the transient calculation of the oil cooling and finally projected to the finite element mesh.
3 Calculation Results and Analysis
3.1 Flow Distribution in the Cooling Gallery
Fig. 6 shows the oil distribution of the cooling gallery at different positions to where the piston moves. When the piston moves from the top dead center (TDC) to the bottom dead center (BDC), the piston accelerates downward at the beginning, and the oil mainly accumulates at the top of the cooling gallery. When the piston passes through the BDC and goes upward, it starts to decelerate and the oil leaves the top of the cooling gallery as a result of inertia. In the same way, when the piston moves from the BDC to the TDC, most of the oil accumulates at the bottom of the cooling gallery during the acceleration period. When the piston moves upward close to the TDC, the oil breaks from the bottom of the cooling gallery to the top as a result of inertia caused by deceleration of the piston, and the flow at the top begins to increase again. In general, the movement of the piston causes the oil to oscillate in the cooling gallery at a high speed, which can greatly enhance heat transfer [27].
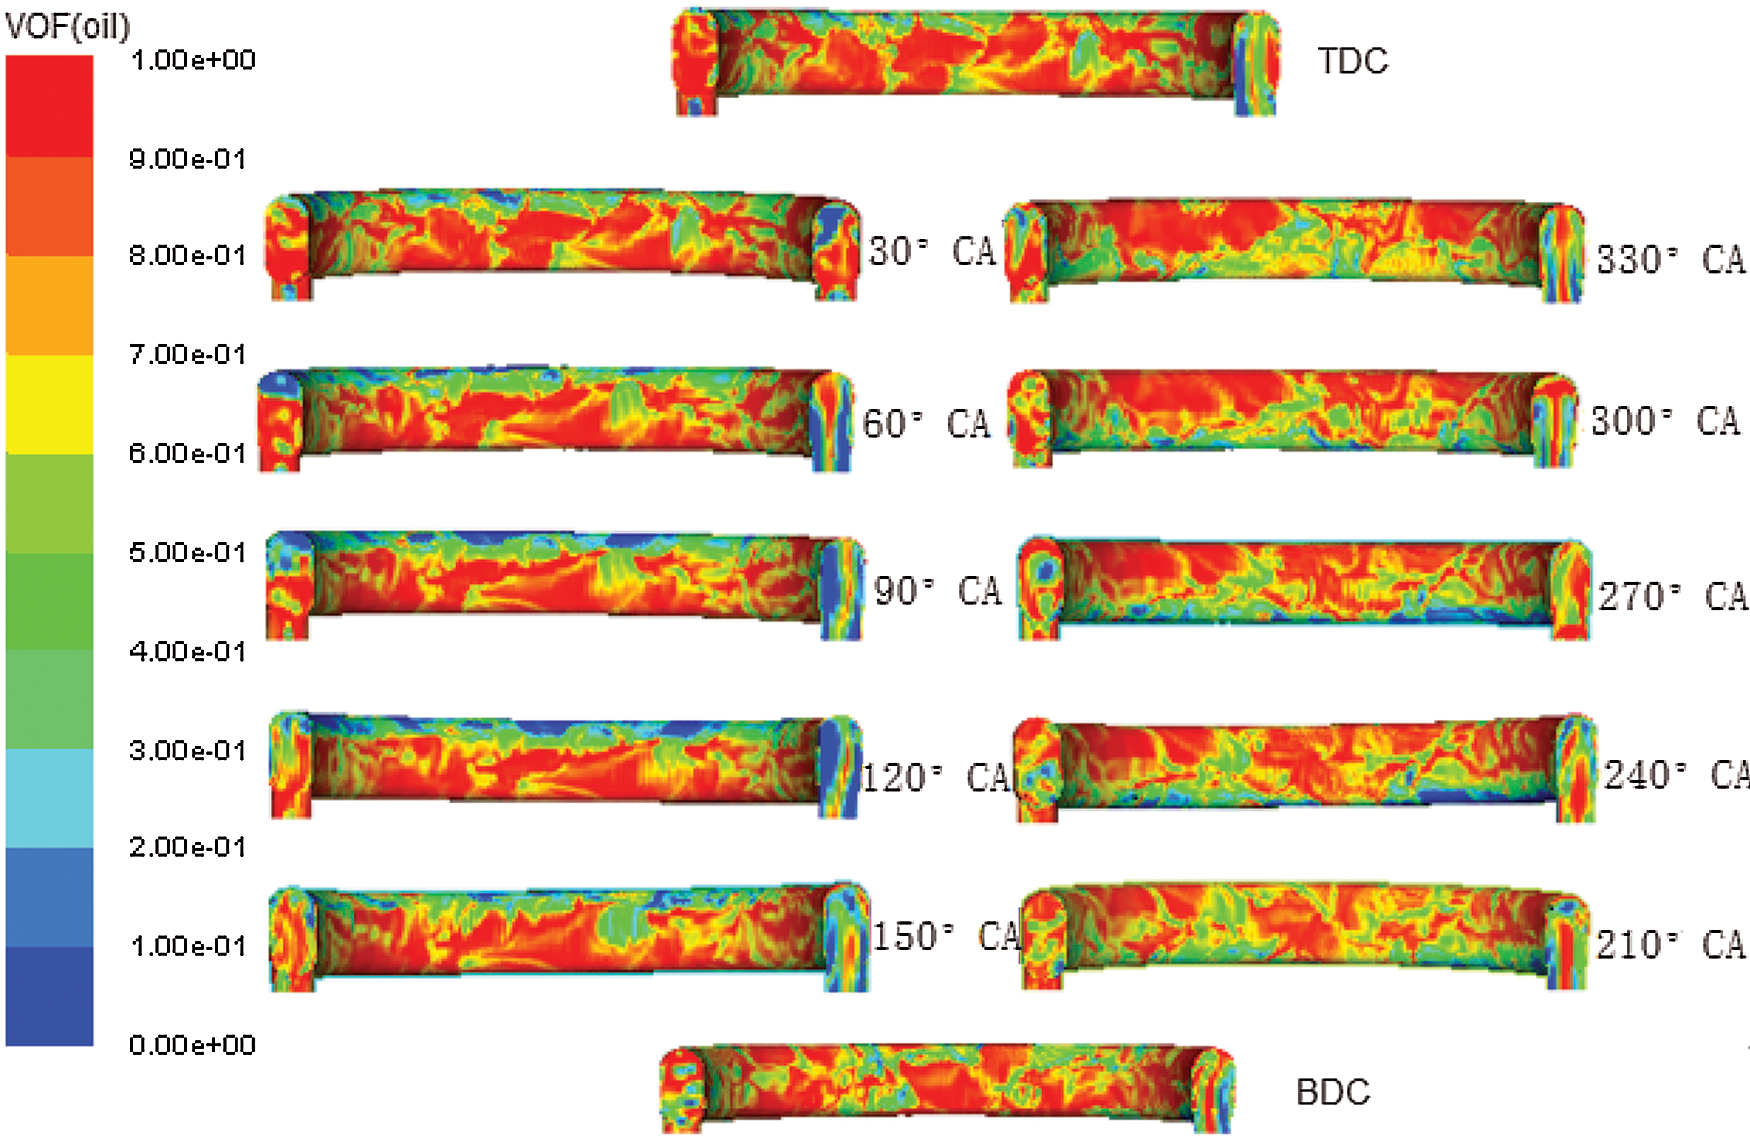
Figure 6: Distribution of oil in the cooling gallery of the piston at different positions
Fig. 7 shows the variation of the oil fill ratio of the cooling gallery as a function of the crank angle. Fig. 8 shows the variation of the oil flow at the inlet and outlet of the cooling gallery and the piston speed as a function of the crank angle. From Figs. 7 and 8, it can be seen that variation of the oil fill ratio is closely linked to the inlet and outlet flow.
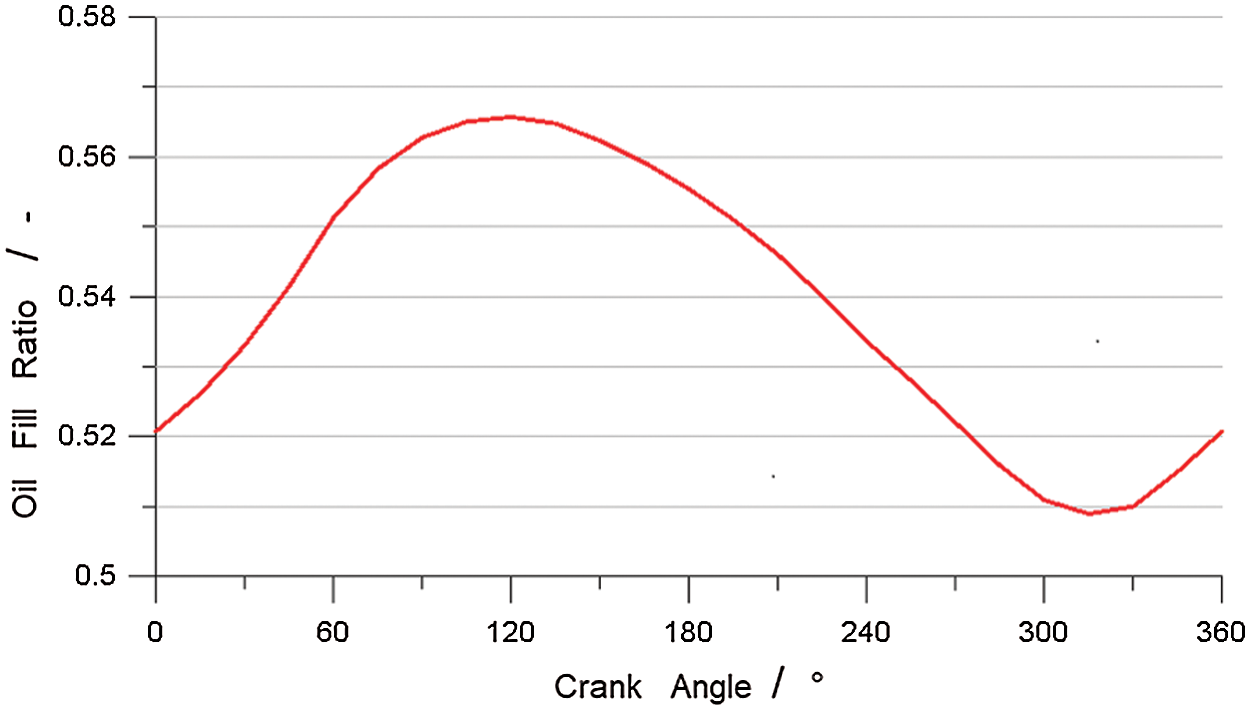
Figure 7: Oil fill ratio of the cooling gallery as a function of the crank angle
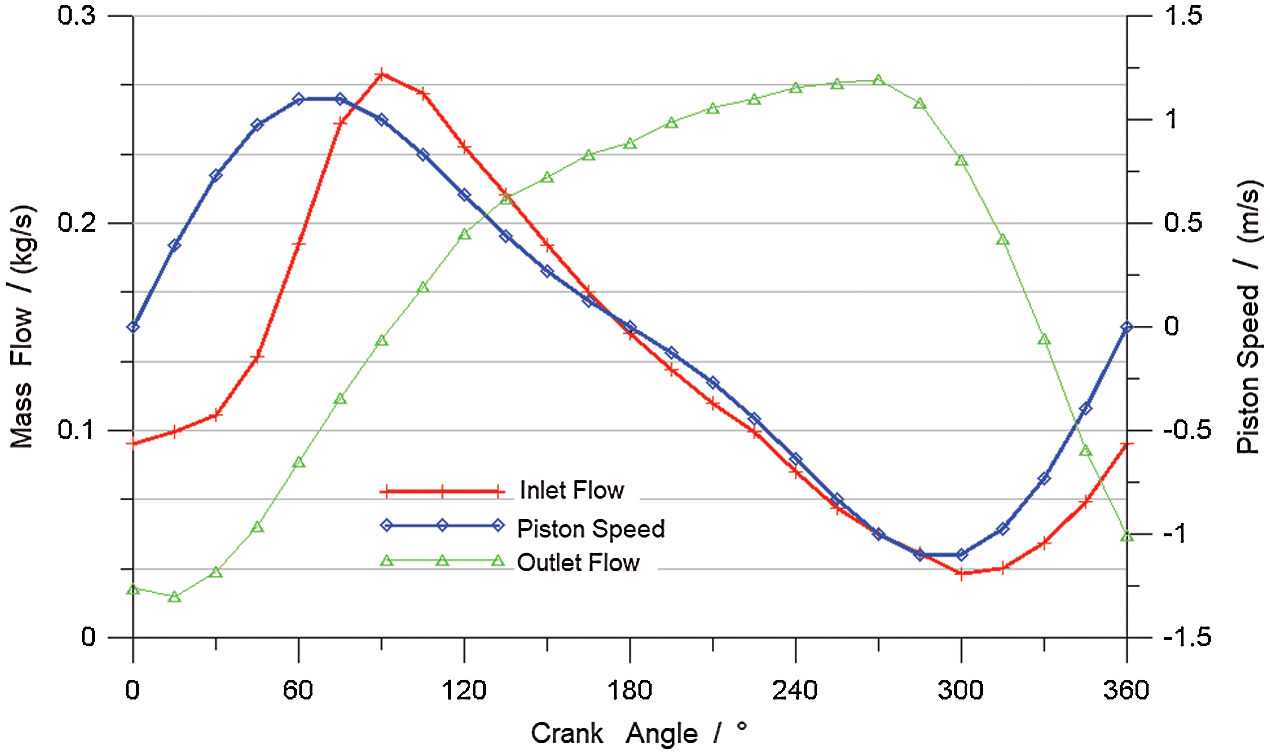
Figure 8: Inlet and outlet oil flow of the cooling gallery and piston speed as functions of the crank angle
During the downward acceleration movement of the piston from the TDC, the relative velocity between the inlet oil and the piston increases. The mass flow of oil flowing in and out of the cooling gallery increases accordingly. Because the oil flowing in the cooling gallery is greater than that flowing out of the cooling gallery, the total amount of retention in the cooling gallery increases. When the piston starts to decelerate, the oil is still accelerating downward as the result of inertia and thus it gathers at the bottom of the cooling gallery. Therefore, the mass flow of oil flowing out of the cooling gallery increases gradually. Near 120° CA, the same amount of oil flows in and out of the cooling gallery. At this time, the oil fill ratio of the cooling gallery reaches its maximum. After 120° CA, the oil flowing out of the cooling gallery is greater than that flowing in, and the oil fill ratio begins to decrease.
After the piston hits the BDC, it begins to accelerate upward. The relative velocity between the inlet oil and the piston decreases, and the mass flow of oil flowing in the cooling gallery decreases accordingly. The oil gathers at the bottom of the cooling gallery, and the mass flow of oil flowing out of the cooling gallery increases, which causes the oil fill ratio to decrease. The oil continues to accelerate upward as the result of inertia as the piston starts to decelerate, and the mass flow of oil flowing in the cooling gallery increases. The same amount of oil flows in and out near 330° CA, and the oil fill ratio at this moment reaches its minimum. After 330° CA, the oil flowing out of the cooling gallery begins to be less than that flowing in, and the oil fill ratio in the cooling gallery begins to increase again.
3.2 Heat Transfer Analysis of the Cooling Gallery
Fig. 9 shows the variation of the average convective heat transfer coefficient of the cooling gallery surface as a function of the crank angle. It can be seen from Figs. 7 and 9 that the trend of the average heat transfer coefficient of the cooling gallery surface in a cycle is similar to that of the oil fill ratio in the cooling gallery, but the former has a lag period. This is because the moving direction of the piston changes at the BDC as the oil hits the wall as the result of inertia. Moreover, the turbulent flow is strengthened, enhancing heat transfer; therefore, the heat transfer coefficient near the BDC is higher [28]. At 120° CA, although the oil fill ratio reaches its maximum, the turbulent flow at this time is weaker compared to that at the BDC; therefore, the heat transfer coefficient is lower than that at the BDC.
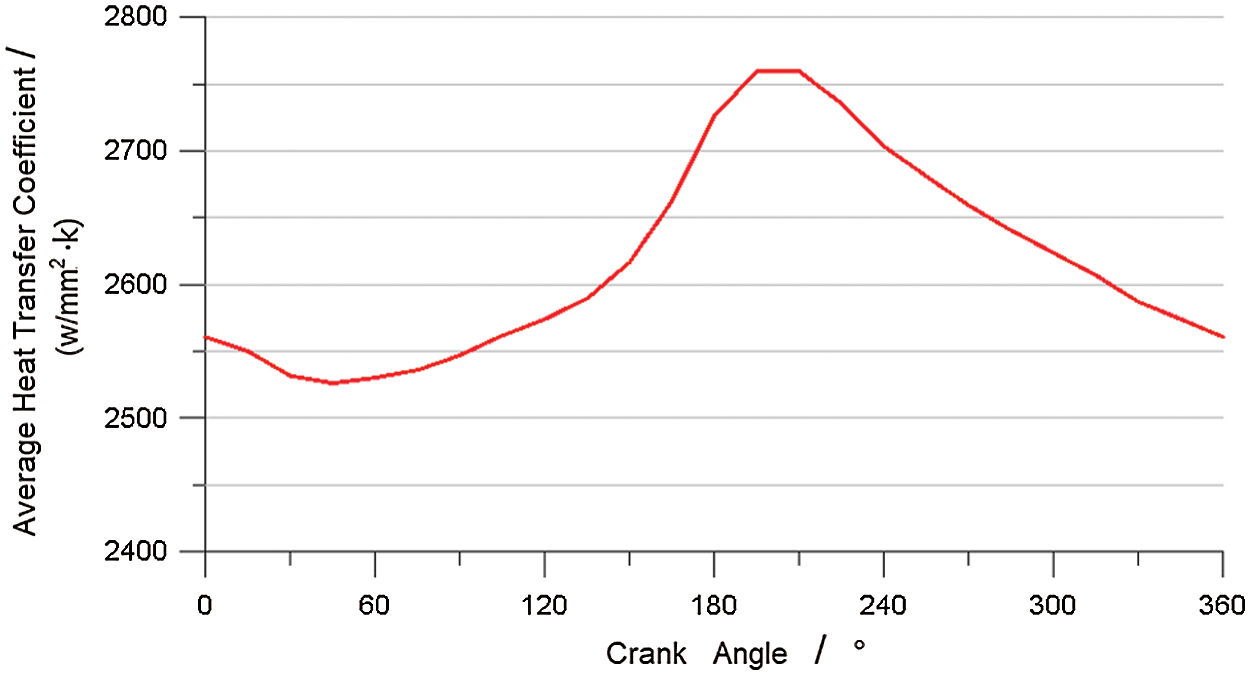
Figure 9: Average convective heat transfer coefficient of the cooling gallery surface as a function of the crank angle
Fig. 10 shows the distribution of the heat transfer coefficient of the cooling gallery surface at different piston positions. For a more intuitive analysis, the surface of the cooling gallery was divided into four areas, as shown in Fig. 11.
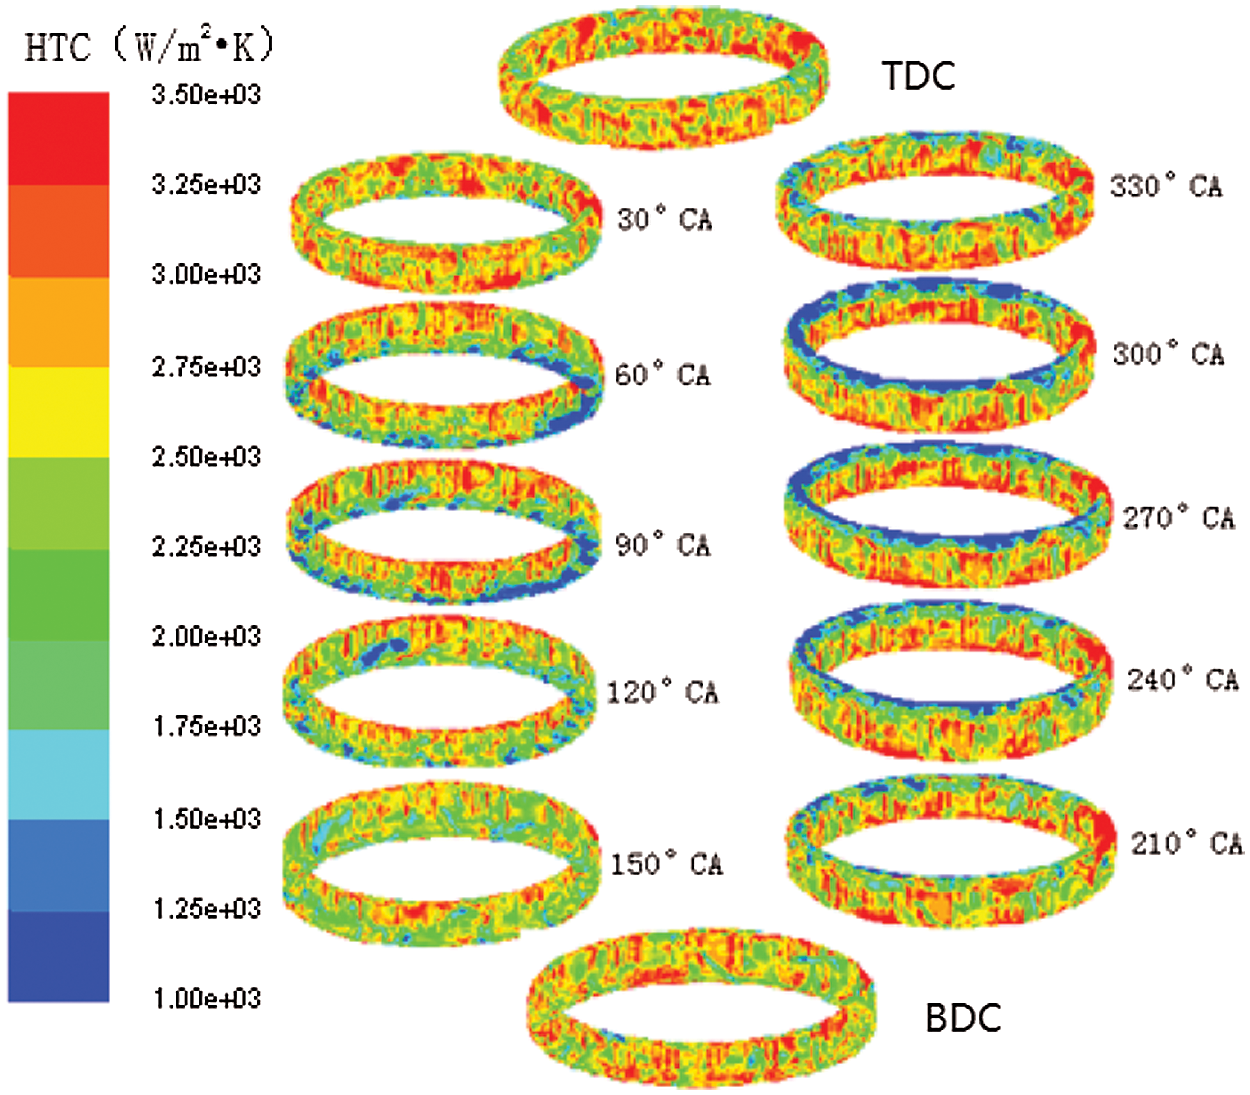
Figure 10: Heat transfer coefficient distribution of the cooling gallery surface
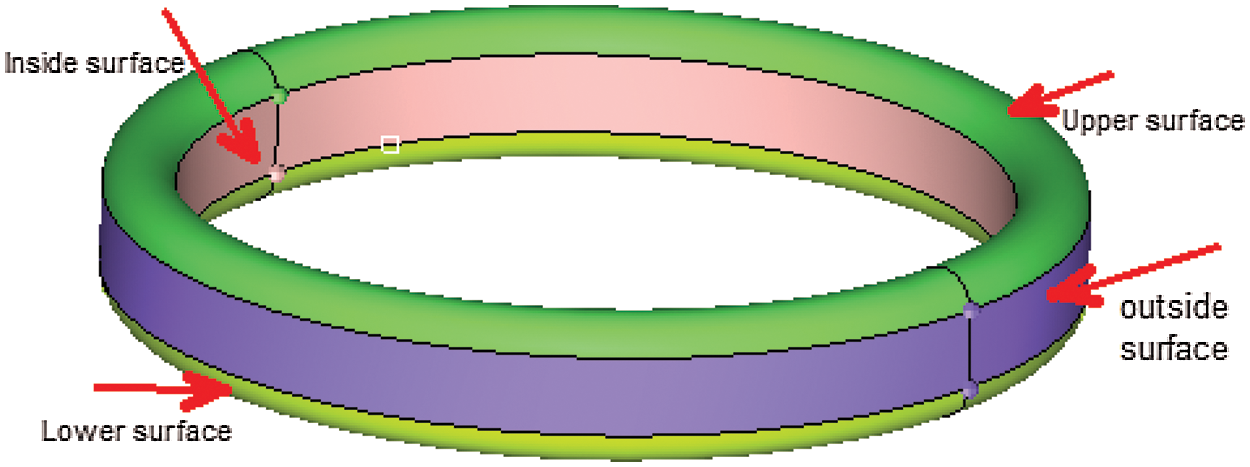
Figure 11: Partitions of the cooling gallery surface
The variation of the average heat transfer coefficient of the cooling gallery surface as a function of the crank angle can be seen in Fig. 12. The heat transfer coefficients in different areas of the cooling gallery surface often vary along with the crank angle, but the values are quite different. The heat transfer coefficient of the upper surface is obviously higher than that of the lower surface, which is closely related to the distribution of oil in the cooling gallery.
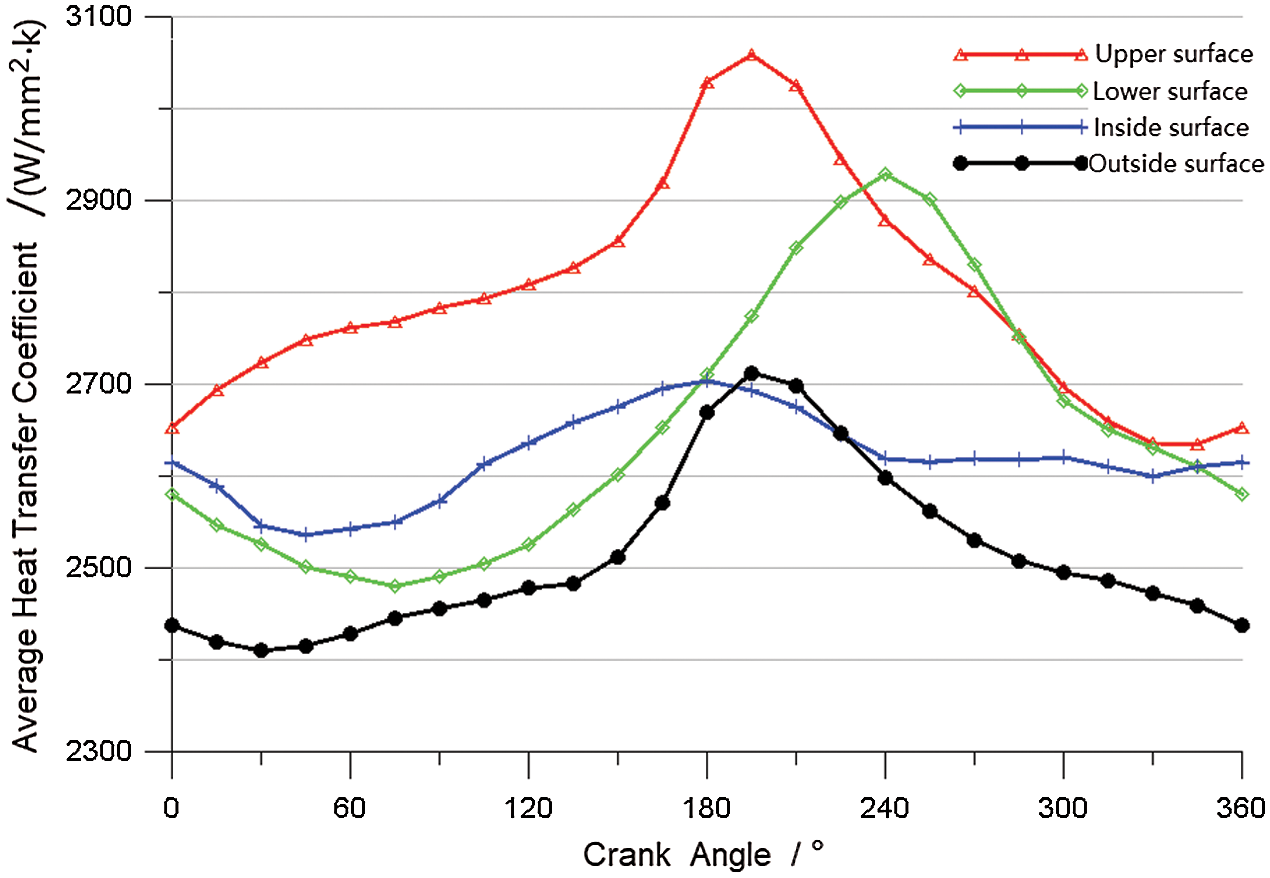
Figure 12: Average convective heat transfer coefficient of the wall as a function of the crank angle
When the piston moves downward, the oil mainly accumulates at the top of the cooling gallery, and air collects at the bottom. Therefore, the heat transfer coefficient of the upper surface increases, and the heat transfer coefficient of the lower surface decreases. In contrast, when the piston moves upward, the cooling oil mainly accumulates at the bottom of the cooling gallery, and air collects at the top. Therefore, the heat transfer coefficient of the lower surface increases and the heat transfer coefficient of the upper surface decreases. In addition, because the inside and outside surfaces of the cooling gallery are less affected by the impact of the oil, the heat transfer coefficients of these two surfaces are low.
3.3 Analysis of the Piston Temperature Field
The oscillating heat transfer effect of the cooling gallery is closely related to the oil fill ratio. If the oil fill ratio in the cooling gallery is too high or too low, the oscillating heat transfer effect will degrade, which is not conducive to cooling of the piston. To make full use of oscillating heat transfer, the oil fill ratio should be between 30% and 60% [25,29]. To further validate the heat transfer effect, the temperature field of the piston was calculated and analyzed.
Fig. 13 shows the temperature field distribution on the outside surface of the piston without and with a cooling gallery. The highest temperature of the piston without cooling is 378.9°C, and the highest temperature of this piston with cooling gallery is 354.2°C, which means the temperature drops by ~24°C. After adding the cooling gallery, the temperature of the engine combustion chamber and the top and second land drops by ~20°C, but the temperature of the piston skirt and bottom center does not drop significantly. It can be seen that the cooling gallery of the piston has a significant cooling effect on the piston crown and piston lands.
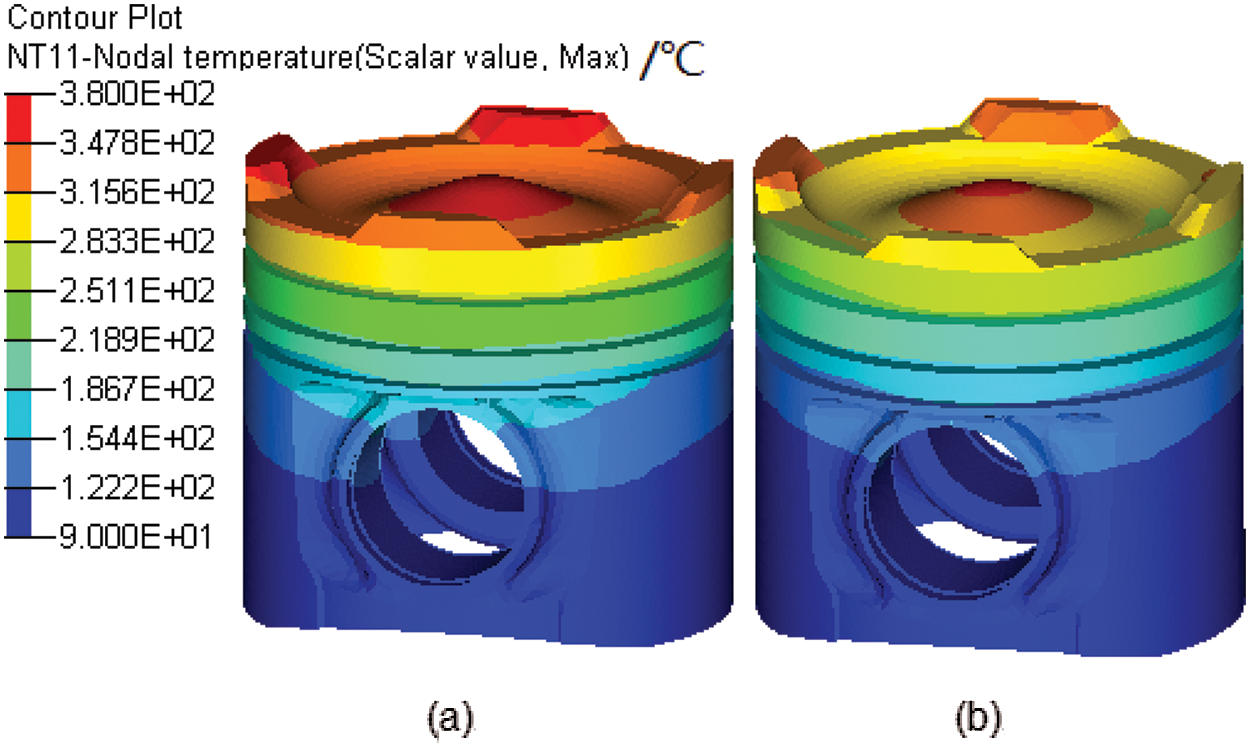
Figure 13: Temperature field distribution on the outside surface of the piston (a) Piston without cooling gallery (b) Piston with cooling gallery
Fig. 14 shows the temperature field distribution of the piston center section and piston crown with the cooling gallery. The high-temperature area of the piston is mainly concentrated in the center of the combustion chamber, and the temperature gradually decreases from the piston head to the lower edge of the skirt. The temperature of different areas on the piston crown varies greatly. From the center of the combustion chamber to the bowl to the edge, the temperature first drops and then rises, and the temperature is the highest in the center of the combustion chamber.
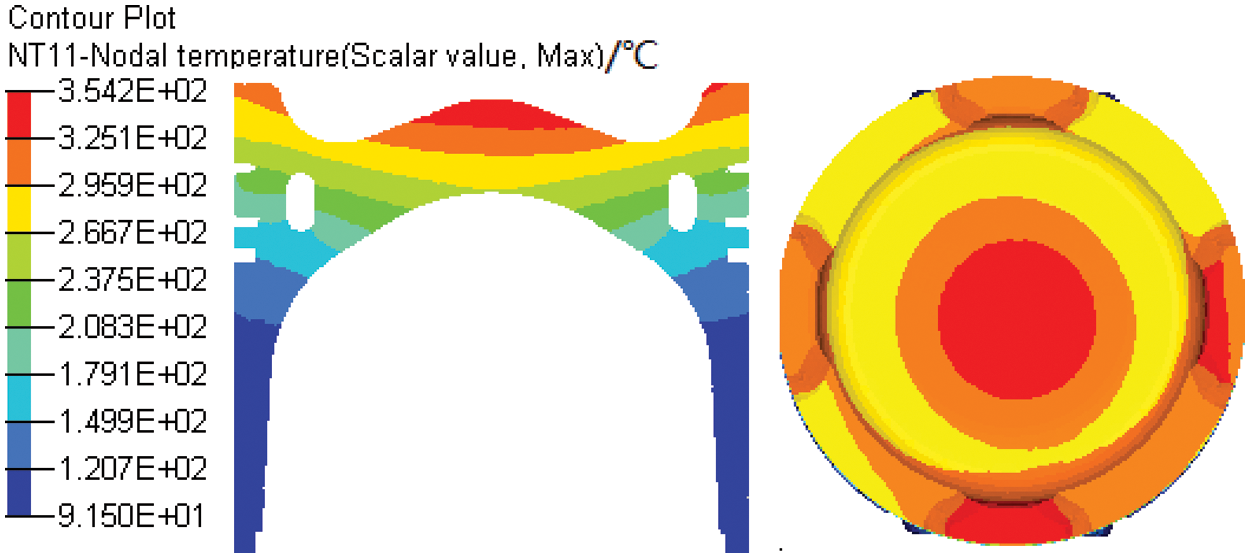
Figure 14: Temperature field distribution of the piston center section and crown
4 Experimental Validation of the Simulation
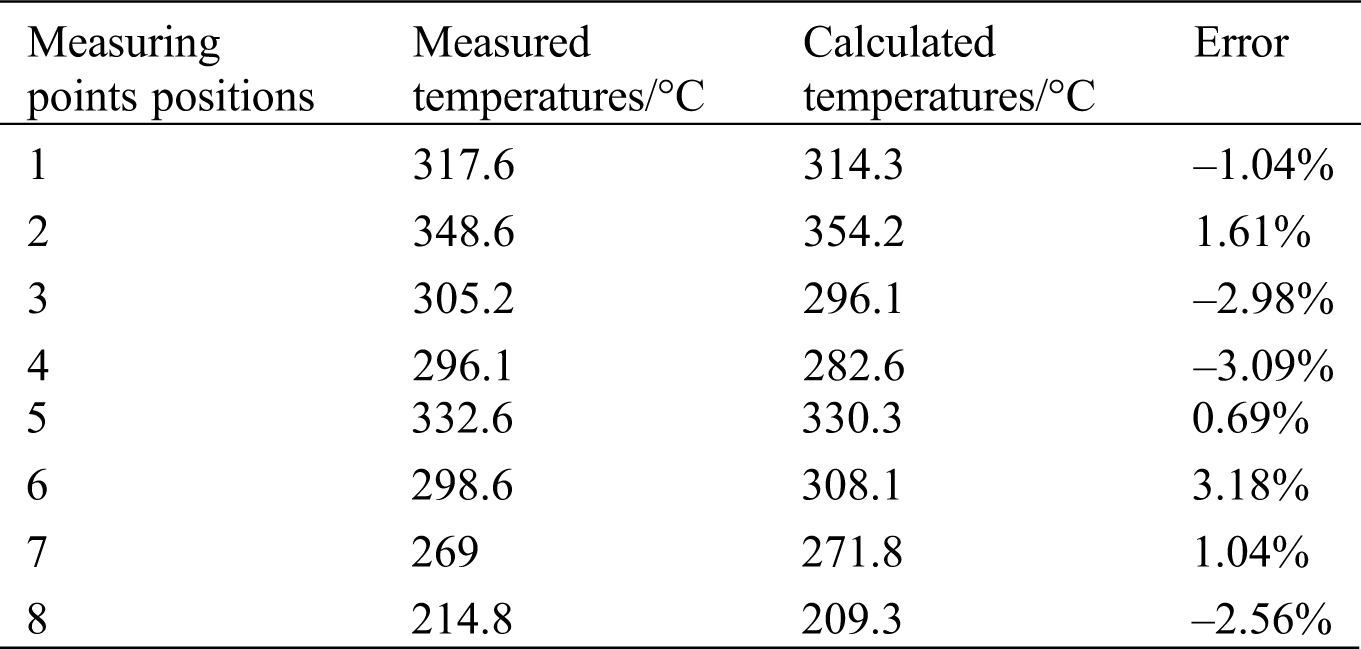
Thermocouples were used in this study to measure the temperature of key positions of the piston, which also provided validation of the simulation results. The main parameters of the diesel engine under measurement conditions are listed in Tab. 3, and the layout of the temperature measurement points is shown in Fig. 15. The moving coil and the signal amplifier for the sensor were mounted on the piston, and the stator antenna was fixed on the engine. When the piston moves, the temperature measurement data are transferred to the computer through a data acquisition system. The temperature measurement data are listed in Tab. 4. The maximum error between the calculated temperature value and the measured temperature value was 3.18%. The point with the maximum error was at point 6 around the combustion chamber on the piston crown. The overall error was within 5%. The simulation results were found to be in good agreement with the experimental results, indicating that the model and numerical simulation method implemented in this study are reasonable and trustworthy.
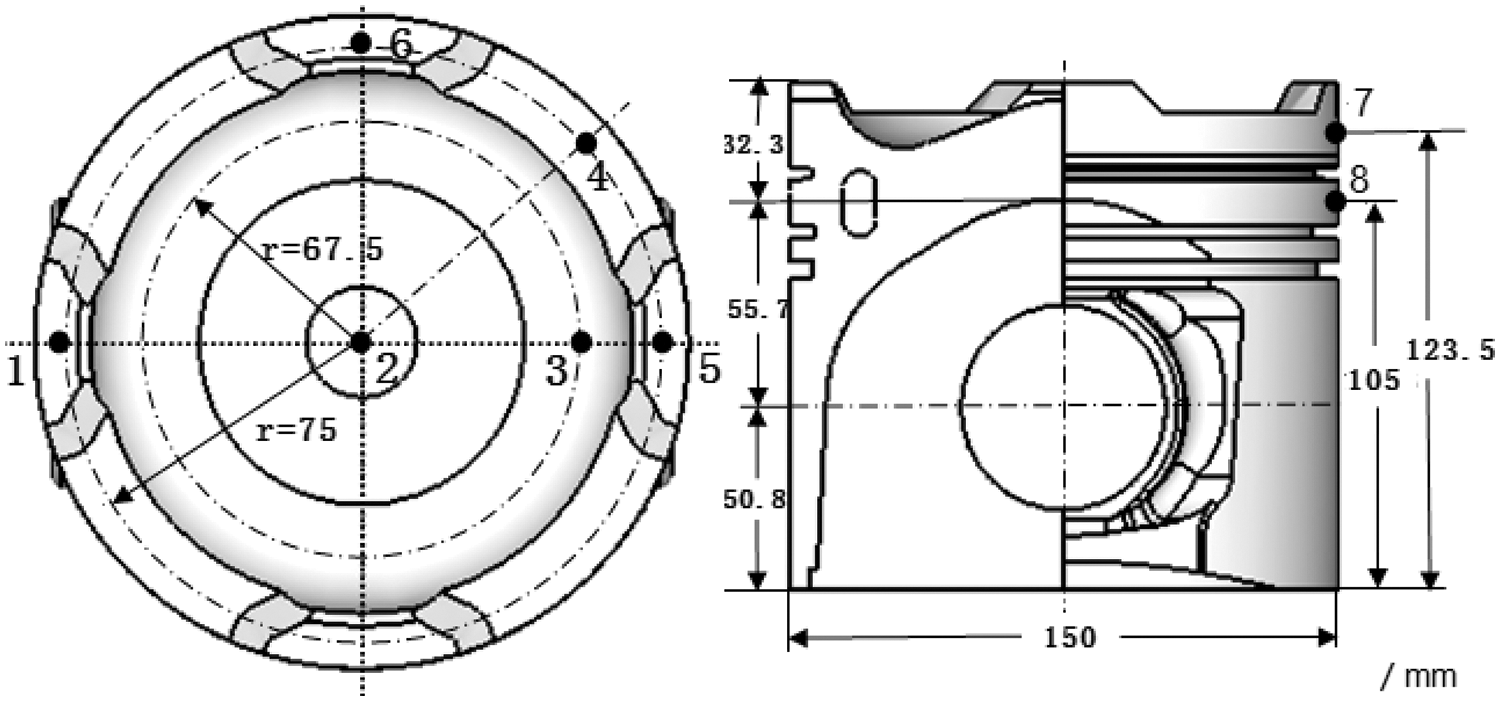
Figure 15: Positions of the measuring points on the piston
Table 3: Main parameters of diesel engine
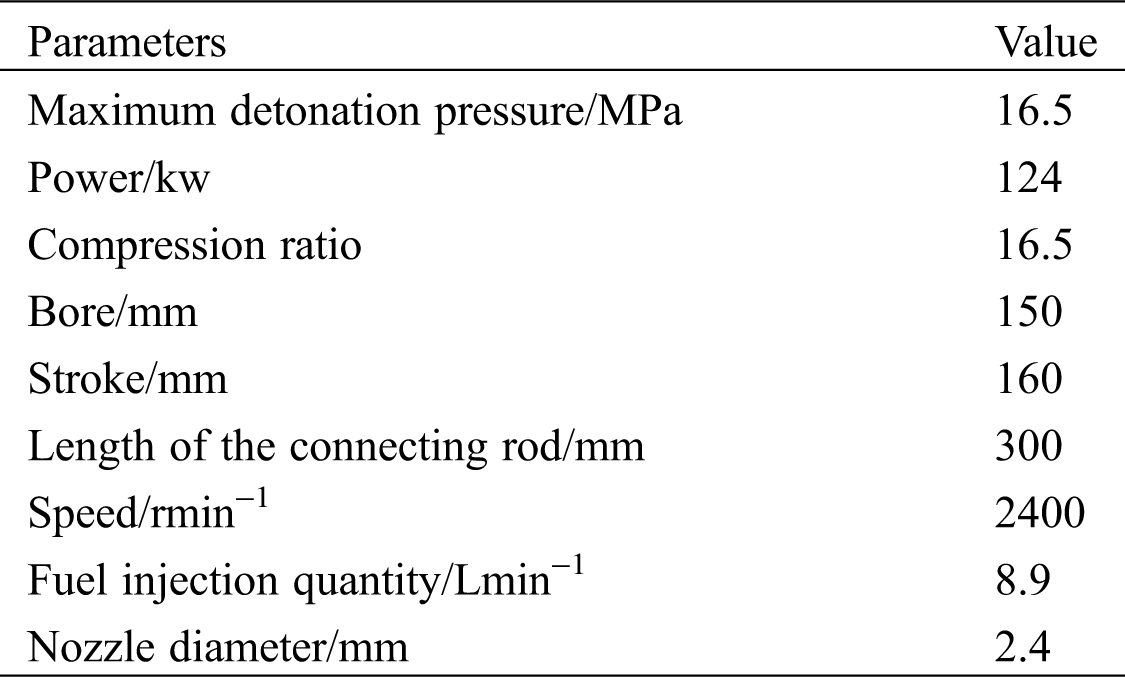
Table 4: Comparison of measured and calculated temperatures of piston
1. The oil flow and heat transfer characteristics of the cooling gallery were investigated through transient CFD calculations of piston oscillating cooling. The oil fill ratio of the cooling gallery was found to be closely related to the inlet and outlet flow of the cooling oil. The same amount of oil flowed in and out of the cooling gallery at 120° CA, while the oil fill ratio reached its maximum. Near 330° CA, the oil fill ratio reached its minimum. The trend of the heat transfer coefficient was similar to that of the oil fill ratio, but there was a lag period.
2. The temperature field distribution of the piston was obtained by using the heat transfer boundary determined from the transient oil-cooling CFD calculations. The highest temperature of this piston without cooling gallery was 378.9°C, and the highest temperature with cooling gallery was 354.2°C (a temperature decrease of 24.7°C). After adding the cooling gallery, the temperature of the combustion chamber and the piston land dropped by ~20°C. The temperature comparison between cases with and without the cooling gallery indicated that the oscillating heat transfer of the cooling gallery can effectively reduce the thermal load on the piston crown and the piston lands.
3. Comparison of the piston temperature test results with the calculated results revealed that the maximum error between the calculated temperature and the measured temperature was ~3.18%. The method used to obtain a temperature field to calculate the cooling gallery heat transfer boundary from the transient calculation results is thus well in line with the actual situation and further validates the accuracy of the oscillating cooling calculation model in this study.
Funding Statement: This work was supported by the Science Fund of State Key Laboratory of Engine Reliability [Grant No. Skler-201611].
Conflicts of Interest: The authors declare that they have no conflicts of interest to report regarding the present study.
1. El-Askary, W. A., Balabel, A., Wilson, S. (2013). Numerical and experimental investigations of jet impingement on a periodically oscillating-heated flat plate. Computer Modeling in Engineering & Sciences, 95(6), 483–499. [Google Scholar]
2. Zhu, H. R., Peng, P. Y., Liu, Q. G. (2018). Study on oscillation cooling technology of highly-intensified piston. Internal Combustion Engine & Parts, 9, 98–100. [Google Scholar]
3. Fu, W. S., Tong, B. H. (2004). Numerical investigation of heat transfer characteristics of the heated blocks in the channel with a transversely oscillating cylinder. International Journal of Heat and Mass Transfer, 47(2), 341–351. DOI 10.1016/S0017-9310(03)00303-X. [Google Scholar] [CrossRef]
4. Lee, G., Han, S., Kim, H., Yoo, Y. (2016). Effects of piston galleries on the piston temperatures of a diesel engine. International Conference on Advanced Engineering Theory and Applications, 415, 469–474. [Google Scholar]
5. Thiel, N., Weimar, H. J., Kamp, H., Windisch, H. (2007). Advanced piston cooling efficiency: A comparison of different new gallery cooling concepts. SAE Transactions, 116(3), 978–992. [Google Scholar]
6. Luff, D. C., Law, T., Shayler, P. J. (2012). The effect of piston cooling jets on diesel engine piston temperatures, emissions and fuel consumption. SAE International Journal of Engines, 5(3), 1300–1311. DOI 10.4271/2012-01-1212. [Google Scholar] [CrossRef]
7. Deng, X. W., Lei, J. L., Wen, J. (2017). Impact of piston secondary motion on oscillating flow and heat transfer of oil inside piston cooling gallery of diesel engine. Transactions of the Chinese Society of Agricultural Engineering, 33(14), 85–92. [Google Scholar]
8. Wang, P., Liang, R. B., Yu, Y. B. (2017). The flow and heat transfer characteristics of engine oil inside the piston cooling gallery. Applied Thermal Engineering, 115, 620–629. DOI 10.1016/j.applthermaleng.2017.01.014. [Google Scholar] [CrossRef]
9. Rahman, M. M., Ariffin, A. K., Abdullah, S. (2007). Effect of nitriding treatment on fatigue life for free piston linear engine component using frequency response method: A finite element approach. Structural Durability & Health Monitoring, 3(4), 197–210. [Google Scholar]
10. Zhang, S. C., Tao, X. H., Lu, J. S. (2015). Design, optimization and CFD simulation of a nozzle for industrial cleaning processes based on high-pressure water jets. Fluid Dynamics & Materials Processing, 11(2), 143–155. [Google Scholar]
11. Frulla, G., Gill, P., D’Oriano, V., Lappa, M. (2015). A practical engineering approach to the design and manufacturing of a mini kw blade wind turbine: Definition, optimization and CFD analysis. Fluid Dynamics & Materials Processing, 11(3), 257–277. [Google Scholar]
12. Kajiwara, H., Fujioka, Y., Suzuki, T. (2002). An analytical approach for prediction of piston temperature distribution in diesel engines. JSAE Review, 23(4), 429–434. DOI 10.1016/S0389-4304(02)00234-5. [Google Scholar] [CrossRef]
13. Pan, J., Nigro, R., Matsuo, E. (2005). 3-D modeling of heat transfer in diesel engine piston cooling galleries. SAE World Congress & Exhibition, 114, 1174–1181. [Google Scholar]
14. Lu, X. Q., He, T., Zou, D. Q. (2012). Thermal analysis of composite piston in marine diesel engine based on inverse evaluation method of heat transfer coefficient. Chinese Internal Combustion Engine Engineering, 33(4), 71–76. [Google Scholar]
15. Nasif, G., Barron, R. M., Balachandar, R. (2016). Numerical simulation of piston cooling with oil jet impingement. Transactions of the ASME, 138(12), 112202. DOI 10.1115/1.4034162. [Google Scholar] [CrossRef]
16. Zhong, J. (2012). Steady and transient numerical simulation of oil-inject shaking cooling and temperature distribution in piston (Master Thesis). China: Shandong University. [Google Scholar]
17. Cheng, Z., Wang, Y., Wang, Y., Nie, Q. (2019). On the application of a mobile grid technology to computational fluid dynamics. Fluid Dynamics & Materials Processing, 15(4), 357–366. DOI 10.32604/fdmp.2019.07843. [Google Scholar] [CrossRef]
18. Chekifi, T. (2019). Droplet breakup regime in a cross-junction device with lateral obstacles. Fluid Dynamics & Materials Processing, 15(5), 545–555. DOI 10.32604/fdmp.2019.01793. [Google Scholar] [CrossRef]
19. Hirt, C. W., Nichols, B. D. (1981). Volume of fluid (VOF) method for the dynamics of free boundaries. Journal of Computational Physics, 39(1), 201–225. DOI 10.1016/0021-9991(81)90145-5. [Google Scholar] [CrossRef]
20. Deshmukh, P. W., Sapali, S. N. (2007). CFD analysis of heat transfer in reciprocating helical coil with piston cooling application. International Review of Mechanical Engineering, 1(5), 579. [Google Scholar]
21. Wang, P., Lv, J. Z., Bai, M. L. (2013). Numerical simulation on the flow and heat transfer process of nanofluids inside a piston cooling gallery. Numerical Heat Transfer, 65(4), 378–400. DOI 10.1080/10407782.2013.832071. [Google Scholar] [CrossRef]
22. Liu, J. X., Wang, Y., Zhang, W. Z. (2010). The effects of the cooling gallery position on the piston temperature field and thermal stress. Applied Mechanics & Materials, 37–38, 1462–1465. DOI 10.4028/www.scientific.net/AMM.37-38.1462. [Google Scholar] [CrossRef]
23. Zong, M. J., Dong, F., Zhu, N. L. (2017). Effect of position of inner cooling gallery on piston temperature field of diesel engine. Journal of Mechanical & Electrical Engineering, 34(12), 1422–1426. [Google Scholar]
24. Hu, Z. H., Li, J. S. (2014). Influence upon temperature field distribution by different cross sectional areas of cooling gallery. Coal Mine Machinery, 35(12), 149–151. [Google Scholar]
25. Cao, Y. F., Zhang, W. Z., Yang, Z. Y. (2014). An investigation into the flow and heat transfer characteristics of an open cooling gallery in piston. Automotive Engineering, 36(5), 546–551. [Google Scholar]
26. Ansys, Inc. (2009). ANSYS FLUENT 12.0 user’s guide—26.3.1 choosing the pressure-velocity coupling. https://www.afs.enea.it/project/neptunius/docs/fluent/html/ug/node785.htm. [Google Scholar]
27. Deng, X. W., Lei, J. L., Wen, J. (2018). A transient analysis approach of the oscillating flow and instantaneous heat transfer processes of the piston cooling gallery. Kung Cheng Je Wu Li Hsueh Pao/Journal of Engineering Thermophysics, 39(7), 1568–1575. [Google Scholar]
28. Bozzoli, F., Cattani, L., Mocerino, A., Rainieri, S. (2016). Experimental estimation of the local heat-transfer coefficient in coiled tubes in turbulent flow regime. Journal of Physics: Conference Series, 745(3), 032034. DOI 10.1088/1742-6596/745/3/032034. [Google Scholar] [CrossRef]
29. Deng, L., Wang, Z., Liu, Y. (2017). Effect of structural parameters on fill ratio of closed cooling gallery. Journal of Central South University (Science and Technology), 48(8), 2224–2230. [Google Scholar]
 | This work is licensed under a Creative Commons Attribution 4.0 International License, which permits unrestricted use, distribution, and reproduction in any medium, provided the original work is properly cited. |