Materials Processing
| Fluid Dynamics & Materials Processing |
DOI: 10.32604/fdmp.2021.012693
ARTICLE
A Simplified Model for the Prediction of the Erosion of a Metal Screen for Sand Control
School of Petroleum Engineering, Yangtze University, Wuhan, 430100, China
*Corresponding Author: Baocheng Shi. Email: shibaoch@126.com
Received: 19 July 2020; Accepted: 19 February 2021
Abstract: In oil drilling processes, sand production in the oil layer is a common issue, generally mitigated by means of sand control screens. To prevent or reduce the risk of damage of these screens and to improve the related service life, it is necessary to investigate the related erosion dynamics. In this study, a screen mesh model based on the flow field similarity theory is proposed to overcome the otherwise too complex geometric structure of this type of equipment. Such model is optimized using experimental data. The predicted results are in good agreement with the measured values, and the error is less than 15%. The results also show that the simplified geometric screen model and the optimized Zhang et al. erosion model have high reliability; therefore, they could effective be used to select underground screen meshes and improve the design of production process.
Keywords: Metal sand control screen; erosion model; life prediction; numerical simulation
In the oil drilling process, sand production in the oil layer is a common problem in the exploitation of loose sand reservoirs. As an important oil and sand control equipment, sand control screens are widely used in the completion of vertical wells, horizontal wells, sidetracking well and branch wells in the oil drilling industry. Actual production shows that erosion wear is an important cause of sand control failure. In order to prevent or reduce the damage of screen mesh erosion wear to oil and gas well production, more and more studies on screen erosion wear have been carried out in recent years. The research results show that the causes and influencing factors of the erosion of the screen tube are the key research objects. The erosion rate of the screen can be obtained by the combination of experimental methods and predictive models. The prediction of the life expectancy has practical guiding significance for preventing the erosion of the screen.
At present, the erosion theory describing solid particles on plastic materials can be divided into four categories: micro-cutting theory [1], deformation and wear theory [2], erosion sheeting theory [3], second erosion theory [4]. According to micro-cutting theory, when irregular particles impact material surface at high speed, the convex angle of particles will take away the material by cutting, which is more suitable for explaining the cutting effect of solid particles at low impact angle; From the point of view of energy balance, the theory of deformation wear considers that the total wear is the sum of deformation wear and cutting wear, which is generally used to describe the elastic-plastic deformation process of material surface caused by impact force of micro-particles; Erosion sheeting theory is an extension of deformation wear theory, which considers that the wear process of materials is a forging and extrusion behavior, and that the continuous impact of particles is the main factor leading to work hardening on the surface of materials, and erosion wear at high angles of attack is usually explained. Common to all three theories is the treatment of solid particles as hard particles of steel. Unlike this type of theory, the second erosion theory suggests that soft brittle solid particles can rupture under the conditions of high mass and fast enough impact velocity and lead to the second erosion phenomenon. It can be seen that the common point of existing solid particle erosion theory is to treat solid particles as hard or soft magic particles.
Above-mentioned theories explain erosion phenomena from different solid particles, different particle structures and different stages. They overlap and complement each other. Based on the above theory, a large number of experiments and theoretical studies have been carried out on the erosion behavior of metal materials with solid particles at home and abroad. Norwegian Classification Society proposed DNV model based on a large number of experimental data [5], the model is mainly applicable to steel pipelines. On the basis of a large number of erosion experiments on solid particles with different impact angles and shapes, Tulsa’s researcher Zhang et al. [6] proposed a new erosion model. Aiming at the pipe wall of AISI1018 steel, Ahlert [7] established a pertinent erosion model. Oka et al. erosion model was proposed by Oka et al. [8] on the basis of comprehensive consideration of impact angle, impact velocity, particle diameter, shape, properties and properties of pipe wall materials. Procyk et al. [9] used different flow rate fluids for the erosion test of woven wire screens, and analyzed the fluid pressure drop, screen mass loss and pore size change with the experiment and proposed an empirical model for woven wire screens. Rui et al. [10] studied the erosion of plugged tees through numerical simulation. Deng et al. [11] established a screen erosion model under different factors by conducting a single layer MWM experiment. Roostaei et al. [12] conducted sand control design by evaluating the mathematical model of sand distribution in the representative office. Salama et al. [13,14] calculates the density of mixed oil and gas in pipeline by means of weighted average method to deal with the erosion of multiphase flow on pipeline wall; Evstifeev et al. [15,16] compared the simulation results of E/CRC, DNV, Oka, Tabakoff and other four erosion models with the experimental data of Pyboynina [17] and Evans et al. [18] through CFX software, and obtains the advantages and disadvantages of different erosion models and their respective applicable working conditions. Chen et al. [19] and others used CFD software to study the relative velocity of ordinary elbow and T-elbow in gas-solid two-phase flow using McLaury erosion model, and compared the accuracy, advantages and disadvantages of solid particle trajectory under random impact rebound model and non-random impact rebound model.
In summary, according to the research results of pipeline erosion literature, there are many studies on the erosion of pipeline wall caused by gas-solid or liquid-solid flow field, but few studies on Numerical Simulation of screen erosion [20–27]. The complexity of the geometry of the screen itself and the unpredictability of the clogging of the mesh sand are the main reasons why the screen is difficult to carry out digital model research. For this reason, a simplified screen model based on flow field similarity theory is proposed to solve the problem that it is difficult to carry out numerical research on sand control screen pipe due to its complex geometric structure, in order to obtain the erosion mechanism of screen, and to provide reference for the selection of underground screen and the design of production process.
For sand control screen at low solid phase volume fractions (usually no more than 10%), the solid-liquid two-phase flow can be numerically simulated with discrete phase model. The characteristics of the discrete phase model are one-way interaction. The fluid, as a carrier, has influences on the movement of the particles by drag, drop and vortex, while the solid particle effects on the liquid phase flow is very limited and can be negligible.
As continuum phase in sand control screen, water is incompressible, thus the Renault eddy viscosity model is employed to calculate liquid flow field. The continuity equation, momentum equation and RNG (Renormalization group) k-ε turbulence model equations can be referred to the literatures [28–31].
In numerical calculations, the solid particle movement can be described by Lagrange’s equation. Based on a single particle forces analysis, the particle trajectory can be solved by integral of differential equations. According to Newton’s second law, control equations for spherical particles in slurry pump flow field in x direction in the absolute coordinates system can be given as follows:
where:
2.2.1 Liquid Phase Continuity Equation
The continuity equation for the flow of the liquid phase within the screen is [32]:
where: t is time(s), u is Velocity vector(ms-1); Subscript j = 1,2,3.
2.2.2 Momentum Equation of Liquid Phase
The momentum equation for flow of liquid phase [33] within the screen is:
where:
where:
where:
2.2.3 Liquid Phase Turbulence Model
The fluid will pass through the protective shell, and the dense screen flows into the accumulation tube, thus the line is curved, and the turbulence is anisotropic, i.e., the turbulent viscosity, is anisotropic, and if the standard turbulence model is used directly the calculation will produce some distortion. Therefore, the RNG (Renormalization Group) turbulence model is more appropriate for the liquid-phase turbulence in the screen, and the turbulent energy equation for the RNG turbulence model is:
where:
The RNG κ-ε turbulence model liquid-phase dissipation rate equation is:
where:
In addition, due to the unstructured grid used in this paper, the format is second order, except for the pressure term which remains in standard format. For the pressure-velocity coupling relationship, the SIMPLE algorithm with phase coupling proposed by Vasquez et al. [34] is used to perform finite volume discretization of the system of Euler’s conservation equations on the unstructured grid, which has the advantages of good convergence and robustness. The coupled solver is used to improve the convergence of the equations, and for the calculation of the gradient, the node-based is used instead to improve the computational accuracy.
2.3 Prediction Model of Erosion
2.3.1 Geometric Modeling and Meshing
(1) Simplified distributed holes screen
The purpose of this simulation is to verify the erosion rule of single-layer screen in laboratory experiments. Because of the difficulty of mesh generation due to the cross-compiling structure of screen mesh, the geometric model of screen tube is simplified first, and then the simulation and trial calculation are carried out. The screen model is shown in Fig. 1, and the simplified model is shown in Fig. 2.
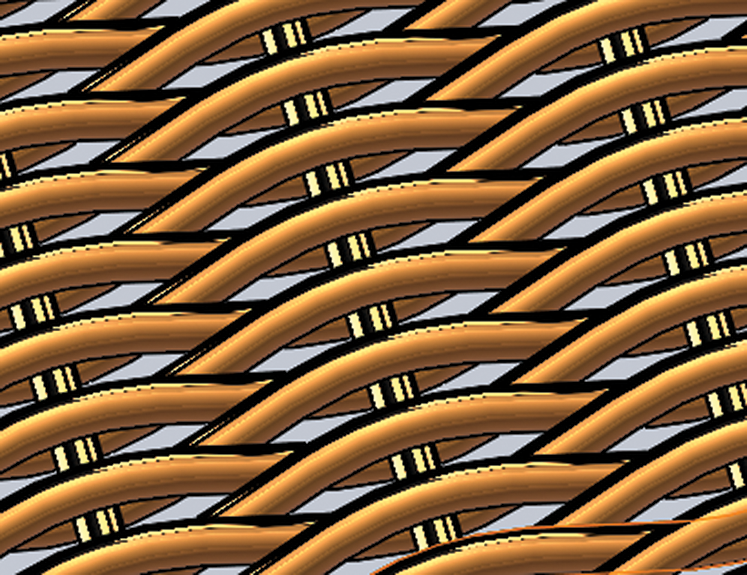
Figure 1: Non simplify the screen mesh structure
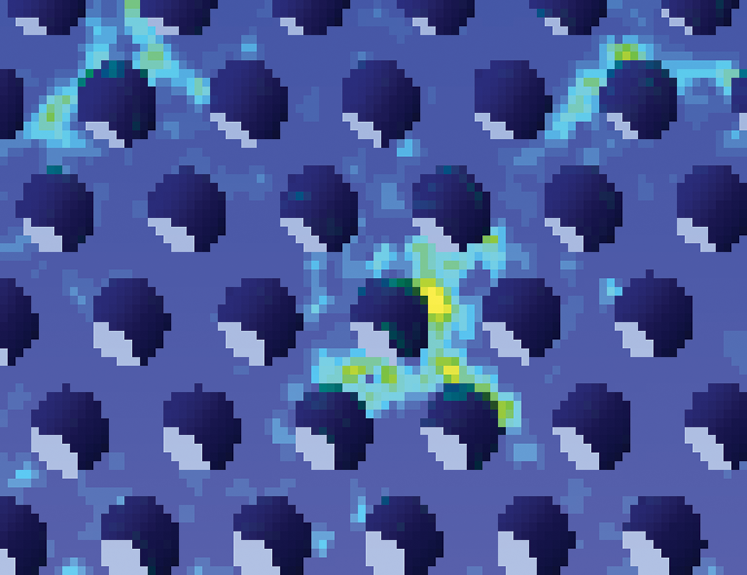
Figure 2: Simplified screen mesh structure screen mesh model
Commonality: The sieve mesh is a porous runner structure with good consistency; Simplified cylindrical hole layout is also a porous channel structure, each small cylindrical hole is uniform, so simplifying screen mesh into cylindrical hole has a certain simplification basis.
Difference: Precision screen mesh has many interfaces which are linear and tangent to each other, which is impossible to carry out Boolean operation in software. In addition, because of the existence of tangent plane, the density of computational grid is required to be higher, and the performance of computer is required to be very high. The simplified cylindrical mesh has uniform rules, high mesh quality and fast convergence. The comparison between simulation and experiment shows that the simplification is reasonable.
According to the experimental conditions, a single layer woven screen with a diameter of 50 mm is selected as the experimental simulation object. The screen diagram of experimental sample is shown in Fig. 3a. Fig. 3b shows the simplify three-dimensional structure of the screen, and Fig. 3c shows 3D drawing of the same size sample screen.
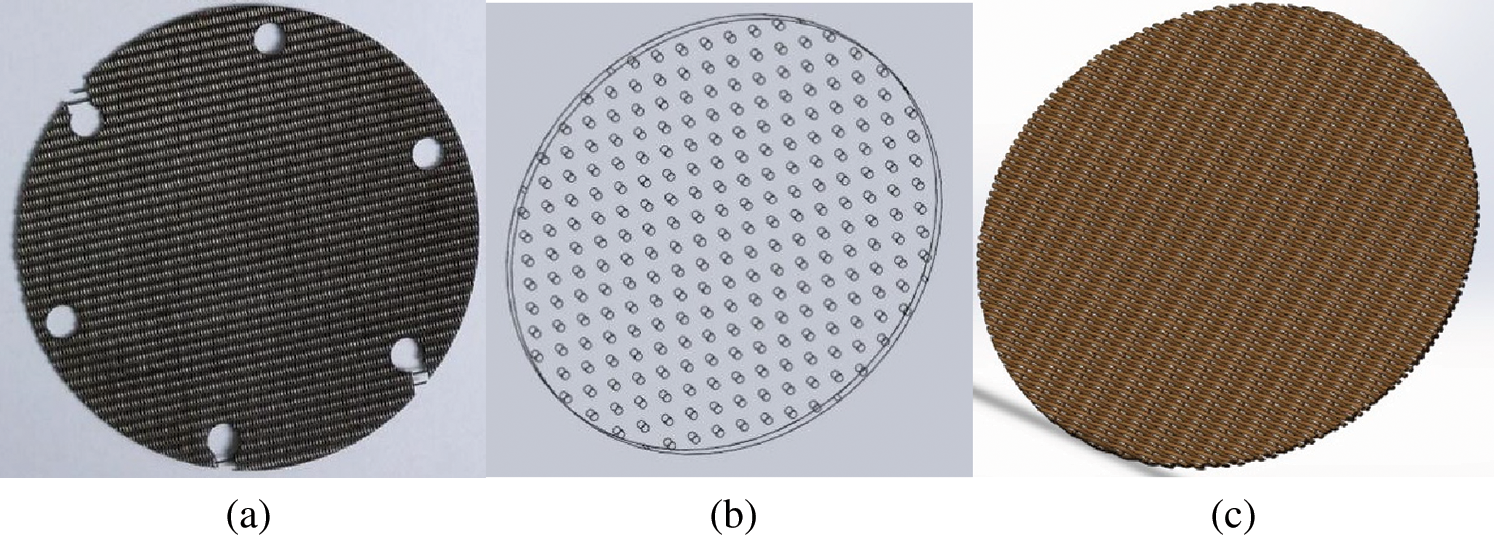
Figure 3: Screen structure diagram (a) Screen diagram of experimental sample (b) Simplify three-dimensional structure of the screen (c) 3D drawing of the same size sample screen
2.3.2 Experimental Device Modeling
The erosion experimental device is shown in Fig. 4. The device is mainly composed of five parts: (1) Liquid supply circulation device is used to transport a mixed sand mixture; (2) Kettle body is the main place for placing the entire experimental screen and conducting the erosion test; (3) Erosion unit test stand is used for gripping sand control screen mesh; (4) Sanding nozzles is changing the nozzle diameter allows you to adjust the jetting speed. (5) Pressure sensors are used to measure the pressure drop before and after the sample is plugged. The laboratory test device effectively simulates the downhole operation of the screen pipe.
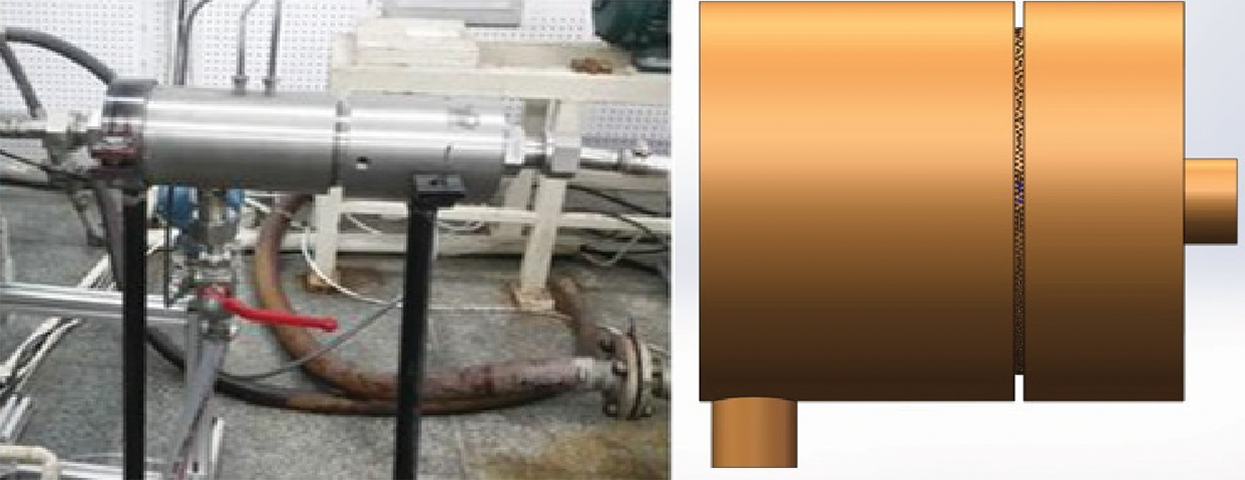
Figure 4: Experimental device for evaluating screen erosion
During the experiment, a small part of the gravel passes through the sieve, while a part of the gravel is retained and blocked by the sieve, and the sieve overcurrent hot spot is formed. At this time, two situations will occur: (1) The existence of a gap so that the sand-containing liquid continues to carry fine gravel through the screen causing screen erosion; (2) Pressure generated by the sealed reactor may cause a part of the blocked sand and gravel to press out of the gap, thereby re-establishing the blockage and causing erosion.
Therefore, in order to better match the experimental conditions, the solid model of the experimental device is established, as shown in Fig. 5.
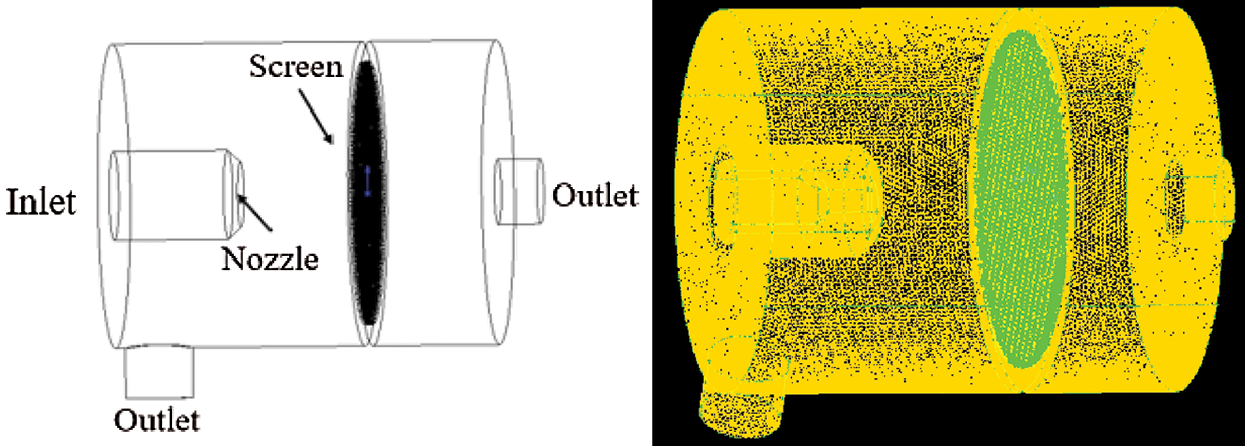
Figure 5: Experimental device model diagram and mesh
2.3.3 Optimization of Erosion Model
(1) Grid independence verification
In the process of grid independence verification, Zhang et al. [6] model is used to simulate erosion. The stochastic particle-wall collision rebound model proposed by Grant and Tabakoff is used for the collision between solid particles and pipe wall. The grid adopts a hexahedral structured grid, and the encrypted boundary layer grid structure is adopted at the wall of the tube, and the grid gradient rate is CR = 1.2, and the number of layers is 5 layers. The simulation calculation of the model with different grid numbers shows that the relationship between the maximum erosion rate and the number of grids is shown in Fig. 6. The results show that the number of grids of 1.7 million is a suitable choice.
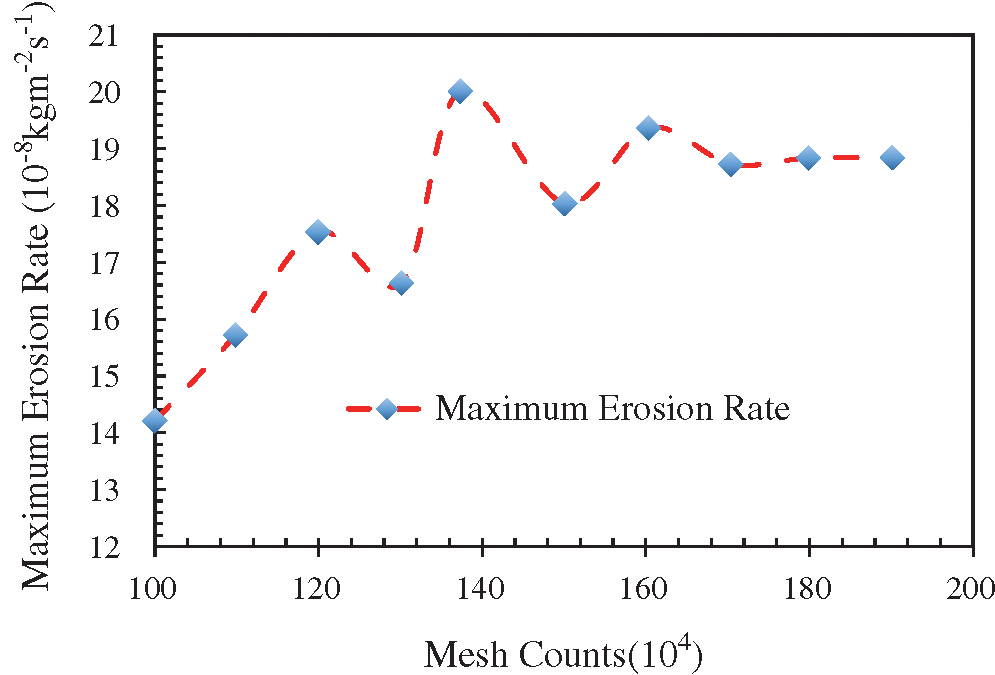
Figure 6: Verification of the grid independence test
(2) Comparison and selection of erosion models
According to previous studies, the erosion rate of pipe wall by solid particles is a function of impact angle [6,21]. However, most of the existing impact angle functions are empirical functions based on experiments, which have strong pertinence and limitations. Therefore, it is very important to find a suitable erosion function model for the working conditions in this paper. This paper summarizes and summarizes the erosion models of predecessors, as shown in Fig. 7. The erosion models can be written as follows:
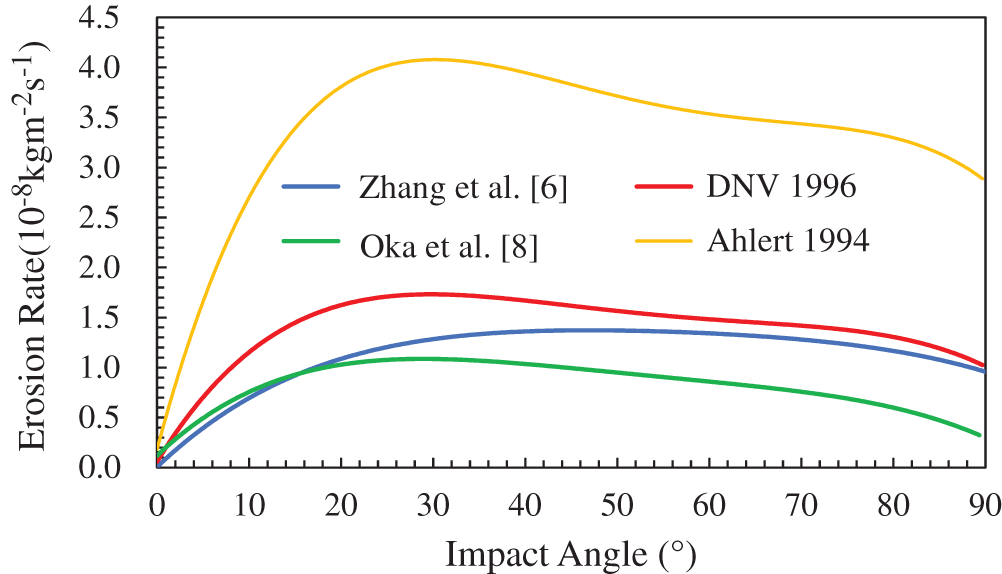
Figure 7: Function of impact angle
Here,
In this paper, the metal screen with plastic wall material is studied, which based on the properties of plastic material that can be obtained. When the impact angle is 90, the impact angle function is positive. Therefore, erosion models such as Hashish [35], Zhang et al. [36] and Hopkins et al. [37] can be excluded. By studying the impact angle function, DNV model [5], Oka et al. model [8], Ahlert model [7] and Zhang et al. model [6] can be obtained. However, Ahlert model does not take into account the impact of screen material on erosion, and the impact angle function is quite different from the other three erosion models.
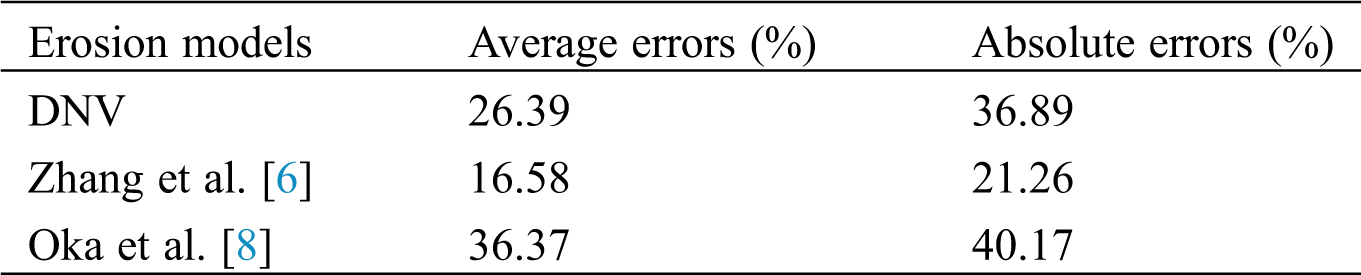
Therefore, DNV model, Zhang et al. [6] model and Oka et al. [8] model are used to simulate and compare with experimental data. Tab. 1 shows the data errors between the maximum erosion rate and the experimental data in three different models. It can be found that the calculation results of Zhang et al. [6] model have little error with the actual situation, while the results of DNV model and Oka et al. [8] model have great error with the experimental data. Therefore, it can be concluded that the Zhang et al. [6] model fits well with the actual situation and is suitable for the study in this paper.
Table 1: Statistical results of erosion models for experimental data
2.4 Important Parameter Design
1) Design of computational working conditions
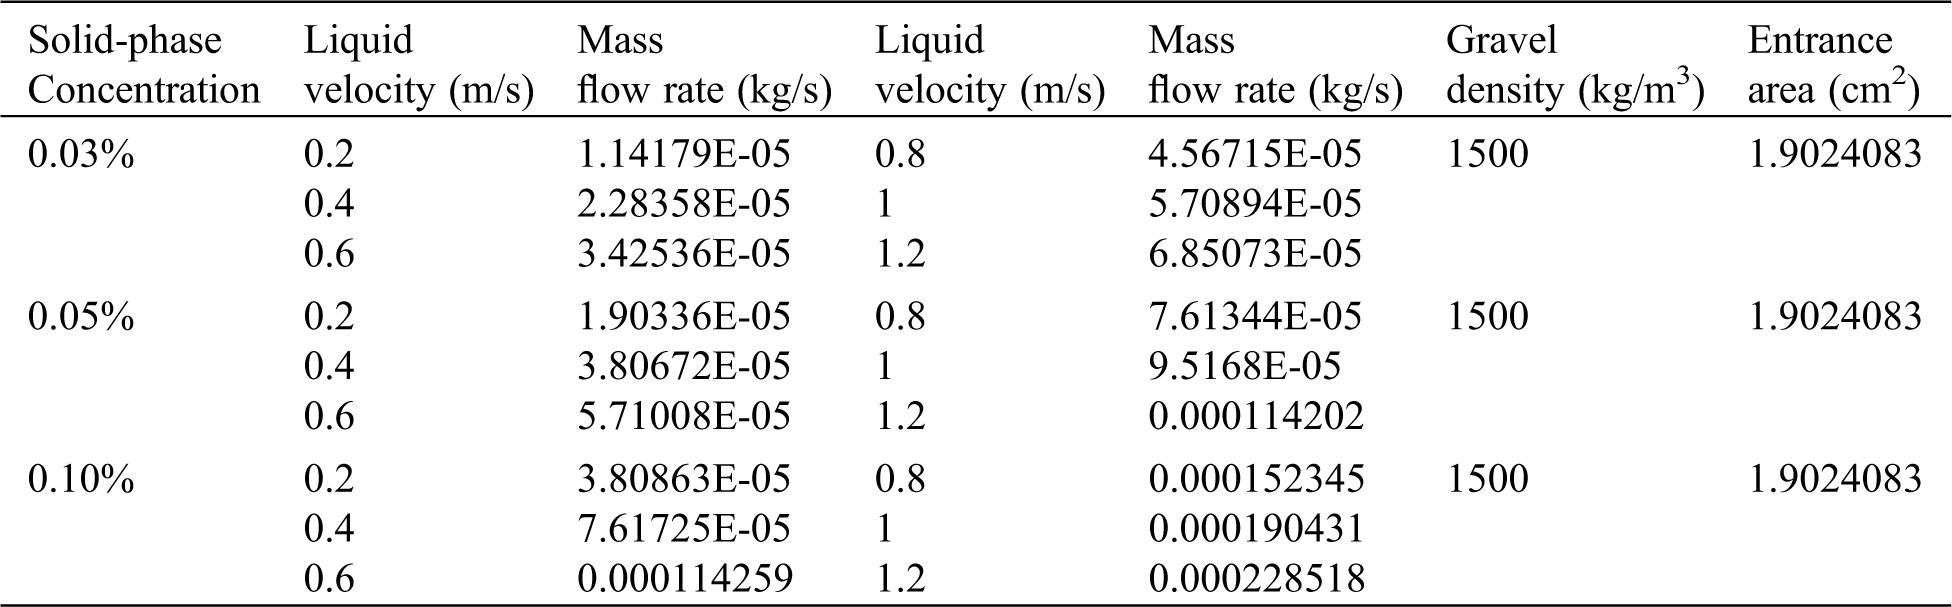
In order to study the influence of particle concentration and particle velocity on the erosion rate of screen mesh, Tab. 2 gives the design of simulated working conditions with different inlet liquid velocity and different gravel concentration.
Table 2: Design of simulated working conditions with different inlet liquid velocity and different solid-phase concentration
2) Gravel Particle Size Characteristic Value Distribution
(1) Rosin-Rammler distribution expression
where,
(2) Particle size analysis of field data of sand production wells
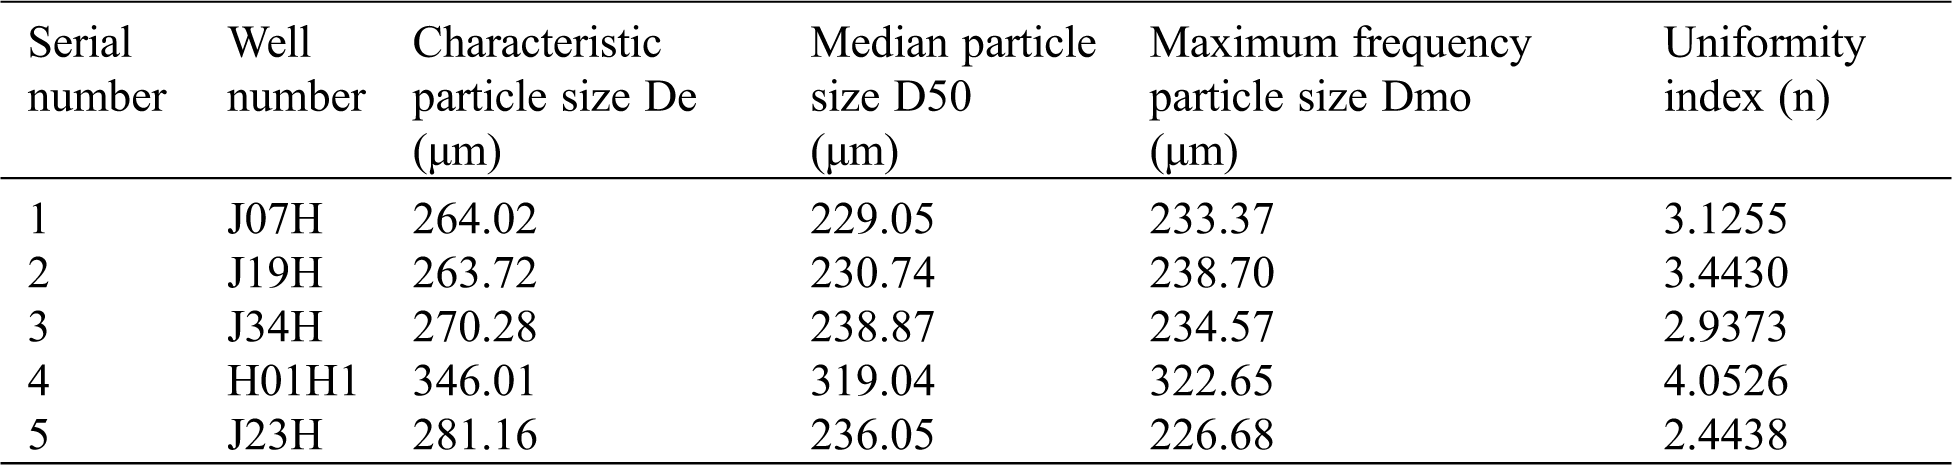
Tab. 3 gives the eigenvalue of Rosin-Rammler particle size distribution based on the field data of sand production wells in an oilfield. The particle size distribution of sand production wells can be simulated by introducing this eigenvalue into the simulation.
Table 3: Particle size analysis of sand well site data
(3) Considering oil and water as one phase in the simulation, it is necessary to calculate the density and viscosity of oil-water mixture
Density is calculated by weighted average of water content:
Estimating of viscosity: The viscosity of oil-water mixture is calculated according to Mcadams formula, which has high accuracy.
where,
(4) Collision rebound model
At present, in the study of solid particle trajectory and erosion, the most commonly used collision rebound models are the random particle-wall collision rebound model proposed by Grant and Tabakoff [5] and the non-random particle-wall collision rebound model proposed by Forder et al. [2]. Non-random particle-wall collision bounce model is as follows:
The random particle-wall collision bounce model is as follows:
where
When a fluid has a vortex, the use of a non-random particle-wall collision bounce model causes some solid particles to repeat a specific motion trajectory dozens of times, resulting in inaccurate prediction of the erosion rate position. However, the random particle-wall collision rebound model can avoid this problem very well.
The curves of initial pressure difference and flow rate with time are shown in Fig. 8. In the test stage without sand, the screen sample is not blocked, the pressure difference is low (0.1 MPa), and the flow rate is large (1150 L/h). After adding sand, the pressure difference on both sides of the sample increases gradually with the sand bearing fluid continuously replacing the overflow, and the increasing range is more and more close to the exponential growth, while the variation law of flow rate is opposite. This shows that with the flow of sand bearing fluid and the gradual bribery of sand particles, the screen sample begins to block. During the blocking period of 600 s–1000 s, the blocking degree of screen sample is low, and the increase of blocking degree is relatively slow. When it is more than 1000 s, the degree of clogging increases until the experimental conditions are reached, and the sieving sample enters the stage of constant pressure control. Therefore, the sand control plugging process of sand control string is a process of slow accumulation in the early stage and rapid increase in the later stage. This plugging process makes the velocity of screen increase rapidly, which strengthens the erosion and wear effect of fine sand passing through the screen, resulting in erosion failure of sand control string in a short time.
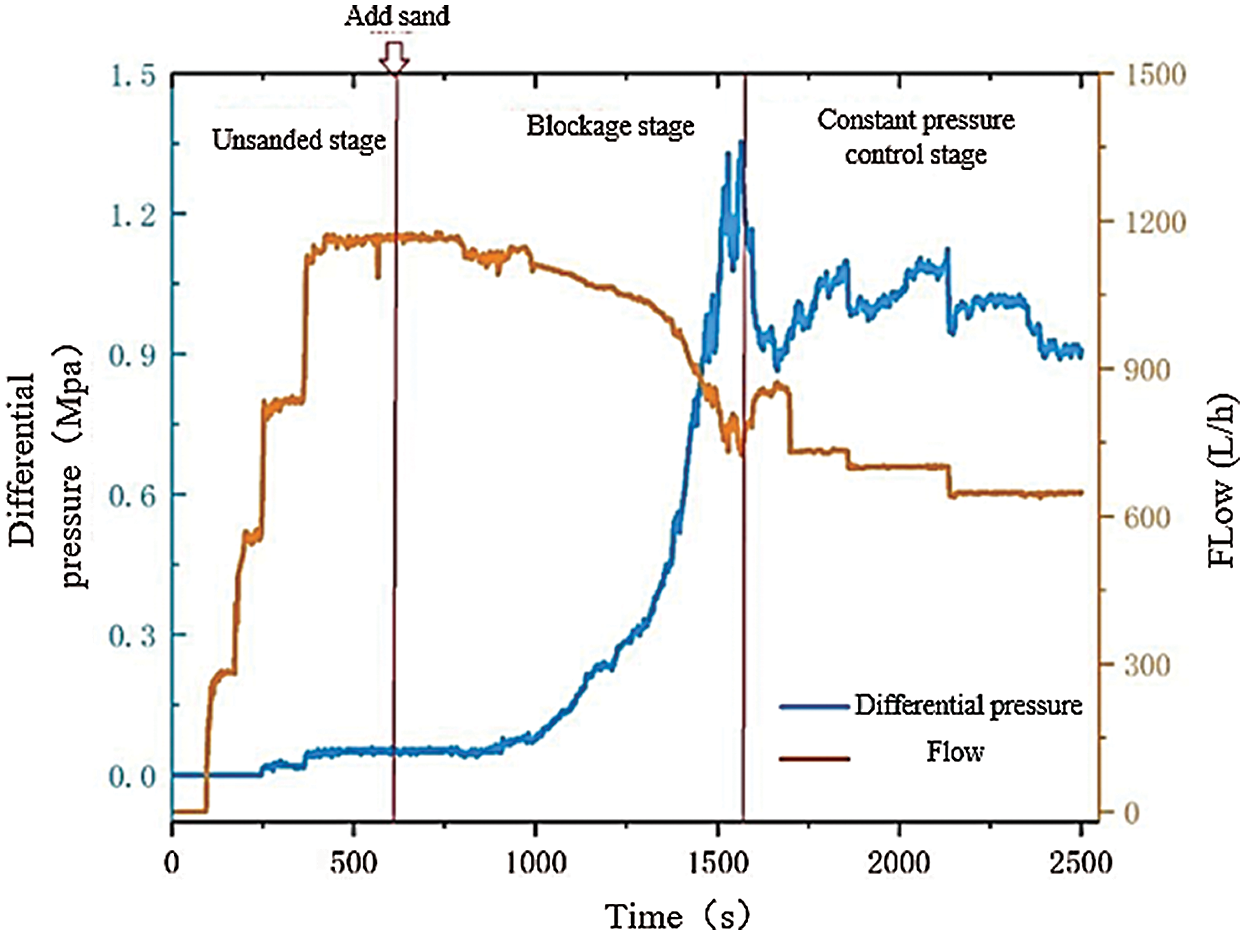
Figure 8: Curve of initial pressure difference and flow rate with time
Curve of differential pressure with time between 2500 s and 4500 s is shown in Fig. 9. in the process of screen plugging, the pressure difference of sample medium does not rise uniformly, but fluctuates periodically. This is because after the bridge plug, the sand does not always continue. When blocking, the pressure difference on both sides of the screen rises, which will discharge the sand particles closest to the screen aperture to form a short new distribution channel, so as to make the pressure difference of the screen sample It drops rapidly, and then the carrier carries new sand into it, gradually forming a new bridge plug, and the differential pressure rises slowly. In the periodic change of pressure difference, the extruded sand and screen will produce cutting wear, which will also aggravate the erosion damage of the screen. It can be seen from the pressure change that the indoor screen jet erosion test is close to the field conditions, and the test results have certain reliability.
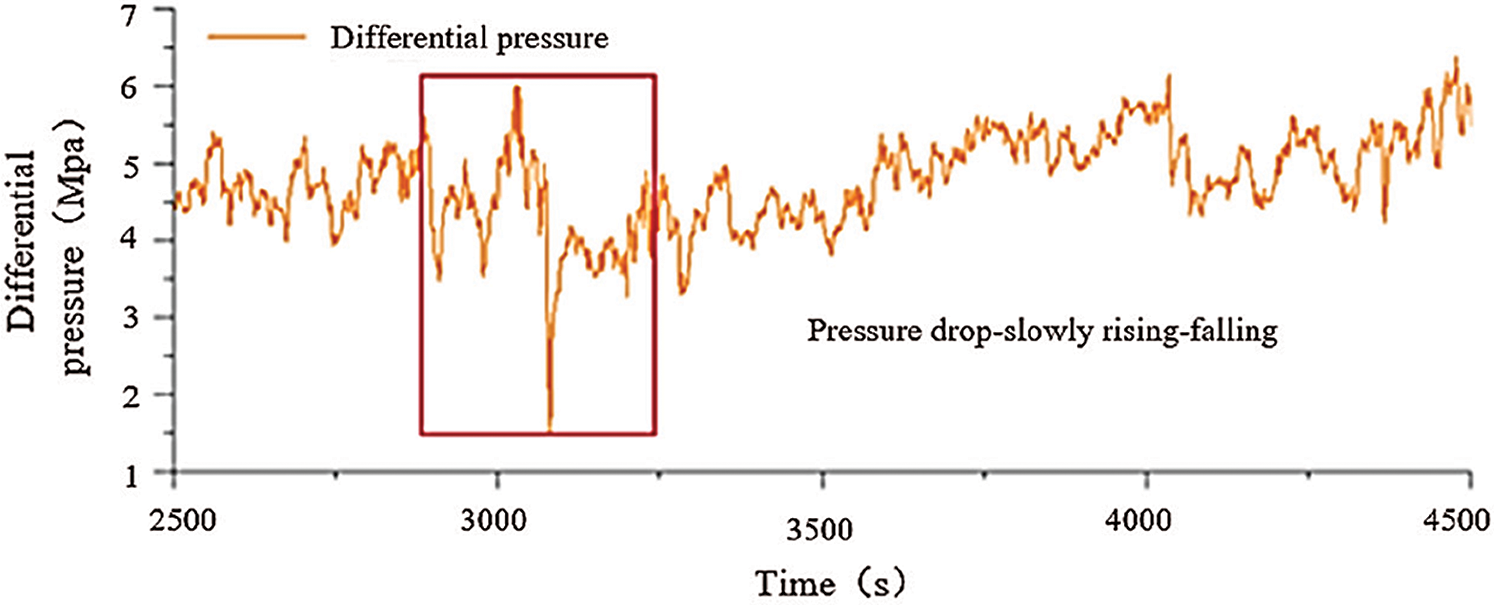
Figure 9: Curve of differential pressure with time (2500 s–4500 s)
3.2 Particle Trajectory Tracking
Fig. 10 shows an example trajectory tracking diagram. From nozzle jet to screen mesh, the particles disperse around the center of the jet. Some solid particles rebound many times through the screen mesh on the wall. Some collide directly on the front wall of the screen mesh, causing erosion and wear on the wall. The number of particles trajectory at the top of the jet is obviously excessive on both sides.
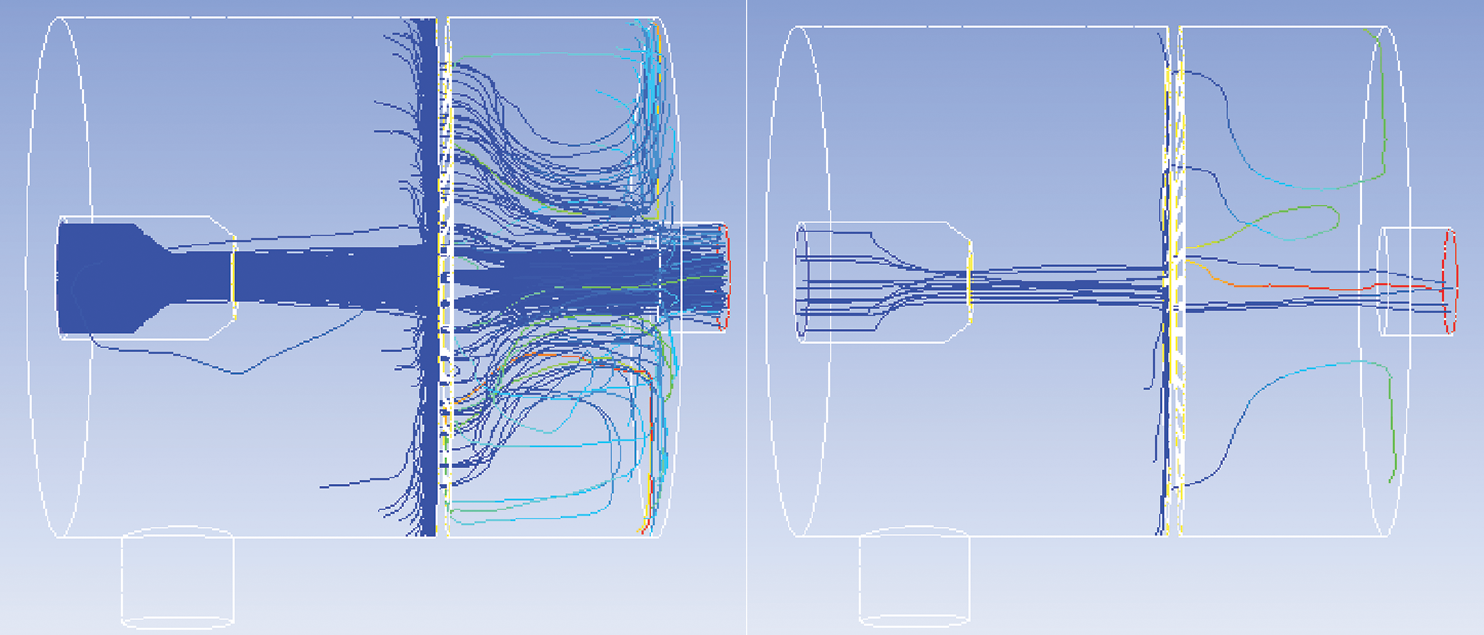
Figure 10: Particle trajectory tracking
3.3 Experimental Verification of Erosion Model
(1) Comparisons of Erosion Cloud pictures
Comparing the erosion nephogram of three erosion models (Fig. 11), it is found that the erosion of screen mesh under Zhang et al. [6] model is relatively divergent, which is in good agreement with the laboratory experiment, and further verifies that the cutting mechanism is the main cause of erosion. Fig. 11b is an erosion nephogram of Zhang et al. [6] model which cancels the background effect. It can be seen that the calculated erosion points are more dispersed than the other two erosion models, and have a higher coincidence with the experiment. It is also a key research model in the future. Further research on velocity index and other parameters can be done in order to better conform to the actual experimental results.
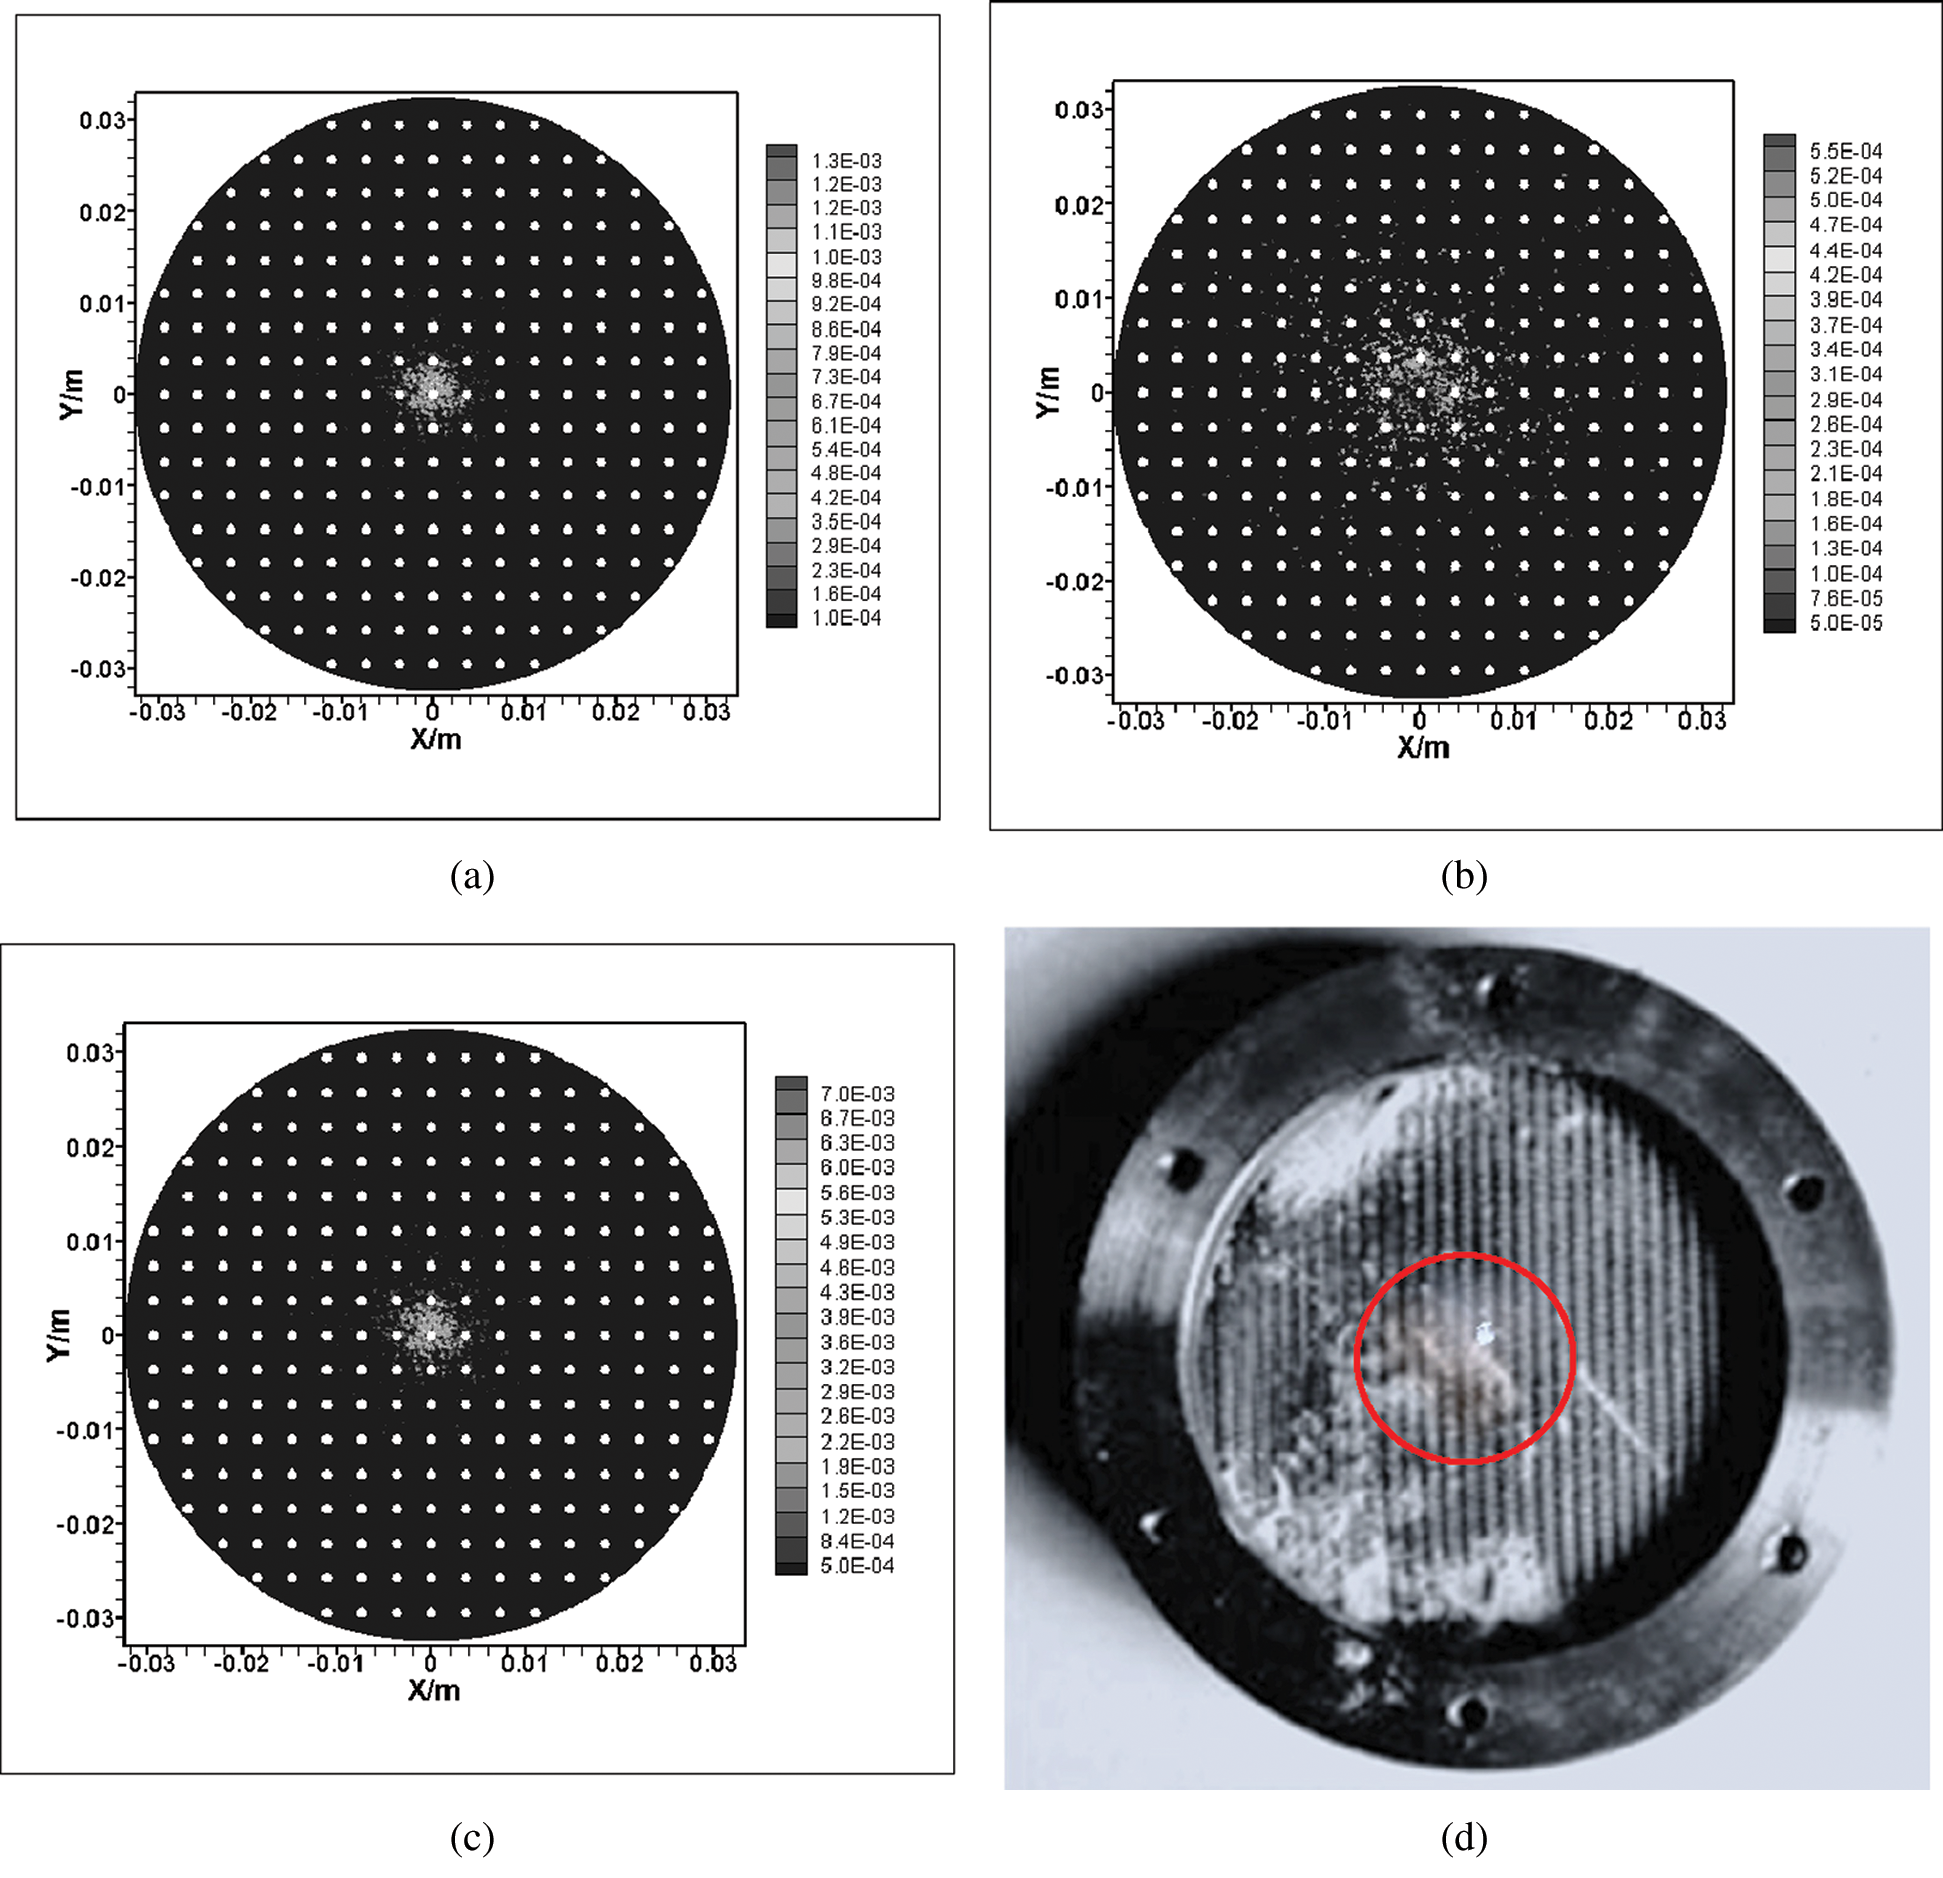
Figure 11: Erosion cloud (a) DNV (b) Zhang et al. (c) Oka et al. (d) Experimental erosion result
(2) Comparison of accuracy of various models
Fig. 12 shows the comparison of the calculated results of the three models with experimental data. We can see that a very noticeable trend was the steady decrease in the erosion mass loss with time passing. From the analyses of the three models, the Zhang et al. [6] model have a small error with the actual situation. It shows that Zhang et al. [6] model fits well with the actual situation and is suitable for the study in this paper.
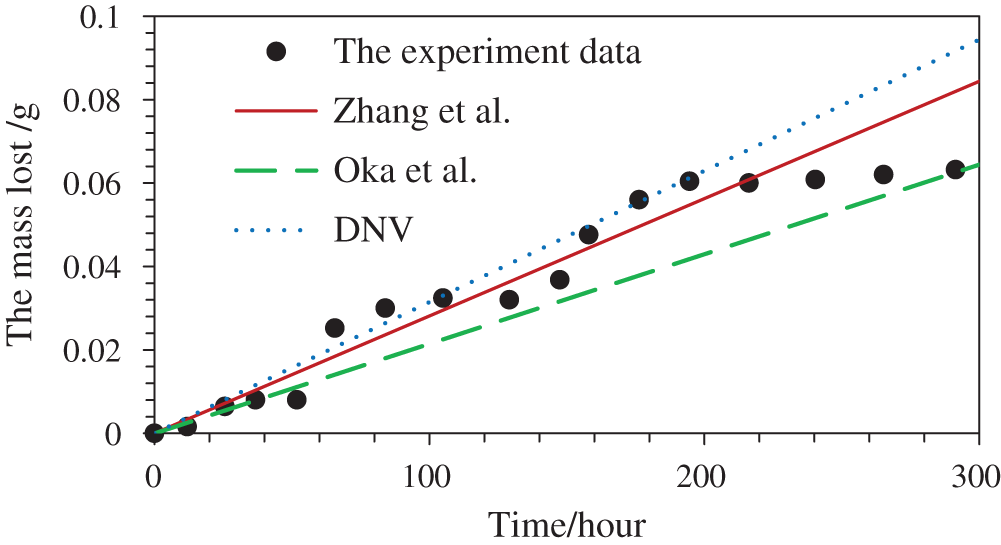
Figure 12: Comparison of accuracy of various models
(3) Comparison of erosion life prediction accuracy of various models
Comparing the three erosion models can be expressed as the following form:
Here,
According to certain failure quantification criteria, the above equation can be forwarded to life prediction model:
Here,
For the screen mesh of specific material, the average erosion rate of the screen tube can be obtained by CFD and the time t can be calculated to predict the service life of the screen tube.
The evaluation standard of screen failure was defined as 8% of the mass loss of metal screen [38,39]. Combined with the screen life prediction model, when the mass loss of single-layer screen is 8%, it indicates that the screen loses its sand control effect.
The comparisons of lifetime between the calculated results and measured data under the inlet of 0.4 m/s are shown in Fig. 13. From the comparison results of the measured values and the three pre the three erosion models, we find that the Zhang et al. [6] model is the nearest approximation of the measured values with the error less than 15%. The results of comparison indicate that the method selected in the present study has good performance and reliability for lifetime prediction of metal sand control screen.
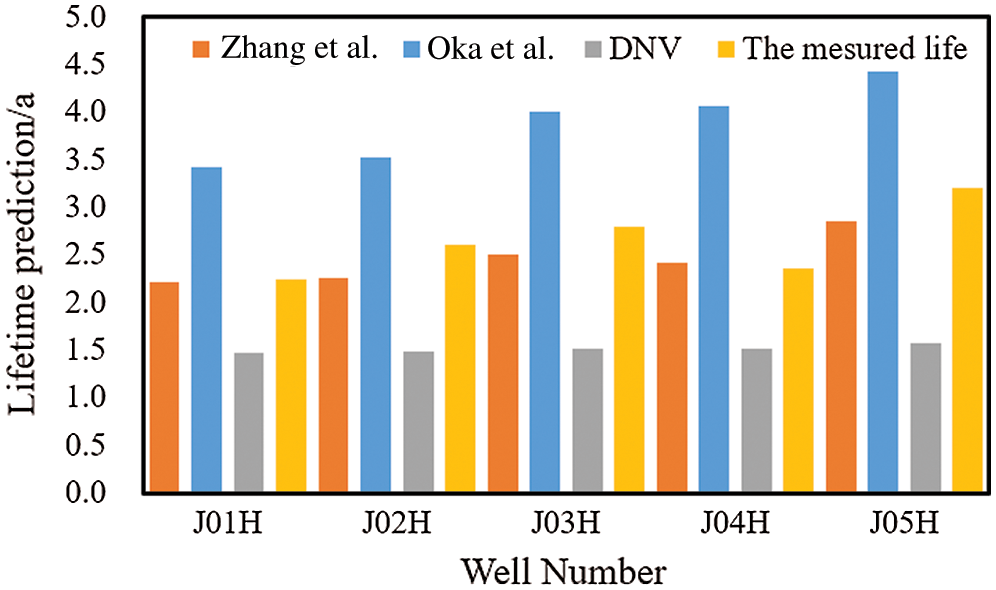
Figure 13: Comparison of erosion life prediction accuracy of various models
In the field of materials, there are a lot of studies on the erosion of abrasive impact targets, but it is very limited to use the research results in material field to explain the erosion failure mechanism of sand control screen due to the special working environment of sand control screen. Scholars at home and abroad have done a lot of work on the erosion failure of sand control screen, but the experimental device used cannot simulate the formation conditions. The existing research only explains the influence law of some factors in the erosion process based on the field data and some indoor experiments, and does not reveal the erosion failure mechanism of sand control screen. In this paper, based on flow field similarity theory, a simplified screen mesh model is proposed to solve the problem of its complex geometric structure. The results show that the simplified geometric screen model have high reliability, which can provide reference for the selection of underground screen mesh and the design of production process. However, this paper compares the experimental data of single-layer metal mesh with Zhang et al. [6] erosion model, and then compares the experimental data with Zhang et al. [6] model to further verify the accuracy of the simplified model. The main conclusions are as follows.
1. In this paper, the DNV model, Zhang et al. model and Oka et al. model are simulated and compared with the experimental data. The results of Zhang et al. [6] model have a small error with the actual situation. It shows that Zhang et al. model fits well with the actual situation and is suitable for the study in this paper.
2. Compared with the erosion nephograms of the three erosion models, the erosion points calculated by Zhang et al. model are more dispersed than those of the other two erosion models, and have a higher coincidence with the experiments. In addition, the comparison between Zhang et al. model predicted screen life and actual life is also studied. The results show that the predicted value is in good agreement with the measured value. The above results show that the optimized erosion model and the simplified geometric model of screen presented in this paper have certain reliability for the life prediction of screen, and can provide reference for the selection of underground screen and the design of production process.
Acknowledgement: The authors gratefully expressed their thanks for the financial supported by the Foundation of the National Natural Science Foundation of China (No. 51974033) and Educational Commission of Hubei Province of China (Q20191310, D20171305).
Funding Statement: The authors received funding from the National Natural Science Foundation of China (No. 51974033) (URL:http://www.nsfc.gov.cn/) and Educational Commission of Hubei Province of China (Q20191310, D20171305) (URL:http://jyt.hubei.gov.cn/).
Conflicts of Interest: The authors declare that there is no conflict of interests regarding the publication of this article.
1. Finnie, I., Mcfadden, D. H. (1978). On the velocity dependence of the erosion of ductile metals by solid particles at low angles of incidence. Wear, 48(1), 181–190. [Google Scholar]
2. Bitter, J. G. (1963). A study of erosion phenomena. Wear, 6(3), 169–190. [Google Scholar]
3. Levy, A. V. (1988). The erosion of structural alloys, cermets and insitu oxide scales on steels. Wear, 127(1), 31–52. DOI 10.1016/0043-1648(88)90051-8. [Google Scholar] [CrossRef]
4. Tilly, G. P. (1973). A two stage mechanism of ductile erosion. Wear, 23(1), 87–96. DOI 10.1016/0043-1648(73)90044-6. [Google Scholar] [CrossRef]
5. DNV RP-O501 (1996). Erosive wear in piping systems. [Google Scholar]
6. Zhang, Y., Reuterfors, E. P., McLaury, B. S., Rybicki, F. (2007). Comparison of computed and measured particle velocities and erosion in water and air flows. Wear, 263(1–6), 330–338. DOI 10.1016/j.wear.2006.12.048. [Google Scholar] [CrossRef]
7. Ahlert, K. R. (1994). Effects of particle impingement angle and surface wetting on solid particle erosion of AISI, 1018 steel (Ph.D. Thesis). Department of Mechanical Engineering, The University of Tulsa. [Google Scholar]
8. Oka, Y. I., Okamura, K., Yoshida, T. (2005). Practical estimation of erosion damage caused by solid particle impact: Part 1: Effects of impact parameters on a predictive equation. Wear, 259(1–6), 95–101. DOI 10.1016/j.wear.2005.01.039. [Google Scholar] [CrossRef]
9. Procyk, A., Gou, X., Marti, S. K., Burton, R. C., Knefel, M. et al. (2015). Sand control screen erosion: predi-ction and avoidance. SPE Annual Technical Conference and Exhibition. Houston, Texas (SPE Paper 174837-MS). [Google Scholar]
10. Rui, Z. A., Sha, B., Chong, Z. C., Wm, C., Gz, D. et al. (2020). Analysis and simulation of erosion of sand control screens in deep water gas well and its practical application. Journal of Petroleum Science and Engineering, 189, 106–112. [Google Scholar]
11. Deng, F., Sun, D., Sun, J., Wen, M., Wei, Y. (2019). Experimental simulation of erosion behavior of monolayer metal screen in sandstone reservoir. Engineering Failure Analysis, 105(3), 255–265. DOI 10.1016/j.engfailanal.2019.06.098. [Google Scholar] [CrossRef]
12. Roostaei, M., Nouri, A., Fattahpour, V., Mahmoudi, M., Izadi, M. et al. (2018). Sand control design throuh assessment of mathematical models representing particle size distribution of reservoir sands. SPE International Conference and Exhibition on Formation Damage Control. Lafayette, Louis-iana, SPE-189528-MS. [Google Scholar]
13. Salama, M. M., Venkatesh, E. S. (1983). Evaluation of API RP 14E erosional velocity limitations for offshore gas well. Proceedings of the 5th Annual Offshore Technology Conference. Houston: OTC4485. [Google Scholar]
14. Salama, M. M. (1998). An altenative to API 14E erosional velocity limits for sand-laden fluids. Proc. of the 30th Annual Offshore Technology Conf. Houston: OTC, 8898. [Google Scholar]
15. Evstifeev, A., Kazarinov, N., Petrov, Y., Witek, L., Bednarz, A. (2018). Experimental and theoretical analysis of solid particle erosion of a steel compressor blade based on incubation time concept. Engineering Failure Analysis, 87(4–5), 15–21. DOI 10.1016/j.engfailanal.2018.01.006. [Google Scholar] [CrossRef]
16. Garrido, M. Á., Sirvent, P., Elvira, D., Rico, Á., Múnez, C. J. et al. (2018). Response of coldsprayed ti6al4v coatings to solid particle erosion and micro-scratch wear processes. Materials Science Forum, 941, 1680–1685. DOI 10.4028/www.scientific.net/MSF.941.1680. [Google Scholar] [CrossRef]
17. Pyboyina (2006). Experimental investigation and computational fluid dynamics simulations of erosion on electrical resistance probes. USA: University of Tulsa. [Google Scholar]
18. Evans, T., Bennett, H., Sun, Y., Alvarez, J., Babaiankibala, E. et al. (2004). Studies of inhibition and monitoring of metal loss in gas systems containing solids. New Orleans: NACE Intermational. [Google Scholar]
19. Chen, X., McLaury, B. S., Shirazi, S. A. (2006). Numerical and experimental investigation of the relative erosion severity between plugged tees and elbows in dilute gas/solid two-phase flow. Wear, 261(7–8), 715–729. DOI 10.1016/j.wear.2006.01.022. [Google Scholar] [CrossRef]
20. Deng, F., Deng, J., Hu, L., Yu, B., Qiang, T. et al. (2014). Simulation research on the erosion of slotted screen for the unconsolidated sand formation. Arabian Journal for Science and Engineering, 39(6), 5237–5243. DOI 10.1007/s13369-014-1205-5. [Google Scholar] [CrossRef]
21. Espitia, L. A., Dong, H., Li, X. Y., Pinedo, C. E., Tschiptschin, A. P. (2015). Cavitation erosion resistance and wear mechanisms of active screen low temperature plasma nitrided aisi 410 martensitic stainless steel. Wear, 332–333, 1070–1079. DOI 10.1016/j.wear.2014.12.009. [Google Scholar] [CrossRef]
22. Mondal, S., Wu, C. H., Sharma, M. M., Chanpura, R. A., Parlar, M. et al. (2016). Characterizing, designing, and selecting metal mesh screens for standalone-screen applications. SPE Drilling & Completion, 31(2), 085–094. DOI 10.2118/170935-MS. [Google Scholar] [CrossRef]
23. Preziosi, L., Fransos, D., Bruno, L. (2015). A multiphase first order model for non-equilibrium sand erosion, transport and sedimentation. Applied Mathematics Letters, 45, 69–75. DOI 10.1016/j.aml.2015.01.011. [Google Scholar] [CrossRef]
24. Liu, H., Yang, W., Kang, R. (2018). A correlation for sand erosion prediction in annular flow considering the effect of liquid dynamic viscosity. Wear, 404–405, 1–11. DOI 10.1016/j.wear.2018.02.011. [Google Scholar] [CrossRef]
25. Chang, C. S., Meidani, M., Deng, Y. (2017). A compression model for sand-silt mixtures base on the concept of active and inactive voids. Acta Geotechnica, 12(6), 1301–1307. [Google Scholar]
26. Saeed, F., Al-Garni, A. Z. (2007). Analysis method for inertial particle separator. Journal of Aircraft, 44(4), 1150–1158. DOI 10.2514/1.20245. [Google Scholar] [CrossRef]
27. Foster, M. A., Anderson, R. S., Wyshnytzky, C. E., Ouimet, W. B., Dethier, D. P. et al. (2015). Hillslope lowering rates and mobile-regolith residence times from in situ and meteoric 10Be analysis, Boulder Creek Critical Zone Observatory. Colorado Geological Society of America Bulletin, 127(5–6), 862–878. DOI 10.1130/B31115.1. [Google Scholar] [CrossRef]
28. Lewis, M. J., Neill, S. P., Elliott, A. J. (2015). Interannual variability of two offshore sand banks in a region of extreme tidal range. Journal of Coastal Research, 300(2), 265–275. DOI 10.2112/JCOASTRES-D-14-00010.1. [Google Scholar] [CrossRef]
29. Wu, W., Perera, C., Smith, J., Sanchez, A. (2017). Critical shear stress for erosion of sand and mud mixtures. Journal of Hydraulic Research, 58(3), 548–550. [Google Scholar]
30. Wu, B., Yan, H., Zhang, J. (2009). Numerical simulation and performance study on 3-D turbulence forecast of slurry pump. China Mechanical Engineering, 20(5), 585–589. [Google Scholar]
31. Shi, B., Wei, J. (2014). Numerical simulation of 3D solid-liquid turbulent flow in a low specificspeed centrifugal pump: Flow field analysis. Advances in Mechanical Engineering, 6, 678271. [Google Scholar]
32. Zhou, H., Gao, H., Fang, Z., Yang, J., Wu, M. et al. (2020). Analysis of gas-solid flow characteristics in a spouted fluidized bed dryer by means of computational particle fluid dynamics. Fluid Dynamics & Materials Processing, 16(4), 813–826. [Google Scholar]
33. Suri, Y., Stephen, K., Donald, C., Thompson, M., Droubi, M. G. (2020). Numerical fluid flow modelling in multiple fractured porous reservoirs. Fluid Dynamics & Materials Processing, 16(2), 245–266. [Google Scholar]
34. Vasquez, S. A., Ivanov, V. A. (2020). A phase coupled method for solving multiphase problemson unstructured meshes. Proceedings of ASME FEDSM100: 2000 Fluids Engineering Division Summer Meeting. Boston. [Google Scholar]
35. Hashish, M. (1988). Visualization of the abrasive-waterjet cutting process. Experimental Mechanics, 28(2), 159–169. [Google Scholar]
36. Zhang, Y. H., Huang, H., Ren, L. Q. (2014). Erosion wear experiments and simulation analysis on bionic anti-erosion sample. Science China Technological Sciences. [Google Scholar]
37. Hopkins, R. H., Kramer, W. E., Brandt, G. B., Schruben, J. S., Hoffman, R. A. et al. (1978). Fabrication and evaluation of erosion-resistant multispectral optical windows. Journal of Applied Physics, 49(6), 3133–3139. [Google Scholar]
38. Wetzel, R. J., Fuller, M. J. (2017). Sand control device and methods for identifying erosion. United States Patent Application, 168–173. [Google Scholar]
39. Gillespie, G., Beare, S. P., Jones, C. (2009). Sand control screen erosion-when are you at risk? The 8th European Formation Damage Conference, Scheveningen, The Netherlands. [Google Scholar]
 | This work is licensed under a Creative Commons Attribution 4.0 International License, which permits unrestricted use, distribution, and reproduction in any medium, provided the original work is properly cited. |