Materials Processing
| Fluid Dynamics & Materials Processing |
DOI: 10.32604/fdmp.2021.012106
ARTICLE
A Computational Study on the Effect of Bifurcation Lesions with Different Structures on Blood Velocity and Temperature
Vehicle Engineering, College of Engineering, China Agricultural University, Beijing, 100083, China
*Corresponding Author: Zhizhu He. Email: zzhe@cau.edu.cn
Received: 15 July 2020; Accepted: 07 February 2021
Abstract: Treating coronary bifurcation stenosis is still a challenging task. Existing procedures still display a relatively small rate of success. This paper aims to investigate numerically the effect of bifurcation lesions with different structures on the dynamics of blood flow and related temperature. The problem geometry is parametrically varied by changing the bifurcation angle and radius. A finite volume method is used to simulate the three-dimensional flow. The effects induced by the structure of the stenosis, the artery bifurcation angle and radius, and the inlet velocity of blood are discussed in terms of flow pattern, pressure distribution, and shear stress at the blood wall. The heat transfer from the solid tissue is also determined for different stenosis configurations. The present study has been conducted with the explicit intention to generate useful data for the development of methods curing the vascular stenosis with thermal ablation.
Keywords: Bioheat transfer; arterial bifurcation; stenosis; blood thermal effect
Cardiovascular disease induced by bifurcation lesions is one of leading causes of death in humans, which remains a significant challenge for its treatment due to a higher risk of restenosis [1]. Many lesions located on the blood vessel were induced by the combined effect of hemodynamics and physiologic process, which often affects the plaque and stenosis formation, such as a chronic disease of atherosclerosis [2]. The domains near branch points and the outer wall of bifurcation with low shear stress are often lesions appearances, such as aneurysms [3] and stenosis [4,5]. The local hemodynamic forces play a fundamental role in the lesion formation [6], which impacts the localization and progression of particle sedimentation and plaque formation [7]. The blood computational fluid dynamics is an essential tool to be used for investigating the formation mechanism of the plaque, which would be a benefit for better clinical outcomes [8,9].
In the past, there has been a variety of studies to investigate the impact of blood vessel bifurcation on blood fluid dynamics [10] and heat transfer. Chiastra et al. [11] have applied the computational fluid dynamics method to study the influence of the bifurcation angle on the coronary fractional flow, which indicates that the side-branch pressure drop becomes high for a larger bifurcation angle. Cutri et al. [12] have studied the drug delivery mechanism for different stenting techniques in coronary bifurcations through fluid dynamics simulation. Otero-Cacho et al. [13] have investigated the determination of hemodynamic risk for vascular disease in planar artery bifurcations through numerical simulation method and the experiments based on the microchannel. The results indicated that the low-velocity regions and low shear stress zones are located near bifurcations’ outer walls. The work from Hossain et al. [14] have focused on the external magnetic field’s impacts on the interaction between the flexible membrane wall and flowing nanofluid in a collapsible arterial network, where the stenosis structure was considered. Santabrata Chakravarty et al. [15] have investigated the dynamic response of heat and mass transfer to blood streaming through the arteries under stenotic conditions, while they have not considered the vessel bifurcation. Wang et al. [16] have found that fractal vascular trees have an important effect on tissue temperature and intracellular ice formation during the combined cryosurgery and hyperthermia for cancer therapy. In addition, Zheng et al. [17] have studied the thermal effects of bifurcation on the iceball morphology during cryosurgery. Recently, Zhang et al. [18] investigated the impact of a bifurcation structure on the heat transfer and temperature distribution of pulsatile blood flow.
The bifurcated artery with stenosis has a complicated structure, which would lead to more complex blood flow distribution, and induce the heterogeneous heat transfer surrounding bifurcation stenosis. As is well known, less investigation contributes to the effects of bifurcation stenosis on both the temperature response and blood flow pattern. In the present study, a parametric geometry model is introduced to construct a close-to-real arterial bifurcation with different bifurcation angle and radius. The three-dimensional flow dynamics and heat transfer simulation model is developed through the finite volume method. The discussion was then made on the effects of stenosis structure, artery bifurcation and the inlet velocity of the root artery on the blood flow pattern, pressure distribution and shear stress at the blood wall, respectively. In addition, the heat transfer from the solid tissue was also investigated for different stenosis structure.
2 Geometry and Mathematical Model
The arterial bifurcation of the blood vessel, including the main vessel and two branch vessels, is determined by a parametric geometric model [19], which could characterize realistic configuration of arterial bifurcation. The different arterial bifurcation structures are given in Fig. 1.
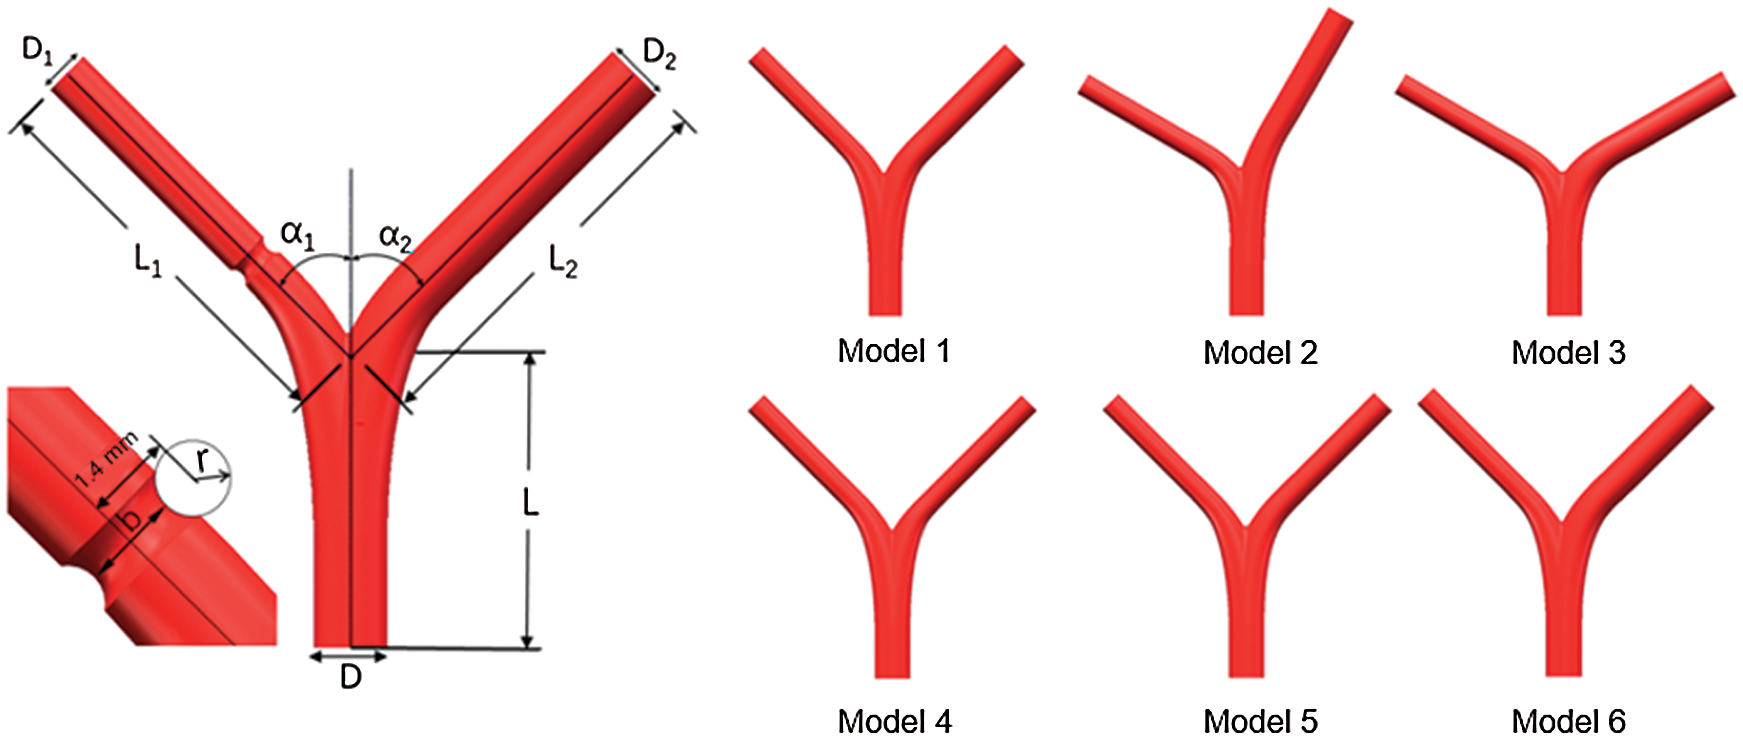
Figure 1: Schematic of the bifurcated artery and computational field
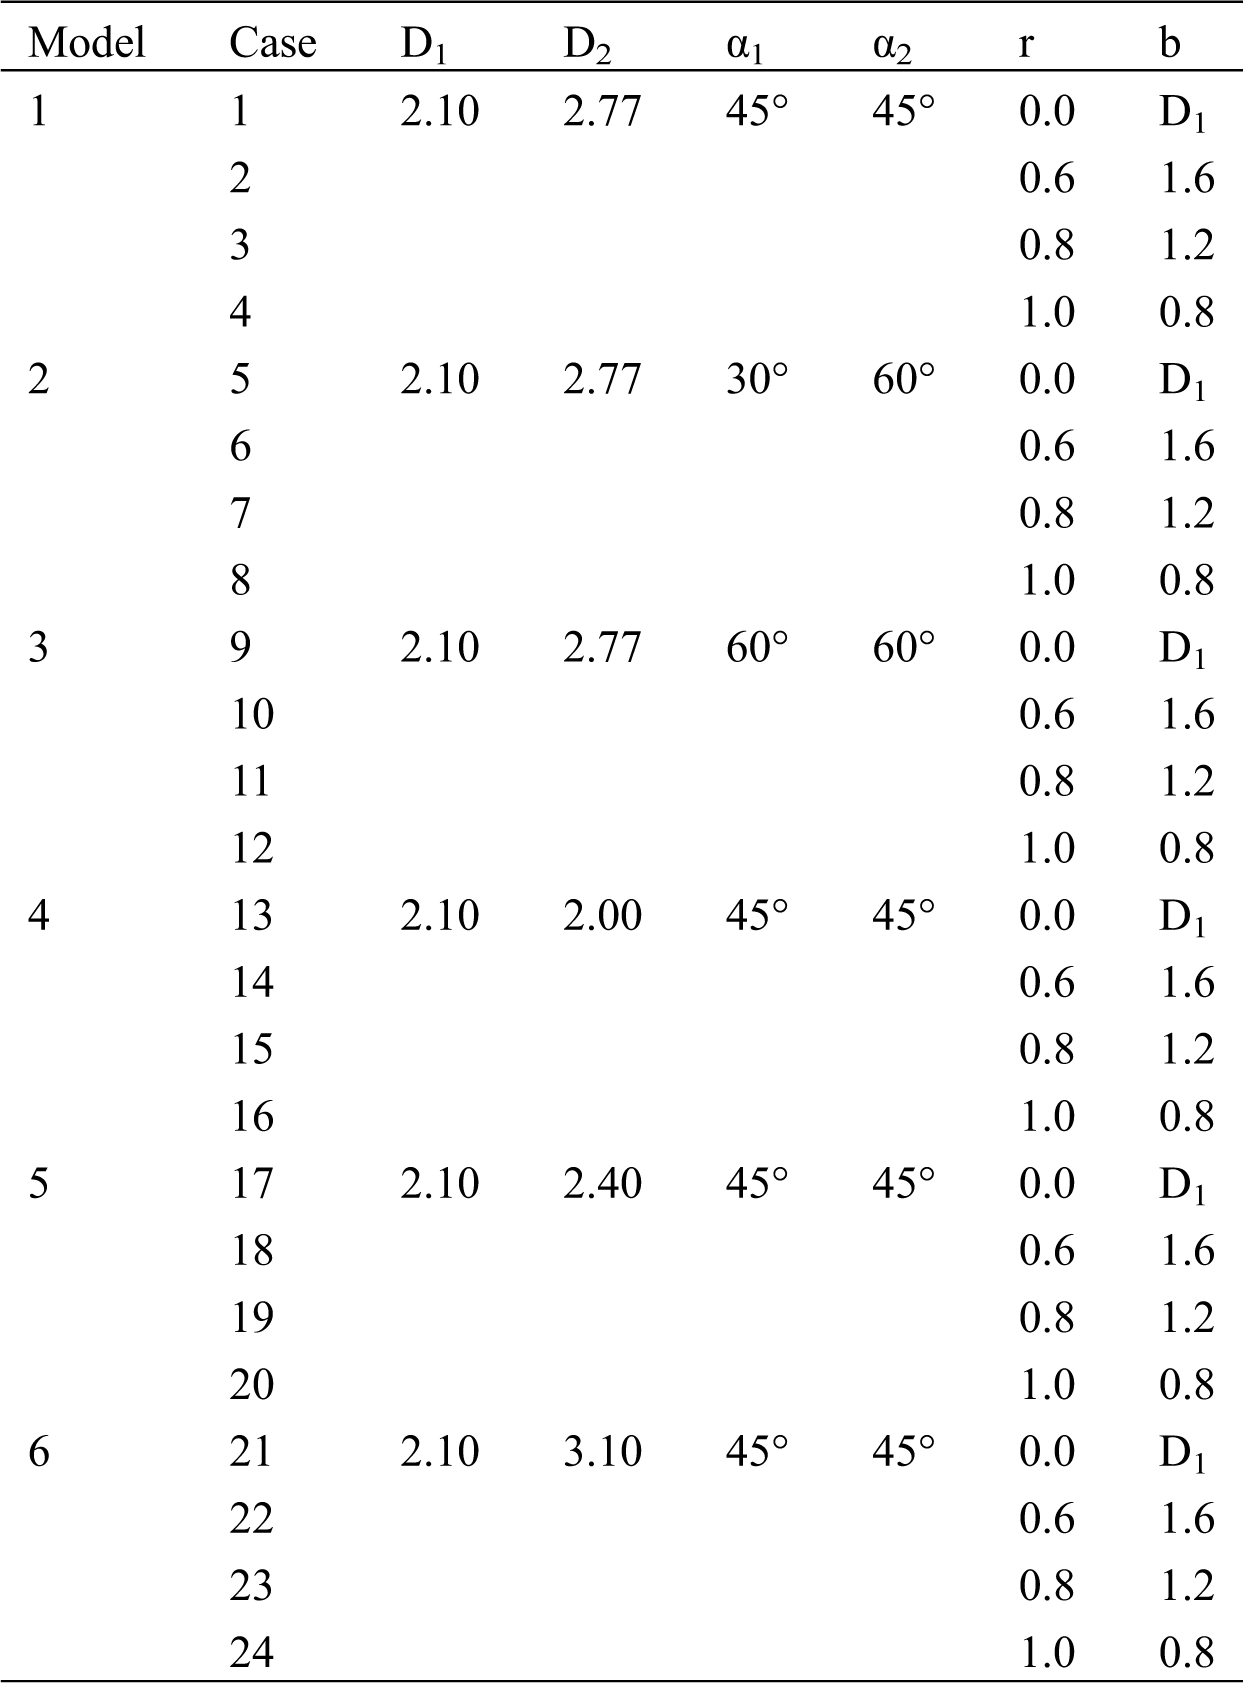
The main vessel is considered with diameter D = 3.30 mm and length L = 13 mm, the left branch (LB) vessel length has L1 = 18 mm and right branch vessel diameter with length L2 = 18 mm, respectively. In addition, two branches of angles are set as α1 and α2, respectively. The lesion is cut with a circular scan of radius r [20]. The minimum diameter of the stenosis is noted by b, and the radius r is 0, 0.6 mm, 0.8 mm, and 1.0 mm, respectively. Thus, the minimum diameter b corresponds to 2.1 mm. 1.6 mm, 1.2 mm, and 0.8 mm, respectively. Six different models are created by changing the parameters, and each model corresponds to four other lesions, as shown in Tab. 1.
Table 1: Parameter example (unit: mm)
2.2 Fluid Dynamics Simulation Method
In this paper, the commercial software of ANSYS-FLUENT was used to model the mass conservation, momentum conservation, and energy conservation equations of blood, described by
where ρ denotes the blood density, μ for its viscosity and k for the thermal conductivity. The blood is considered an incompressible viscous Newtonian fluid. The non-slip boundary condition is assumed at the blood wall, the aortic blood inlet flow rate is set as 0.2 m/s [20], and the outlet condition is given by mass outflow. For the temperature field, the inlet temperature is assumed as the constant as needed.
The unstructured mesh through ANSYS-ICEM is considered here, where the geometry models were established from software of Solidworks. The fluid dynamics of blood is set as a laminar type. The density of blood is set to 1050 kg/m3, and the viscosity of blood is 0.0035 Pa·s. The time-independent blood flow field is solved though using the SIMPLE algorithm, and the stable temperature field through the second-order upwind algorithm is obtained [17]. The mesh quality significantly affects the simulation results, while the excessively small mesh size would lead to high computing resources needed. All the test cases are carried out with the same computer configuration (CPU: E5-2650@2.3 GHz; Memory size: 64 GB). In order to verify the accuracy of CFD model, the comparison of the experiment results of Gijsen et al. [21] at Re = 270 with that from our simulation method is conducted, which indicates that our CFD model is accurately consistent with the experiment results as presented in Fig. 2. In order to further ensure the calculation accuracy and computational speed, local encryption is considered to meet the calculation accuracy of the lesion and the bifurcation, as shown in Fig. 3.
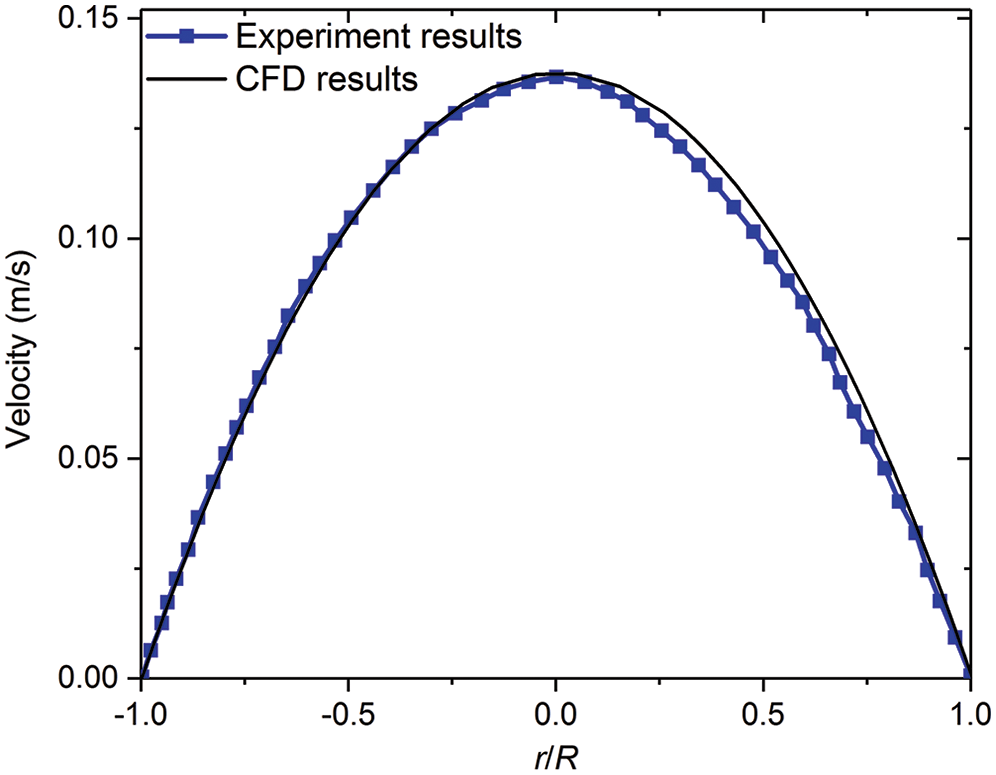
Figure 2: Comparing axial velocity on a line segment at a root vessel (D = 8 mm) with experimental results of Gijsen et al. [21]
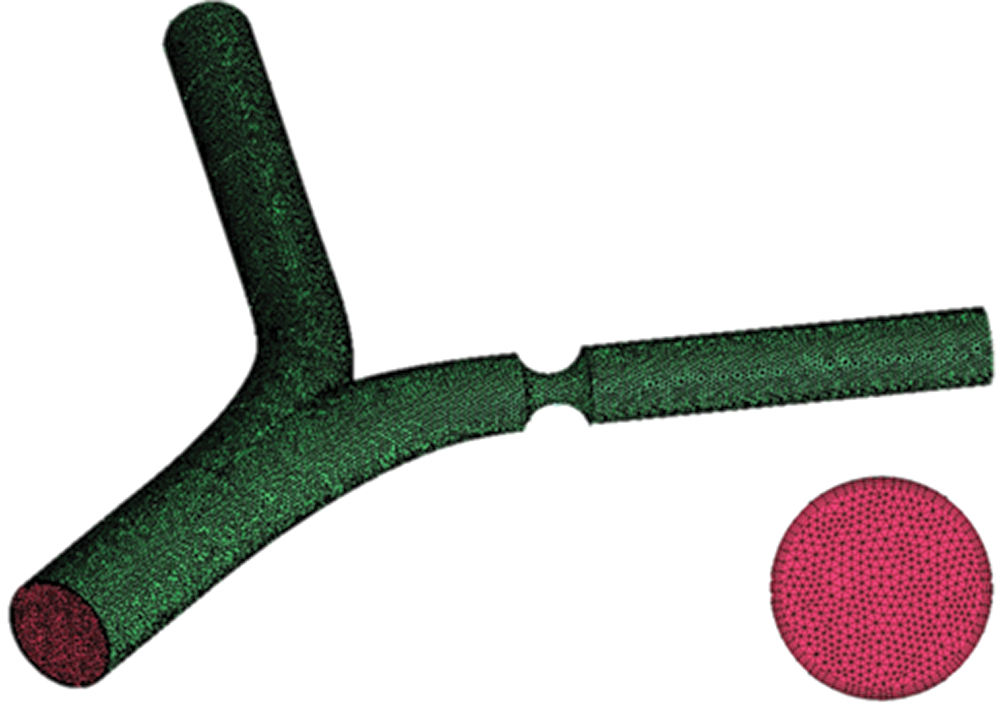
Figure 3: Grid and boundary layer diagram
The grid independence results are shown in Tab. 2, which has indicated that the total number of meshes for each model is between 8 × 10⁵ and 12 × 105, obtaining accurate numerical results (relative errors of blood velocity is smaller than 2%).
Table 2: The grid independence results

The flow ratio is calculated by the following formula [22,23]:
where Q1 and Q2 are the flow rates of the diseased bifurcation vessel and the main bifurcation vessels, respectively. For Model 1-3, the calculated flow distribution ratio is set as 35%: 65%. In order to further study the flow rate effects, other two flow ratios 30%: 70% and 40%: 60% are taken into accounts. The calculated flow rates for Models 4, 5 and 6 are set as 53%: 47%, 42.5%: 57.5% and 29%: 71%, respectively.
Fig. 4 shows the flow field contours of Model 1 at different flow ratios with varying sizes of stenosis. The blood has a high flow velocity at the center of the blood vessel. The blood velocity distribution of the two-branched vessels was mainly determined by the flow ratios and the vessel radius for the normal blood vessels. It is also noteworthy that the low blood velocity domains were found near the bifurcation wall [11]. When the stenosis occurs at the left branch (LB) vessel, the blood velocity at the lesion is significantly increased. When the stenosis degree increases, the blood flow velocity in the same section is more uneven, which may lead to the deposition of impurities on the wall surface and aggravate the disease.
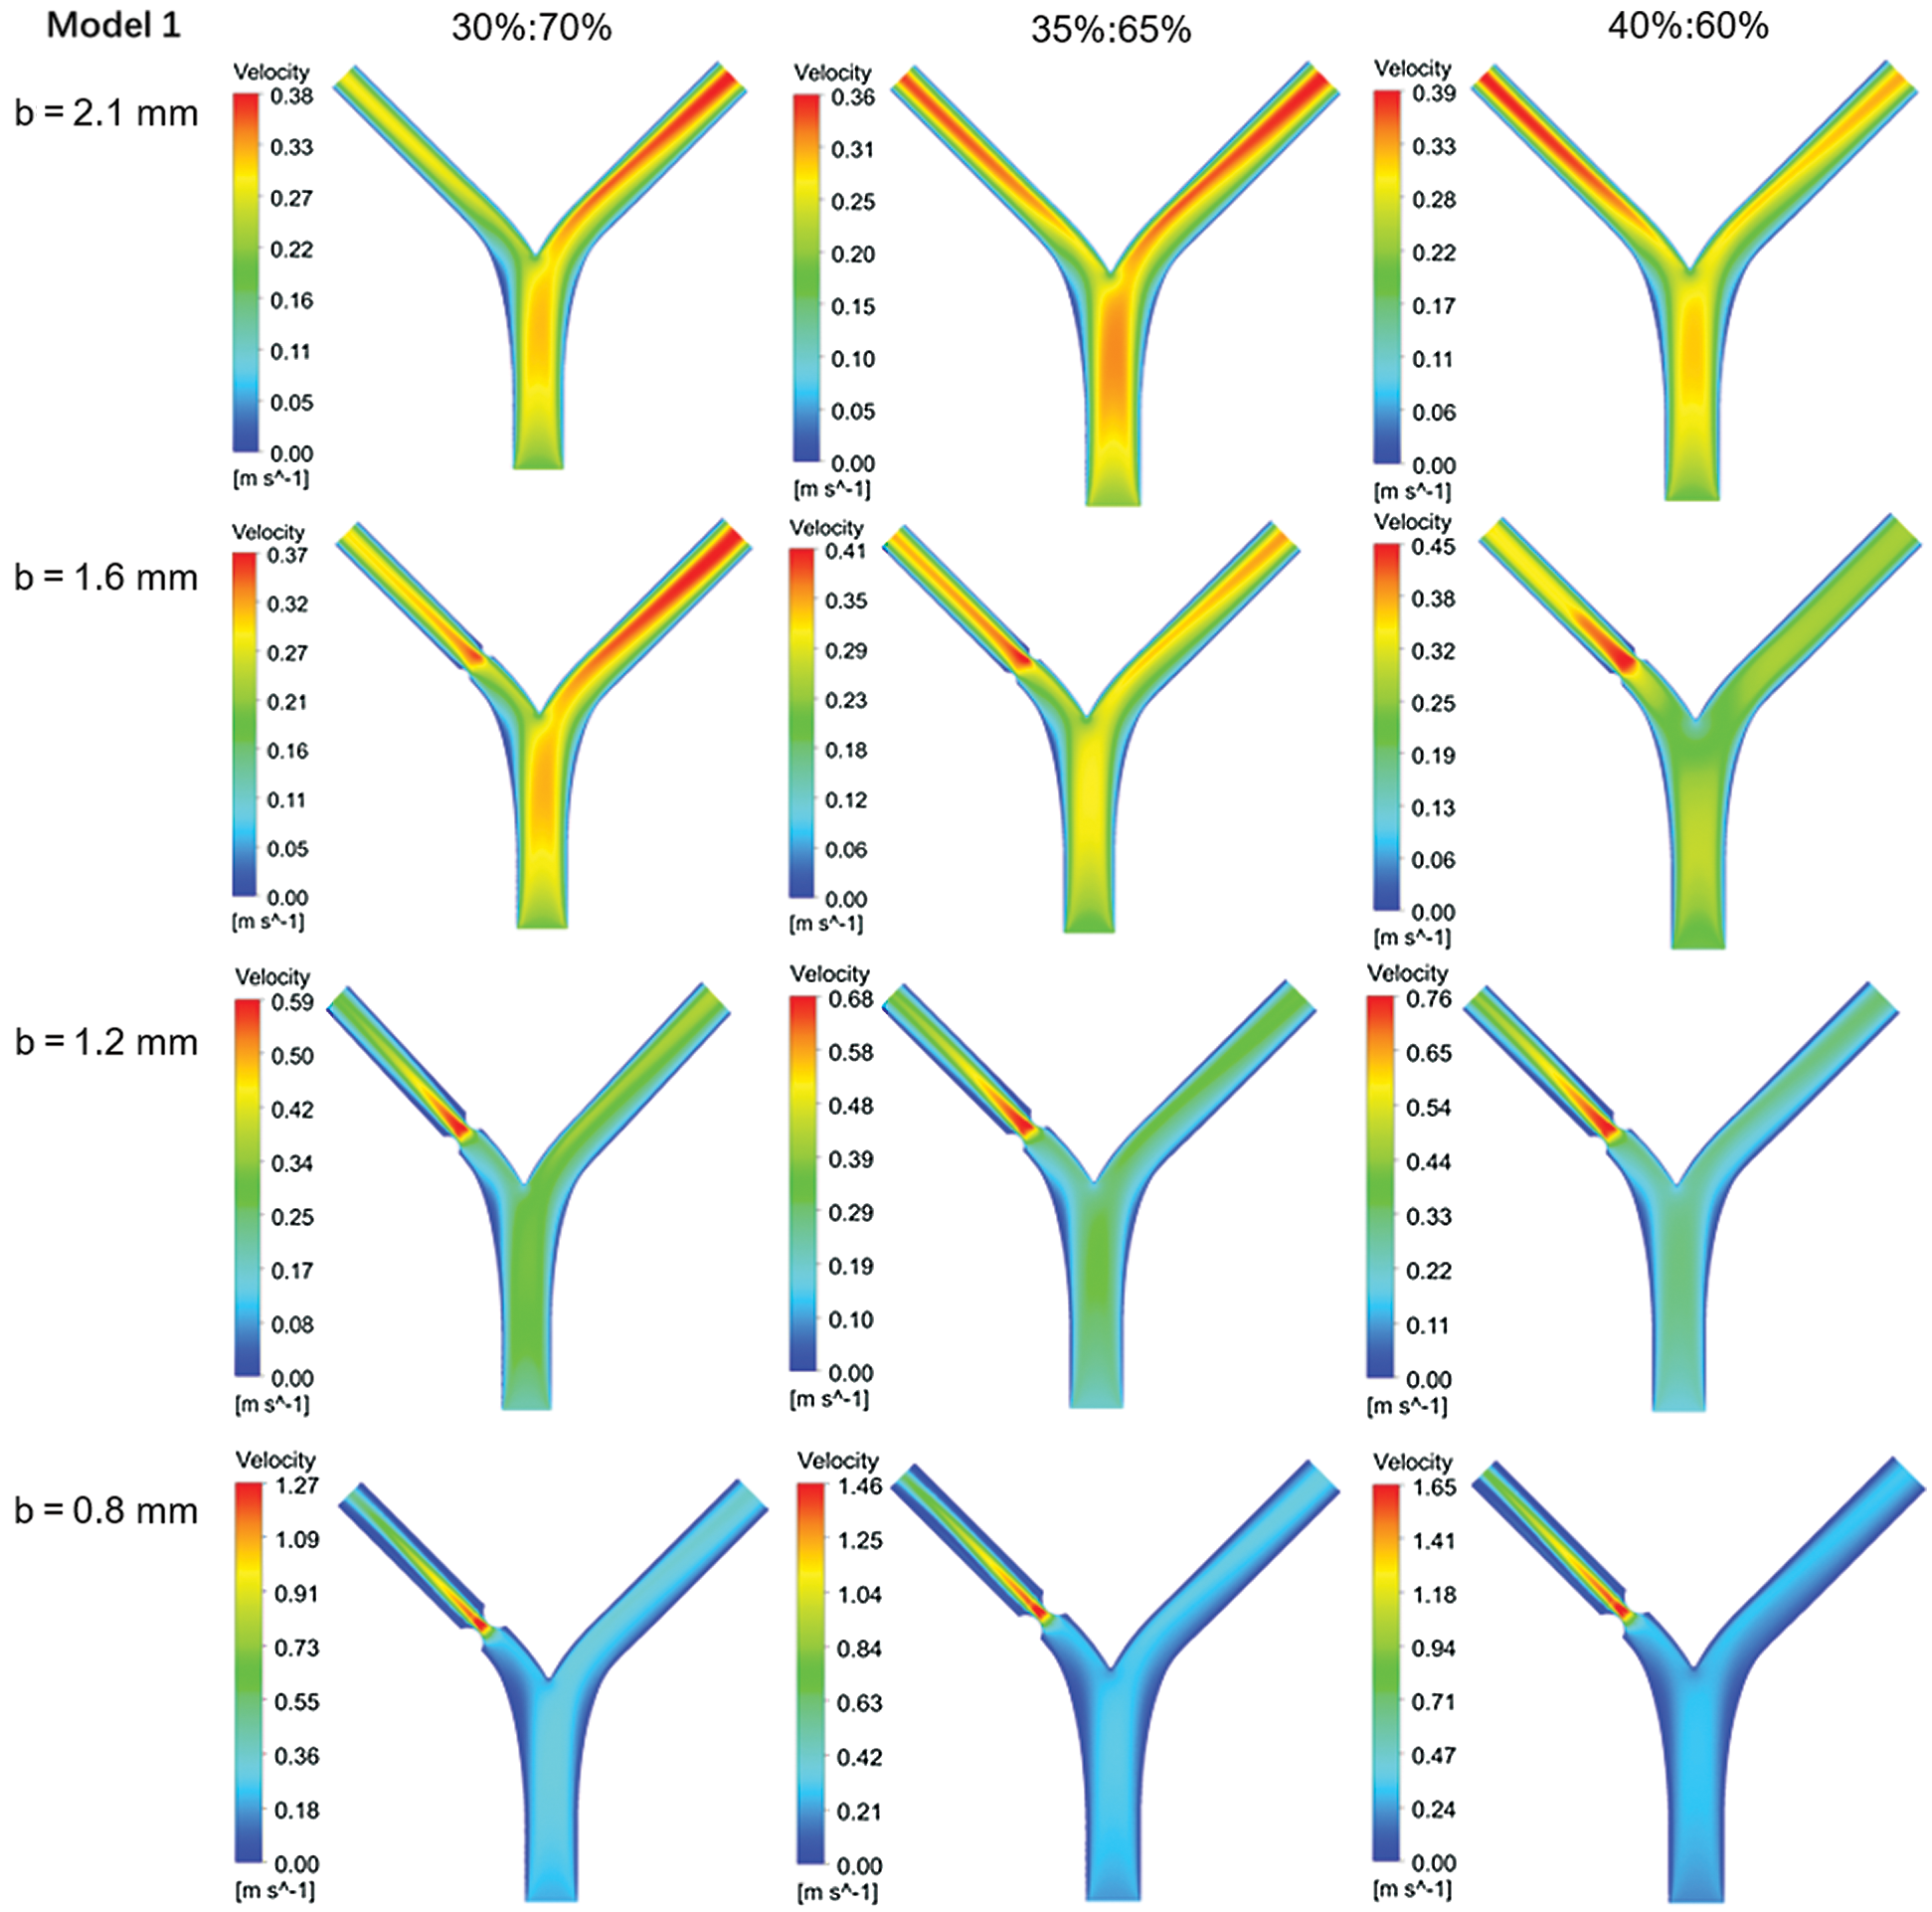
Figure 4: Flow rate contours of Model 1 with different flow distribution
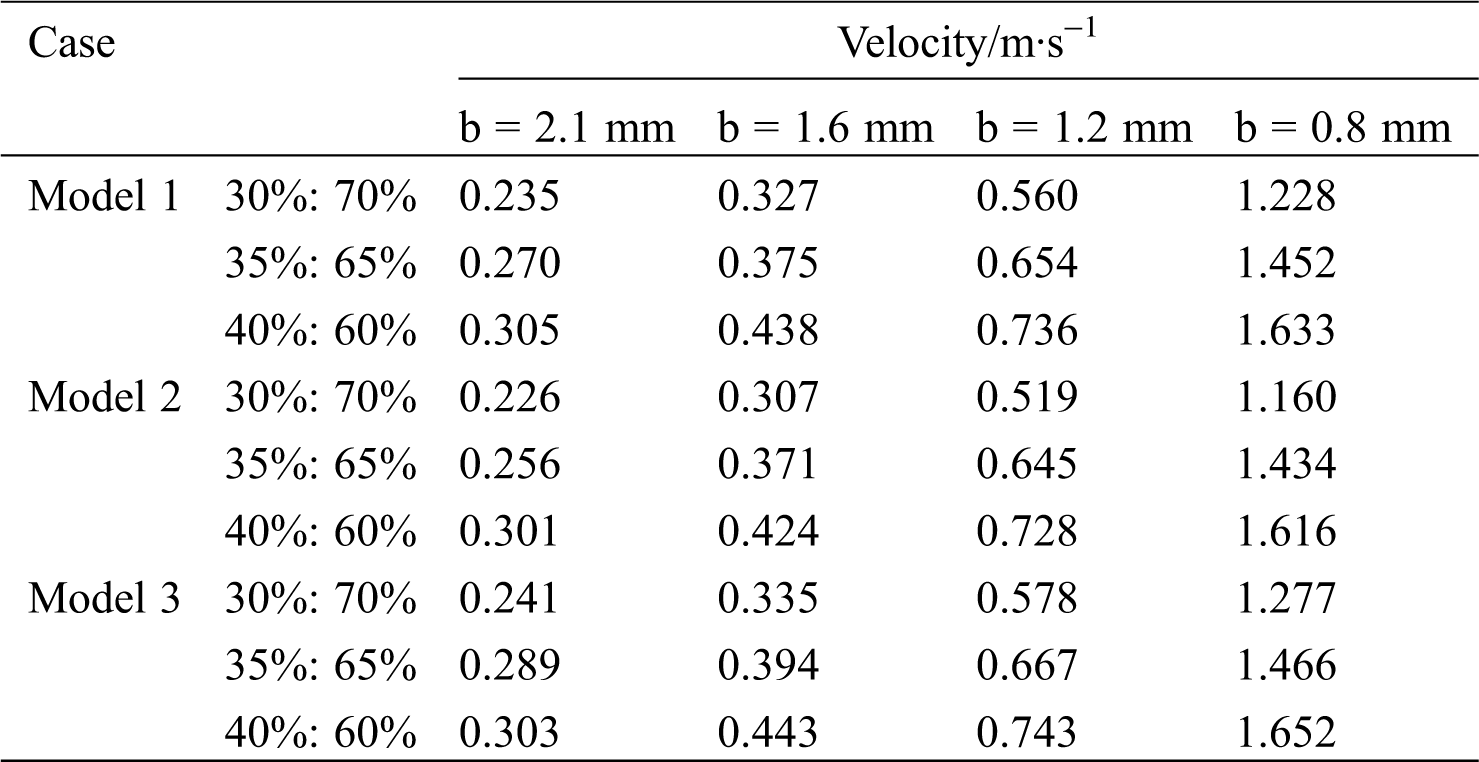
As the minimum diameter b decreases, the maximum flow velocity of the blood increases. Taking Model 1 as an example, with a flow ratio of 35%:65%, the maximum flow rate of non-lesion blood is 0.36 m/s. However, when b is 0.8 mm, the maximum flow rate of blood reaches 1.46 m/s, which occurs at the lesion. Tab. 3 shows the blood flow rate at the center of the lesion. At the same flow ratio, the change in the bifurcation angle has less effect on the flow rate of the point. Model 2 (60o–30o) has a lower blood flow velocity at the central point of the lesion compared to Model 1 (45o–45o). The flow rate of Model 3 (60o–60o) is the largest among them.
Table 3: Blood flow rate at the center of the lesion
The pressure drops Δp1 = p0–p1 is considered the difference between inlet pressure p0 and LB outlet pressure p1, while the pressure drops Δp2 = p0–p2 set as the difference between inlet pressure p0 and RB outlet pressure p2. Figs. 5a–5c) shows the pressure drop of Models-1~3 at three flow rates, respectively. Fig. 5d shows the pressure drop in different RB diameters of D2. The pressure drop Δp2 is independent of the stenosis diameter b, and the change of minimum b hardly affects the pressure drop at the LB outlet. However, the pressure drops Δp1 increases as b decreases. As shown in Fig. 4a, Model-1 with the flow ratio is 35%:65%, the pressure drop Δp1 reaches 0.88 mmHg for b=2.1 mm. When b=0.8 mm, the pressure difference between the two ends reaches 6.76 mmHg. As the diameter b decreases, the rate of pressure drop rise increases. As shown in Fig. 5b for Model-2 under the flow ratio of 35%:65%, the pressure drop Δp1 increases by 0.64 mmHg in the process of the diameter b decreasing from 1.6 mm to 1.2 mm; and Δp1 increases by 5.42 mmHg in the process of b reducing from 1.2 mm to 0.8 mm.
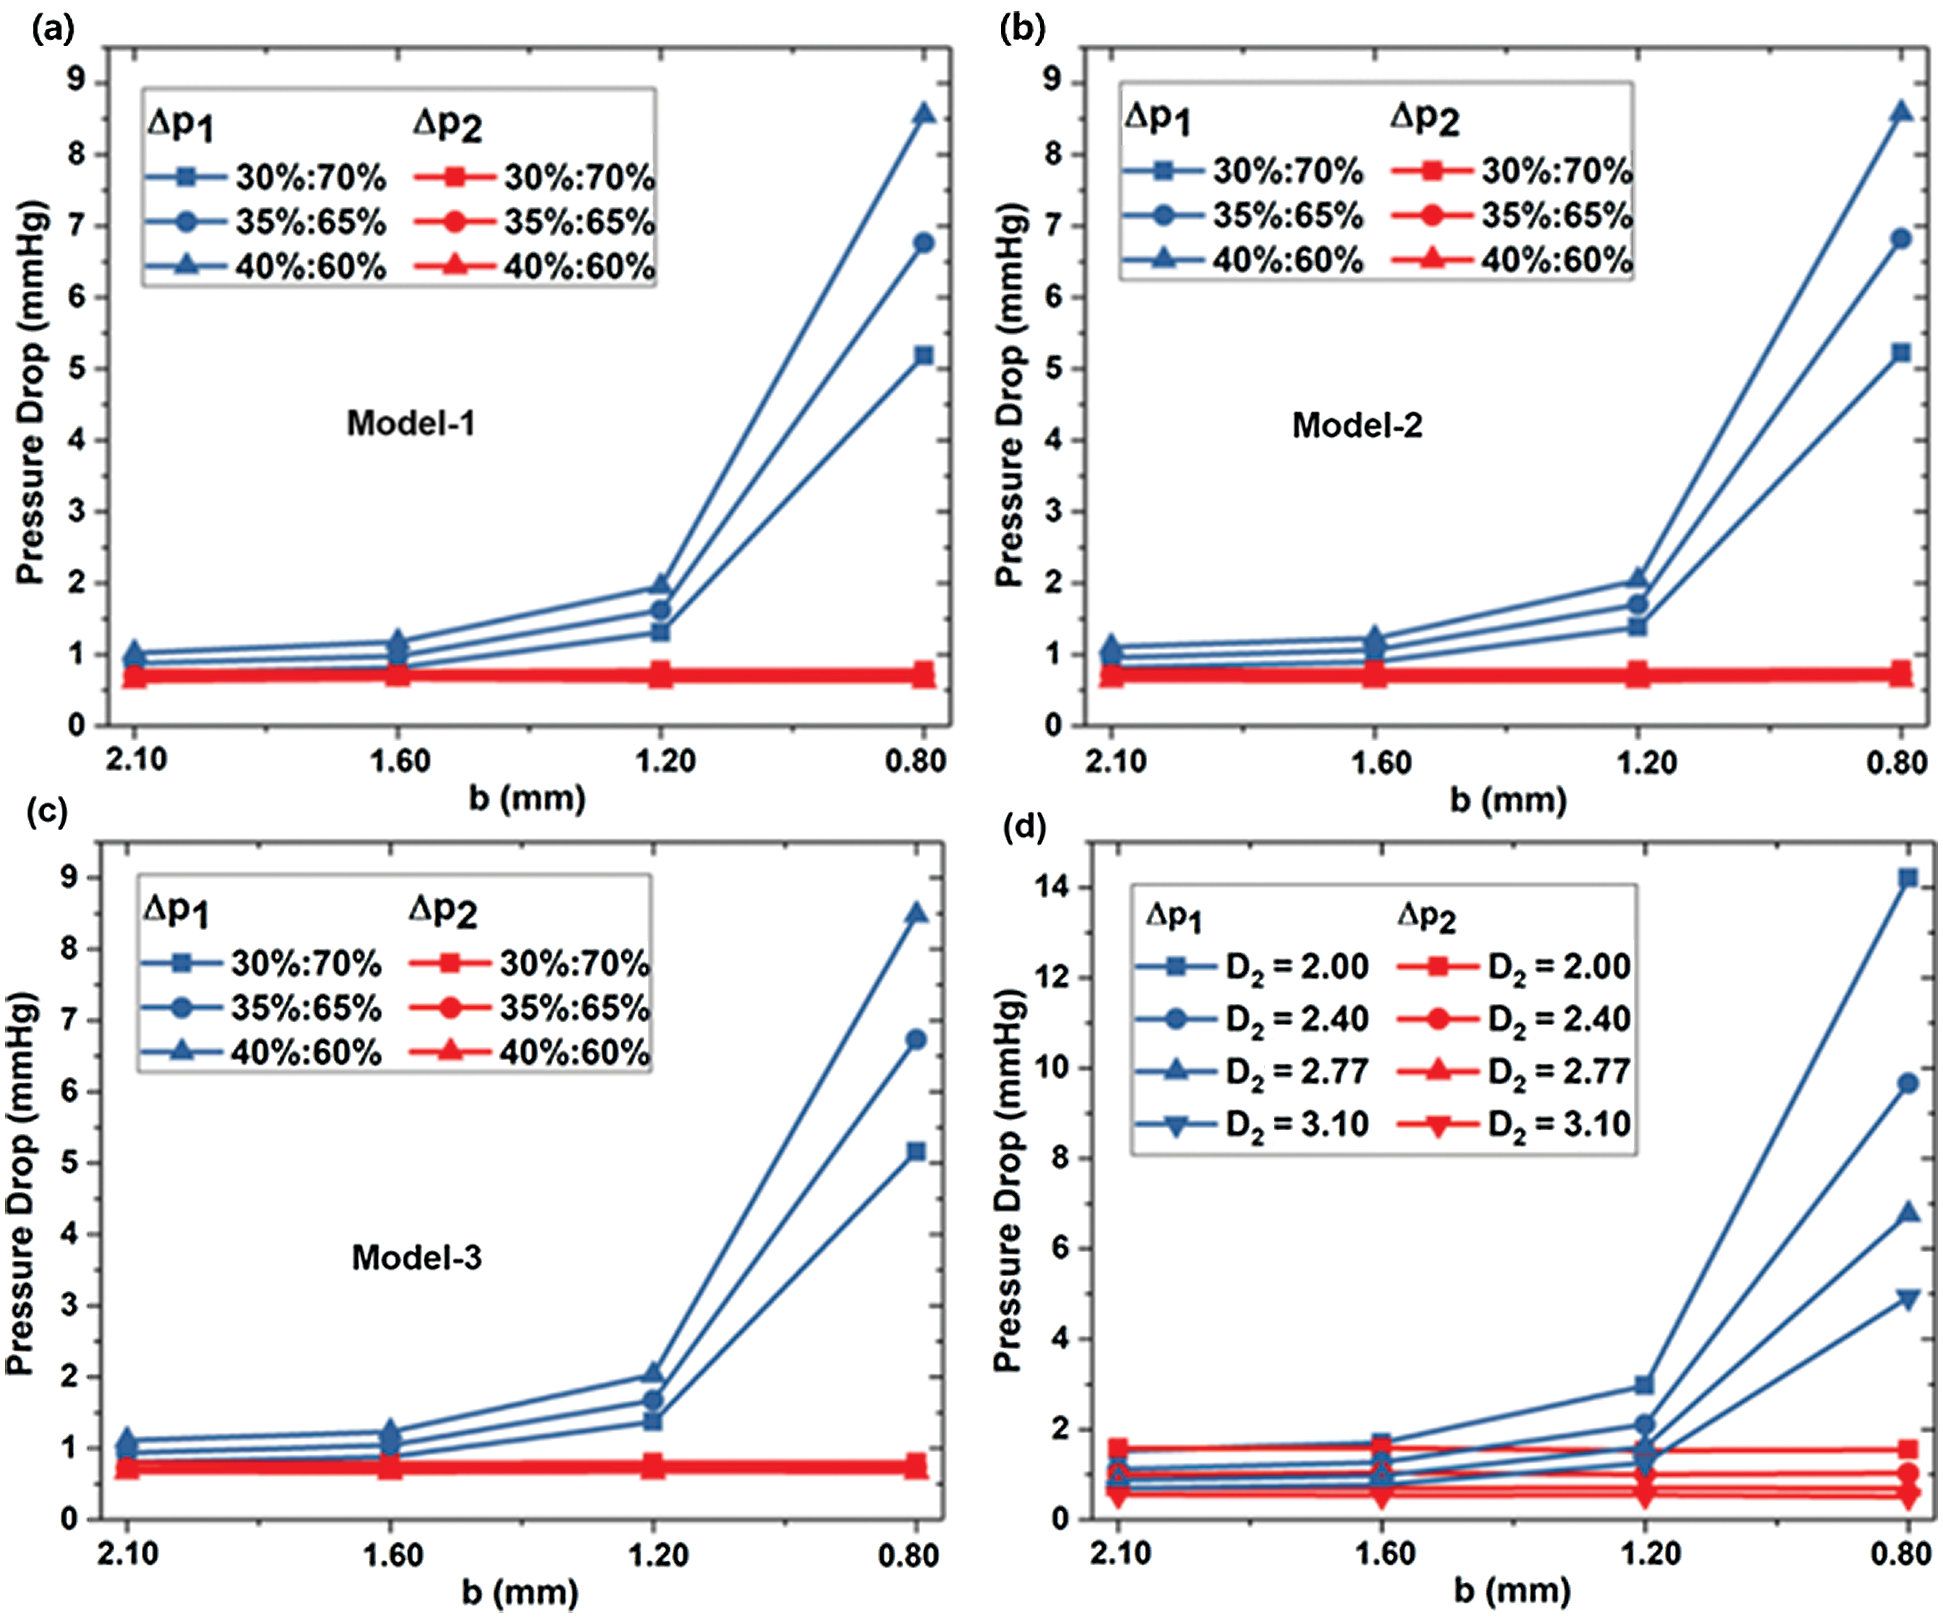
Figure 5: The dependence of pressure drops on stenosis sizes in different models (a) Model-1, (b) Model-2 and (c) Model-3, and for different D2
Fig. 6 shows the relative intravascular pressure distribution of Models 1–3 at different b under a standard flow ratio of 35%:65%. Because of the diameter b reducing, the inlet pressure at lesion is higher. The outlet pressure at the lesion is lower so that the pressure at the near wall of the bifurcation is higher than that in the vicinity. It would increase with decreasing diameter b.
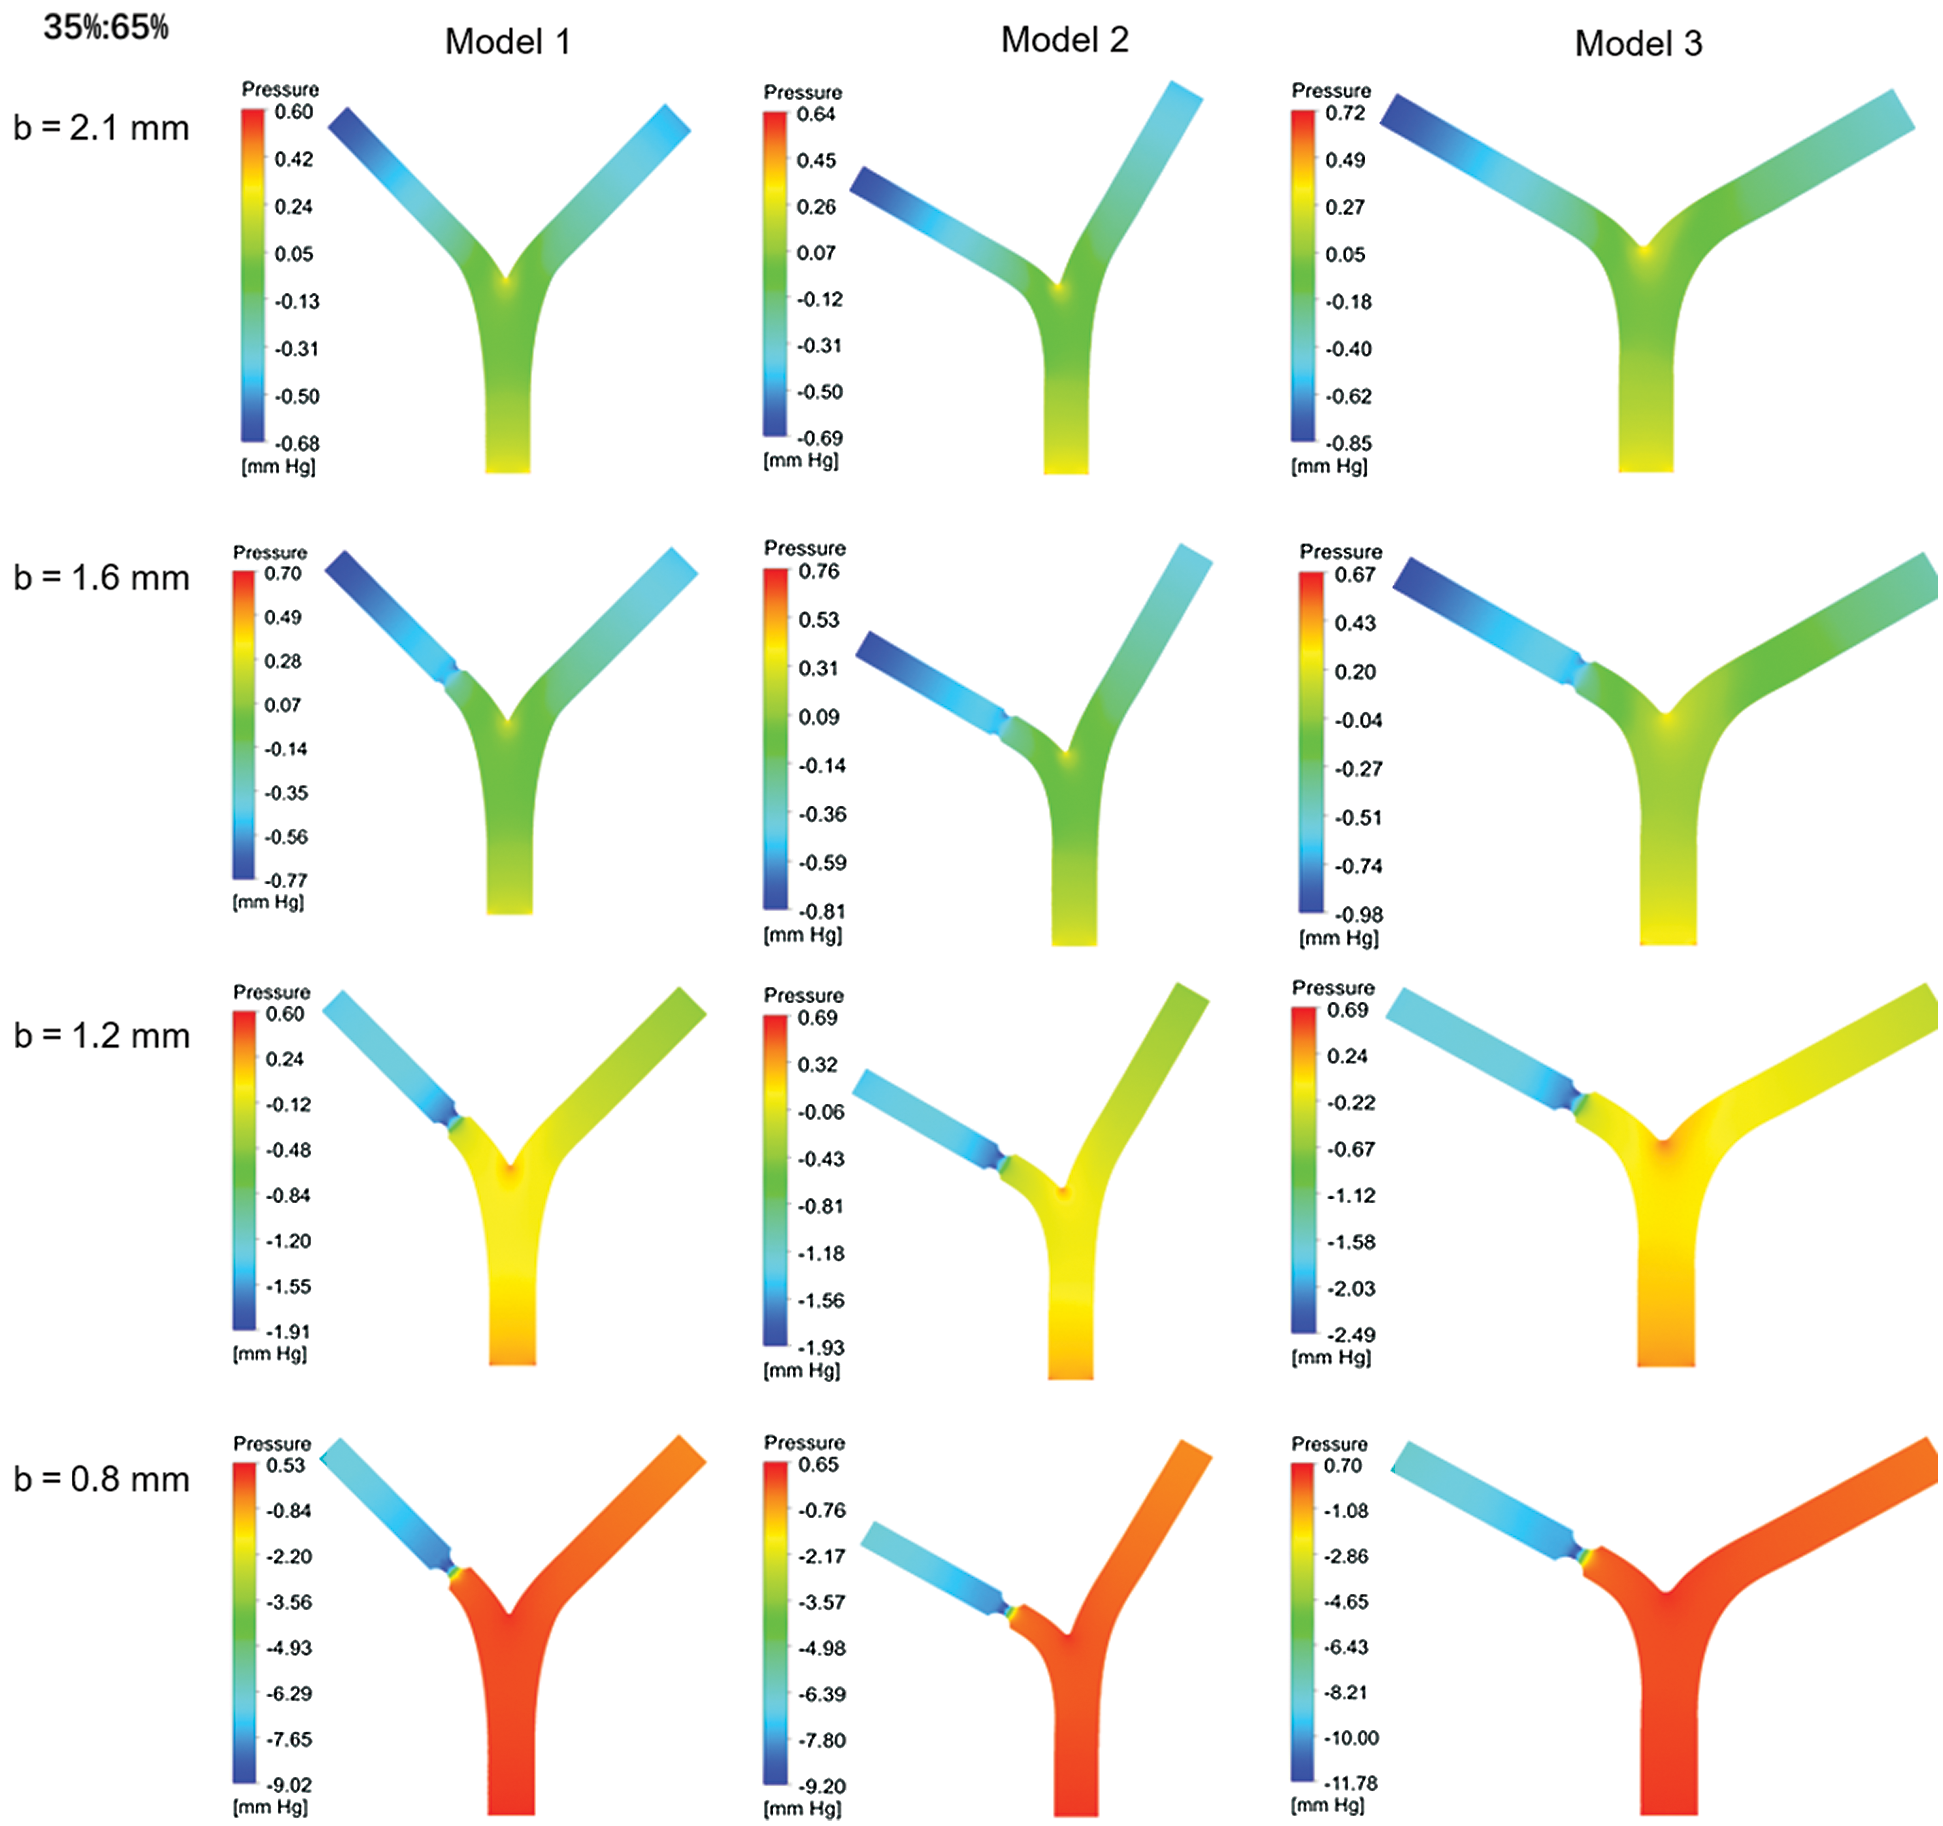
Figure 6: Pressure distribution for different blood flow ratio
Fig. 7 shows the wall shear stress (WSS) located at the bifurcation and the stenosis of the Model-1~3 under three kinds of flow rates. WSS at the bifurcation is small and does not change significantly with stenosis diameter b or bifurcation angle α1, α2. The maximum WSS at the bifurcation is 6.42 Pa. There was no significant difference in WSS among Models 1–3 under the same conditions. When diameter b = 0.8 mm and flow rate accounts for 30%, 35%, and 40%, the WSS at the diseased region is close to 80 Pa, 100 Pa, and 120 Pa, respectively. The WSS at stenosis of Model 2 and Model 3 is more significant than Model 1, while the WSS difference between Models 2 and 3 is small. In consequence, increasing angle α1 of LB will increase the wall shear stress.
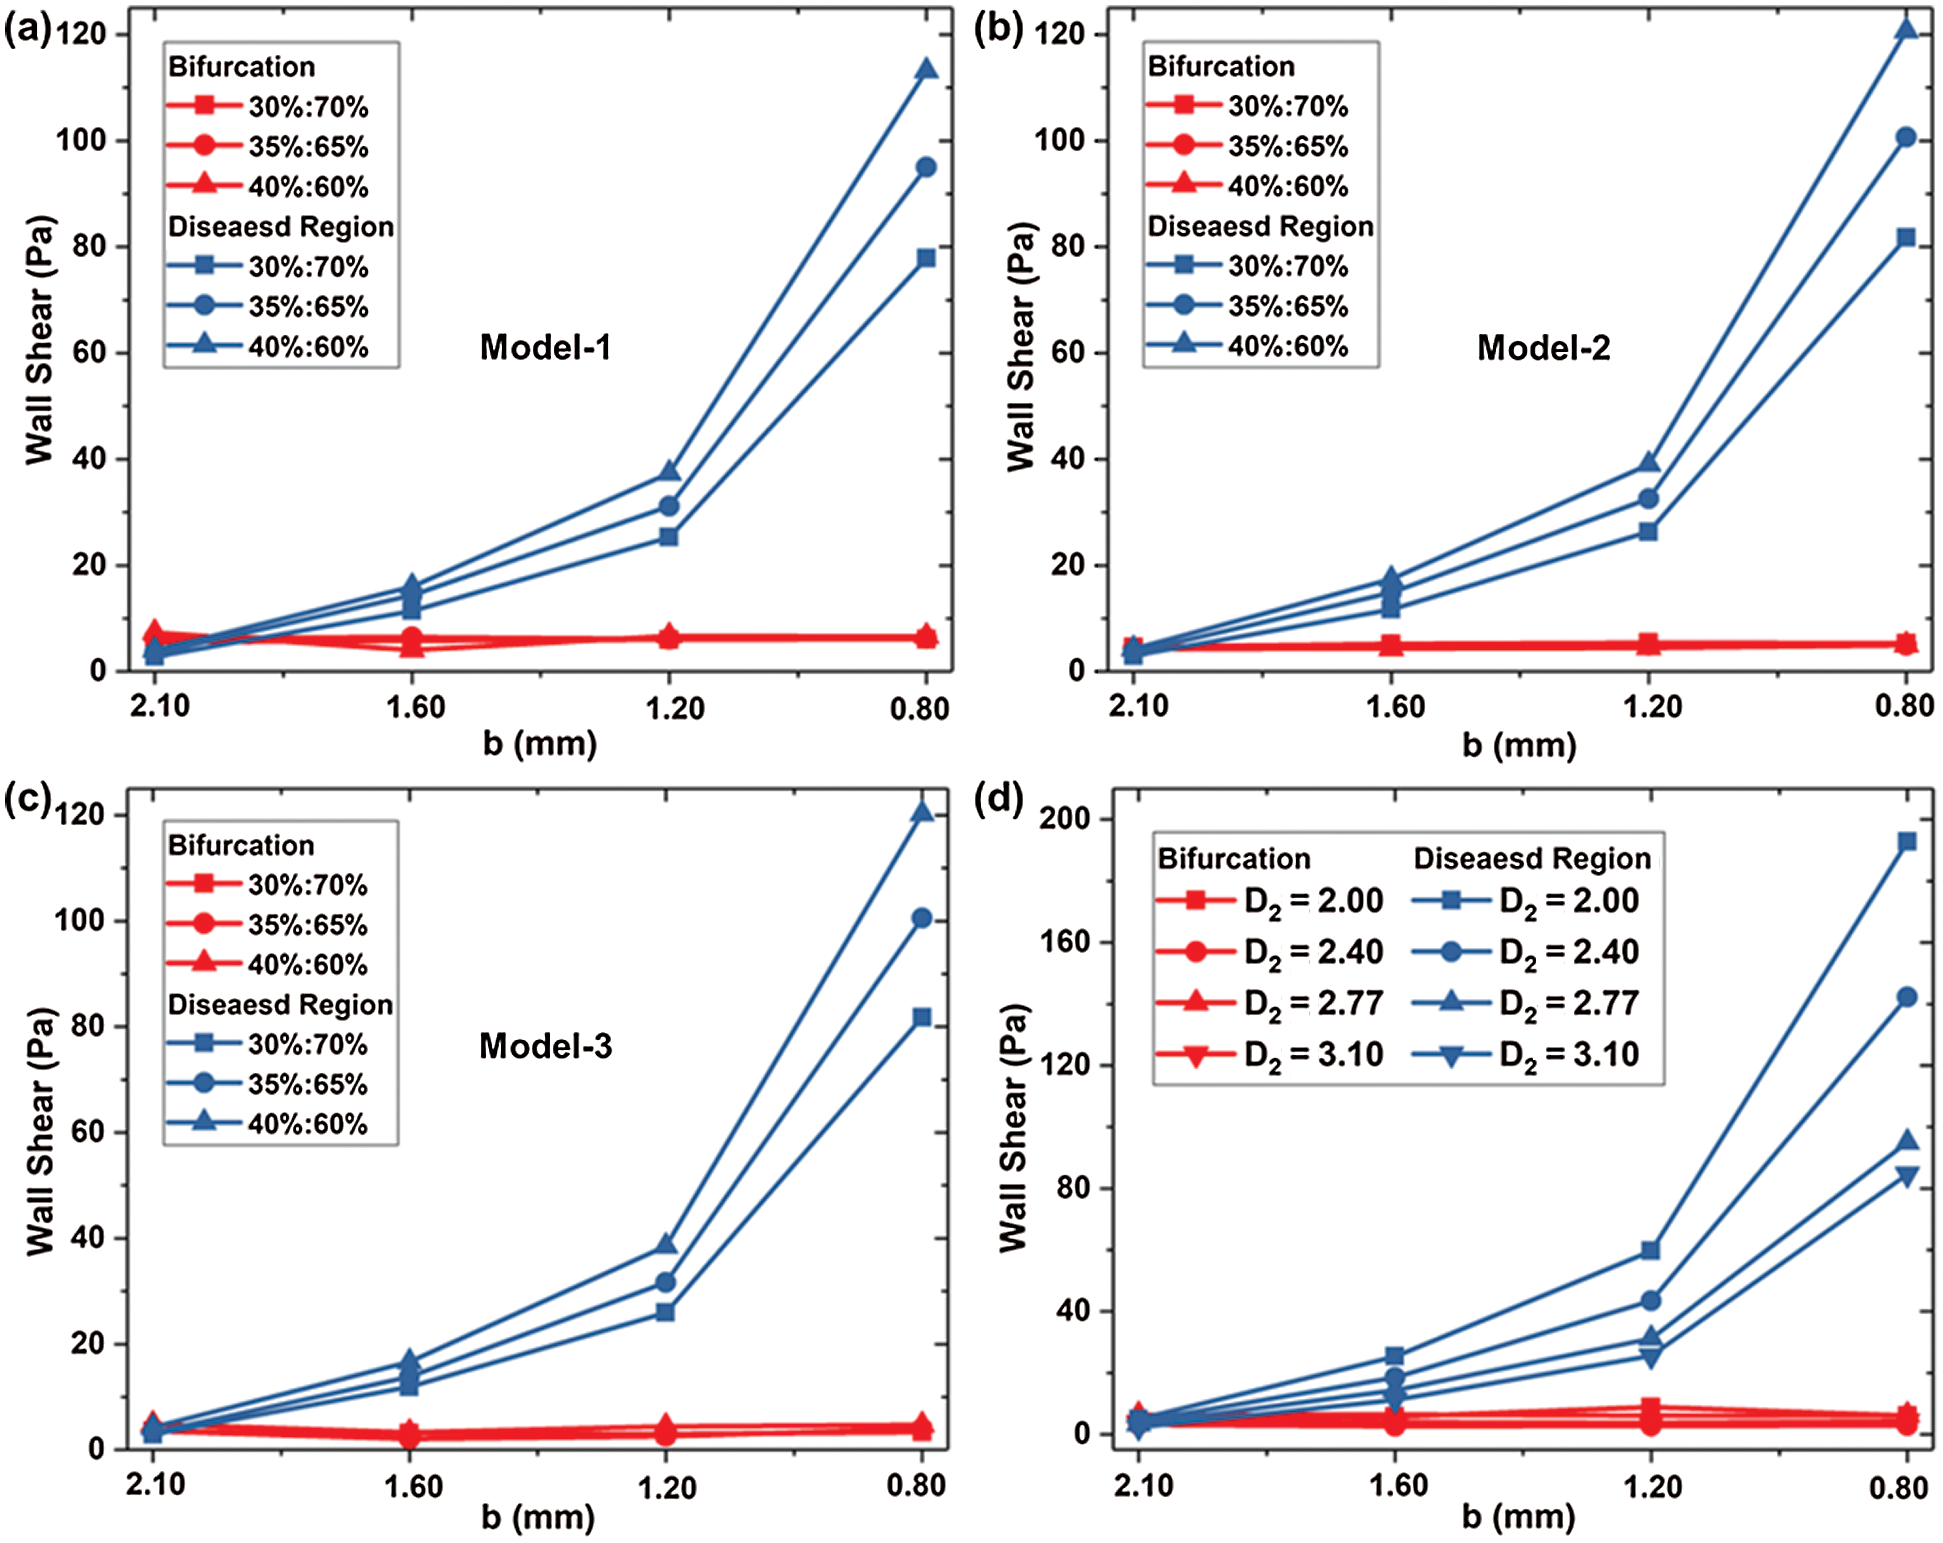
Figure 7: WSS located at the bifurcation and the stenosis for (a) Model-1, (b) WSS-2 and (c) Model-3; and the impact of D2 on WSS (d)
Fig. 7d shows the WSS in different D2 (Model 1, and Models 4–6) at bifurcation and lesion region. The WSS of the four models at the bifurcation almost keeps the same. The WSS of the lesion increases with the decrease of diameter b, and the smaller the diameter b, the faster WSS increases. At a standard flow ratio of 35%: 65%, when b = 1.2 mm, the WSS of Model 1 is 31.17 Pa, which has a rise of 16.79 Pa compared with b = 1.6 mm. When the minimum diameter of b = 0.8 mm, WSS increases by 68.36Pa compared to 1.2 mm. D2 variation has a significant impact on the WSS at the stenosis with the small diameter of b. For b = 0.8 mm, the WSS at stenosis is increased by 10.4Pa with D2 reducing from 3.10 mm to 2.77 mm.
Fig. 8 shows the contour of WSS in different D2 (Model 1, and Models 4–6) at standard flow rates. The WSS patterns have similar distribution for other models. However, WSS changes obviously at stenosis as the minimum diameter b decreases.
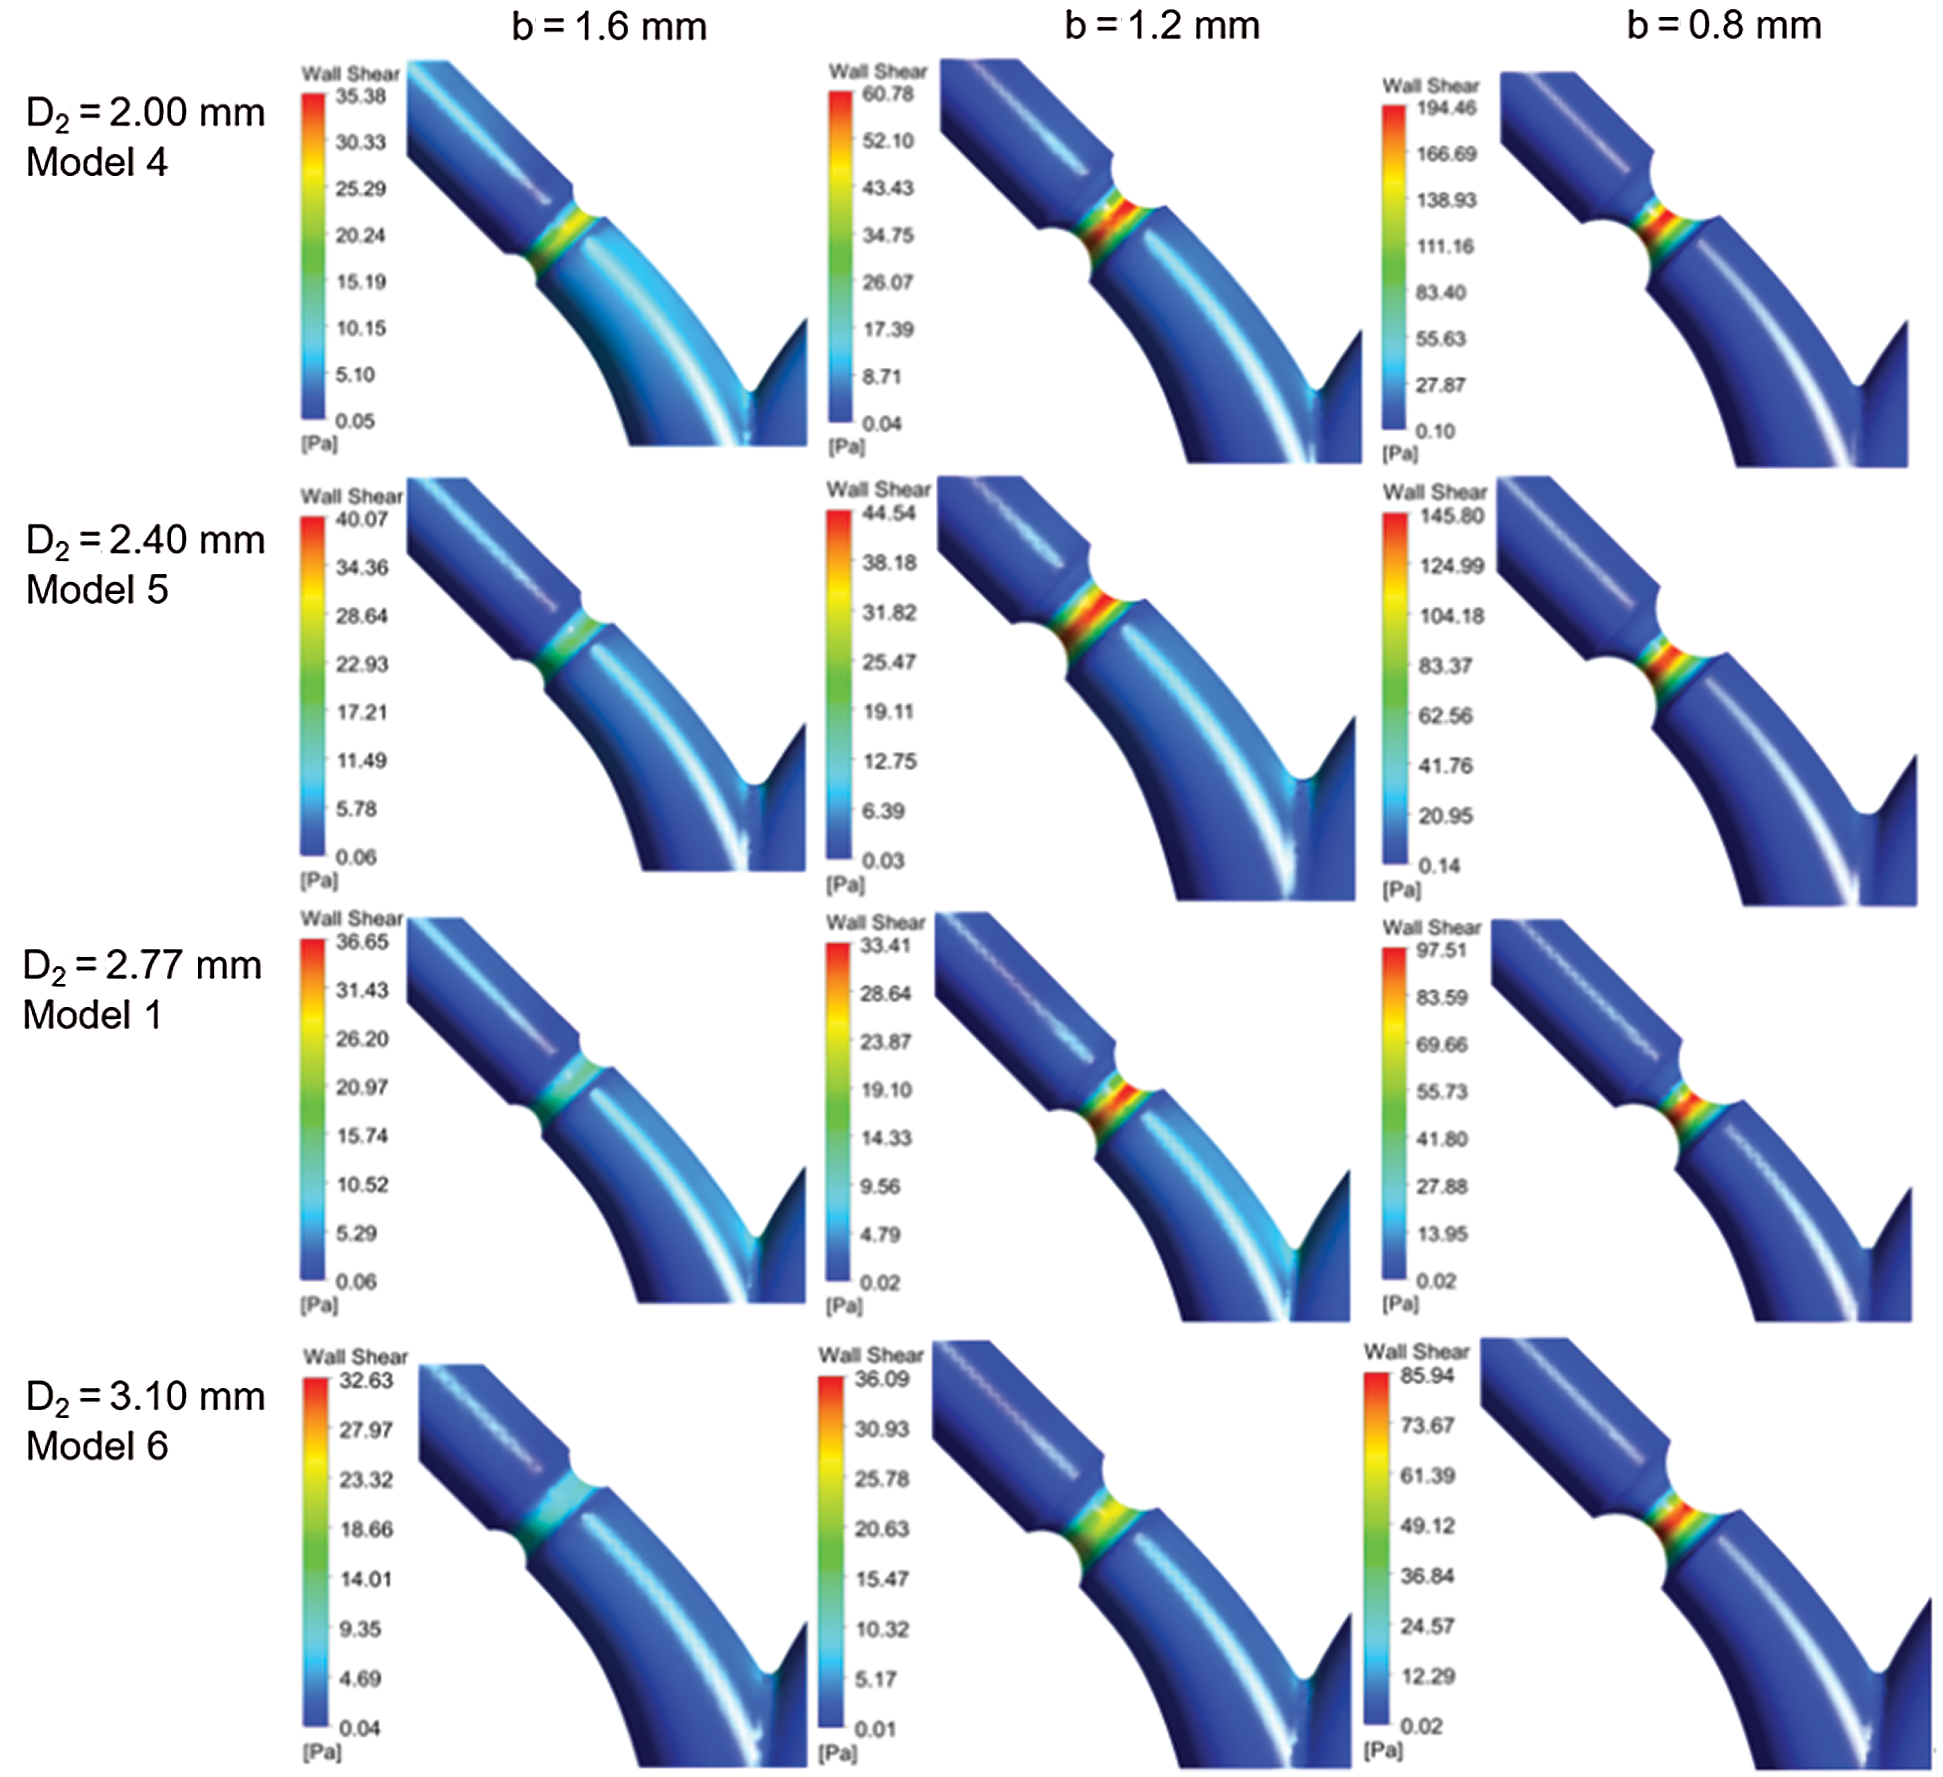
Figure 8: Contour of WSS for different models
Based on the simulation results of the flow field, a series of heat flux is set at the vessel wall to study the blood temperature distribution due to the solid tissue impact. The initial blood temperature assumes as 37°C. The thermal conductivity of blood is set to 0.55 W/m•K [17]. Fig. 8 shows the steady temperature field of Model-1 (b = 2.1 mm and b = 1.2 mm), where the heat flux is set as 5000W/m2. The temperatures distribution located at sections denoted by A, B, C and D as shown in Fig. 9a are given. When the heat transfer between the vessel and solid tissue is considered, the blood temperature at the inlet is set as 37°C. As the blood flows, the temperature near the wall rises, and the temperature on both sides is higher than that on the inside. This is related to the difference in flow velocity. The inner side of the blood still maintains a higher flow velocity, while the outer side has a larger temperature gradient. The average temperature of the blood near the top of the branching vessel is lower than that below.
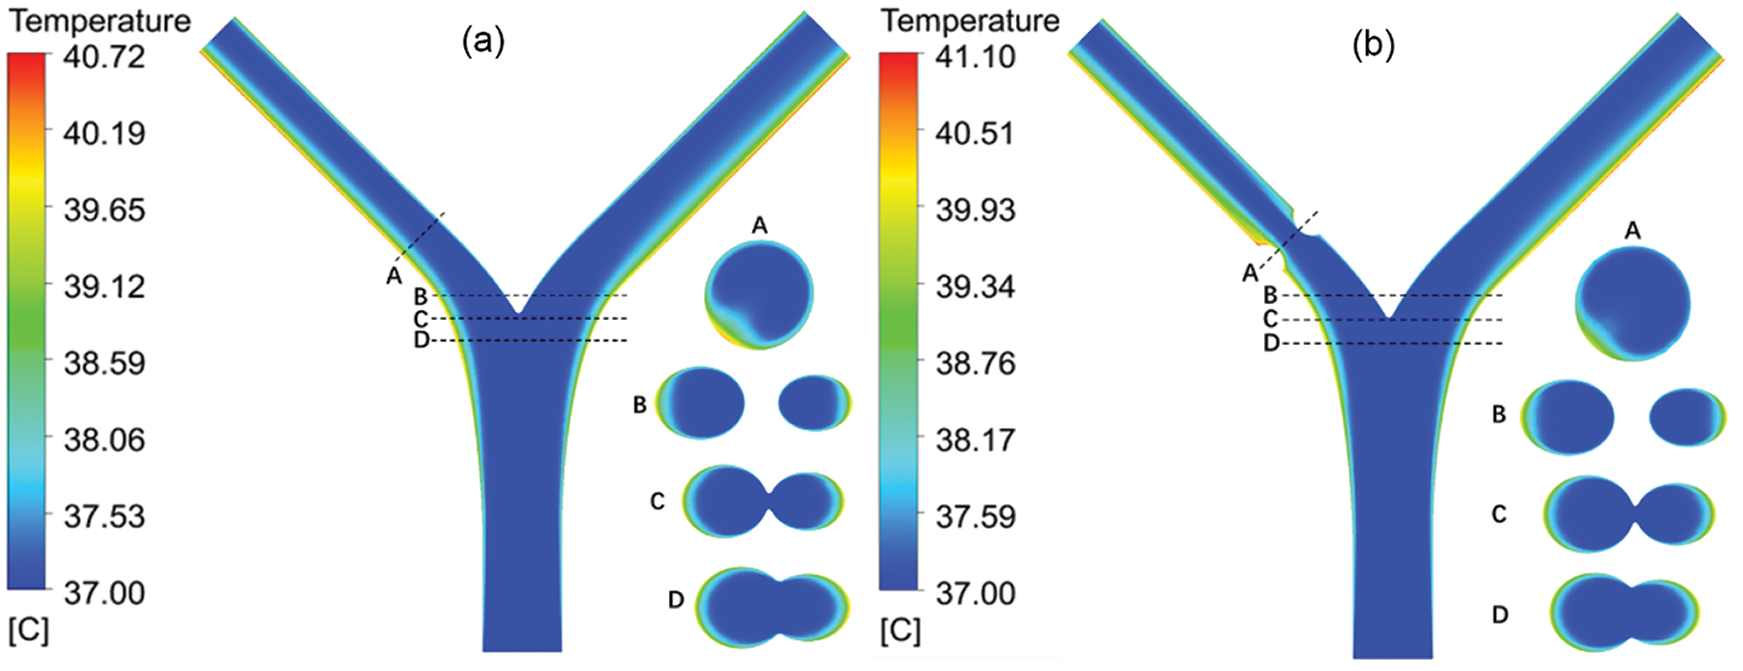
Figure 9: The temperature contour of the blood vessel for (a) b = 2.1 mm and (b) b = 1.2 mm
The cross-section temperature contour shows that at the bifurcation, the temperature near the center barely changed, while the temperature around the two sides changed significantly. Due to the decrease of diameter, the flow concentrates and the flow rate increases accordingly. The change of temperature at the lesion is small. In addition, as the diameter returns to normal and the flow velocity is low at a position below the outlet of the lesion, the max temperature occurs at this position. In different lesion diameter b, the temperature rises linearly with the heating power. In the absence of lesions (b = 2.1 mm), both the max temperature and the outlet temperature are minimal. This is because the flow is relatively stable, and there is no slow-speed area like lesion happens. The LB outlet center temperature is shown in Fig. 9. When a lesion occurs, with the decrease of b, the max temperature decreases and the outlet temperature increases.
On the one hand, the decrease of b increases the flow velocity. It makes the flow at the outlet more uneven (see Fig. 10). When b = 1.6 mm, the max temperature is the highest due to its low flow rate area below the lesion. However, the high-velocity area of flow after the lesion is larger than other conditions, so the outlet temperature is smaller. When b = 0.8 mm, the maximum velocity increases so that the max temperature is small. Nevertheless, the area with a high flow rate is small and the blood velocity around it is low, so that heat is transferred to the blood vessels and the outlet temperature increased significantly. Besides, the smaller the lesion diameter b is, the less obvious the decrease of vascular max temperature is, and the more obvious the increase of outlet temperature.
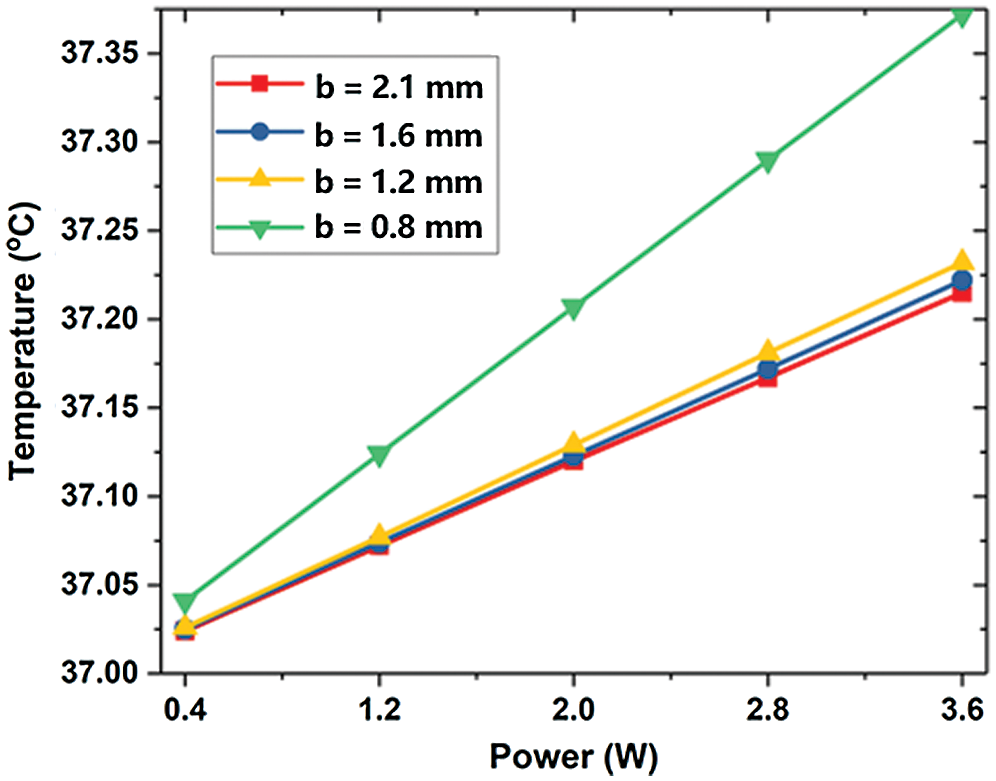
Figure 10: The maximum temperature of LB outlet center
In summary, a three-dimensional numerical simulation method was used to investigate the thermal effects of bifurcation stenosis on blood flow and temperature responses. We have investigated the blood velocity and pressure distribution and wall shear stress in arterial bifurcation and its effects on the heat transfer. The results indicated that the maximum wall shear stress was located on stenosis. The pressure distribution of two branch vessels was effectively remodeled by stenosis. In addition, heat transfer between blood with solid tissue was also affected by bifurcation stenosis due to the inhomogeneous distribution of blood velocity. This work may enhance the current understanding of the factors for determining the effects of bifurcation stenosis in the vascular network [24,25].
Acknowledgement: We would also like to thank the editors for many helpful suggestions.
Funding Statement: This work is supported by the National Natural Science Foundation of China (NSFC) under Grant No. 52076213.
Conflicts of Interest: The authors declare that there is no conflict of interest.
1. Wang, H. D., Naghavi, M., Allen, C., Barber, R. M., Bhutta, Z. A. et al. (2016). Global, regional, and national life expectancy, all-cause mortality, and cause-specific mortality for 249 causes of death, 1980–2015: A systematic analysis for the Global Burden of Disease Study 2015. Lancet, 388(10053), 1459–1544. DOI 10.1016/S0140-6736(16)31012-1. [Google Scholar] [CrossRef]
2. Asakura, T., Karino, T. (1990). Flow patterns and spatial-distribution of atherosclerotic lesions in human coronary-arteries. Circulation Research, 66(4), 1045–1066. DOI 10.1161/01.RES.66.4.1045. [Google Scholar] [CrossRef]
3. Cebral, J. R., Vazquez, M., Sforza, D. M., Houzeaux, G., Tateshima, S. et al. (2015). Analysis of hemodynamics and wall mechanics at sites of cerebral aneurysm rupture. Journal of NeuroInterventional Surgery, 7(7), 530–536. DOI 10.1136/neurintsurg-2014-011247. [Google Scholar] [CrossRef]
4. Zhang, C., Xie, S., Li, S. Y., Pu, F., Deng, X. Y. et al. (2012). Flow patterns and wall shear stress distribution in human internal carotid arteries: The geometric effect on the risk for stenoses. Journal of Biomechanics, 45(1), 83–89. DOI 10.1016/j.jbiomech.2011.10.001. [Google Scholar] [CrossRef]
5. Cheruvu, C., Naoum, C., Blanke, P., Norgaard, B., Leipsic, J. (2016). Beyond stenosis with fractional flow reserve via computed tomography and advanced plaque analyses for the diagnosis of lesion-specific ischemia. Canadian Journal of Cardiology, 32(11), 1315.e1–1315.e9. DOI 10.1016/j.cjca.2016.01.023. [Google Scholar] [CrossRef]
6. Koskinas, K. C., Feldman, C. L., Chatzizisis, Y. S., Coskun, A. U., Jonas, M. et al. (2010). Natural history of experimental coronary atherosclerosis and vascular remodeling in relation to endothelial shear stress. Circulation, 121(19), 2092–2101. DOI 10.1161/CIRCULATIONAHA.109.901678. [Google Scholar] [CrossRef]
7. Hoef, T., Meuwissen, M., Piek, J. J. (2013). Fractional flow reserve and beyond. Heart, 99(22), 1699–1705. DOI 10.1136/heartjnl-2012-302325. [Google Scholar] [CrossRef]
8. Chiastra, C., Gallo, D., Tasso, P., Iannaccone, F., Migliavacca, F. et al. (2017). Healthy and diseased coronary bifurcation geometries influence near-wall and intravascular flow: A computational exploration of the hemodynamic risk. Journal of Biomechanics, 58, 79–88. DOI 10.1016/j.jbiomech.2017.04.016. [Google Scholar] [CrossRef]
9. Zhang, D. F., Lv, S. Z., Song, X. T., Yuan, F., Xu, F. et al. (2015). Fractional flow reserve versus angiography for guiding percutaneous coronary intervention: A meta-analysis. Heart, 101(6), 455–462. DOI 10.1136/heartjnl-2014-306578. [Google Scholar] [CrossRef]
10. Gholipour, A., Ghayesh, M. H., Zander, A. (2018). Nonlinear biomechanics of bifurcated atherosclerotic coronary arteries. International Journal of Engineering Science, 133, 60–83. DOI 10.1016/j.ijengsci.2018.08.003. [Google Scholar] [CrossRef]
11. Chiastra, C., Iannaccone, F., Grundeken, M. J., Gijsen, F. J. H., Segers, P. et al. (2016). Coronary fractional flow reserve measurements of a stenosed side branch: a computational study investigating the influence of the bifurcation angle. BioMedical Engineering OnLine, 15(1), 1699. DOI 10.1186/s12938-016-0211-0. [Google Scholar] [CrossRef]
12. Cutri, E., Zunino, P., Morlacchi, S., Chiastra, C., Migliavacca, F. (2013). Drug delivery patterns for different stenting techniques in coronary bifurcations: A comparative computational study. Biomechanics and Modelling in Mechanobiology, 12(4), 657–669. DOI 10.1007/s10237-012-0432-5. [Google Scholar] [CrossRef]
13. Otero-Cacho, A., Aymerich, M., Flores-Arias, M. T., Abal, M., Alvarez, E. et al. (2018). Determination of hemodynamic risk for vascular disease in planar artery bifurcations. Scientific Reports, 8(1), 1459. DOI 10.1038/s41598-018-21126-1. [Google Scholar] [CrossRef]
14. Hossain, S. M. C., Zhang, X., Liu, Z. F., Haider, Z., Memon, K. et al. (2018). Evaluation effect of magnetic field on nanofluid flow through a deformable bifurcated arterial network. International Communications in Heat and Mass Transfer, 98(1), 239–247. DOI 10.1016/j.icheatmasstransfer.2018.09.004. [Google Scholar] [CrossRef]
15. Chakravarty, S. S., Mandal, P. K. (2009). Effect of heat and mass transfer on non-Newtonian flow-Links to atherosclerosis. International Journal of Heat and Mass Transfer, 52(25–26), 5719–5730. DOI 10.1016/j.ijheatmasstransfer.2009.04.040. [Google Scholar] [CrossRef]
16. Wang, Z., Zhao, G., Wang, T., Yu, Q. F., Su, M. Y. et al. (2015). Three-dimensional numerical simulation of the effects of fractal vascular trees on tissue temperature and intracelluar ice formation during combined cancer therapy of cryosurgery and hyperthermia. Applied Thermal Engineering, 90(1), 296–304. DOI 10.1016/j.applthermaleng.2015.06.103. [Google Scholar] [CrossRef]
17. Zheng, Y. C., Wu, J. H., He, Z. Z., Huang, S. J. (2018). Computational study of the effects of arterial bifurcation on the temperature distribution during cryosurgery. BioMedical Engineering OnLine, 17(1), 157. DOI 10.1186/s12938-018-0438-z. [Google Scholar] [CrossRef]
18. Zhang, Y., Xie, H. W. (2018). The effect of a bifurcation structure on the heat transfer and temperature distribution of pulsatile blood flow. International Journal of Heat and Mass Transfer, 118(6), 663–670. DOI 10.1016/j.ijheatmasstransfer.2017.11.055. [Google Scholar] [CrossRef]
19. Zakaria, H., Robertson, A. M., Kerber, C. W. (2008). A parametric model for studies of flow in arterial bifurcations. Annals Biomedical Engineering, 36(9), 1515–1530. DOI 10.1007/s10439-008-9531-y. [Google Scholar] [CrossRef]
20. Johnson, D. A., Naik, U. P., Beris, A. N. (2011). Efficient implementation of the proper outlet flow conditions in blood flow simulations through asymmetric arterial bifurcations. International Journal for Numerical Methods in Fluids, 66(11), 1383–1408. DOI 10.1002/fld.2319. [Google Scholar] [CrossRef]
21. Gijsen, F. J., van de Vosse, F. N., Janssen, J. D. (1999). The influence of the non-Newtonian properties of blood on the flow in large arteries: steady flow in a carotid bifurcation model. Journal of Biomechanics, 32(6), 601–608. DOI 10.1016/S0021-9290(99)00015-9. [Google Scholar] [CrossRef]
22. Hossein, R. J., Pakravan, H. A., Saidi, M. S., Firoozabadi, B. (2019). Primary stenosis progression versus secondary stenosis formation in the left coronary bifurcation: A mechanical point of view. Biocybernetics and Biomedical Engineering, 39(1), 188–198. DOI 10.1016/j.bbe.2018.11.006. [Google Scholar] [CrossRef]
23. Nagargoje, M., Gupta, R. (2020). Effect of asymmetry on the flow behavior in an idealized arterial bifurcation. Computer Methods in Biomechanics and Biomedical Engineering, 23(6), 232–247. DOI 10.1080/10255842.2019.1711068. [Google Scholar] [CrossRef]
24. Tang, Y. L., Mu, L. Z., He, Y. (2020). Numerical simulation of fluid and heat transfer in biological tissue containing the exact structure of microvascular network using immersed boundary method. Fluid Dynamics & Materials Processing, 16(2), 281–296. DOI 10.32604/fdmp.2020.06760. [Google Scholar] [CrossRef]
25. Khechiba, A., Benakcha, Y., Ghezal, A., Spetiri, P. (2018). Combined MHD and pulsatile flow on porous medium. Fluid Dynamics & Materials Processing, 14, 137–154. [Google Scholar]
 | This work is licensed under a Creative Commons Attribution 4.0 International License, which permits unrestricted use, distribution, and reproduction in any medium, provided the original work is properly cited. |