Materials Processing
| Fluid Dynamics & Materials Processing |
DOI: 10.32604/fdmp.2021.014712
ARTICLE
On the Effect of the Rotating Chamber Reverse Speed on the Mixing of SiC Ceramic Particles in a Dry Granulation Process
1School of Mechanical and Electronic Engineering, Jingdezhen Ceramic Institute, Jingdezhen, 333403, China
2National Engineering Research Center for Domestic & Building Ceramics, Jingdezhen, 333001, China
*Corresponding Authors: Nanxing Wu. Email: 15172480512@163.com; Dahai Liao. Email: ldhjdz1987@163.com
Received: 23 October 2020; Accepted: 11 February 2021
Abstract: In order to control the accumulation of SiC ceramic particles on the wall of the rotating chamber in the frame of a dry granulation process, the effect of the wall reverse speed on the mixing process is investigated. In particular, an Euler-Euler two-phase flow model is used to analyze the dynamics of both SiC particles and air. The numerical results show that by setting a certain reverse rotating speed of the rotating chamber, the accumulation of SiC particles on the wall can be improved, i.e., their direction of motion in proximity to the wall can be changed and particles can be forced to re-join the granulation process. Experimental tests conducted to verify the reliability of the numerical findings, demonstrate that when the reverse rotating speed of the rotating chamber is 4 r/min, the sphericity of SiC particles in the rotating chamber is the highest and the fluidity is the best possible one.
Keywords: SiC ceramic dry granulation; CFD method; accumulate of wall surface; rotating chamber reverse speed
SiC ceramics prepared by the dry process have the advantages of low investment, low energy consumption, low pollution, and simple technology [1–4], which meet the development requirements of energy saving and emission reduction [5]. However, prepared SiC particles have some defects, such as uneven composition, poor liquidity, and single gradation [6–7]. The reason is that only the crushing reamer drove by the stirring principal axis rotating at a certain direction in the mixing process, which results in the accumulation of SiC particles on the surface of the rotating chamber [8–9]. Research shows that when the rotating chamber has a certain reverse speed, the SiC particles accumulated on the wall can move in reverse and then participate in the granulation process again, which reducing the wall accumulation to some extent. At this time, there is a certain rotational speed ratio between the stirring principal axis and the rotating chamber.
The motion characteristics of the flow field can be improved by setting the correct rotating speed of the rotating chamber in the mixing process [10]. Many scholars have studied the effect of speed ratio on flow field by the CFD method. Yu et al. [11] studied the effect of the rotational speed of the granulating chamber on the dry granulation process of ceramics. When the rotational speed of the granulating chamber was 160 r/min, the effect was the best. Sun et al. [12] experiments were conducted in a water flume using Particle Image Velocimetry (PIV) to study the evolution of the vortical structures in the wakes of four types of screen cylinders at a Reynolds number of about 3200. The results were compared with that of a bare cylinder. Liu et al. [13] studied the mixing characteristics of the mixture at different rotating speed ratios. The synchronizing cycles blender has high mixing efficiency. Liang [14] used computational fluid dynamics (CFD) method to study the flow field in a cylindrical stirred tank in which a double-layer combined impeller with an upper straight blade and lower inclined blade mixed non-Newtonian fluid. Dbouk et al. [15] employ an advanced three-dimensional model based on fully coupled Eulerian-Lagrangian techniques, employs computational multiphase fluid dynamics and heat transfer to investigate transport, dispersion, and evaporation of saliva particles arising from a human cough.
On the basis of previous studies on the influence of reverse speed on the flow field, the numerical simulation method is used to analyze the influence of the rotating chamber on the flow field under different reverse speeds. The Euler-Euler method [16] is used to establish the computational model of gas-solid two-phase flow [17] mixing processes. Simplify the simulation area and establish the physical model. The CFD method is used to calculate the flow field of the rotating chamber under three reverses rotating speed [18]. The volume distribution and velocity field of the rotating chamber are compared and the effect of the reverse rotating speed on the surface of the rotating chamber is analyzed. At the same time, the particle size distribution and fluidity of SiC particles manufactured at three reverses rotating speed were analyzed experimentally. The results have certain theoretical significance for improving the mixing uniformity and fluidity of SiC ceramic particles.
2 Simplification of Simulation Region
Fig. 1 is a simplified diagram of the rotating chamber for dry granulation of SiC ceramics.
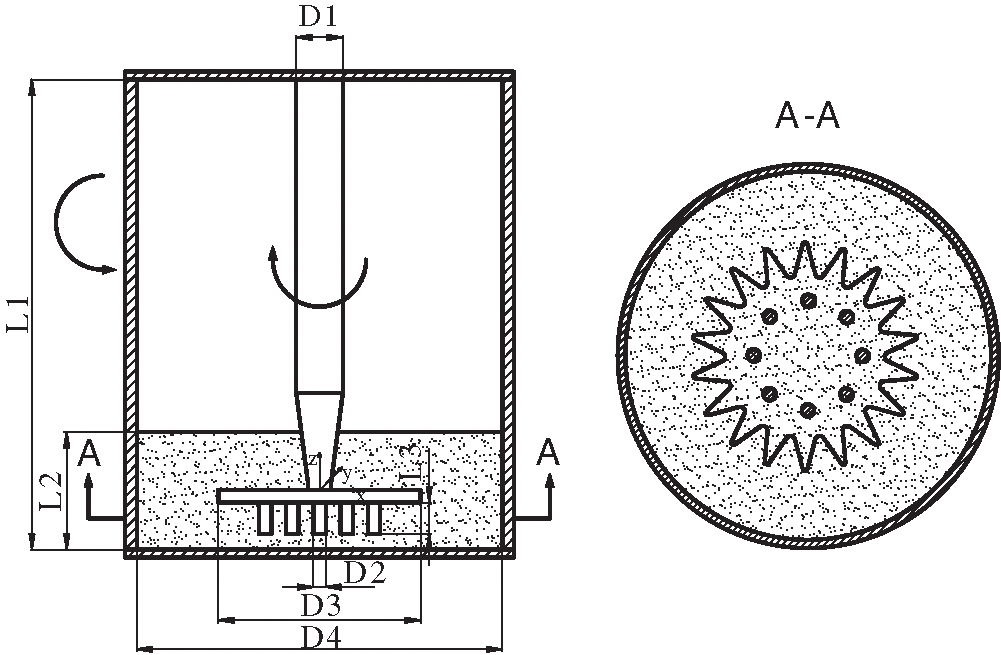
Figure 1: Simplified diagram of the rotating chamber for dry granulation of SiC ceramics
The diameter of stirring principal axis is D1, the diameter of prilling column is D2, the diameter of crushing reamer is D3, and the diameter of rotating chamber is D4. The height of the rotating chamber is L1, the height of granulation is L2, and the length of granulation column is L3. The stirring principal axis drives the crushing reamer to rotate clockwise at 160 r/min and counter-clockwise at 2 r/min, 4 r/min and 8 r/min respectively. The specific size of the rotating chamber is shown in Tab. 1.
Table 1: Specific size of the rotating chamber
In mathematics, Reynolds number (Re) is generally used to quantify the change degree of fluid from laminar flow to turbulent flow [19–20]. The reynolds number is used as a criterion to judge the flow state of fluid. The specific calculation formula is as follows:
where,
The flow state of fluid can be evaluated by calculating the Reynolds number. Small Reynolds number indicates that the viscous force between fluid is copious, and high Reynolds number indicates that there is little influence of inertia between fluids. Generally speaking, Re < 2300 is laminar flow, 2300 ≤ Re ≤ 4000 is a transition state, Re > 4000 is turbulent state. The density of the mixture is 2047 kg/m3, the dynamic viscosity is 0.32 PAs. By substituting the data into the formula, it can be concluded that the Reynolds number is greater than 4000, so the coupling field in the rotating chamber presents a turbulent state. Motion characteristics of SiC powder used in this paper are similar to that of fluid in the high-speed rotating flow field. The working medium of the rotating chamber is a mixture of SiC particles and air, so it is treated as a quasi fluid.
In the gas-solid two-phase flow, if the mass and energy transfer between phases are not considered, according to the basic law of conservation of mass and momentum. The instantaneous and local conservation equations of each phase in the control body are as follows:
1. Continuity conservation equation
Continuity equation of SiC powder phase is as follows:
Continuity equation of air phase is as follows:
where: ms and mg represent the mass of SiC powder phase and air phase respectively;
2. Momentum conservation equation
Momentum conservation equation of SiC powder phase:
Conservation equation of air phase momentum:
where: αs and αg represent the volume fraction ratio of SiC powder phase and air phase, respectively; μs and λs represent the molecular viscosity and volume viscosity of SiC powder phase, respectively; μg and λg represent the molecular viscosity and volume viscosity of air phase, respectively;
The theory of gas-solid two-phase flow refers to the flow of solid particles in the gas. In this paper, the air is regarded as a gas phase and SiC powder as a solid phase. The mixing process in the rotating chamber can be considered as gas-solid two-phase flow. In the mixing process, SiC powder interacts with SiC powder, and SiC powder also interacts with the air. In the Euler-Euler model, the exchange coefficient can be set between the same phase and between two phases, which can be solved by coupling. Therefore, the Euler-Euler model is selected for simulation.
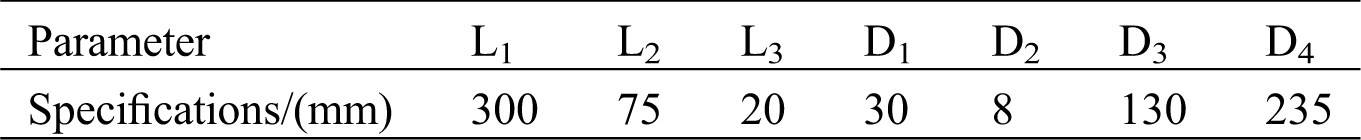
Barton et al. [21] by extending a ghost cell method for gas-dynamics to solid mechanics, by using a first-order model for elastic materials in conservative form. In particular for colliding solid objects it is desirable to allow large deformations and relative slides, whilst employing fixed grids and maintaining sharp interfaces, with emphasis on the inclusion of interfacial boundary conditions. Draw lessons from the method of Barton et al. The stirring principal axis, the crushing reamer, the prilling column, and the surface of the rotating chamber are set to walls. The stirring principal axis has a high speed. Because of the intense movement of SiC particles near the crushing reamer and the prilling column, the adjacent area is configured as a dynamic area, and the rest area is set as a static area. The dynamic and static regions are divided by sliding grids and multiple reference systems. The dynamic and static calculation area is connected through the interface for data exchange between regions. The whole simulation area of the rotating chamber is closed and there is no pressure outlet. Fig. 2 is a physical model of the mixing process of SiC particles in the rotating chamber, ignoring the influence of other factors on the flow field distribution of the mixing process in the rotating chamber.
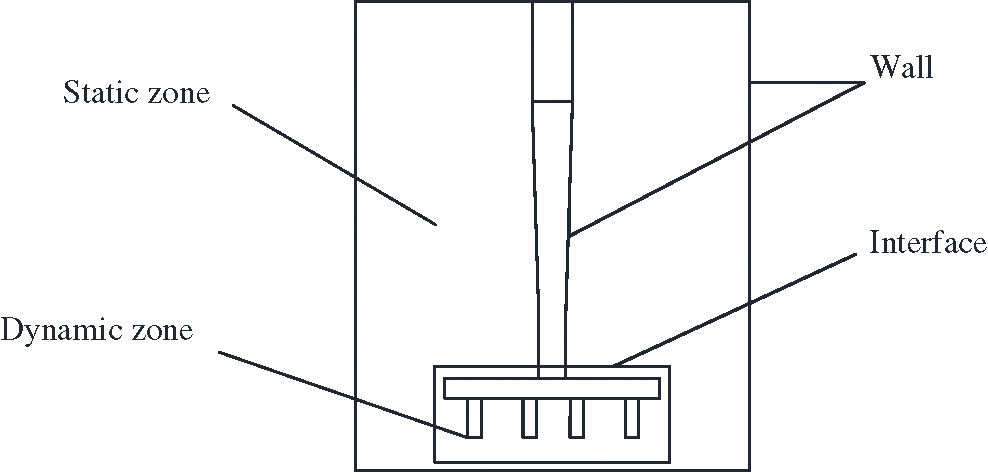
Figure 2: Boundary condition of rotating chamber
SolidWorks software is used to build the three-dimensional model of the rotating chamber structure. After Boolean subtraction, it is imported into ICEM software to generate computational area grids. The geometric structure of the adjacent area between the grinding reamer and granulating column is complex. Baton et al. [22] proposed a method for solving compressible solid/fluid problems on a fixed grid based on conservative level sets. Refer to its theoretical method. The tetrahedral mesh is selected to divide the mesh, and the mesh size is set to 3. Other regions are divided into hexahedral meshes of size 4. The whole calculation area is divided into two areas: the dynamic calculation area near the grinding reamer, the granulation column, and the remaining static calculation area. Moving mesh model is used in the static operation area, MRF (Markov Random Field) model [23] is used in the dynamic operation area, and pressure implicit solution is used for unsteady coupling field. The Euler–Euler multiphase flow model is utilized to simulate the distribution of SiC powder and air. The grid generation diagram is shown in Fig. 3.
Figure 3: Sketch map of mesh generation (a) Static area grid (b) Moving area grid
The flow field in a rotating chamber is simulated by computational fluid dynamics (CFD). Simplify the simulation area of the granulation chamber and establish the physical model of the air- particles mixing process by a finite volume method. Pressure implicit algorithm is used to solve the unsteady flow field and Euler-Euler two-fluid model is used to simulate the flow field distribution. The RNG discrete modelin k-ε model [24] is chosen as turbulence model, and the second-order upwind scheme is used for discretization. The SIMPLE algorithm [25] is used for pressure-velocity coupling. Convergence residuals of all variables are less than 1 × 10⁻⁴.
4 The Results and Discussion of Numerical Analysis
4.1 Axial Volume Distribution Nephogram of SiC Particles
Fig. 4 shows the axial volume distribution nephogram of SiC particles in the rotating chamber when the rotating speed of the stirring principal axis is 160 r/min clockwise and that of the rotating chamber is 2 r/min, 4 r/min, and 8 r/min counterclockwise, respectively. When the counter-clockwise speed of the rotating chamber is 2 r/min, there are five regions. About 1/3 of the volume fraction of the upper part of the rotating chamber is less than 0.025; about 12% of the bottom and the upper wall of the rotating chamber is more than 0.225; and the volume fraction of SiC particles on both sides of the grinding reamer is between 0.175 and 0.200, accounting for about 4%. The upper part of the grinding reamer is trapezoidal distribution, the volume distribution is between 0.025 and 0.175, accounting for 25% of the total volume; the volume of the remaining area is between 0.200 and 0.225, accounting for 26% of the total volume. When the rotating speed of the rotating chamber is 4 r/min, there are five regions. About 1/3 of the volume fraction of the upper part of the rotary chamber is less than 0.025; about 6% of the volume fraction of the bottom and upper wall of the rotary chamber is more than 0.225; the volume fraction of SiC particles on both sides of the grinding reamer is between 0.175 and 0.200, accounting for 12% of the total volume; the volume fraction of the upper part of the grinding reamer is between 0.025 and 0.175, accounting for 28% of the total volume; and the volume fraction of the remaining area is between 0.200 and 0.225. It accounts for 21% of the total volume. When the rotating speed of the rotating chamber is 8 r/min, there are five regions. The volume fraction of about 1/3 of the upper part of the rotating chamber is less than 0.025; the volume fraction of about 20% of the bottom and the upper wall of the rotating chamber is more than 0.225; and the volume fraction of SiC particles on both sides of the crushing chamber is between 0.175 and 0.200, accounting for about 1%. Volume fraction ranged from 0.025 to 0.175, accounting for about 30% of the total volume. The volume fraction of other areas ranged from 0.200 to 0.225, accounting for 16% of the total volume. When the rotating speed of the rotating chamber is 4 r/min, the area with a volume fraction greater than 0.225 is the smallest, and the area with volume fraction between 0.175 and 0.200 is the largest, and the distribution of each part is relatively uniform.
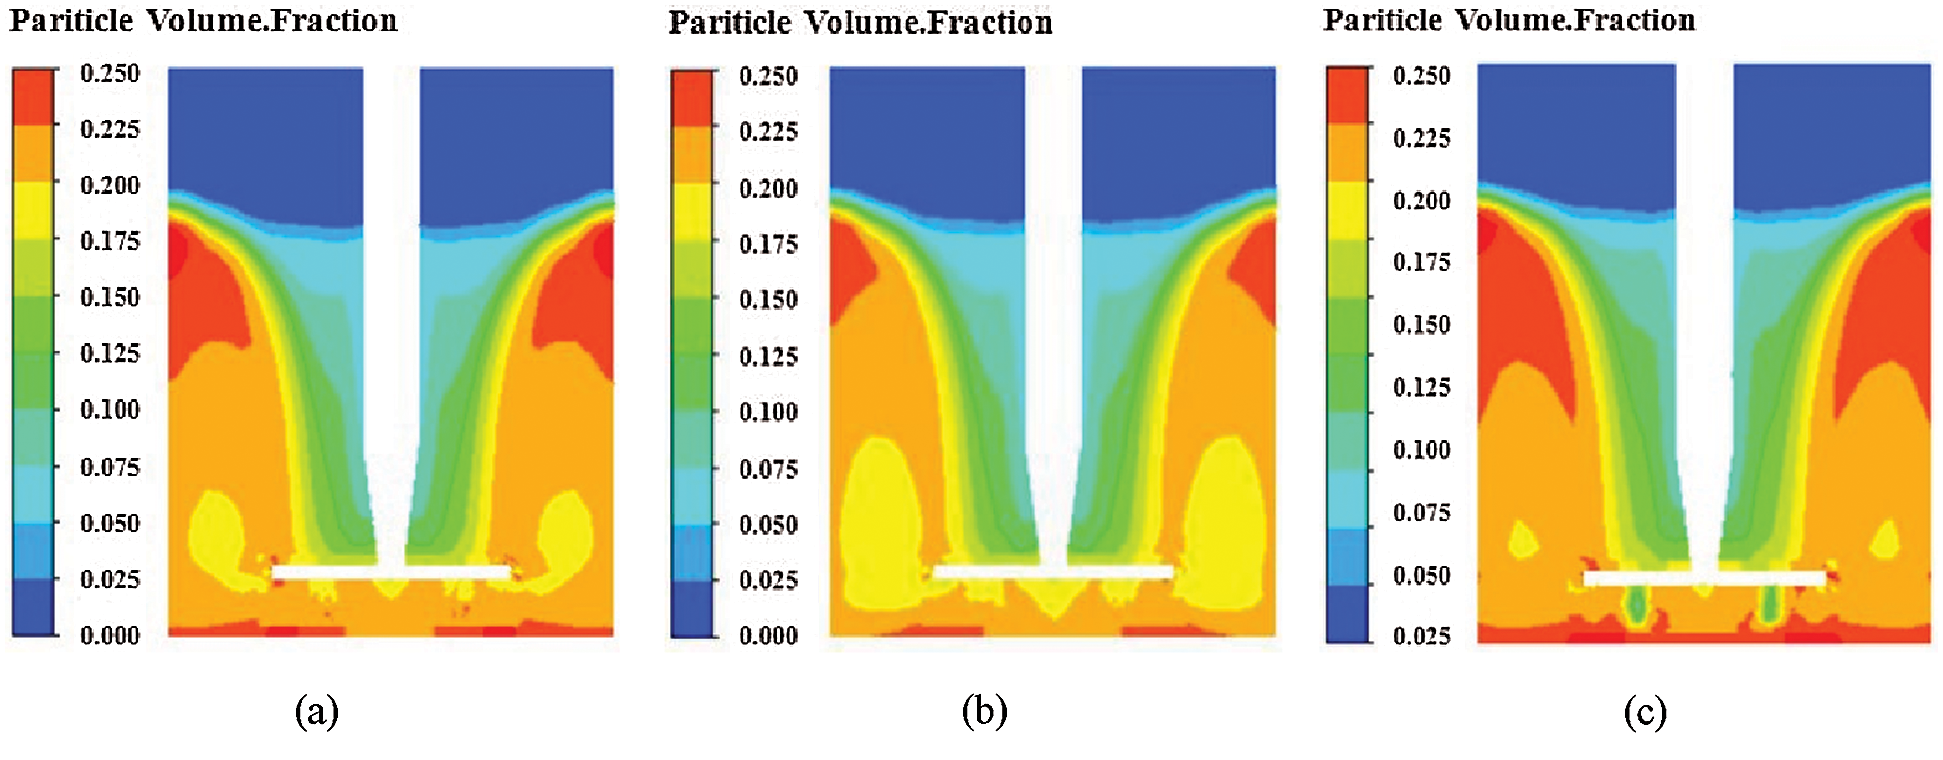
Figure 4: Axial volume distribution nephogram of SiC particle (a) ɷ1 = 2 rmp/min (b) ɷ2 = 4 rmp/min (c) ɷ3 = 8 rmp/min
4.2 Radial Volume Distribution Nephogram of SiC Particles
Fig. 5 is the radial volume distribution nephogram of SiC particles at 20 mm from the bottom of three rotating chambers at different rotating speeds. When the reverse speed of the rotating chamber is 2 r/min, the whole area is divided into two parts. From the center of the rotating chamber to the smashing reamer and the adjacent area of the wall, the volume fraction ranges from 0.100 to 0.200, accounting for about 1/5 of the total cross-sectional area. The volume fraction of the remaining areas is more than 0.200, mainly concentrated in the outer and inner barrel walls of the granulating column. When the rotating speed of the rotating chamber is 4 r/min, it is also divided into two parts. The volume fraction from the center of the revolving chamber to the adjacent area of the grinding reamer and the inner wall is between 0.100 and 0.200, accounting for about 55% of the total cross-sectional area. The volume fraction of the other areas is more than 0.200, mainly concentrated on the outside and the wall of the granulating column. When the rotating chamber speed is 8 r/min, it is divided into two parts. From the center of the rotating chamber to the area near the grinding reamer and wall, the volume fraction ranges from 0.100 to 0.200, accounting for about 40% of the total cross-sectional area. The volume fraction of the remaining areas is more than 0.200, mainly concentrated on the outer and inner walls of the granulating column. When the reverse speed of the rotating chamber is 4 r/min, the area of the volume fraction of the rotating chamber is the largest between 0.100 and 0.200.
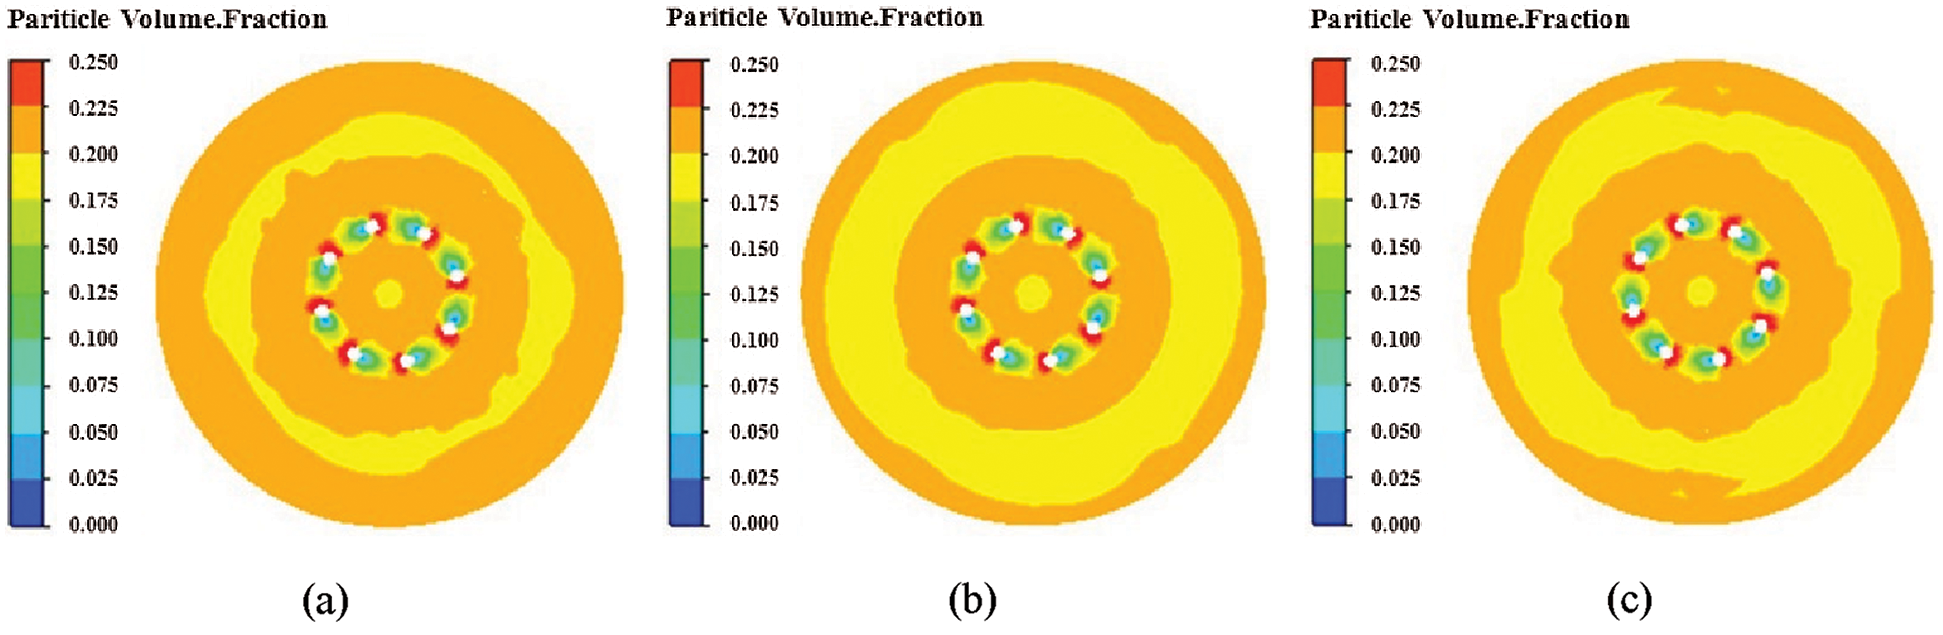
Figure 5: Radial volume distribution nephogram of SiC particles (a) ɷ1 = 2 rmp/min (b) ɷ2 = 4 rmp/min (c) ɷ3 = 8 rmp/min
4.3 Axial Velocity Vector Diagram of SiC Particles
Fig. 6 is an axial velocity vector diagram of SiC particles in the granulating chamber at three different reverses rotating speed. The crushing reamer rotates to produce a horizontal jet, which drives the particles nearby to diffuse rapidly, and distributes upward and downward respectively on the impact inner wall, then generates a radial flow to the stirring spindle, and finally rotates upward and downward back to the crushing reamer to form two symmetrical eddy rings. It can be seen from Fig. 6 that the change trend of the velocity vector is roughly the same when the rotation speed of the granulation chamber is 2, 4, and 8 r/min. The vortex ring with 4 and 8 r/min speed is larger than that with 2 rmp/min speed. When the rotating speed of the rotating chamber is 4 r/min, the speed of vortex ring formed between the mixing spindle and the granulation chamber is the highest, and the vortex ring with the speed between 0.75–1.00 is the most, so that the SiC particles can be mixed more quickly and fully in the granulation chamber.
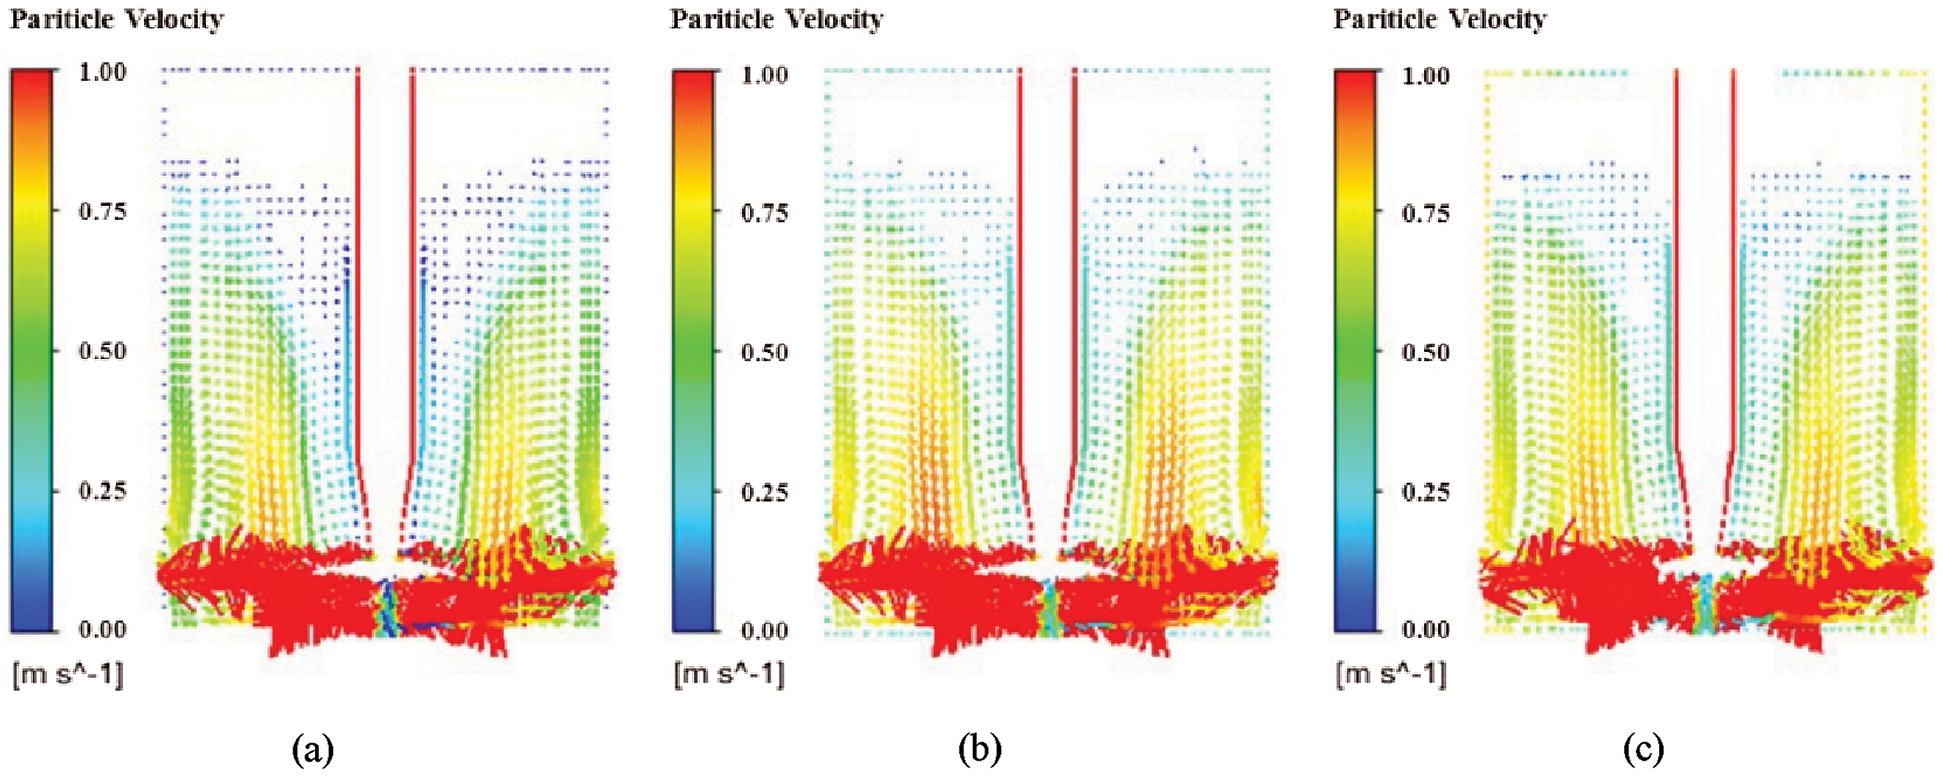
Figure 6: Axial velocity vector diagram of SiC particles (a) ɷ1 = 2 rmp/min (b) ɷ2 = 4 rmp/min (c) ɷ3 = 8 rmp/min
4.4 Axial Velocity Nephogram of SiC Particles
Fig. 7 shows the axial velocity nephogram of SiC particles in the rotating chamber at three different reverse rotating speeds. When the rotating speed of the rotating chamber is 2 r/min, it is divided into three parts. The velocity from the center of the rotating chamber to the crushing reamer and the upper part ranges from 1.00 to 2.00, accounting for about 6% of the total cross-sectional area. The speed of the grinding reamer from the center of the rotating chamber on both sides and bottom is more than 2.00, accounting for about 8% of the total cross-section area. The velocity of other regions is less than 1.00, accounting for 86% of the total cross section. When the rotating speed of the rotating chamber is 4 r/min, it is divided into three parts. The speed from the center of the revolving chamber to the crushing reamer and the upper part ranges from 1.00 to 2.00, accounting for about 10% of the total cross-sectional area. The speed of the grinding reamer from the center of the rotating chamber on both sides and bottom is more than 2.00, accounting for about 8% of the total cross-section area. The velocity of other regions is less than 1.00, accounting for about 82% of the total cross section. When the rotating speed of the rotating chamber is 8 r/min, it is divided into three parts. The velocity from the center of the rotating chamber to the top of the grinding reamer ranges from 1.00 to 2.00, accounting for about 8% of the total cross-sectional area. The velocity of the grinding reamer from the center of the rotating chamber to both sides and bottom is more than 2.00, accounting for about 8% of the total cross-section area, and the velocity of the remaining area is less than 1.00, accounting for about 84% of the whole cross-section. When the rotating speed of the rotating chamber is 4 r/min, the area of particle velocity between 1.00 and 2.00 is the largest and the height is higher.
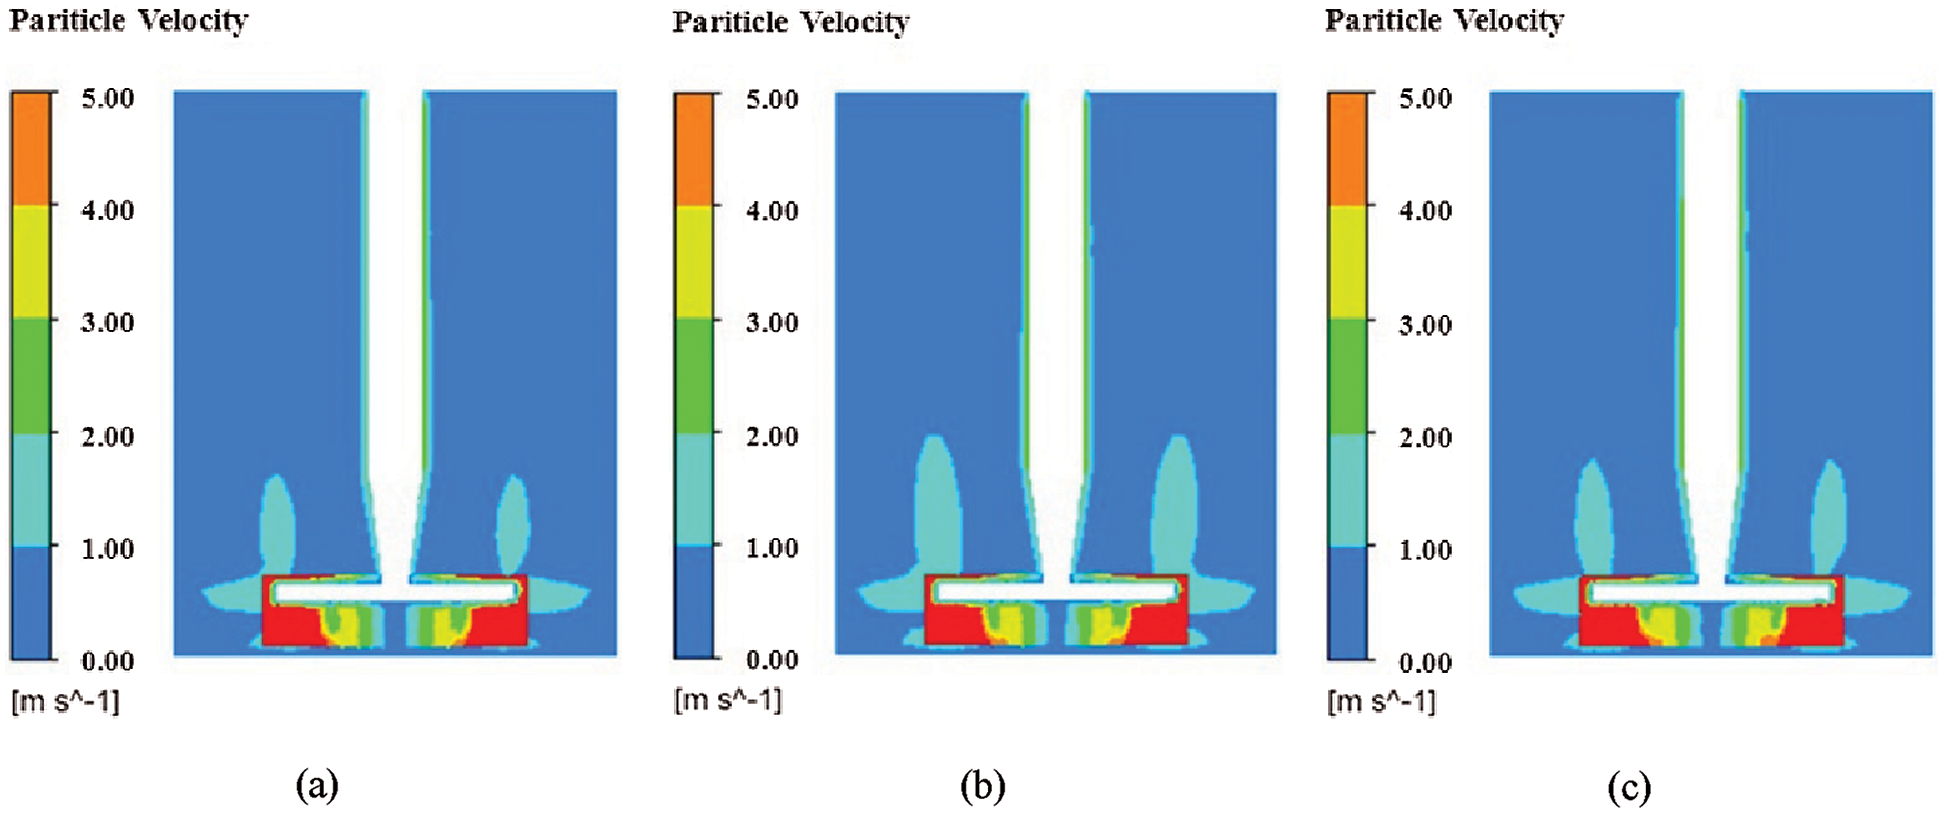
Figure 7: Axial velocity nephogram of SiC particles (a) ɷ1 = 2 rmp/min (b) ɷ2 = 4 rmp/min (c) ɷ3 = 8 rmp/min
4.5 Radial Velocity Nephogram and Vector Diagram of SiC Particles
Fig. 8 shows the radial velocity nephogram and vector diagram of SiC particles at three different reverse rotational speeds in the rotating chamber. The radial cloud of SiC particle velocity shows a layered distribution. The velocity at the grinding cutter is the highest, and the outward velocity decreases in turn. When the reverse speed of the rotating chamber is 2 r/min, the radial velocity distribution cloud image is divided into three regions. The maximum speed of the grinding reamer is over 2.00, and the speed near the cutter is between 1.00 and 1.20, accounting for 18% of the total cross-section area. The speed in other areas is below 1.00, accounting for 70% of the total cross-section area. When the rotating speed of the rotating chamber is 4 r/min, the radial velocity distribution cloud image is divided into three regions. The maximum speed of the cutter is more than 2.00, and the speed near the cutter is between 1.40 and 1.60, which account for 10% of the total cross-section area. The speed in the other areas is less than 1.40, which accounts for 78% of the total cross-section area. When the rotating chamber velocity is 8 r/min, the radial velocity distribution cloud image is divided into four regions. The maximum speed of the cutter is over 2.00, and the speed near the cutter is between 1.00 and 1.20, accounting for 14% of the total cross-sectional area. Some regions have velocities between 1.40 and 1.60, while others have velocities below 1.00, accounting for 78% of the total cross-sectional area.
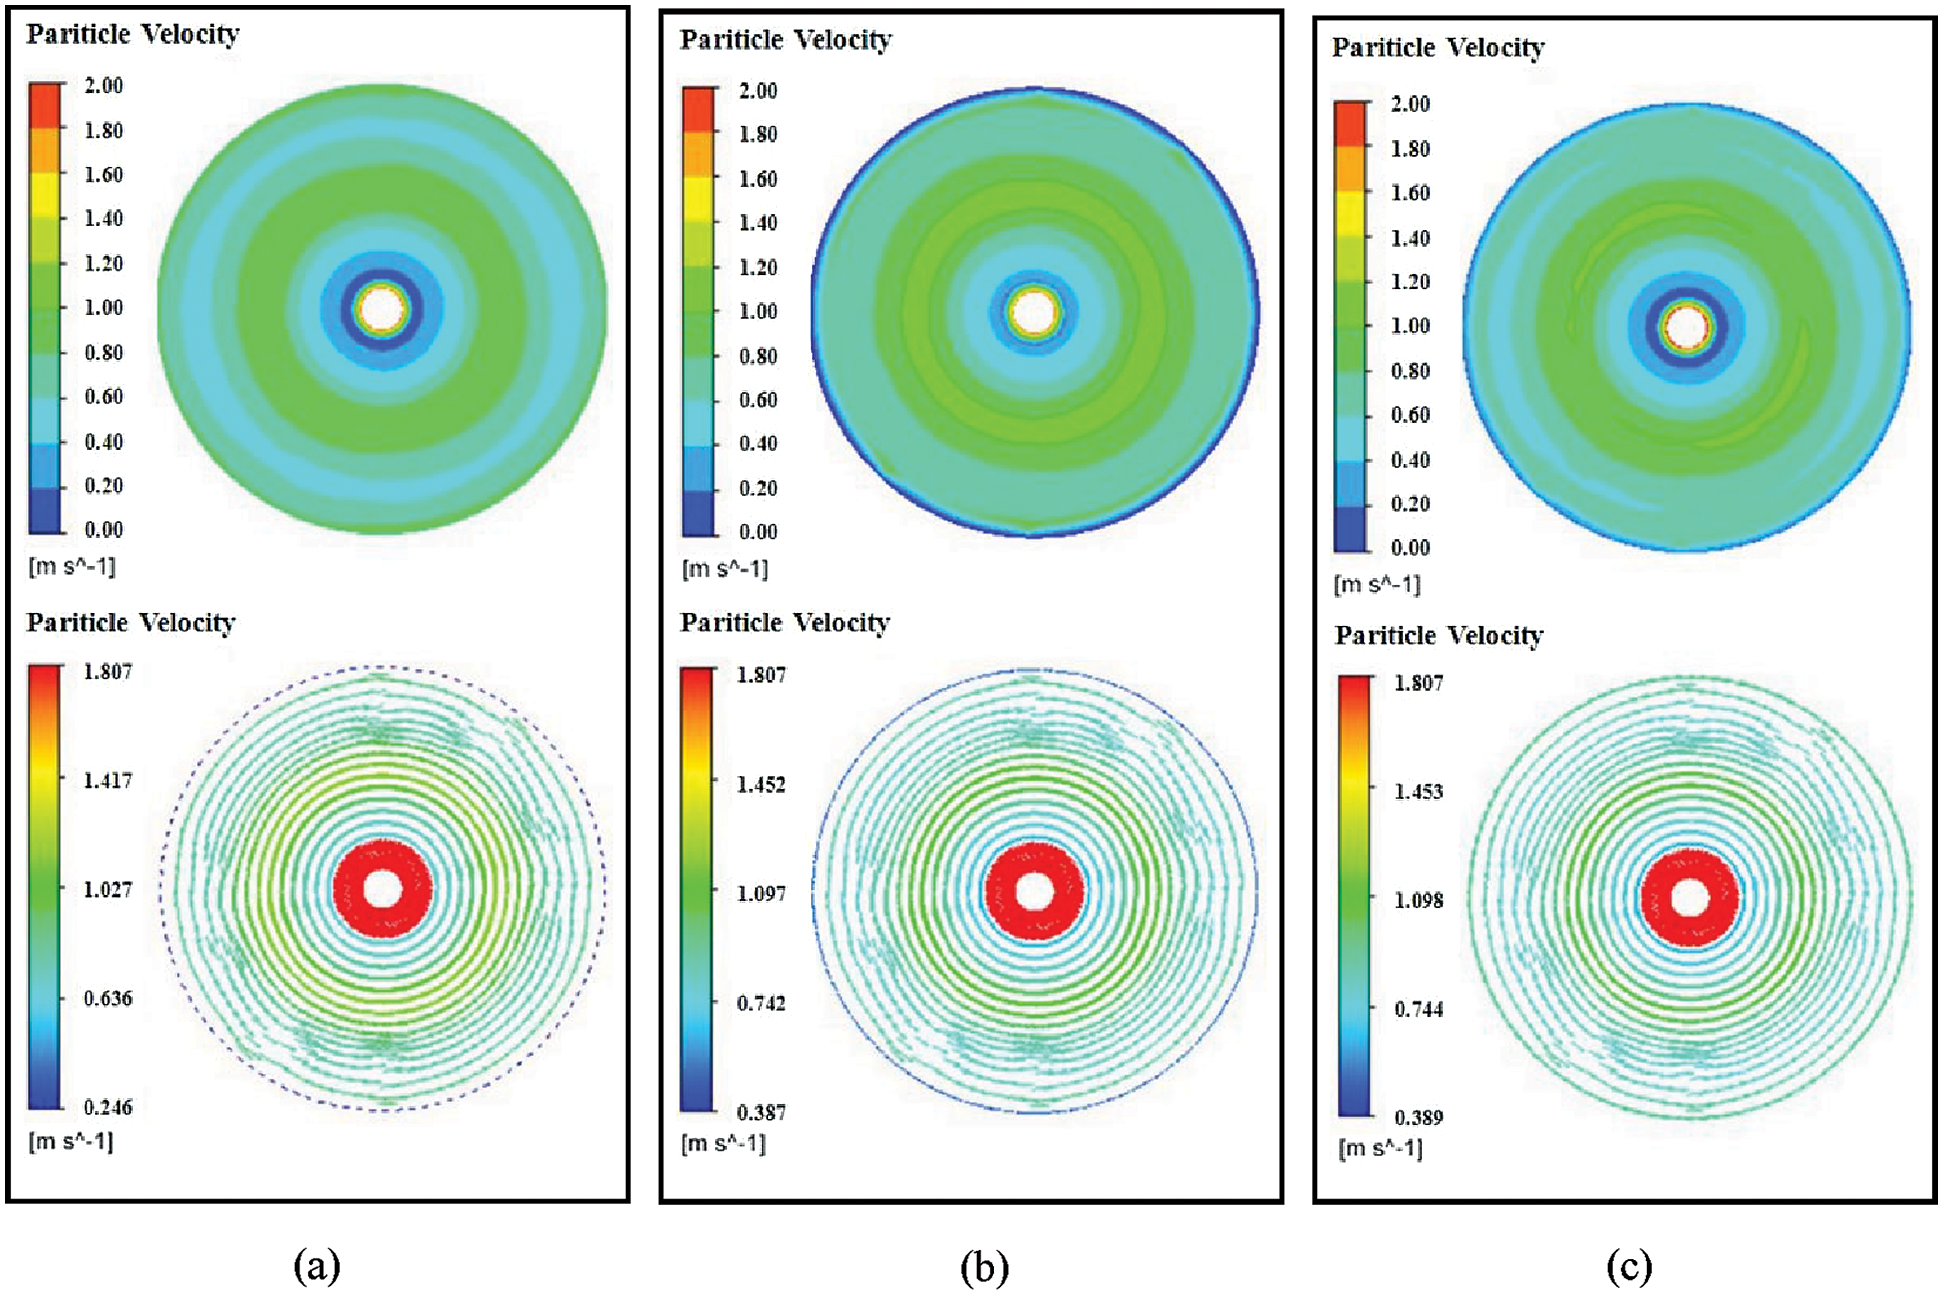
Figure 8: Radial velocity nephogram and vector diagram of SiC particles (a) ɷ1 = 2 rmp/min (b) ɷ2 = 4 rmp/min (c) ɷ3 = 8 rmp/min
The main raw materials of the experiment are SiC powder (w (SiC) = 99.0%, D = 100 um), SiC powder (w (SiC) = 98.0%, D = 2.5 um). The required granulation additives are dibutyl phthalate, polymethyl methacrylate, polyvinyl alcohol, polyacrylamide, sodium alginate. Specific and water. Experimental ratios are shown in Tab. 2.
Table 2: Experimental proportioning

5.2 Construction of Experimental Platform
Three groups of SiC powder and 50% SiC powder were selected as experimental materials according to the ratio in Tab. 2. At the same time, granulation additives were prepared according to the ratio in Tab. 2. The raw materials were added into the SiC ceramic rotating chamber, and the grinding reamer was rotated clockwise at 160 r/min, while the rotating chamber was rotated counterclockwise at 2, 4, and 8 r/min, respectively. When the grinding reamer and the rotating chamber rotate at the same time, properly proportioned granulating additives are evenly sprayed into the SiC ceramic rotating chamber through the ultrasonic atomizing nozzle. The raw materials and the granulating additives are fully mixed to achieve the granulating effect. After the granulation, granulating additives enter the stale silo. After 24 h, the SiC particles were divided into two parts: one was air-dried, the other was enhanced by gold plating. The micromorphology of the SiC particles was observed and analyzed by Scanning Electron Microscopy (SEM, JSM-IT300, BaHens(China) Instrument Co, Ltd., Shanghai, China). The morphology of SiC particles was observed and the sphericity of the SiC particles was calculated. In the other, the plate angle, the angle of repose, coacervation, and compression degree were measured by Intelligent Powder Physical Property Tester (BT1001, Bettersize Instruments, Ltd., Dandong, China), and the liquidity index was calculated. The experimental process is shown in Fig. 9. The experimental principle is shown in Fig. 10.
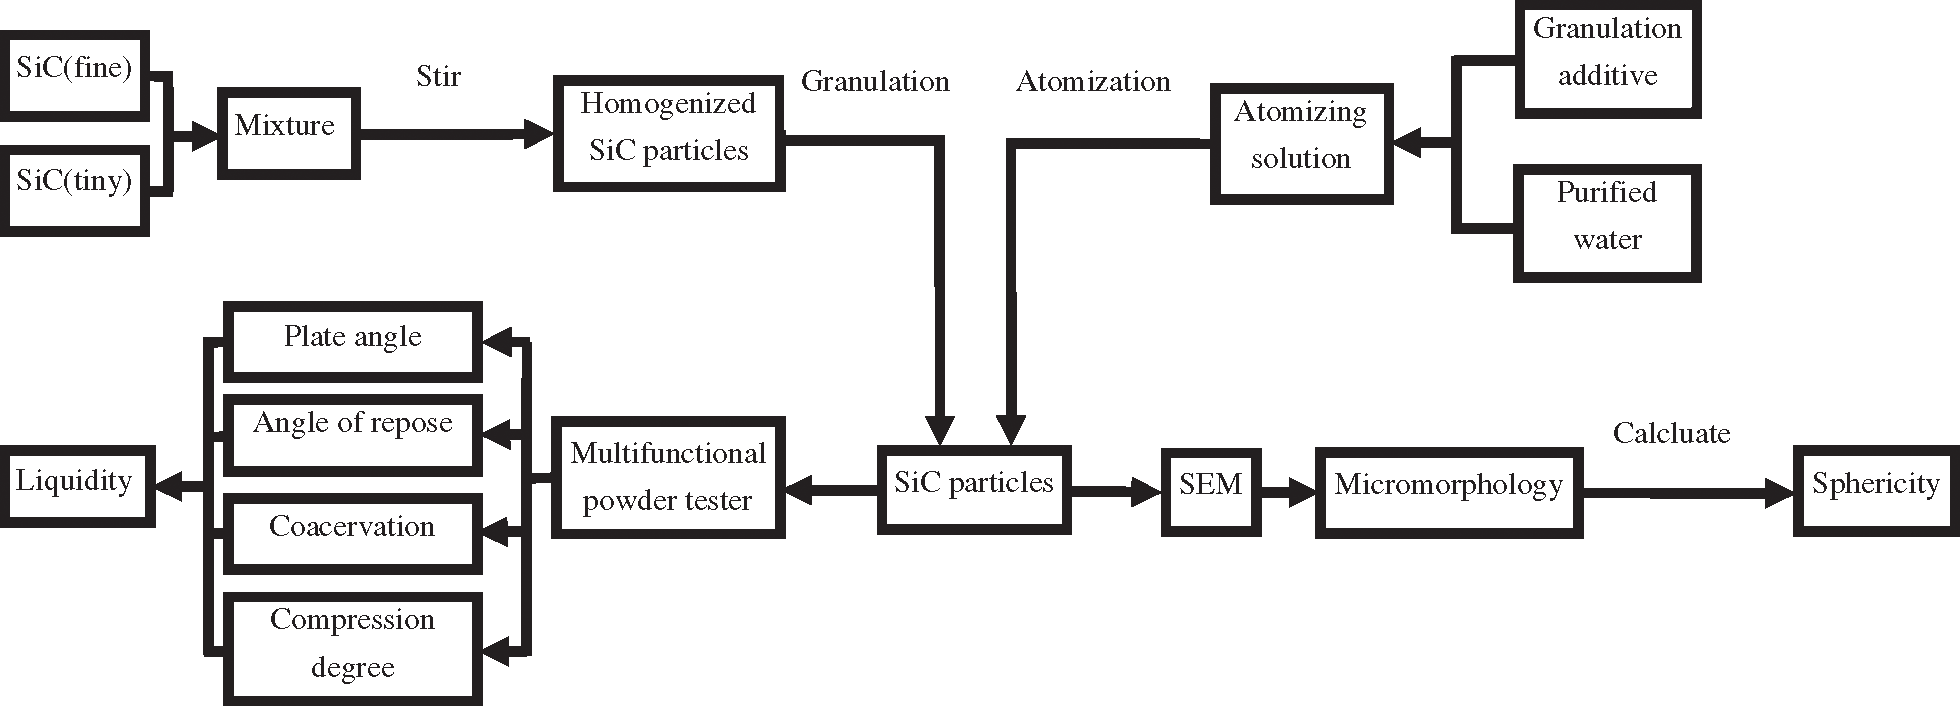
Figure 9: Flow chart of experiment
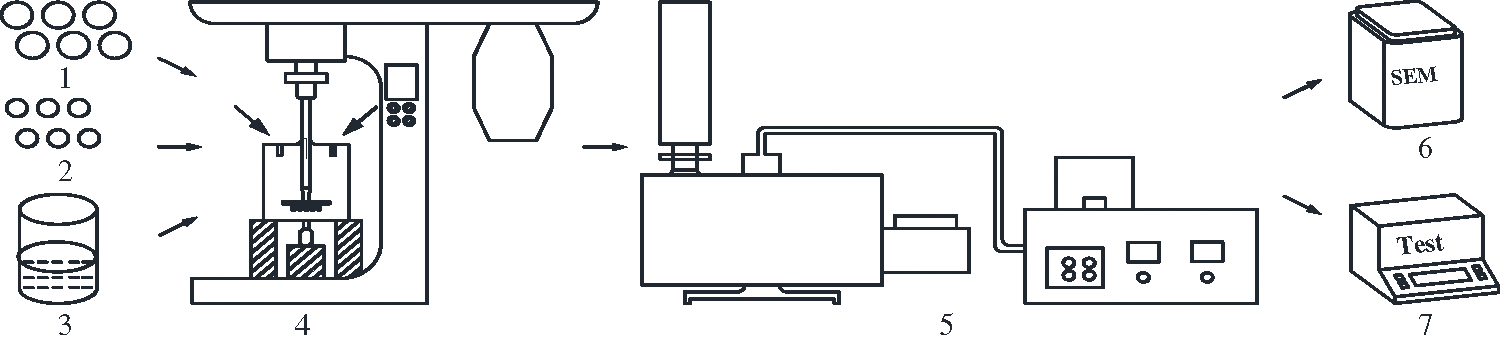
Figure 10: Schematic diagram of experiment 1-SiC(fine); 2-SiC(tiny); 3-Granulation additive; 4-Centrifugal granulator; 5-Sputter coating instrument; 6-SEM; 7-Multifunctional powder tester
5.3.1 Microstructure Analysis of SiC Particles
Scanning electron microscopy (SEM) was used to observe the SiC particles obtained in the rotating chamber at three different reverses of rotating speed. The magnification was 100 times. The sphericity is invoked as the criterion to judge the mixing effect of the particles. Sphericity: The ratio of the surface area of a sphere of the same volume to the surface area of an object.
The molecule is the surface area of the sphere with the same volume as the object, the denominator is the surface area of the actual object. The sphericity of the sphere is 1. The closer the sphere is, the closer the particle is to the sphere. When there are many objects observed, the average sphericity is usually used to judge.
The average sphericity of SiC particles prepared at the reverse rotating speed of 2 r/min, 4 r/min, and 8 r/min in the rotating chamber were 0.62, 0.71, and 0.57, respectively. The sphericity of SiC particles is the highest when the reverse rotating speed of the rotating chamber is 4 r/min. Scanning electron microscopy analysis photos are shown in Fig. 11. When the reverse rotating speed of the rotating chamber is 2 r/min, the photograph (a) shows that some SiC particles are larger, some are smaller and the average sphericity is 0.62; when the reverse rotating speed of the rotating chamber is 4 r/min, the photograph (b) shows that most SiC particles are larger, a small part is smaller and the average sphericity is 0.71; when the reverse rotating speed of the rotating chamber is 8 r/min, the photograph (c) shows most SiC particles. The volume of fractional SiC particles is smaller, and a small part of them is larger, with average sphericity of 0.57. By comparing the three photographs, when the rotating speed of the rotating chamber is 4 r/min, SiC has the largest number of particles and the highest average sphericity.
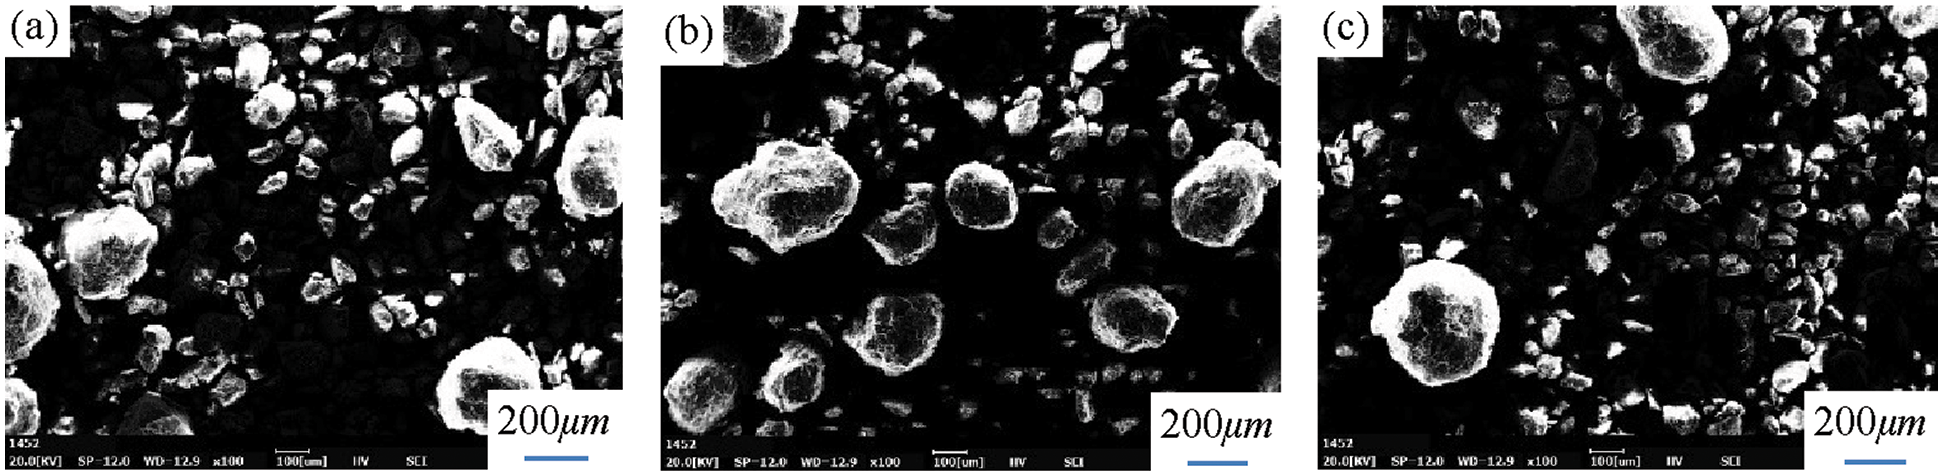
Figure 11: SEM photographs at three different reverse speeds (a) ɷ1 = 2 r/min (b) ɷ2 = 4 r/min (c) ɷ3 = 8 r/min
5.3.2 Fluidity Analysis of SiC Particles
The angle of repose refers to the acute angle between the inclined plane of natural accumulation of powder and the horizontal plane at the bottom under the state of static equilibrium; plate angle is the average value of the angle between the free surface and the horizontal plane of the powder and the angle after a certain impact; compression degree refers to the ratio of the difference between tap density and bulk density and tap density; coacervation refers to the quality of the residual agglomerated powder on the sieve after the powder is vibrated by the standard sieve within a certain period of time. Liquidity index is the weighted sum of angle of repose, plate angle, compression degree, and coacervation. The liquidity index is also an important index to determine the mixing effect of particles. As showing in Tab. 3, the relationship between three different reverses rotational speed of the rotating chamber and the liquidity index of SiC particles is discussed.
Table 3: Liquidity index and reverse speed of rotating chamber
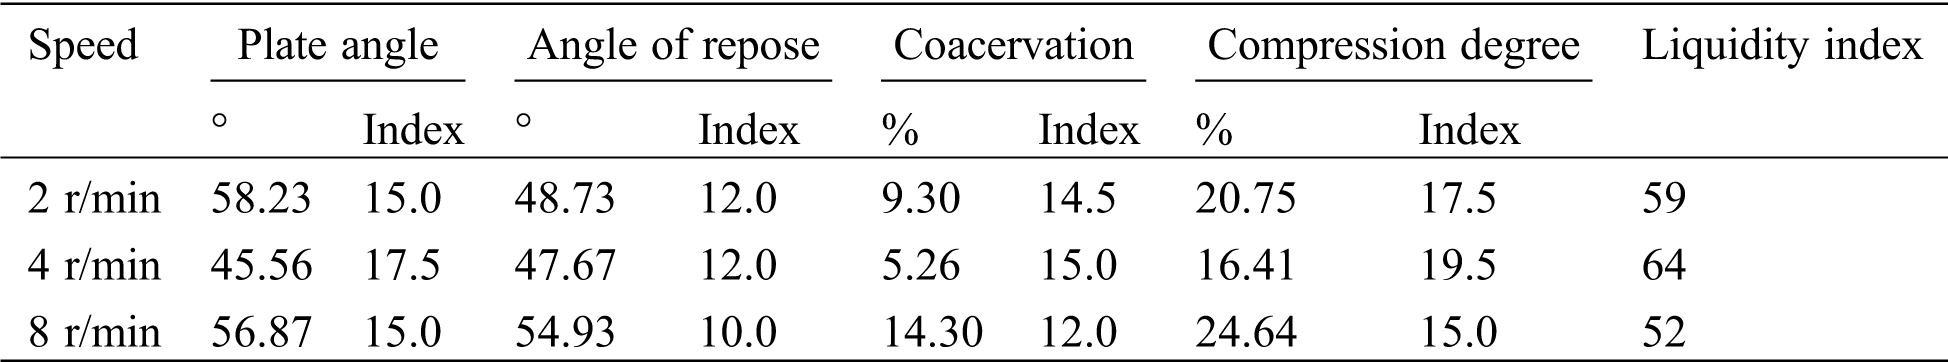
When the reverse rotating speed of the rotating chamber is 2 r/min, the plate angle, angle of repose, coacervation, compression degree of SiC particles are 58.23, 48.73, 9.30, and 20.75, respectively, and the liquidity index is 59. When the reverse rotating speed of the rotating chamber is 4 r/min, the plate angle, angle of repose, coacervation, compression degree of SiC particles are 45.56, 47.67, 5.26, and 16.41, respectively, and the liquidity index is 64. When the reverse rotating speed of the rotating chamber is 8 r/min, the plate angle, angle of repose, coacervation, compression degree of SiC particles are 56.87, 54.93, 14.30, and 24.64, respectively, and the liquidity index is 52. When the rotating speed of the rotating chamber is 4 r/min, the fluidity of SiC particles is the best.
Any simulation can be used in engineering only if it is checked by experiments. Simulation has the advantages of low cost, short cycle, and good display effect of the flow field. It is very suitable to explore the influence of reverse speed of the rotating chamber on the mixing process of SiC ceramic dry granulation, and experiments are used as a means to test the optimization effect of simulation. According to the experimental results of micromorphology and fluidity, there is a good consistent with the simulation results, which verify the correctness of the numerical simulation results and strengthen the certainty of simulation and experiment.
1. The numerical results show that setting a certain reverse rotating speed of the rotating chamber can improve the accumulation of SiC particles on the wall, change the movement direction of SiC particles on the wall, and make the SiC particles in the original forward motion move in the opposite direction, and re-join into the granulation process to reduce the accumulation. The experimental results show that the sphericity and fluidity of SiC particles are the highest when the reverse rotating speed of the rotating chamber is 4 r/min.
2. The Euler-Euler method is applied to establish the computational model of the gas-solid two-phase flow mixing process, simplify the simulation area and establish the physical model. The CFD method is used to calculate the flow field of the rotating chamber under three kinds of reverse rotating speed. The volume distribution and velocity field of the rotating chamber are compared and the influence of the reverse rotating speed on the wall stacking of the rotating chamber is analyzed. The correctness of the numerical calculation is verified by comparing the experimental results. The method and conclusion used in this paper have certain theoretical guiding significance for setting a certain reverse rotating speed to reduce the wall stacking of the SiC ceramic rotating chamber.
Acknowledgement: We are very grateful to the reviewers for their comments and language editing, which greatly improved the quality of the article, and thank the National Natural Science Foundation of China (Grant No. 51964022).
Funding Statement: This work is supported by the National Natural Science Foundation of China (Grant No. 51964022).
Conflicts of Interest: The authors declare that they have no conflicts of interest to report regarding the present study.
1. Wang, B., Zheng, W. K., Li, H., Ding, S. X. (2015). Progress of powder making process of ceramic tiles in China. Silicate Bulletin, 34(5), 1312–1319. [Google Scholar]
2. Wang, D. J., Zhou, H. Z., Huang, Z. Y. (2003). Design and CFD analysis of different speed ratios of counter-rotating axial impellers. Fluid Machinery, 31(12), 7–10. [Google Scholar]
3. Perez-Gandarillas, L., Mazor, A., Lecoq, O. (2018). Michrafy compaction properties of dry granulated powders based on drucker-prager cap model. Powder Technology, 337, 43–50. DOI 10.1016/j.powtec.2017.12.057. [Google Scholar] [CrossRef]
4. Pauli, V., Kleinebudde, P., Krumme, M. (2020). Predictive model-based process start-up in pharmaceutical continuous granulation and drying. Pharmaceutics, 12(1), 67. DOI 10.3390/pharmaceutics12010067. [Google Scholar] [CrossRef]
5. Ye, X., Kallakunta, V., Kim, D. W., Patil, H., Repka, M. A. (2019). Effects of processing on a sustained release formulation prepared by twin-screw dry granulation. Journal of Pharmaceutical Sciences, 108(9), 2895–2904. DOI 10.1016/j.xphs.2019.04.004. [Google Scholar] [CrossRef]
6. Ye, T. K., Xu, Y. X., Ren, J. (2019). Effects of SiC particle size on mechanical properties of SiC particle reinforced aluminum metal matrix composite. Materials Science and Engineering: A, 753(4), 146–155. DOI 10.1016/j.msea.2019.03.037. [Google Scholar] [CrossRef]
7. Liu, X. W., Wang, L. M., Ge, W. (2017). A study of the influence of numerical diffusion on gas-solid flow predictions in fluidized beds. AIChE Journal, 63(1), 3–14. DOI 10.1002/aic.15489. [Google Scholar] [CrossRef]
8. Dong, D. Y., Zang, C., Jin, R. X., Pan, H. J. (2012). Application of dry granulation technology in granulation process of extract powder from Chinese traditional medicine. Chinese Journal of Experimental Traditional Medical Formulae, 18(14), 306–309. [Google Scholar]
9. Wu, N. X., Zhan, T. T., Jiang, Z. T. (2014). The selection of ceramic dry granulating machine spray device based on the DPM model. Applied Mechanics and Materials, 716-717, 573–576. DOI 10.4028/www.scientific.net/AMM.716-717.573. [Google Scholar] [CrossRef]
10. Ma, X., Peng, Y., Yu, Q., Lai, K., Wu, D. (2020). Collision of single particle in rotating flow field. Chemical Engineering Research and Design, 156(4), 507–518. DOI 10.1016/j.cherd.2019.12.024. [Google Scholar] [CrossRef]
11. Yu, D. L., Hua, Y. B., Wu, N. X., Liao, D. H., Zhu, Z. X. (2017). Effect of powder forming and rotational speed of granulation chamber on dry granulation process of ceramic wall and floor tiles. Silicate Bulletin, 36(10), 3353–3360. [Google Scholar]
12. Sun, C. L., Azmi, A. M., Zhou, T. M. (2020). Experimental study on wake flow structures of screen cylinders using PIV. International Journal of Heat and Fluid Flow, 85(4), 108643. DOI 10.1016/j.ijheatfluidflow.2020.108643. [Google Scholar] [CrossRef]
13. Liu, J., Zhu, X. Z. (2018). Study on chaotic mixing characteristics of mixer fluid at different speed ratios. Plastics Industry, 46(3), 55–60. [Google Scholar]
14. Liang, Y. N. (2015). Numerical simulation of the laminar flow field in stirred tank with double layer combined impeller stirring eccentrically. Applied Mechanics and Materials, 779, 125–132. DOI 10.4028/www.scientific.net/AMM.779.125. [Google Scholar] [CrossRef]
15. Dbouk, T., Drikakis, D. (2020). On coughing and airborne droplet transmission to humans. Physics of Fluids, 32(5), 053310. DOI 10.1063/5.0011960. [Google Scholar] [CrossRef]
16. Lu, D., Yoshikawa, K., Ismail, T. M., Abd El-Salam, M. (2018). Assessment of the carbonized woody briquette gasification in an updraft fixed bed gasifier using the euler-euler model. Applied Energy, 220(1), 70–86. DOI 10.1016/j.apenergy.2018.03.063. [Google Scholar] [CrossRef]
17. Zhou, H., Gao, H., Fang, Z., Yang, J., Wu, M. (2020). Analysis of gas-solid flow characteristics in a spouted fluidized bed dryer by means of computational particle fluid dynamics. Fluid Dynamics & Materials Processing, 16(4), 813–826. DOI 10.32604/fdmp.2020.010150. [Google Scholar] [CrossRef]
18. Shen, Z. H., Pan, Z. Y., Li, H., Huang, Z. (2014). Controlling Speed of counter-rotating axial-flow sprinkler pump based on CFD. Journal of Drainage and Irrigation Machinery Engineering, 32(11), 931–936. [Google Scholar]
19. Han, Y., Chen, D., Liu, S., Xu, G. (2019). An investigation into the effects of the Reynolds number on high-speed trains using a low temperature wind tunnel test facility. Fluid Dynamics and Materials Processing, 15(1), 1–14. DOI 10.32604/fdmp.2019.04759. [Google Scholar] [CrossRef]
20. Laima, S., Jiang, C., Li, H., Chen, W., Ou, J. (2018). A numerical investigation of Reynolds number sensitivity of flow characteristics around a twin-box girder. Journal of Wind Engineering and Industrial Aerodynamics, 172(5), 298–316. DOI 10.1016/j.jweia.2017.11.016. [Google Scholar] [CrossRef]
21. Barton, P. T., Drikakis, D. (2010). An Eulerian method for multi-component problems in non-linear elasticity with sliding interfaces. Journal of Computational Physics, 229(15), 5518–5540. DOI 10.1016/j.jcp.2010.04.012. [Google Scholar] [CrossRef]
22. Barton, P. T., Obadia, B., Drikakis, D. (2011). A conservative level-set based method for compressible solid/fluid problems on fixed grids. Journal of Computational Physics, 230(21), 7867–7890. DOI 10.1016/j.jcp.2011.07.008. [Google Scholar] [CrossRef]
23. Dogruoz, M. B., Shankaran, G. (2017). Computations with the multiple reference frame technique: flow and temperature fields downstream of an axial fan. Numerical Heat Transfer, Part A: Applications, 71(5), 488–510. DOI 10.1080/10407782.2016.1277930. [Google Scholar] [CrossRef]
24. Chen, H. X., Jiang, G. J., Gao, L. (2019). Numerical simulation study of turbulent flow in vacuum tempering furnace using k-epsilon model. Transactions of FAMENA, 43(SI-1), 25–33. DOI 10.21278/TOF.43Si103. [Google Scholar] [CrossRef]
25. Inas, Y. A., Roslan, R., Alsabery, A. I., Bakar, N. A. (2021). Mixed convection in a double lid-driven cavity filled with hybrid nanofluid by using finite volume method. Symmetry, 12(12), 1–15. DOI 10.3390/sym12121977. [Google Scholar] [CrossRef]
 | This work is licensed under a Creative Commons Attribution 4.0 International License, which permits unrestricted use, distribution, and reproduction in any medium, provided the original work is properly cited. |