Materials Processing
| Fluid Dynamics & Materials Processing |
DOI: 10.32604/fdmp.2021.012114
ARTICLE
Numerical Simulation of the Mixing and Hydrodynamics of Asphalt and Rubber in a Stirred Tank
1School of Construction Machinery, Chang’an University, Xi’an, 710064, China
2School of Transportation and Logistics, Taiyuan University of Science and Technology, Taiyuan, 030024, China
*Corresponding Author: Renfeng Yang. Email: yrfeng@chd.edu.cn
Received: 15 July 2020; Accepted: 24 December 2020
Abstract: Computational fluid dynamics (CFD) has been used to analyze the mixing process of Asphalt and Rubber (AR) in a stirred tank with a six flat-blade disc turbine (Rushton), a down-pumping 45° pitched-blade turbine (PBTD-6) and a down-pumping propeller (TXL). The two-phase (solid-liquid) flow in the considered stirred tank has been modelled in the framework of an Eulerian-Eulerian approach, a laminar-flow assumption and a multi-reference frame strategy. The following effects have been investigated: The influence of the impeller speed, impeller type, crumb rubber (CR) particle diameter and initial CR particle loading on the quality of the CR particle’s suspension. The outcomes of the numerical simulations have been found to be in good agreement with the experimental results. The most important findings can be summarized as follows. The flow velocity on the lower part of the stirred tank, induced by the Rushton impeller, is the highest for the three considered mixing systems at the same impeller speed. The suspension quality of CR particles increases with the impeller speed. A larger particle diameter and a higher initial CR particle loading lead to an uneven distribution of particles. The degree of homogeneity in the Rushton impeller system is better than that of the PBTD-6 impeller system and the TXL impeller system at the same impeller speed, while the suspension uniformity of the TXL impeller system is the best possible one for the same power consumption.
Keywords: Mixing; suspension quality; CR particles; asphalt-Rubber; CFD
| Nomenclature | |
| CD: | drag coefficient |
| Ch: | local CR volume fraction at height of h |
| Cavg: | average CR volume fraction |
| d: | diameter of impeller (m) |
| dp: | solid particle diameter (mm) |
| fD: | function of drag force |
| | external body force (N) |
| g: | gravitational acceleration (m/s2) |
| H: | liquid height (m) |
| | unit stress tensor |
| Kij: | momentum exchange coefficient between phases |
| L: | sampling line |
| n: | number of sapling points |
| N: | impeller speed (rpm) |
| p: | pressure for all phases (Pa) |
| P: | power consumption (W) |
| r: | radial coordinate (m) |
| R: | stirred tank radius (m) |
| | interaction force between phases (N) |
| Re: | Reynolds number |
| Res: | relative Reynolds number |
| | stress-strain tensor of phase i (N/m) |
| t: | stirring time (s) |
| T: | stirred tank diameter (m) |
| | velocity vector of phase i (m/s) |
| | velocity vector of phase j (m/s) |
| | velocity vector of liquid phase (m/s) |
| | velocity vector of solid phase (m/s) |
| W: | baffle width (m) |
| z: | axial coordinate (m) |
| Greek letters | |
| αi: | volume fraction of phase I |
| αs: | volume fraction of solid phase |
| αl: | volume fraction of liquid phase |
| λi: | bulk viscosity of phase i (Pa·s) |
| μi: | shear viscosity of each phase i (Pa·s) |
| μl: | shear viscosity of liquid phase (Pa·s) |
| ρi: | density of phase i (kg/m3) |
| ρl: | density of liquid phase (kg/m3) |
| ρs: | density of solid phase (kg/m3) |
| τs: | particle relaxation time (s) |
At present, nearly 1.5 billion waste tires are generated around the world each year and the number is still increasing rapidly [1]. Waste tires are made of long polymer chains, most of which are crosslinked with sulfur bridges; it is very difficult to recover and recycle waste tires [2,3]. The disposal of used tires is a worldwide problem and burying or burning is the general treatment; hence, waste tires are called “black pollution” [4]. Asphalt-Rubber (AR) is a new material which is made by adding crumb waste tire rubber into base asphalt. This can reduce the amount of waste tires and it can also improve the road performance of asphalt by using natural rubber and carbon black from waste tires. Hence, AR technology is a green road construction and maintenance technology. With the adoption of the Paris climate agreement [5], a great number of countries are paying more attention to environmental protection, and AR technology has received more and more attention.
At present, there has been a lot of research on the modification effect of AR binders [6–10], which has resulted in remarkable achievements and promoted the development of AR technology. However, there have been few studies on the production process of AR binders, and uneven mixing phenomena always appear in AR production equipment. The AR binder is a solid-liquid material, and in recent years, there have been a lot of studies on the solid-liquid two-phase mixing process worldwide [11–18]. Nevertheless, a majority of the existing studies on the two-phase flow adopted water as the liquid phase and ignored the impact of the liquid’s viscosity, and the studies on the mixing process of AR binders with high viscosity are still basically missing.
CFD software has been proved to be very helpful for engineering design optimization [19–22]. Exploring the suspension quality of solid particles in the flow field and obtaining their solid-liquid suspension characteristics are very important for the design optimization and industrialization of stirred tanks. In the last two decades, CFD has been considered as a useful tool for simulating the fluid dynamics of two-phase flow in the stirred tank [14,16,23–25]. For instance, Hosseini et al. [26] predicted the normalized solid concentration profiles, cloud height, homogeneity based on CFD. Qi et al. [27] studied the impacts of particle density, particle size, liquid viscosity on mixing uniformity in a stirred tank with Smith turbine based on a CFD model. Gu et al. [25] simulated the effect of impeller type, impeller speed, impeller blades aperture ratio, particle size, and liquid viscosity on the suspension quality of solid particles in the stirred tank. Till et al. [28] explored the impact of the number of impeller blades on the mixing efficiency using a CFD model. Vilardi et al. [29] optimize the production of metallic iron nanoparticles in a baffled stirred tank reactor using CFD model. From this, it can be seen that CFD software is an effective method to simulate the suspension characteristics of solid particles.
In this paper, the suspension characteristics of asphalt and CR particles in a stirred tank with a Rushton impeller, a PBTD-6 impeller and a TXL impeller have been investigated by CFD simulation. The liquid velocity field, the axial CR concentration profiles, the contour plots of CR concentration and the cloud height in the stirred tank have been predicted. And the effects of impeller speeds, impeller types, CR particle sizes and initial CR particle loading on the suspension quality of CR particles in a stirred tank have been deeply investigated. The improved sample withdrawal method was used to verify the correctness of numerical modeling.
2 Physical Model and Experimental Methodology
As shown in Fig. 1, the experimental system consisted of a stirred tank with a diameter T = 0.3 m, equipped with four baffles with a width of W = T/10. The height (H) of liquid level was 0.3 m. The impeller’s off-bottom clearance was set at T/3. The impeller was driven by a motor (OuBang Company, China) with a power output of 250 W. The outer wall of the stirred tank was wrapped in a heating device with a power output of 7.2 KW, and a temperature controller (FengDa Company, China) was used to ensure a constant temperature of 180°C. The heating device was surrounded by a thermal insulation layer to reduce heat loss. A Rushton, a PBTD-6 and a TXL, as shown in Fig. 2, were adopted in the research; the diameter of these three impellers was d = T/3. The impeller’s power consumption was measured by a torque transducer (JinNuo Company, Model: JN-DN, China).
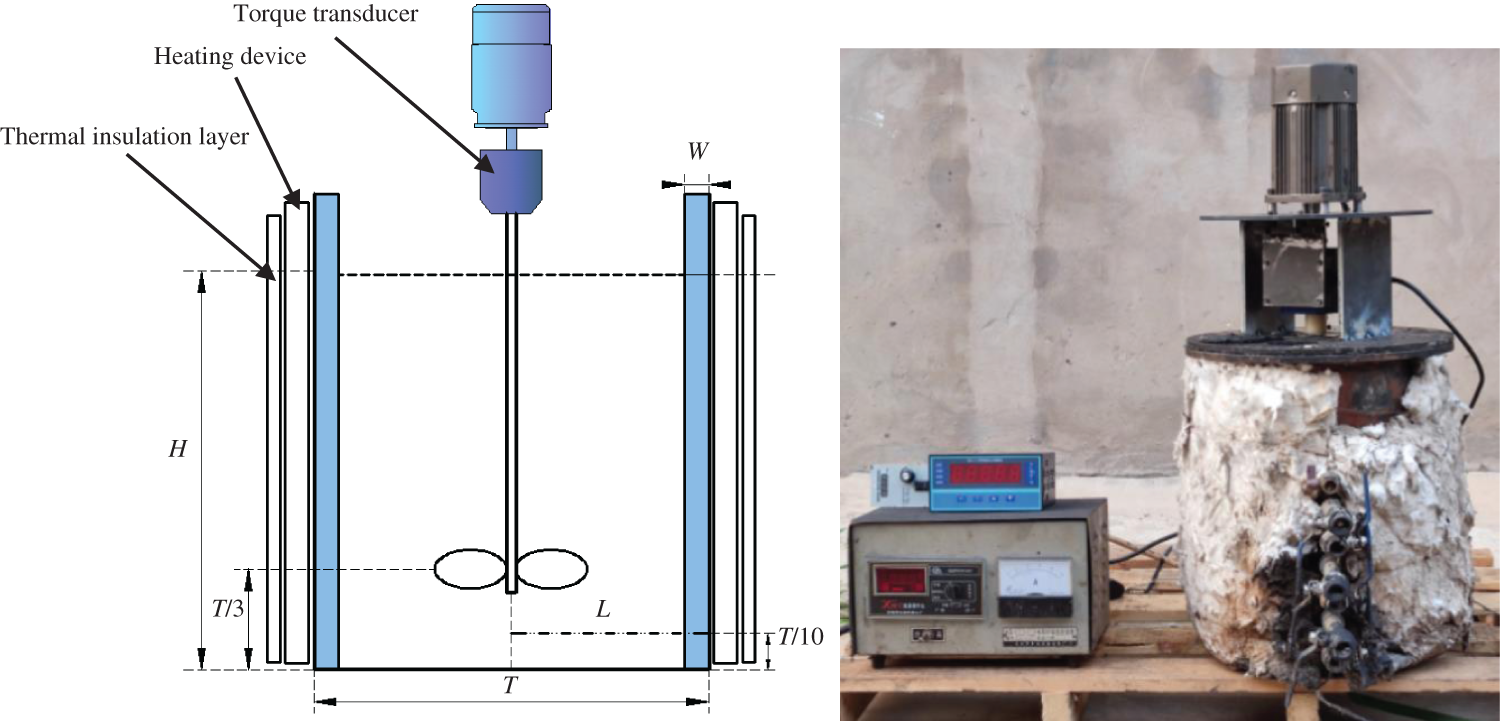
Figure 1: Schematic of the stirred tank
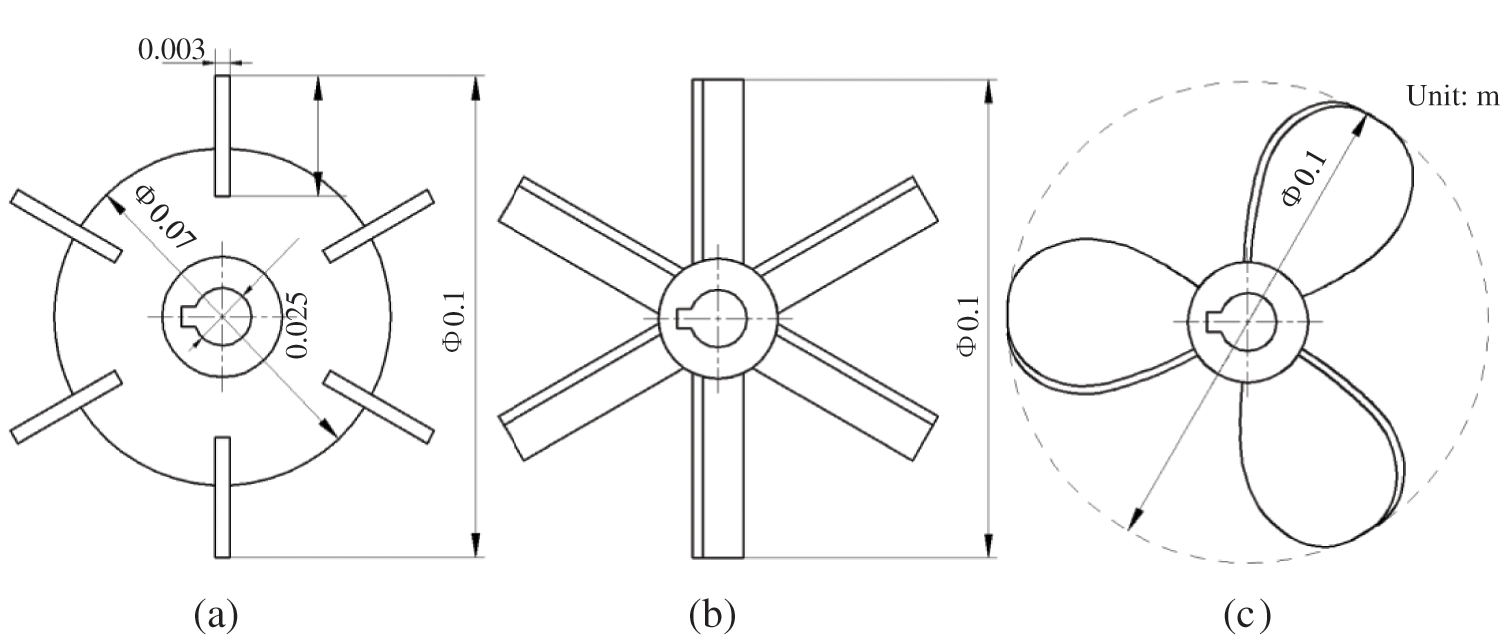
Figure 2: The structural dimensions of three impellers: (a) Rushton; (b) PBTD-6; (c) TXL
The dispersion of CR (ρs = 1170 kg/m3, particle diameter = 550 μm, particle shape is nearly spherical, Xi’an Zhongxuan Company, Xi’an, China) in asphalt (ρ1 = 900 kg/m3, μ = 1.5 Pa·s, SK Company, Seoul, Korea.) was investigated at 180°C. The CR particles were selected due to the difference of density. The asphalt is Newtonian fluid with constant viscosity at 180°C. The viscosity was tested by Rhein viscometer (Japan) following GB/T 22235-2008 [30]. The A mean CR loading of 20 vol%, which was always used in the preparation of the AR binder, was used in both the experiments and the simulations. The industrial production of AR binders was always divided into two steps: Pre-mixing and maturing mixing (solid-liquid suspension process). Hence, in order to be consistent with the reality, before the suspension experiment, the AR binders were pre-mixed for 5 min at 1500 rpm to ensure even mixing, and in order to avoid inadequate settlement caused by the lower density difference, mixing time of 500 s was used for the suspension experiments. At present, the sample withdrawal method [31,32] is always used to verify the accuracy of the CFD model. However, due to the sharp fall in the temperature of the AR binder when the samples were taken out and the density of asphalt being obviously changed, the conventional sample withdrawal method makes it difficult to accurately measure the content of the CR in the asphalt. In order to accurately measure the CR content, trichloroethylene and petrol were used to dissolve the asphalt in the samples. Then the CR particles were filtered out using a steel net with 300 mesh (50 μm) and dried in an oven, and the mass of the CR particles was then weighed. Finally, the volume fraction of the CR in the samples was obtained. The samples were withdrawn at seven axial positions of the stirred tank where z/H = 0.125, 0.25, 0.375, 0.5, 0.625, 0.75 and 0.875 in this paper. 100 g of AR binder was taken at every sampling position in this paper. It is worth mentioning that a large amount of trichloroethylene and petrol were needed to dissolve asphalt. Here we can refer to the literature Asphalt Solubility Test [33]. Moreover, due to trichloroethylene being a volatile carcinogen, gas masks (3M Company, Model: 3200, China) were worn during the experiments.
In this paper, the solid-liquid flow was modeled based on Eulerian-Eulerian multifluid model. In this model, the phases were seen as continua, interpenetrating and interacting with each other in the flow field [15,18]. The governing equations of which are as follows:
Continuity equations [15]:
Momentum equations [15]:
where,
where, i denotes the phase, i = s and i = l represent solid phase and liquid phase, respectively; αi is the volume fraction of each phase; ρi is the density of each phase;
The following formula is used to calculate the interphase force [18]:
where, Kij is the momentum exchange coefficient between the phases; fD is the function of the drag force; τs is the particles’ relaxation time and dp is the solid particles’ diameter. In the commonly used drag model, the Gidaspow model is combined with the Ergun formula on the basis of the Wen-Yu model, and the ensuing calculation is more accurate. The exchange coefficient was calculated as follows [11,34]:
where, CD is the drag coefficient [11,34]:
The relative Reynolds number is defined as [18,24]:
According to the definition of the Re number (Re = ρNd2/(60μ)), the maximum value was Re = 42 in the mixing system, which indicates that laminar flow occurred in the stirred tank.
3.2 Methodology and Boundary Conditions
In this paper, the MRF technology was employed to simulate the rotation zone with impeller. As shown in Fig. 3, the unstructured tetrahedral grid was used in rotation zone due to the complexity of impeller structure, while the structured hexahedral grid was used in non-rotation zone to improve the accuracy and convergence of calculation. Some models are partitioned using unstructured grids due to the convergence. A grid independence test was carried out to avoid the influence of the grid number on the accuracy of the calculation. Taking the Rushton impeller system as an example, the variation of the velocity magnitude with z/H (z being the Z axis coordinate) has been shown in Fig. 4 for the division of three grid numbers. When the number of grids was increased from 682301 to 1325864, the relative deviation was less than 3%. Within the allowable range of the project, the number of grids used for the Rushton impeller system was 682301. Similarly, the number of grids used for the PBTD-6 system and the TXL system were 623578 and 685264, respectively. Fig. 5 has shown the comparison of the local axial CR concentration profiles both with the temperature boundary condition (180°C) and without; this has shown that the temperature had little impact on the distribution of particles. For the sake of simplicity, the temperature boundary conditions were not considered in the CFD model. Considering the impact of steady-state MRF simulations of the two-phase system on the model [35], the average CR concentration computed by the model is 20 vol%.
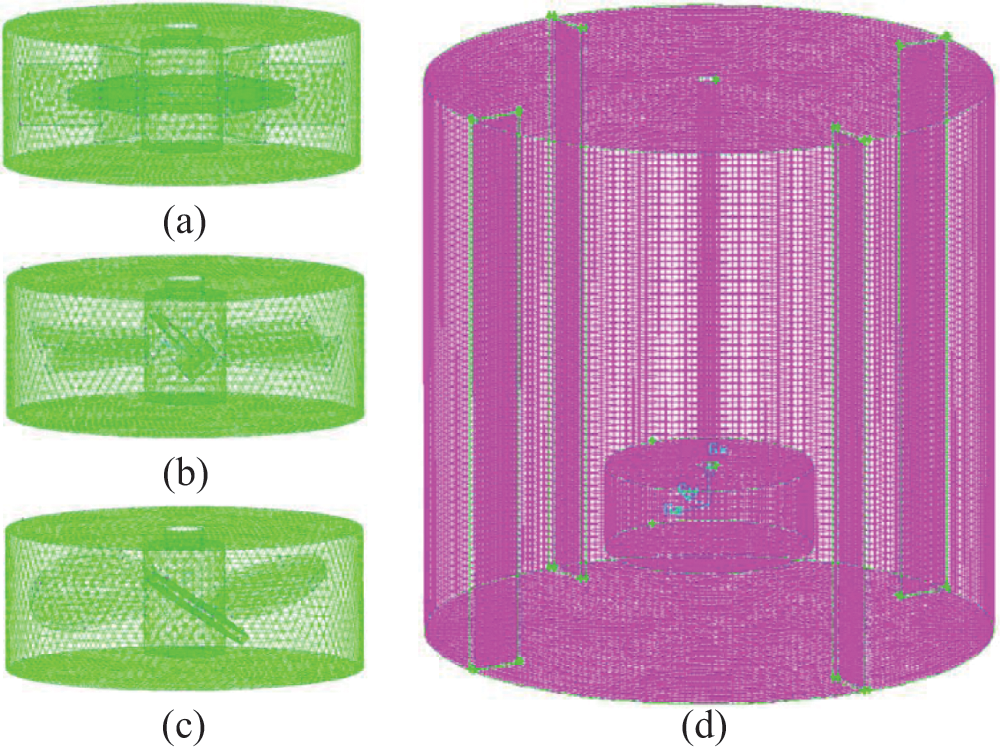
Figure 3: Grid model of the stirred tank: (a) Rushton; (b) PBTD-6; (c) TXL; (d) Stirred tank
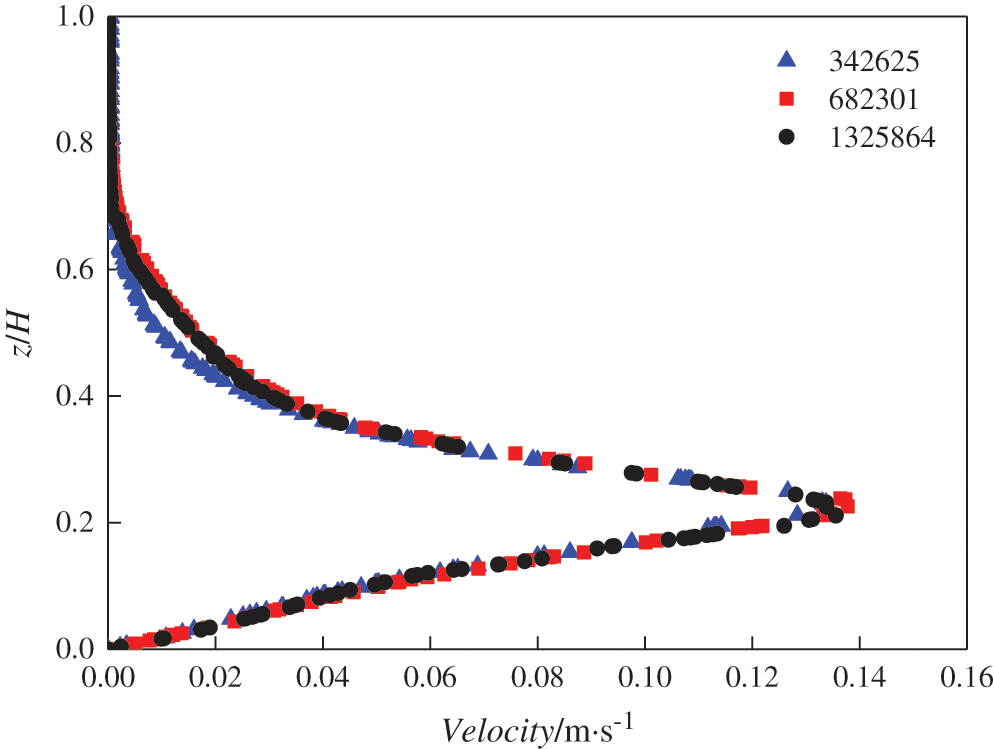
Figure 4: Grid independence verification (particle diameter = 550 μm, r/R = 0.4, N = 60 rpm)
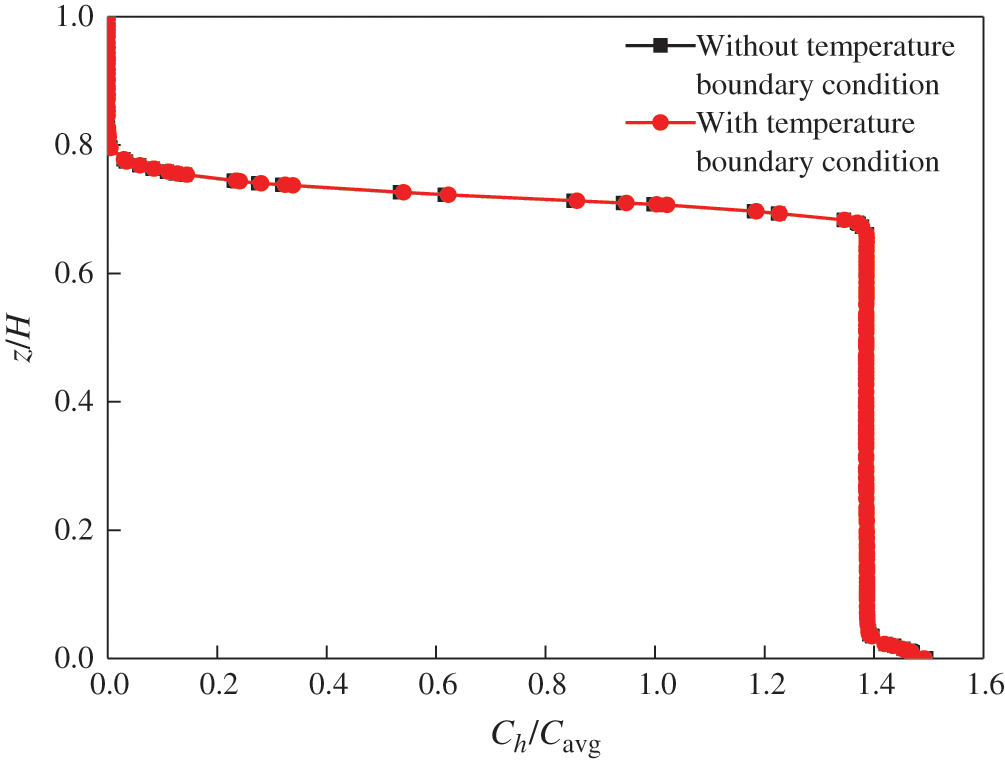
Figure 5: Temperature boundary condition verification (particle diameter = 550 μm, r/R = 0.8, N = 60 rpm)
The ANSYS FLUENT 18.0 was used to calculate simulation model. Asphalt is the incompressible fluid. All terms of governing equations were discretized by a first-order upwind and the coupling of the pressure and the velocity was carried out using the SIMPLEC algorithm [24]. The steady-state model was used for calculation. The relative residual was set at 1 × 10⁻⁴, which was considered to be the convergence index.
In order to validate the correctness of numerical simulation, the results of computation were validated by experimental measurements. The improved sample withdrawal method was employed to measure the local CR concentration. Fig. 6 has shown the variation trend of the local axial CR concentration profiles between the simulation and the experimental results were similar although there are some deviations. Therefore, the correctness of CFD model is proved.
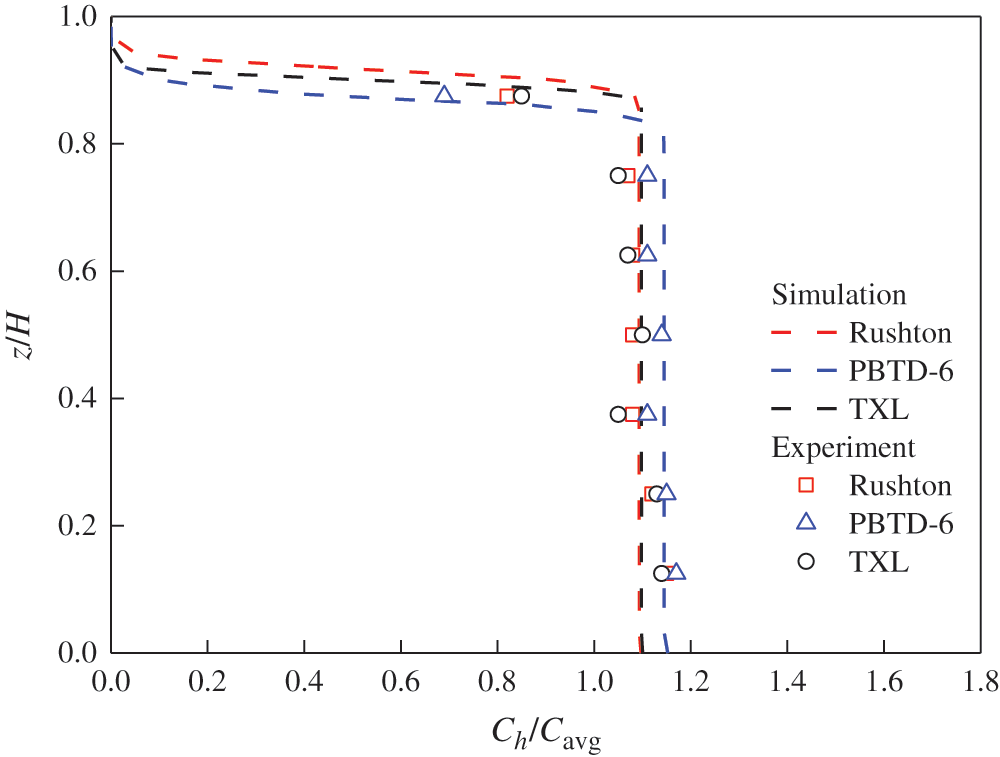
Figure 6: Verification of the model: Comparison of the local axial CR concentration profiles between the simulation and the experiment (particle diameter = 550 μm, r/R = 0.8, N = 300 rpm)
4.2 Distribution of the Liquid Velocity Field
Fig. 7 has illustrated the two-dimensional liquid velocity contour for the Rushton impeller, the PBTD-6 impeller and the TXL impeller. It can be found that a typical two-loop flow pattern was obtained when the Rushton impeller and the PBTD-6 impeller were adopted in the stirred tank. When these two impellers were employed, the fluid flowed from the impeller to the wall and divided into upper and lower streams, converged at the center of the stirred shaft, which is consistent with Liu’s research [18]. Meanwhile, it can be seen that the strength of the flow field near the bottom of the stirred tank with the Rushton and the TXL was greater than the PBTD-6 impeller system, which is beneficial to the CR particles’ suspension.
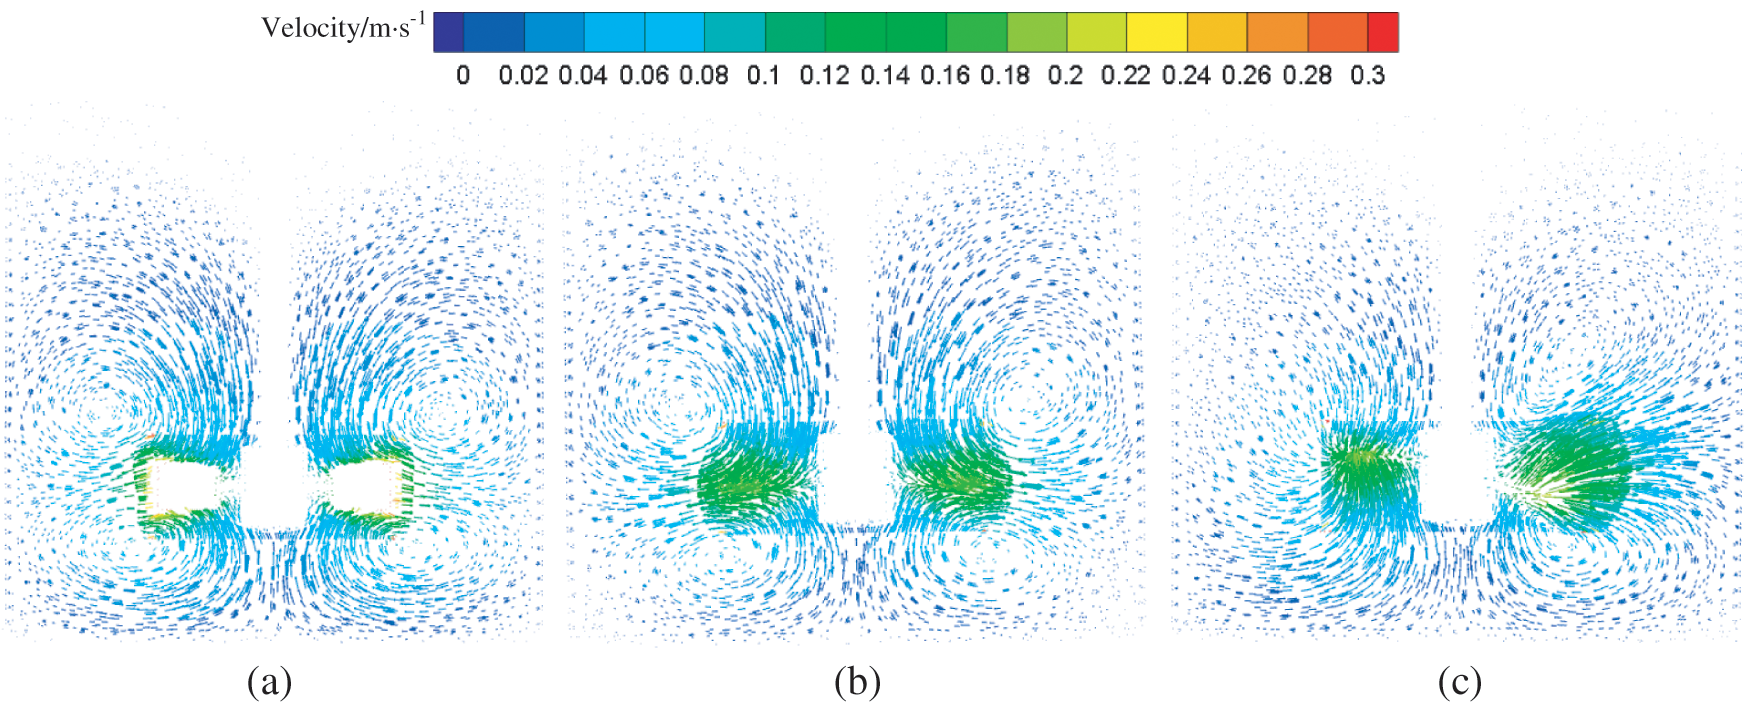
Figure 7: Liquid velocity field distribution corresponding to the different impellers (N = 60 rpm, particle diameter = 550 μm): (a) Rushton; (b) PBTD-6; (c) TXL
Fig. 8 has illustrated the axial, radial, and tangential liquid velocities on the sampling line L (shown in Fig. 1) for the Rushton impeller, the PBTD-6 impeller and the TXL impeller. These three velocities in the stirred tank with the Rushton impeller were higher than those of the other two impeller systems, which indicated that CR particles in Rushton impeller system were easy to suspend at same impeller speed. The radial velocities of the TXL impeller were lower than those of PBTD-6 impeller, while its tangential velocities were higher than those of the PBTD-6 impeller.
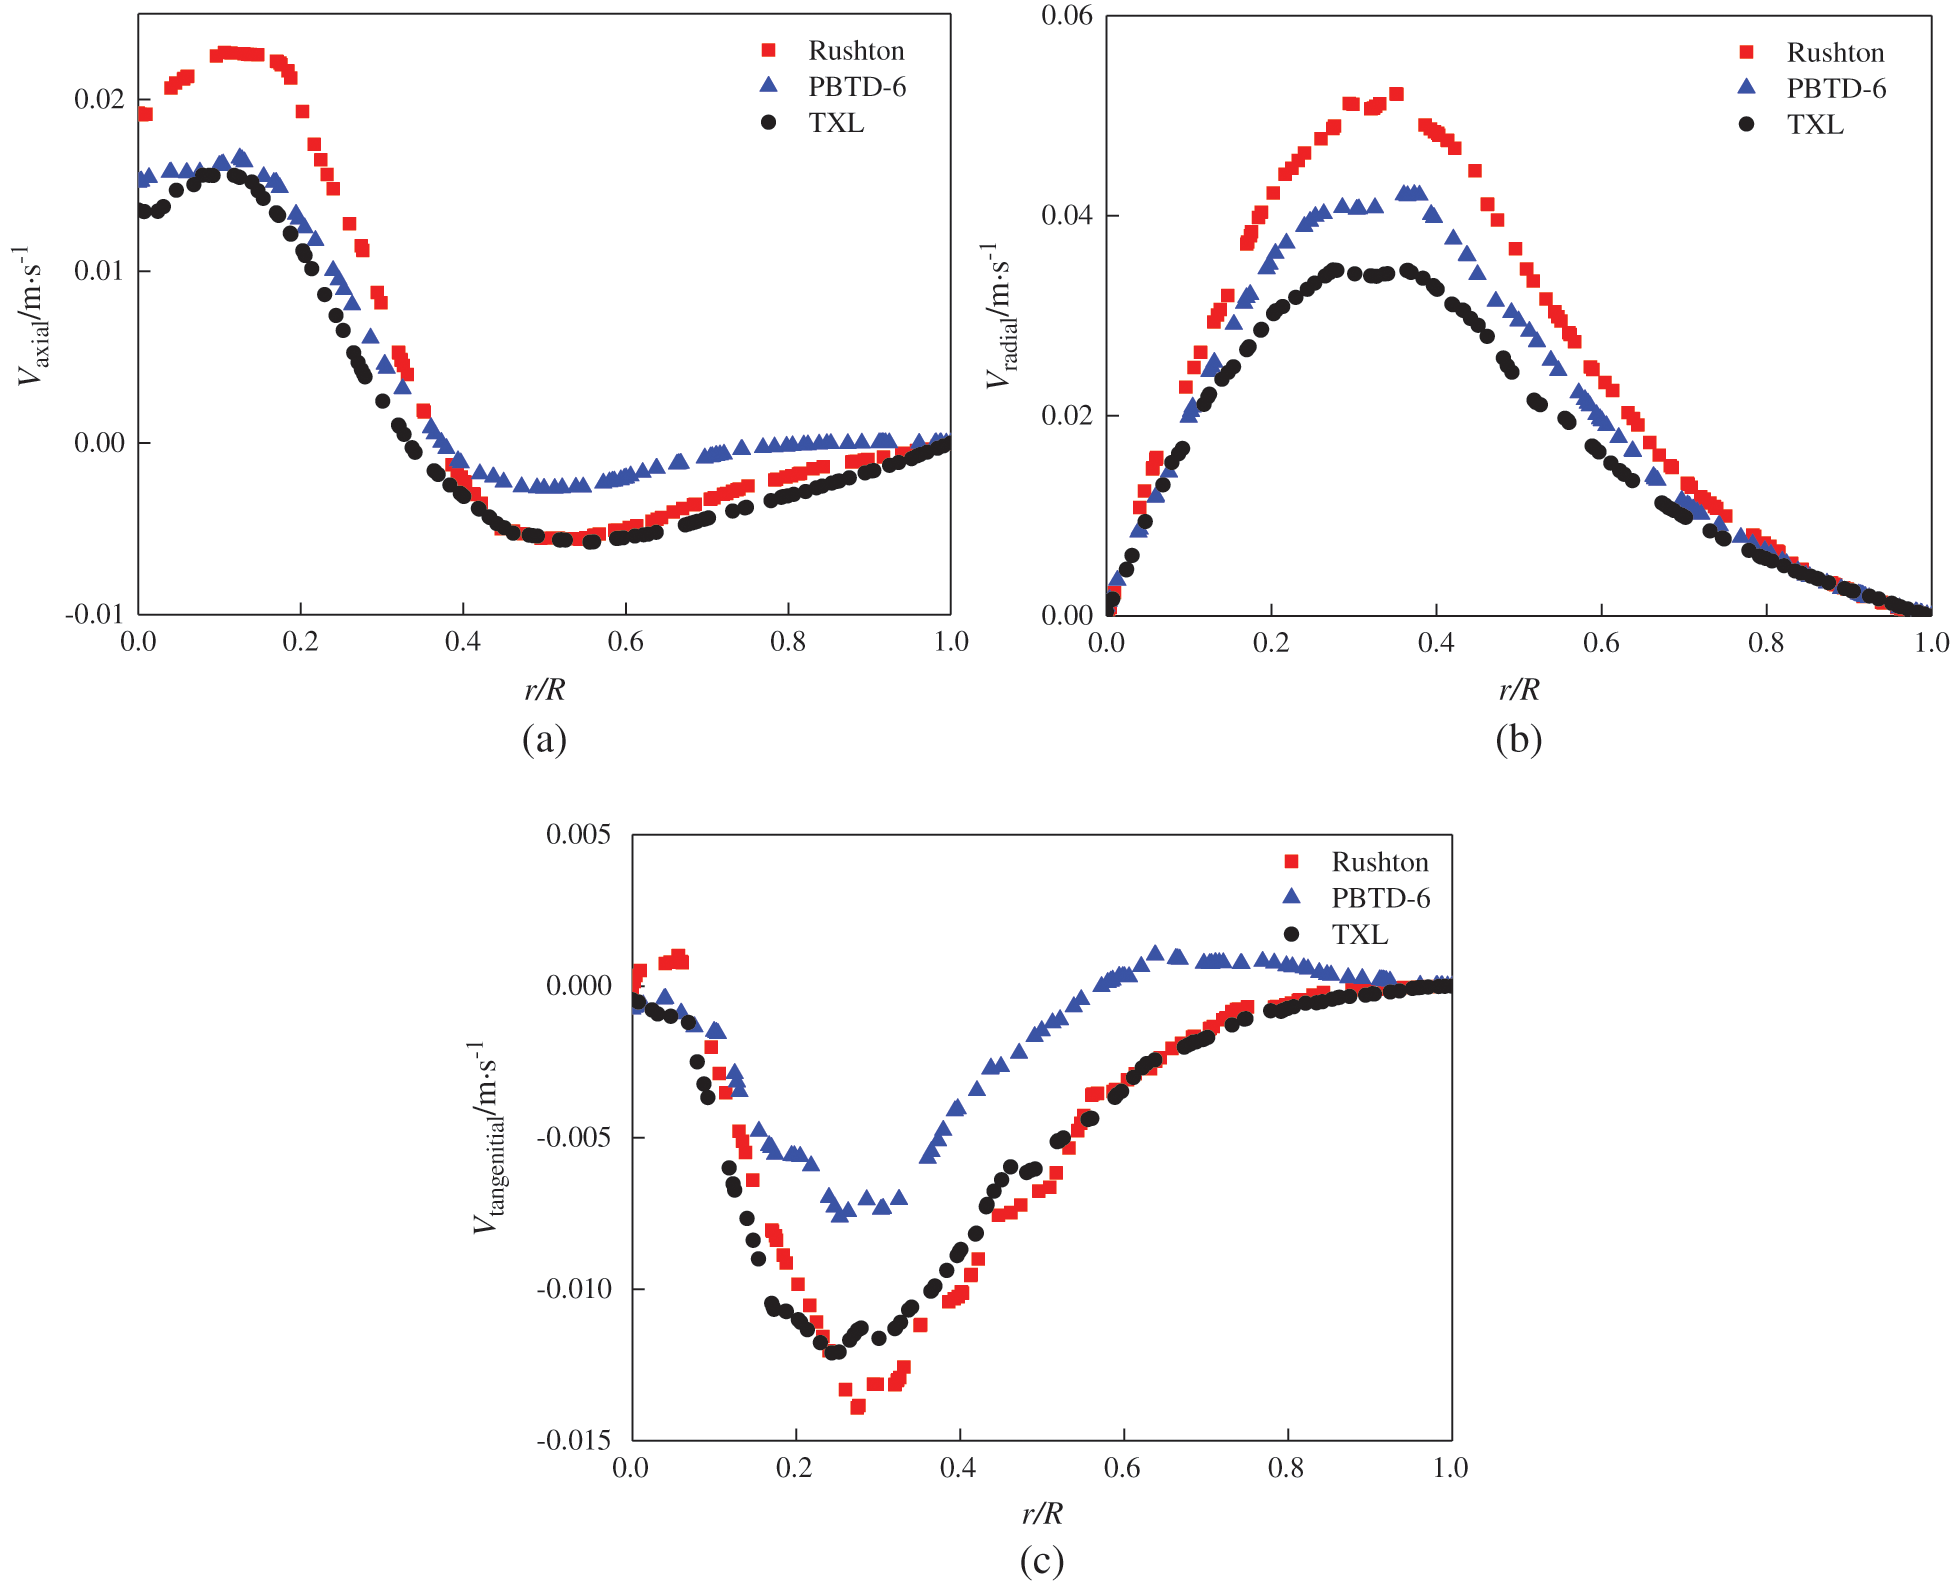
Figure 8: Comparison of the liquid velocity along sampling line L in Fig. 1, corresponding to the different impellers (N = 60 rpm, particle diameter = 550 μm): (a) Axial velocity; (b) Radial velocity; (c) Tangential velocity
4.3 Effects of Impeller Types and Impeller Speeds
Fig. 9 has illustrated the local axial CR concentration profiles at different impeller speeds for the Rushton impeller, the PBTD-6 impeller and the TXL impeller. Fig. 10 has shown the computed contour plots of the CR volumetric fraction on a horizontal plane at different vessel heights (i.e., z = 0H, 0.3H, 0.5H, 0.7H, 0.9H) for different impeller speeds. As displayed in Fig. 9, at a low impeller speed (i.e., N = 60 rpm), it can be observed that the Ch/Cavg values were very small at the upper part of the stirred tank, which shown that few CR particles suspended in the upper part of the stirred tank, and the similar phenomenon can be also seen in Fig. 10. With the increase of the impeller speed, plenty of CR particles was dispersed from the lower part of the stirred tank and the degree of homogeneity was improved. It can be seen that the Ch/Cavg values of the Rushton system at the upper part were larger than that of the PBTD-6 impeller system and the TXL impeller system at N = 180, 300, 420 rpm. As shown in Fig. 10, the CR particles’ suspension quality for the PBTD-6 impeller system was the worst of these three impeller systems. The cloud height was defined as the distance from the highest point of the iso-surface of the average CR concentration to the bottom of the stirred tank [13], which can reflect the quality of the suspension. The cloud heights of the CR particles in the stirred tank at different impeller speeds for the Rushton impeller, the PBTD-6 impeller and the TXL impeller have been illustrated in Fig. 11. The cloud heights increased with the impeller speed and it can be observed that the cloud height of the PBTD-6 system was lower than those of the other two impeller systems, indicating that its mixing quality was not good, which is consistent with the CR concentration distribution in Figs. 9, and 10. There was little difference between the two cloud heights of the Rushton system and the TXL system, and the cloud heights of the Rushton impeller system was slightly lower than those of the TXL system at N = 300, 420 rpm. The reason that the suspension quality of CR particles in a stirred tank with Rushton impeller is better may be the normal direction of the blade is the same as the linear velocity direction of the impeller, and the Rushton impeller has the higher fluid velocity, which leads to better particles suspension under same impeller speed.
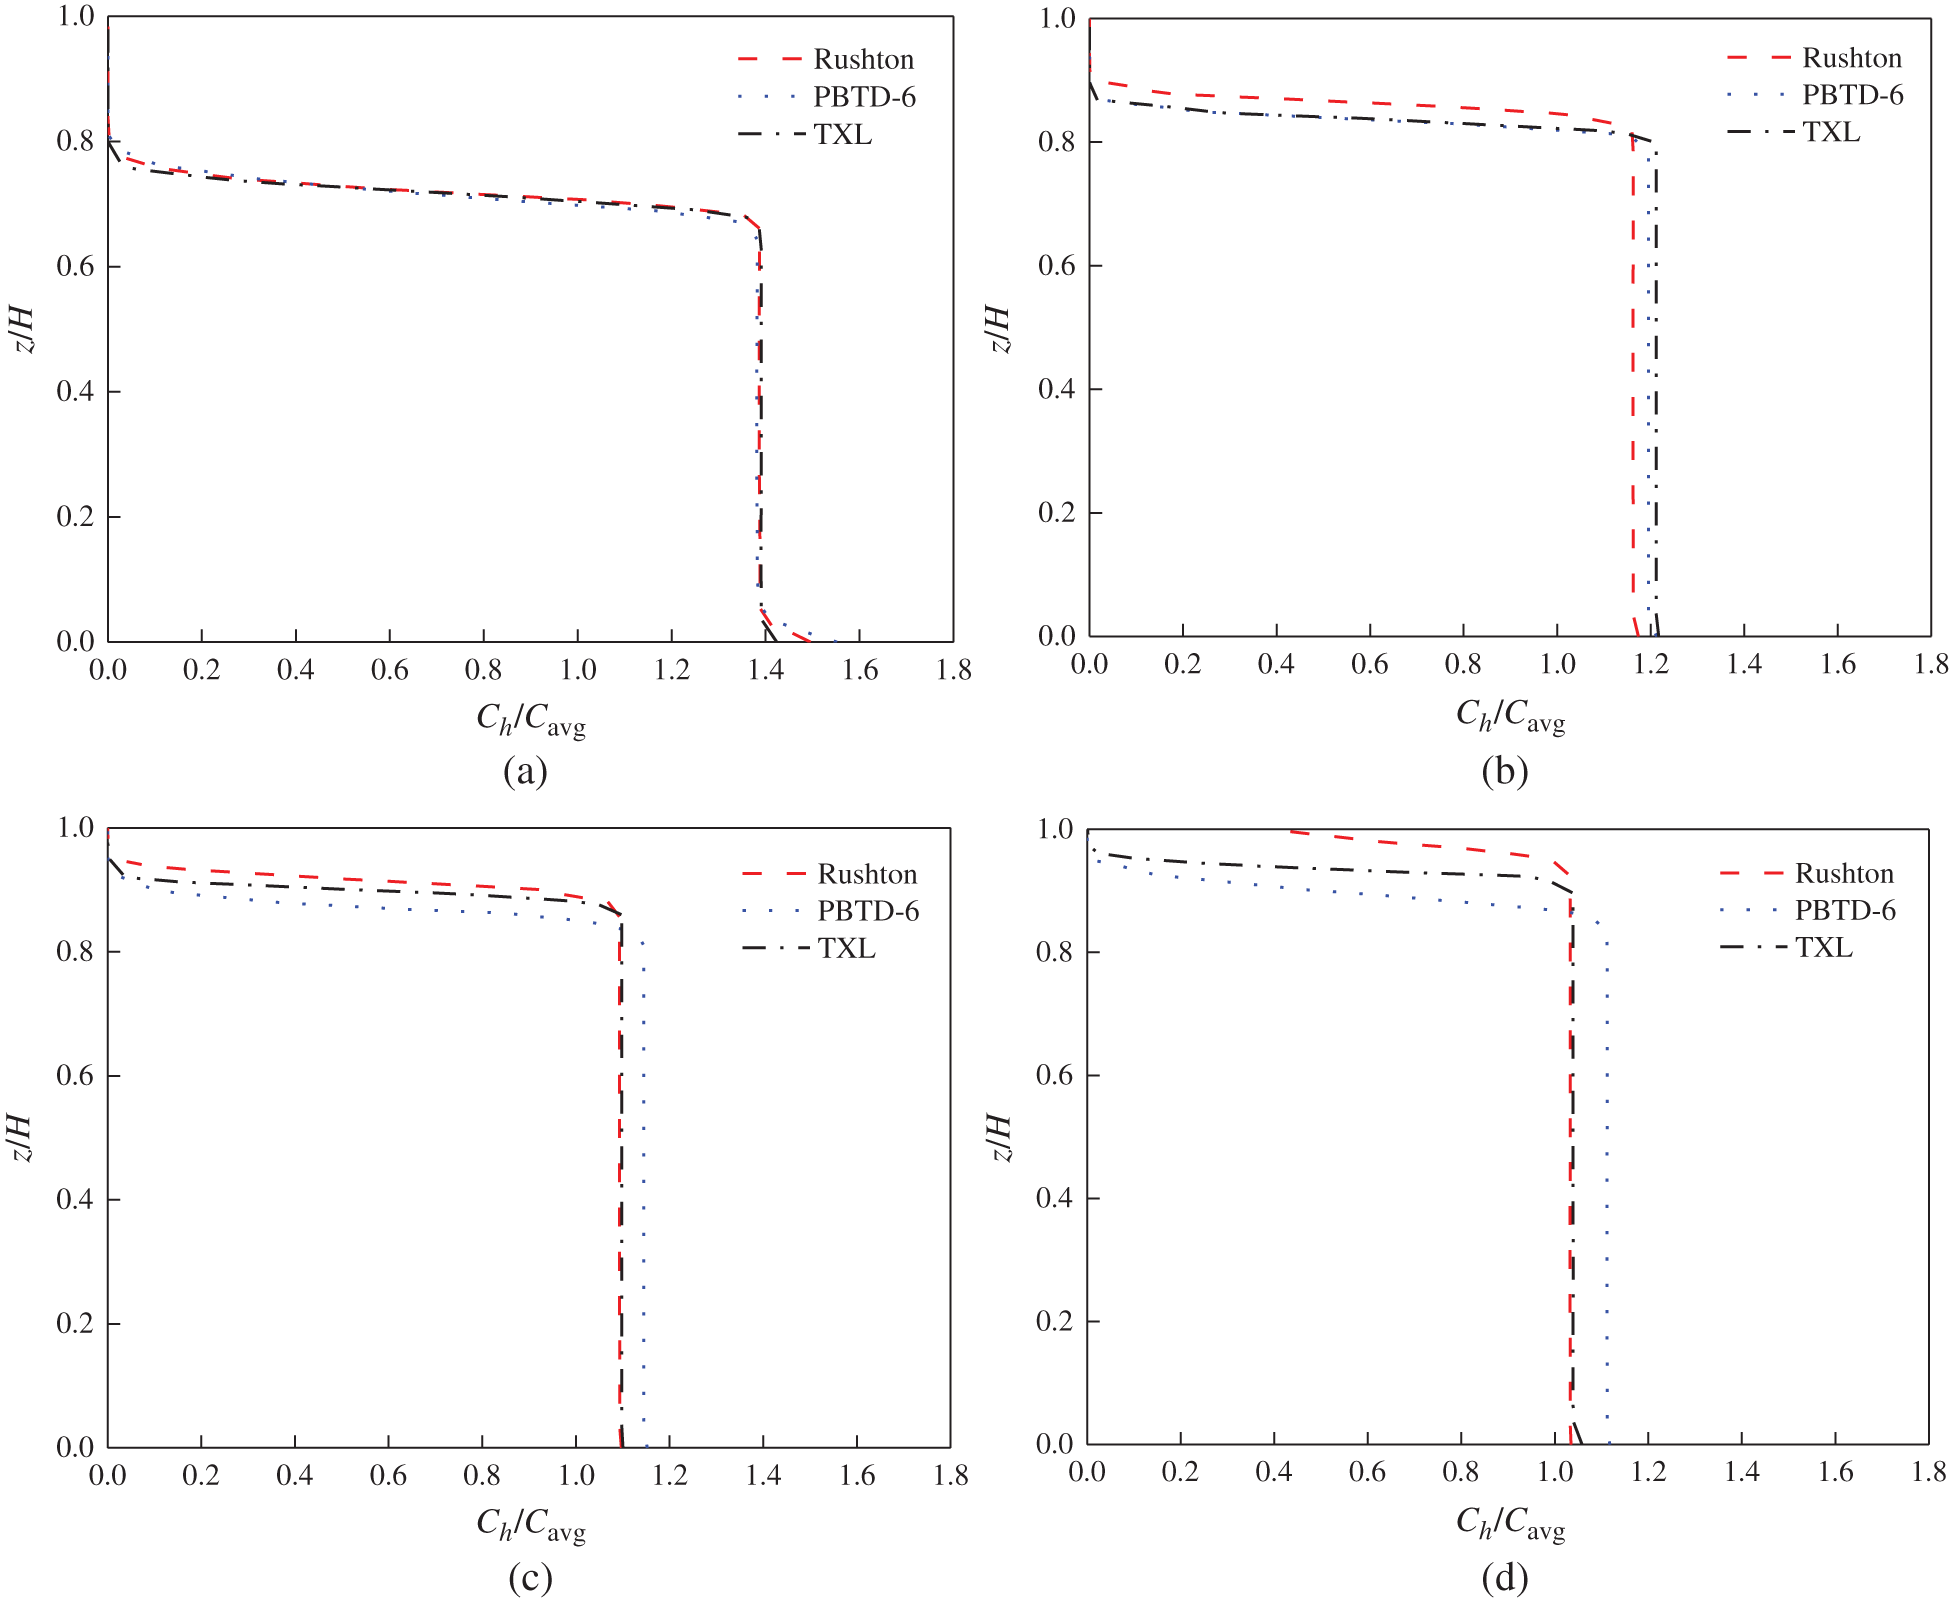
Figure 9: Effects of impeller speeds on the local axial CR concentration profiles (particle diameter = 550 μm, r/R = 0.8): (a) N = 60 rpm; (b) N = 180 rpm; (c) N = 300 rpm; (d) N = 420 rpm
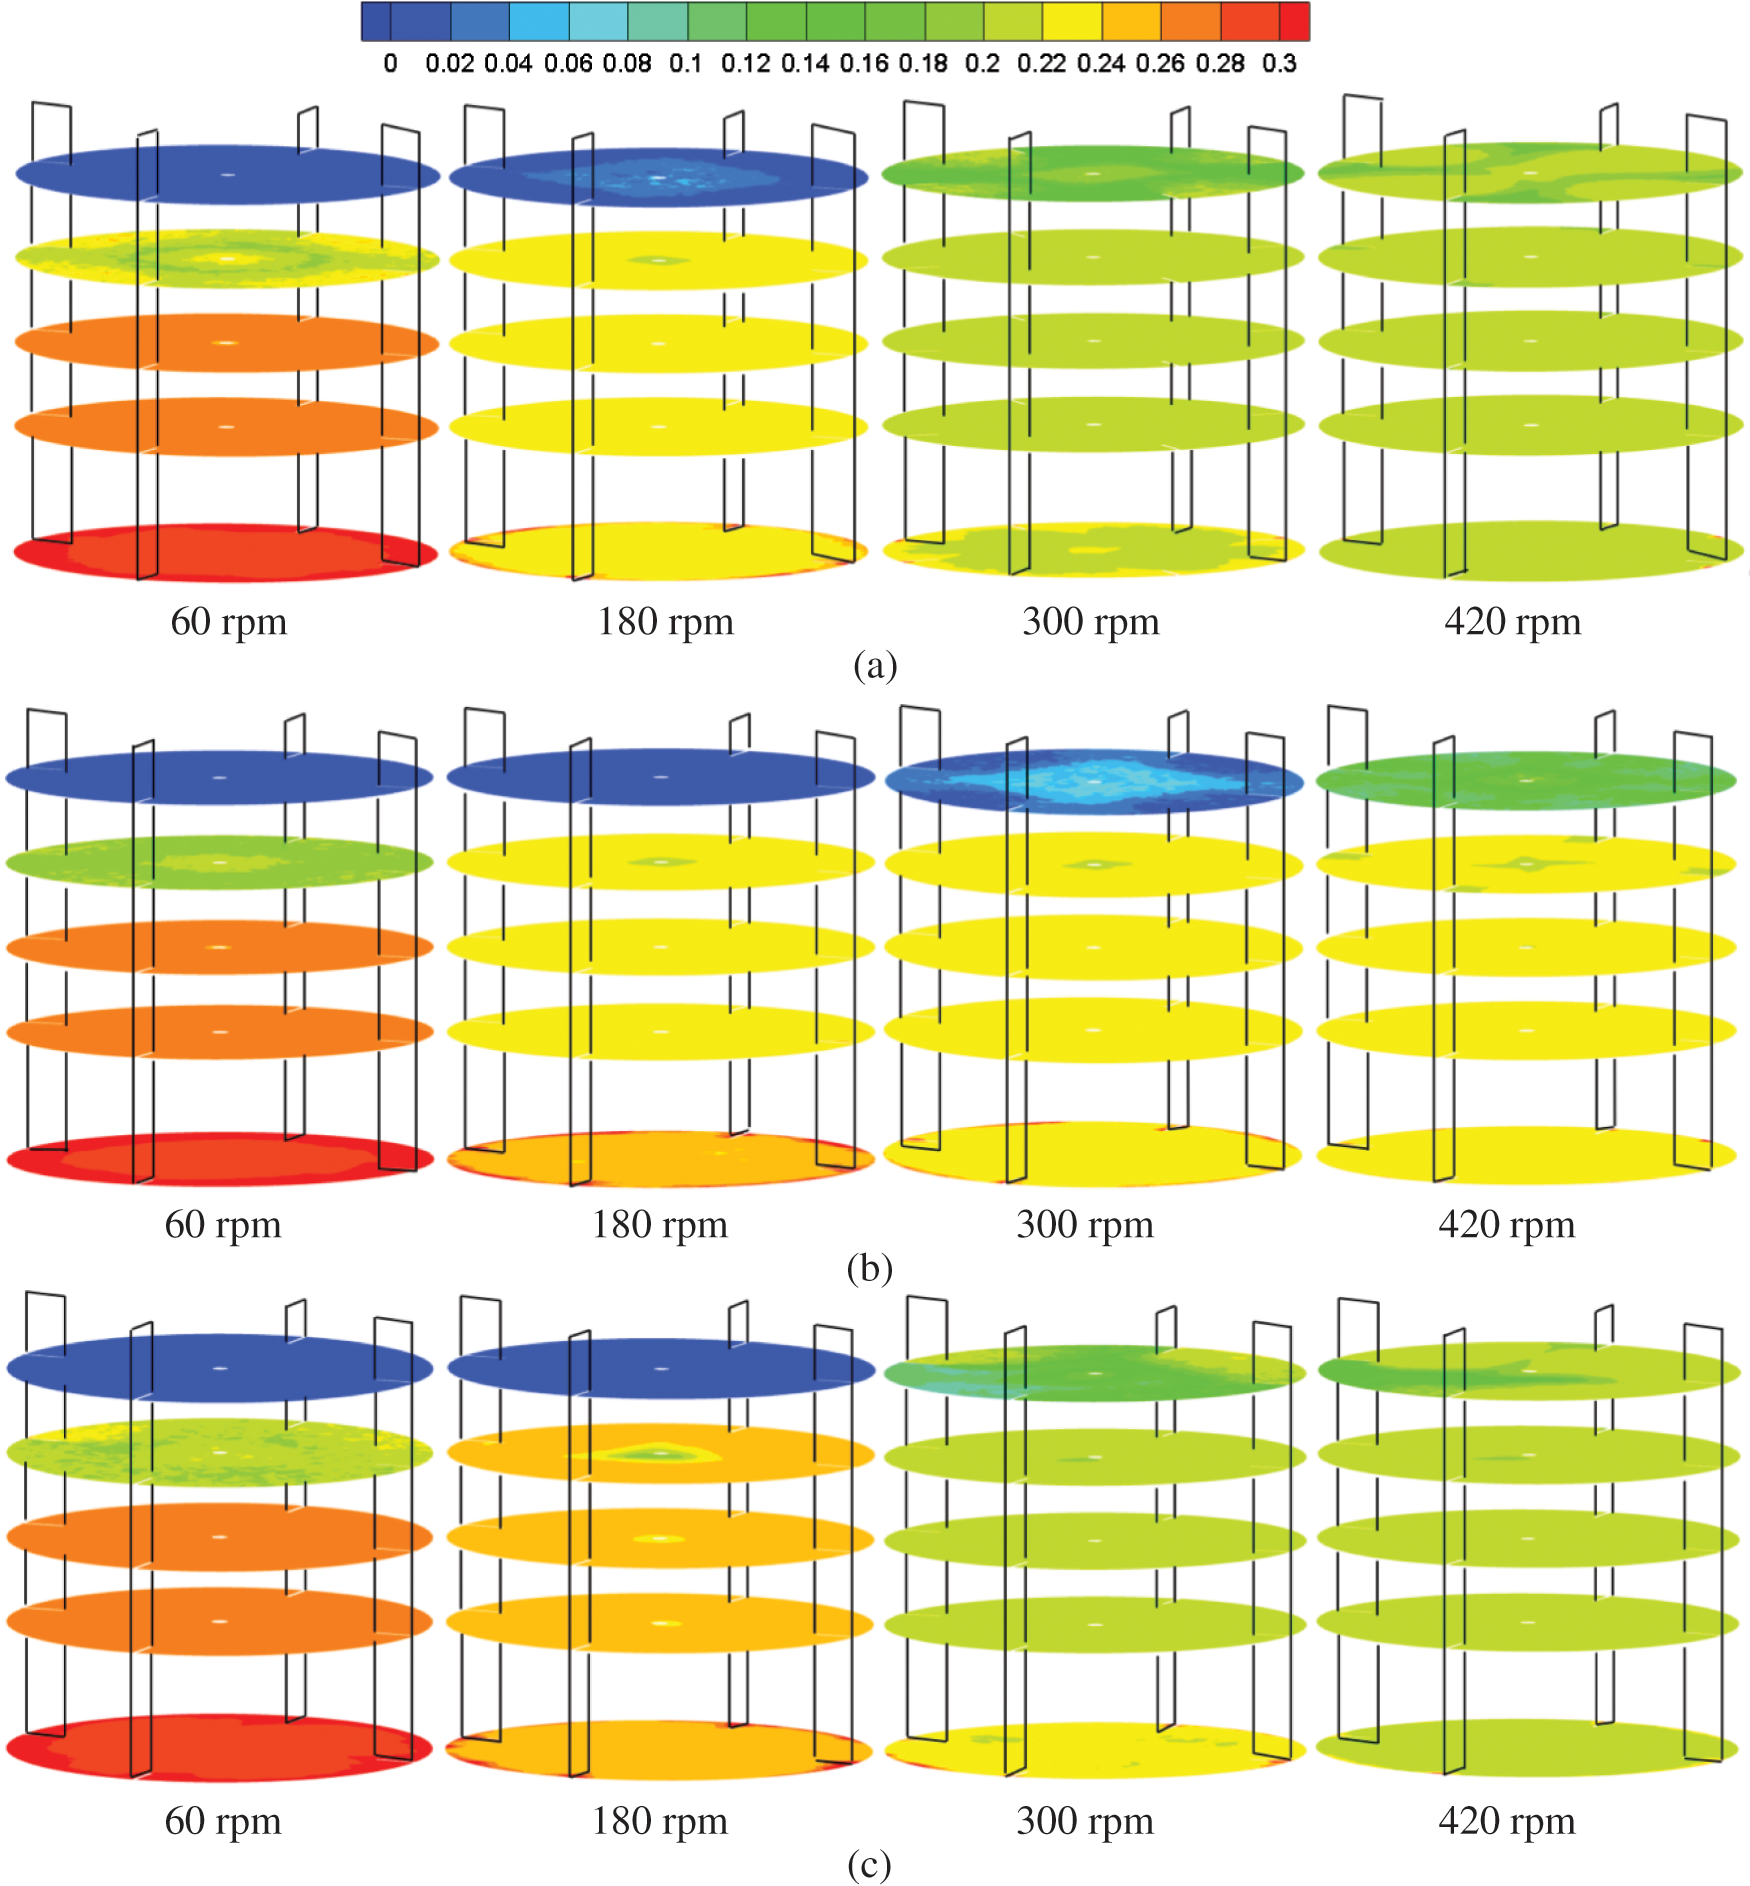
Figure 10: Contour plots of the CR volumetric fraction on a horizontal plane at different vessel heights (i.e., z = 0H, 0.3H, 0.5H, 0.7H, 0.9H) for different impeller speeds (particle diameter = 550 μm): (a) Rushton; (b) PBTD-6; (c) TXL
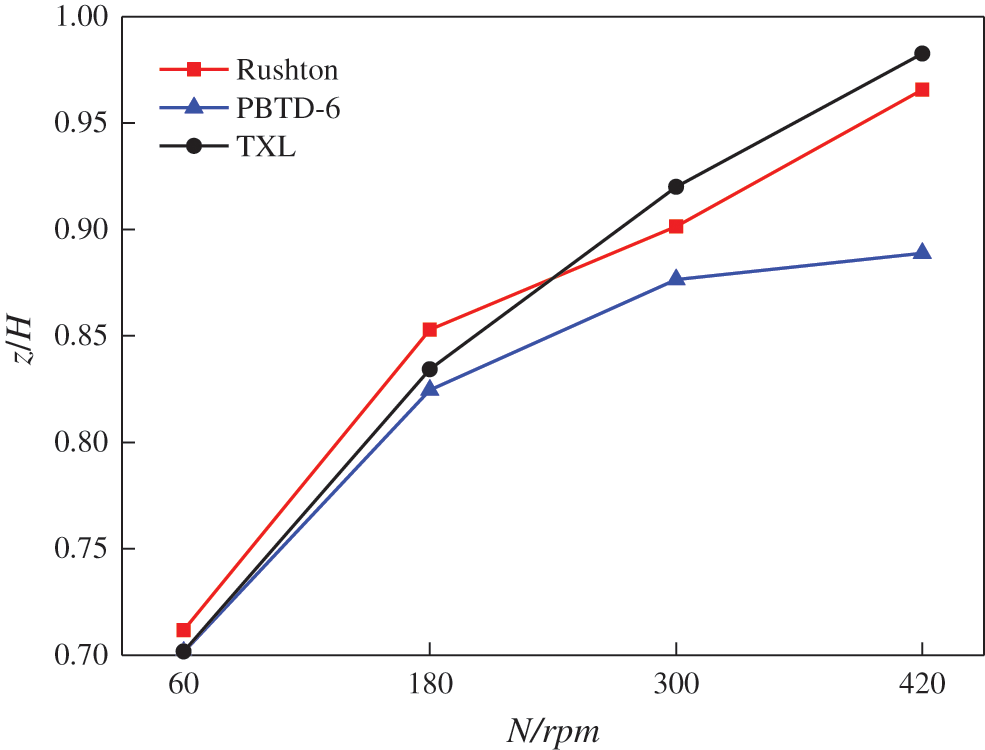
Figure 11: Cloud heights with Cavg = 0.2 at different impeller speeds (particle diameter = 550 μm)
4.4 Effects of CR Particle Diameter
In practical pavement engineering, #20 mesh (830 μm), #30 mesh (550 μm) and #40 mesh (350 μm) CR is often used to prepare AR binders, and particle size is one of the key factors affecting suspension quality. Fig. 12 shows the local axial CR concentration profiles effected by the CR particle diameter. It can be observed that the suspension quality decreased with the increase of the CR’s particle diameter. This can be interpreted by the free setting velocity (Vt) [15]:
where, g is the acceleration due to gravity; dp is the particle’s diameter; ρs is the CR’s density; ρl is the liquid’s density and CD is the drag coefficient. The settling velocity increases with the particle diameter, which means that larger particles need more energy to suspend in the stirred tank. Hence, this suggests that the impeller speed should be increased to ensure mixing uniformity when AR binders with a lower mesh number are produced.
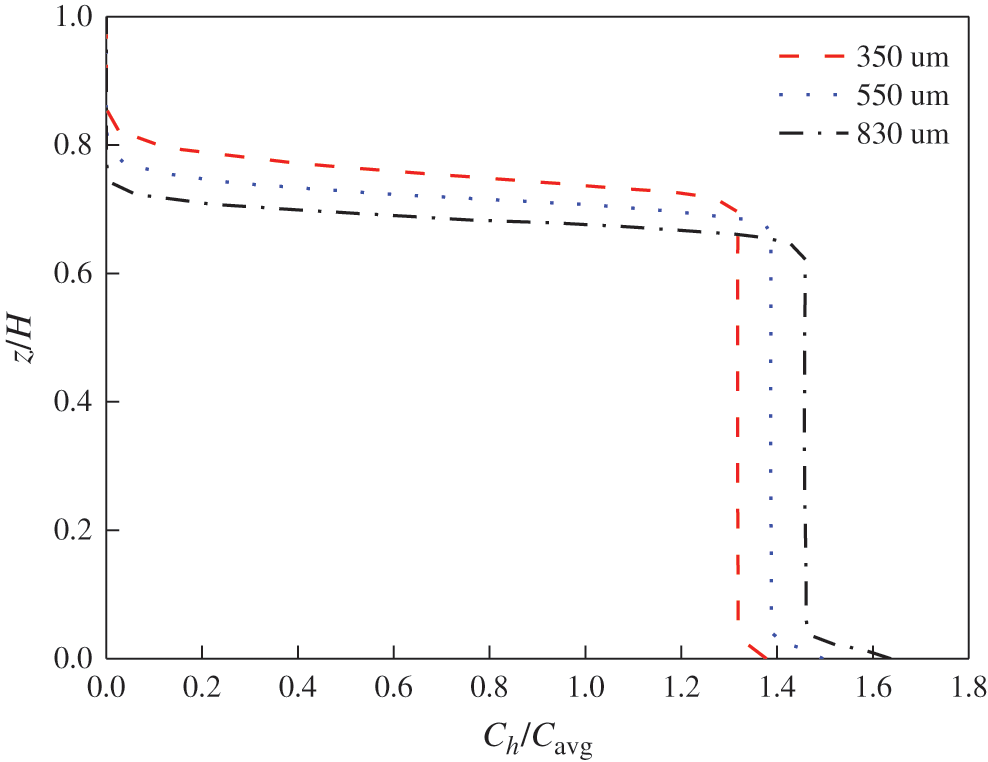
Figure 12: Effects of particle diameter on axial CR concentration profiles (Rushton impeller, N = 60 rpm, r/R = 0.8)
4.5 Effects of the Initial CR Particle Loading
Fig. 13 has shown the effects of the initial CR particle loading on the local axial CR concentration profiles. The suspension quality of CR particles in the stirred tank with a lower initial CR loading of 15 vol% was better than that of 20 vol% and 25 vol% because CR particles in the mixing system with higher content have to gain more energy to overcome the gravity to suspend.
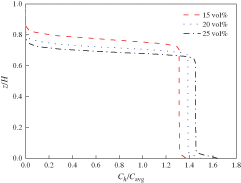
Figure 13: Effects of the initial CR particle loading on the axial CR concentration profiles (Rushton impeller, N = 60 rpm, particle diameter = 550 μm, r/R = 0.8)
4.6 Evaluation of the CR Particle Suspension Quality
In this paper, the relative standard deviation (RSD) [24] was employed to illustrate the variation of suspension quality with power consumption in the stirred tank. The RSD was calculated by the local CR concentration at different positions in the stirred tank, where z/H = 0.125, 0.25, 0.375, 0.5, 0.625, 0.75 and 0.875, and the smaller RSD value represented the better suspension quality in stirred tank. The RSD was defined [24]:
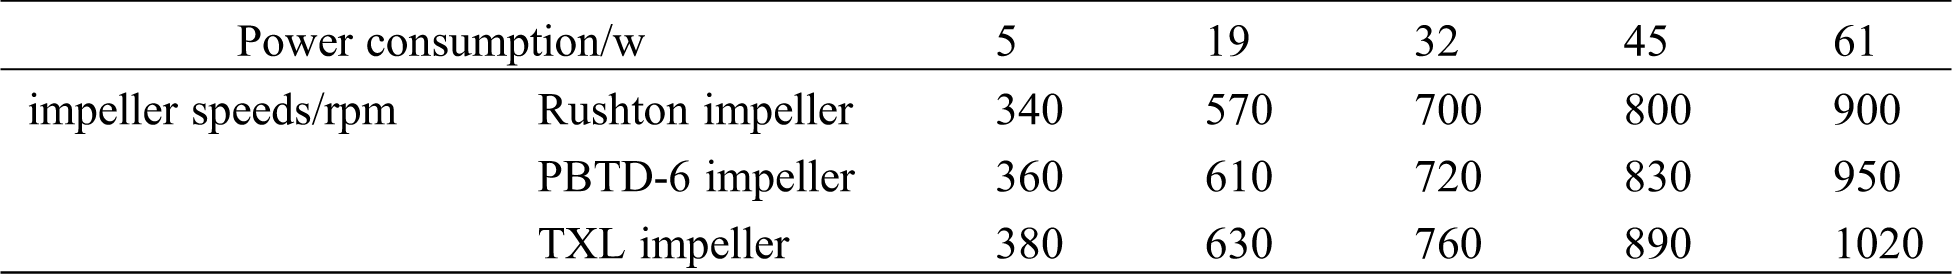
where, n is the number of sampling points, Ch is the local axial CR concentration at height h, and Cavg is the average CR concentration. Fig. 14 has illustrated the variation of RSD with the power consumption (P) for the Rushton impeller, the PBTD-6 impeller and the TXL impeller for experiments. As can be seen that the RSD decreased as the power consumption increased, which indicated that the increase of the power consumption was beneficial to improve the uniformity of CR particles suspension. It can also be found that the suspension quality of the TXL system was better than that of the Rushton and the PBTD-6 impeller system, and the mixing effect of the PBTD-6 impeller was the worst. In other words, the power consumption of the TXL impeller with regard to the just off-bottom suspension state was the lowest of these three impellers. The impeller speeds at each constant power consumption in experiments for Fig. 14 are shown in Tab. 1.
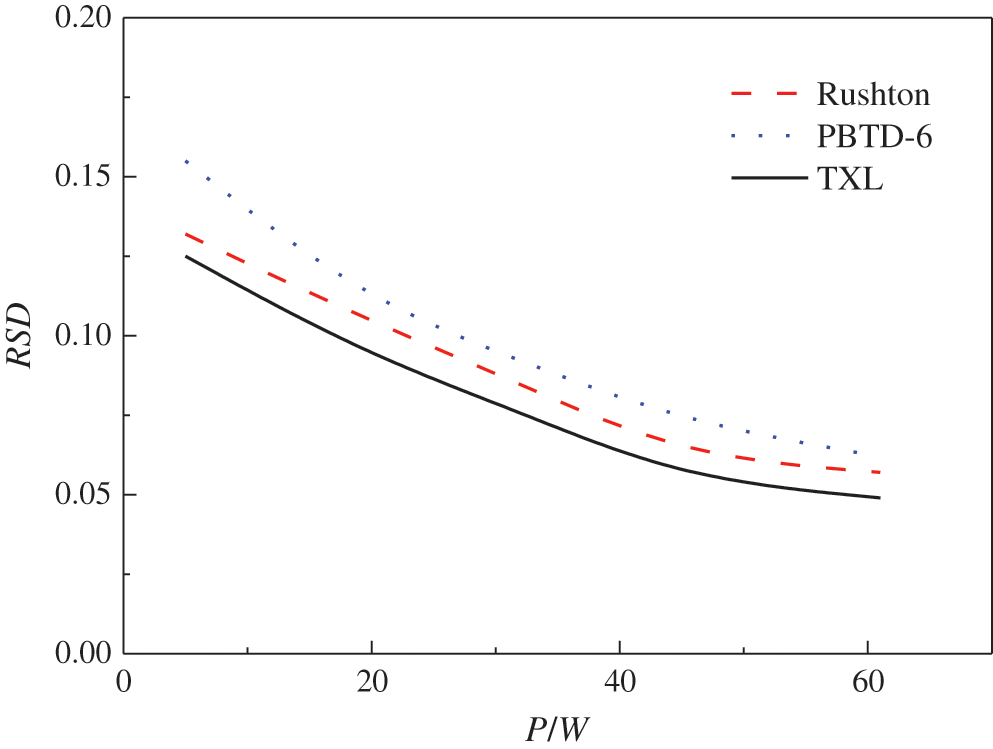
Figure 14: Comparison of the RSD at different power consumptions in experiments
Table 1: Impeller speeds at each constant power consumption in experiments
The CR particles suspension characteristic in asphalt in a stirred tank with a Rushton impeller, a PBTD-6 impeller and a TXL impeller were explored by numerical simulation in this paper. The effects of impeller types, impeller speeds, CR particle diameter and initial CR particle loading on the flow field characteristics and the suspension quality were deeply studied. Results showed that the local axial CR concentration profiles calculated by the CFD model were similar with the experimental results. The average axial, radial, and tangential liquid velocities in the lower part of the stirred tank with the Rushton impeller were the highest of these three impeller systems at the same impeller speed. As expected, the suspension quality of CR particles was increased with impeller speed. At the same speed, the CR particles’ suspension quality in the stirred tank with the PBTD-6 was the worst of the three impeller systems. A larger particle size and higher initial CR particle loading were not conducive to the suspension of CR particles. Moreover, the TXL impeller was able to enhance the degree of homogeneity compared with the PBTD-6 impeller and the Rushton impeller at the same power consumption. This paper may help to improve the production quality of AR binders and extend the implication of two-phase fluid dynamics on mixing system with high temperature and high viscosity.
However, there are some limitations in the experiments. Due to the high temperature of experimental process may easily lead to the breakdown of motor and torque transducer and the impact of the reaction of asphalt and CR particles on accuracy of extracting solid particles in asphalt, finding the substitute whose physical property is similar with asphalt to carry out experiments at room temperature may be good for the research of AR experiment in the future.
Acknowledgement: The authors gratefully acknowledge the helpful comments and suggestions from several reviewers, which significantly improve the earlier versions of this paper.
Funding Statement: This work was supported by the Fundamental Research Funds for the Central Universities [300102250112]; the Fundamental Research Funds for the Central Universities, CHD [300102251711].
Conflicts of Interest: The authors declare that they have no conflicts of interest to report regarding the present study.
1. Ma, T., Zhao, Y. L., Huang, X. M., Zhang, Y. (2016). Characteristics of desulfurized rubber asphalt and mixture. KSCE Journal of Civil Engineering, 20(4), 1347–1355. DOI 10.1007/s12205-015-1195-1. [Google Scholar] [CrossRef]
2. Sienkiewicz, M., Borzędowska-Labuda, K., Zalewski, S., Janik, H. (2017). The effect of tyre rubber grinding method on the rubber-asphalt binder properties. Construction and Building Materials, 154(6), 144–154. DOI 10.1016/j.conbuildmat.2017.07.170. [Google Scholar] [CrossRef]
3. Karger-Kocsis, J., Mészáros, L., Bárány, T. (2013). Ground tyre rubber (GTR) in thermoplastics, thermosets, and rubbers. Journal of Materials Science, 48(1), 1–38. DOI 10.1007/s10853-012-6564-2. [Google Scholar] [CrossRef]
4. Irfan, M., Ali, Y., Ahmed, S., Hafeez, I. (2018). Performance evaluation of crumb rubber-modified asphalt mixtures based on laboratory and field investigations. Arabian Journal for Science and Engineering, 43(4), 1795–1806. DOI 10.1007/s13369-017-2729-2. [Google Scholar] [CrossRef]
5. Wang, H. P., Liu, X. Y., Zhang, H., Apostolidis, P., Scarpas, T. et al. (2018). Asphalt-rubber interaction and performance evaluation of rubberised asphalt binders containing non-foaming warm-mix additives. Road Materials and Pavement Design, 1, 1–22. [Google Scholar]
6. Bressi, S., Fiorentini, N., Huang, J., Losa, M. (2019). Crumb rubber modifier in road asphalt pavements: State of the art and statistics. Coatings, 9(6), 384. DOI 10.3390/coatings9060384. [Google Scholar] [CrossRef]
7. Cheng, G., Shen, B., Zhang, J. (2011). A study on the performance and storage stability of crumb rubber-modified asphalts. Petroleum Science and Technology, 29(2), 192–200. DOI 10.1080/10916460903070421. [Google Scholar] [CrossRef]
8. Ghavibazoo, A., Abdelrahman, M., Ragab, M. (2016). Changes in composition and molecular structure of asphalt in mixing with crumb rubber modifier. Road Materials and Pavement Design, 17(4), 906–919. DOI 10.1080/14680629.2016.1138878. [Google Scholar] [CrossRef]
9. Guo, S. C., Dai, Q. L., Si, R. Z., Sun, X., Lu, C. (2017). Evaluation of properties and performance of rubber-modified concrete for recycling of waste scrap tire. Journal of Cleaner Production, 148(10), 681–689. DOI 10.1016/j.jclepro.2017.02.046. [Google Scholar] [CrossRef]
10. Huang, S. C., Pauli, A. T. (2011). Particle size effect of crumb rubber on rheology and morphology of asphalt binders with long-term aging. Road Materials and Pavement Design, 9(1), 73–95. DOI 10.1080/14680629.2008.9690108. [Google Scholar] [CrossRef]
11. Zamzam, Z., Yoshikawa, S., Ookawara, S., Kato, Y. (2016). A new model for estimation of just-suspension speed based on lift force for solid-liquid suspension in a stirred tank. Journal of Chemical Engineering of Japan, 49(8), 737–746. DOI 10.1252/jcej.15we304. [Google Scholar] [CrossRef]
12. Yang, T., Takahashi, K. (2011). Suspension of solid particles in a horizontal vessel. Journal of Chemical Engineering of Japan, 44(11), 876–881. DOI 10.1252/jcej.11we056. [Google Scholar] [CrossRef]
13. Kasat, G. R., Khopkar, A. R., Ranade, V. V., Pandit, A. B. (2008). CFD simulation of liquid-phase mixing in solid-liquid stirred reactor. Chemical Engineering Science, 63(15), 3877–3885. DOI 10.1016/j.ces.2008.04.018. [Google Scholar] [CrossRef]
14. Ahsan, M., Hussain, A. (2017). Computational fluid dynamics (CFD) simulation and comparison for different numbers of baffles to reduce concentration polarization effects in membrane tubes. Journal of Engineering and Technological Sciences, 49(1), 114–131. DOI 10.5614/j.eng.technol.sci.2017.49.1.7. [Google Scholar] [CrossRef]
15. Hosseini, S., Patel, D., Ein-Mozaffari, F., Mehrvar, M. (2010). Study of solid-liquid mixing in agitated tanks through computational fluid dynamics modeling. Industrial & Engineering Chemistry Research, 49(9), 4426–4435. DOI 10.1021/ie901130z. [Google Scholar] [CrossRef]
16. Tamburini, A., Cipollina, A., Micale, A. G., Ciofalo, M., Brucato, A. (2009). Dense solid-liquid off-bottom suspension dynamics: Simulation and experiment. Chemical Engineering Research and Design, 87(4), 587–597. DOI 10.1016/j.cherd.2008.12.024. [Google Scholar] [CrossRef]
17. Sha, Z., Palosaari, S., Oinas, P., Ogawa, K. (2001). CFD simulation of solid suspension in a stirred tank. Journal of Chemical Engineering of Japan, 34(5), 621–626. DOI 10.1252/jcej.34.621. [Google Scholar] [CrossRef]
18. Liu, B. Q., Zheng, Y. J., Chen, M. M., Chen, X. G., Jin, Z. (2017). CFD simulation of the mixing and dispersing of floating particles in a viscous system. Brazilian Journal of Chemical Engineering, 34(4), 1175–1189. DOI 10.1590/0104-6632.20170344s20160379. [Google Scholar] [CrossRef]
19. Yan, Q. Y., Li, Y., Zhu, Y. H., Cheng, K., Ye, X. M. (2020). CFD-based optimization of hot primary-air pipe networks in power plant milling systems. Fluid Dynamics & Materials Processing, 16(3), 623–636. DOI 10.32604/fdmp.2020.09669. [Google Scholar] [CrossRef]
20. Fourie, L. F., Square, L. (2020). Determination of a safe distance for atomic hydrogen depositions in hot-wire chemical vapour deposition by means of CFD heat transfer simulations. Fluid Dynamics & Materials Processing, 16(2), 225–235. DOI 10.32604/fdmp.2020.08771. [Google Scholar] [CrossRef]
21. Dandani, M., Lepiller, V., Ghezal, A., Desevaux, P. (2018). Numerical visualizations of mixing enhancement in a 2D supersonic ejector. Fluid Dynamics & Materials Processing, 14(1), 23–37. [Google Scholar]
22. Bentarzi, F., Mataoui, A. (2018). Turbulent flow produced by twin slot jets impinging a wall. Fluid Dynamics & Materials Processing, 14(2), 107–120. [Google Scholar]
23. Ljungqvist, M., Rasmuson, A. (2001). Numerical simulation of the two-phase flow in an axially stirred vessel. Chemical Engineering Research and Design, 79(5), 533–546. DOI 10.1205/02638760152424307. [Google Scholar] [CrossRef]
24. Gu, D. Y., Cheng, C., Liu, Z. H., Wang, Y. D. (2019). Numerical simulation of solid-liquid mixing characteristics in a stirred tank with fractal impellers. Advanced Powder Technology, 30(10), 2126–2138. DOI 10.1016/j.apt.2019.06.028. [Google Scholar] [CrossRef]
25. Gu, D. Y., Liu, Z. H., Xie, Z. M., Li, J., Tao, C. Y. et al. (2017). Numerical simulation of solid-liquid suspension in a stirred tank with a dual punched rigid-flexible impeller. Advanced Powder Technology, 28(10), 2723–2734. DOI 10.1016/j.apt.2017.07.025. [Google Scholar] [CrossRef]
26. Hosseini, S., Patel, D., Ein-Mozaffari, F., Mehrvar, M. (2010). Study of solid-liquid mixing in agitated tanks through computational fluid dynamics modeling. Industrial & Engineering Chemistry Research, 49(9), 4426–4435. DOI 10.1021/ie901130z. [Google Scholar] [CrossRef]
27. Qi, N. N., Zhang, H., Zhang, K., Xu, G., Yang, Y. P. (2013). CFD simulation of particle suspension in a stirred tank. Particuology, 11(3), 317–326. DOI 10.1016/j.partic.2012.03.003. [Google Scholar] [CrossRef]
28. Till, Z., Molnár, B., Egedy, A., Varga, T. (2018). CFD based qualification of mixing efficiency of stirred vessels. Periodica Polytechnica Chemical Engineering, 63(1), 226–238. DOI 10.3311/PPch.12245. [Google Scholar] [CrossRef]
29. Vilardi, G., Verdone, N. (2020). Production of metallic iron nanoparticles in a baffled stirred tank reactor: Optimization via computational fluid dynamics simulation. Particuology, 52(1), 83–96. DOI 10.1016/j.partic.2019.12.005. [Google Scholar] [CrossRef]
30. GB/T 22235 (2008). Determination for viscosity of liquids. pp. 1–7. National Standardization Management Committee. [Google Scholar]
31. Bohnet, M., Niesmak, G. (1980). Distribution of solids in stirred suspensions. German Chemical Engineering, 3(1), 57–65. [Google Scholar]
32. Dohi, N., Takahashi, T., Minekawa, K., Kawase, Y. (2004). Power consumption and solid suspension performance of large-scale impellers in gas-liquid-solid three-phase stirred tank reactors. Chemical Engineering Journal, 97(2–3), 103–114. DOI 10.1016/S1385-8947(03)00148-7. [Google Scholar] [CrossRef]
33. GB/T 0607 (2011). Test method for solubility of asphalt. pp. 1–2. Ministry of Transport of the People’s Republic of China. [Google Scholar]
34. Zhao, H. L., Zhang, Z. M., Zhang, T. A., Liu, Y., Gu, S. Q. et al. (2014). Experimental and CFD studies of solid-liquid slurry tank stirred with an improved Intermig impeller. Transactions of Nonferrous Metals Society of China, 8(1), 2649–2658. [Google Scholar]
35. Maluta, F., Paglianti, A., Montante, G. (2019). RANS-based predictions of dense solid–liquid suspensions in turbulent stirred tanks. Chemical Engineering Research and Design, 147, 470–482. DOI 10.1016/j.cherd.2019.05.015. [Google Scholar] [CrossRef]
 | This work is licensed under a Creative Commons Attribution 4.0 International License, which permits unrestricted use, distribution, and reproduction in any medium, provided the original work is properly cited. |