Materials Processing
| Fluid Dynamics & Materials Processing |
DOI: 10.32604/fdmp.2021.011205
ARTICLE
On the Influence of Vortex-Induced Resistance on Oil-Shale Particle-Slurry Flow in Vertical Pipes
1College of Mining, Liaoning Technical University, Fuxin, 123000, China
2Pipeline Engineering Institute, Wuhan Design and Research Institute of China Coal Technology and Engineering Group, Wuhan, 430064, China
*Corresponding Author: Li-an Zhao. Email: anlizhao@163.com
Received: 26 April 2020; Accepted: 28 December 2020
Abstract: The transportation in vertical pipelines of particle slurry of oil shale has important applications in several fields (marine mining, hydraulic mining, dredging of river reservoir, etc.). However, there is still a lack of information about the behavior of coarse particles in comparison to that of fine particles. For this reason, experiments on the fluidization and hydraulic lifting of coarse oil shale particles have been carried out. The experimental data for three kinds of particles with an average size of 5 mm, 15 mm and 25 mm clearly demonstrate that vortices can be formed behind the particles. On this basis, a vortex resistance factor K is proposed here to describe this effect. A possible correlation law is defined by means of a data fitting method accordingly. This law is validated by an experiment employing particles with an average size of 3.4 mm. The vortex resistance factor K results in a reduction of the speed of solid particles and an increase in the sliding speed as well as a decrease in the hydraulic gradient. As a result, using this factor, the calculation of the solid particle speed and hydraulic gradient can be made more accurate with respect to measured values.
Keywords: Coarse particle; hydraulic gradient; vertical pipe; fluidization
| Notation | |
| d: | Particle size, (m); |
| D: | Pipe diameter (m); |
| fG: | Solid particle gravity, (N); |
| fB: | Buoyancy of fluid on particle, (N); |
| fDi: | Resistance on particle from liquids, (N); |
| fhi: | Interference force from other particles (N); |
| fvi: | Vortex resistance (N); |
| Fr: | Froude number (-); |
| g: | Acceleration of gravity (m/s²) |
| ∆H: | Pressure difference (m); |
| im: | Friction resistance, (mH2O/m); |
| K: | Vortex force factor (-); |
| L: | Distance between connection points of mercury differential pressure gauge (m); |
| La: | Acceleration distance of solid particles (m); |
| ρ: | Water density (kg/m-3); |
| ρs: | Solid density (kg/m-3); |
| Q: | Local concentration, |
| q: | Particle concentration in tube; |
| Vm: | Average water velocity (m/s); |
| Vs: | Mean Velocity of particle after momentum exchange between water and particles (m/s); |
| Vslip: | Slip velocity (m/s); |
| Vw: | Mean Velocity of water after momentum exchange between water and particles (m/s); |
| ψ(1): | Coefficient; |
| λ: | Darcy resistance coefficient (-). |
Due to the significance of energy, many countries around the world are exploring the safe and high efficient mining and transportation methods. Oil and gas resources buried in underground and submarine are the future energy for human beings. The vertical lifting technology with multiphase flow of these fuels has become a hot research topic for many scholars [1–4]. The reserves of oil shale in the world are much more than those of coal, oil or natural gas. Compared with the primitive way of direct exploitation of oil shale, the drilling hydraulic oil shale mining technology can reduce environmental pollution and avoid production accidents. This technology breaks the oil shale orebody by the high-pressure water jet, and cracks it up to form slurry with water flow. Finally, the slurry will transport to the surface by vertical pipes. By this way, the financial investment can be effectively reduced. Drilling hydraulic recovery of oil shale involves coarse particle lifting technology with particle size of 8 mm–15 mm. However, the hydraulic transportation of oil shale mainly focuses on the indoor test and numerical simulation [5–8]. Although many efforts have made to study the vertical transport of coarse-grained slurry of other minerals [9–13], the research on hydraulic gradient of coarse particles in vertical pipeline is still insufficient. Scholars, such as Matoušek et al. [10,14–16], have studied the friction resistance loss (pressure loss) of coarse-grained slurry flow in vertical direction by experimental and numerical methods. These studies lack general acceptance due to the unreasonable theoretical model, leading to the failure to establish the relation between coarse-grained slurry and fine-grained slurry. In this study, experiments on coarse oil shale particle slurry were conducted to investigate the special mechanical characteristics of coarse particles in vertical pipes distinguishing from that of fine particles. The influence of the mechanical characteristics on velocity and hydraulic gradient will be explored.
2 Experimental Study of Coarse Oil Shale Slurry
The general layout of the tested loop pipeline is shown in Fig. 1. As shown in Fig. 1, it includes two vertical pipelines, namely fluidization experimental tube section and vertical lifting pipe section. The motor speed of centrifugal pump and jet pump feeder is controlled by variable frequency motor to change the fluid velocity in the pipeline and the feed concentration of particles. In order to overcome the disadvantage of particle grading degradation caused by the passing of particles through centrifugal pump, the pipeline layout should be set to mix the particles provided by the jet pump feeder with the centrifugal pump accelerated water from the pipeline. After the mixture passing through the experimental pipe section, the particles in mixture slurry are recycled through the cyclone separator and into the particle storehouse connected with the jet pump feeder. The water enters the water tank. The variable frequency motor of both centrifugal pump and jet pump feeder can realize stepless change of the water flow and the concentration of feed particle.
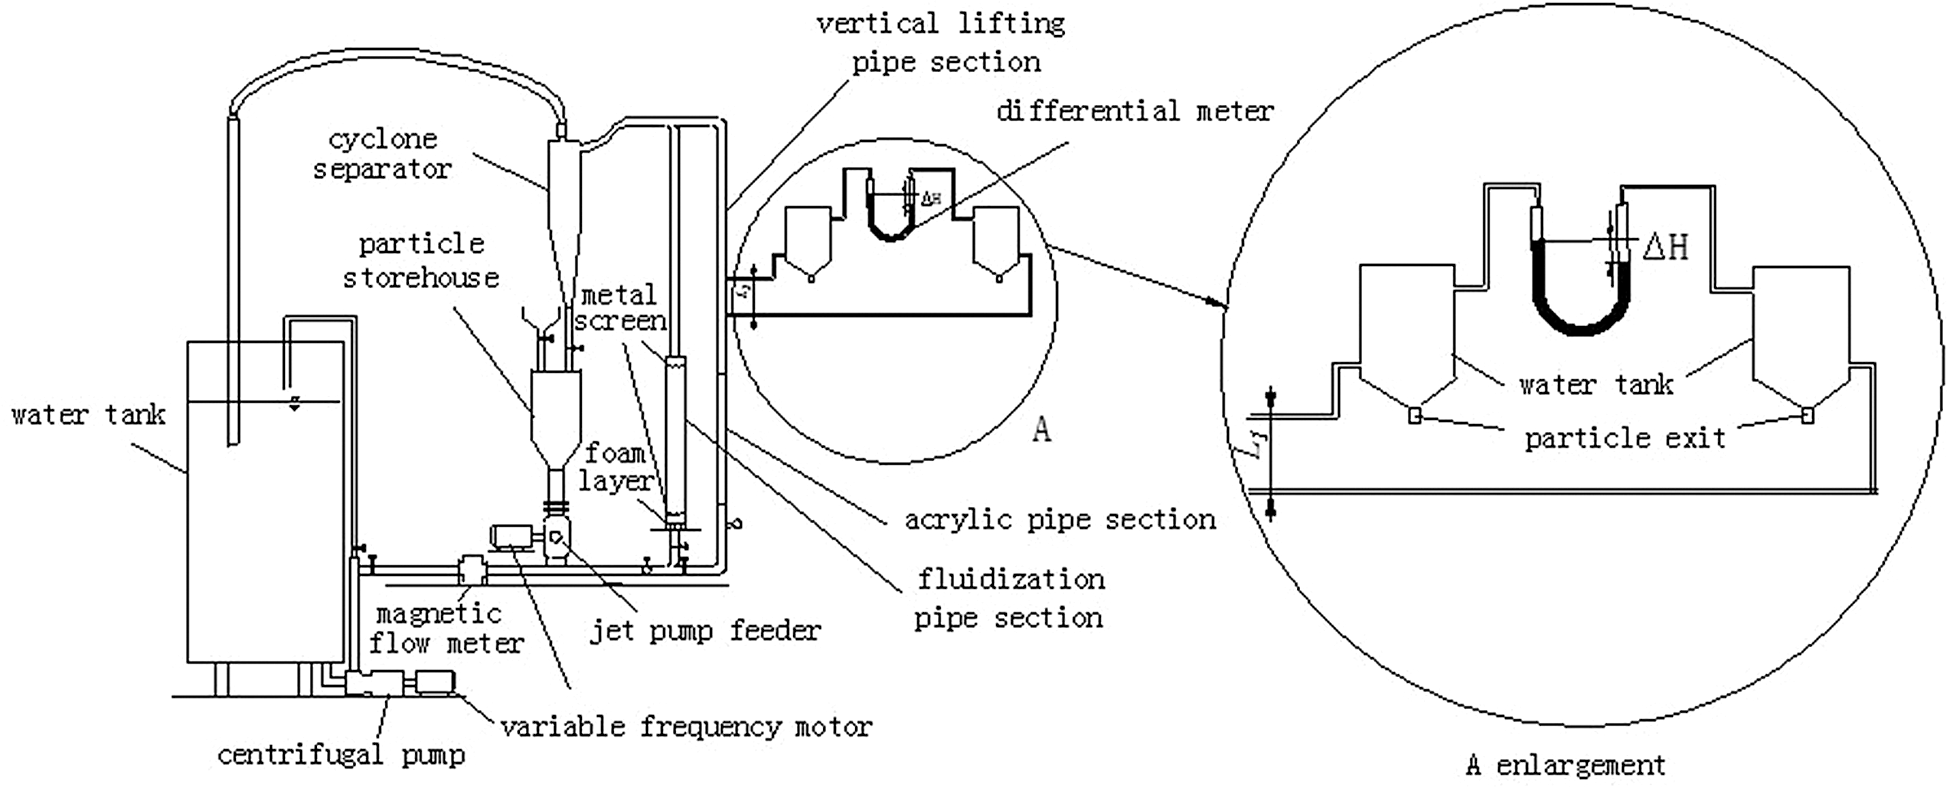
Figure 1: Schematic layout of experimental device
In the loop pipe line, the fluidization section is acrylic transparent pipe with a length of 1.8 m and a diameter of 0.1 m. A piece of metal screen is set at the upper and lower parts respectively. The diameter of the hydraulic rising section is 0.036 m and the length is 4 m. There is a transparent acrylic pipe of 1.5 m within this hydraulic rising section to facilitate the use of high-speed camera to take particle motion images. Magnetic flow meter is used to measure water velocity before liquid and solid are mixed.
The coarse oil shale particles with density ranging from 1895 kg/m3 to 1900 kg/m3 are used in the fluidization and hydraulic lifting experiment. The average compressive strength of oil shale is 49.2 MPa, while the proctor hardness coefficient is 4.7. The particles have tough surface and are not easy to be broken. The average oil content is about 5.5%. The organic components of oil shale are mainly C, H, O. The main inorganic components and elements of N and S are clay and siltstone. Oil shale particles were processed by a sand mill to be approximately spherical shape. These particles prepared for fluidization experiment were divided into three groups by self-made metal sieve. Each group is narrow graded particles, and particle size ranges were 4.8 mm~5.2 mm, 14.2 mm~16.4 mm and 24.1 mm~26.2 mm with average particle size of 5 mm, 15 mm and 25 mm respectively. In hydraulic lift pipe section in Fig. 1, the particles size ranging 3.2 mm~3.6 mm with an average 3.4 mm were used.
Firstly, the fluidization experiment is carried out. The coarse oil shale particles of 80 mm–100 mm thickness are placed on the metal screen, and the water speed is gradually increased through the frequency conversion motor driving centrifugal pump. When the particle layer on the metal screen disappears, the flow state changes from granular bed to movable bed. At this point, fluidization is achieved. After the flow state stabilizes for 15 min, the height of solid particles and the velocity water are recorded. This process should be repeated for 3~4 times. Then, the average value will be taken. The flow rate of water is raised gradually to achieve the fluidization at different particle concentrations. The corresponding water speed Vm and height of suspended bed Hb are recorded. Through the above steps, 21 groups of experimental data of coarse oil shale particle fluidization with an average particle size of 5 mm, 15 mm and 25 mm were obtained.
Secondly, the coarse oil shale particles hydraulic lifting experiment is carried out. The test pipe section is shown in vertical pipe lifting section of Fig. 1. In order to obtain the velocity of solid particles, the motion of particles in vertical lifting section of Fig. 1 is captured by a high-speed camera every fixed period of time. The sensor of the camera is equipped with a 1/5 inch interlaced charge coupled device (CCD). The maximum pixel is 1280 × 896, with the gray level of 340 and the maximum single field exposure time of 1/2000 s. The CCD element in the camera scans the shooting area 50 times per second. At the same time, the image processing chip inside the camera converts the scanning signal into static images to be stored along the time series. By processing the particles moving within the fluid in the video, the characteristics of particle velocity and concentration distribution can be obtained [12]. In this experiment, non real-time post-processing method is used to analyze the particle image data. After shooting, the particle single field image is extracted by segmenting the video file. And then, the operations of intra-field de-interleaving, image calibration, image segmentation and image morphology are performed on the single field image. Finally, the binary image of particles is obtained. The velocity vs and concentration c of solid particles are obtained by particle matching. The values of average particle concentration Q and average velocity Vs are obtained by integrating concentration q and velocity vs. The average water velocity Vm can be achieved from the magnetic flow meter.
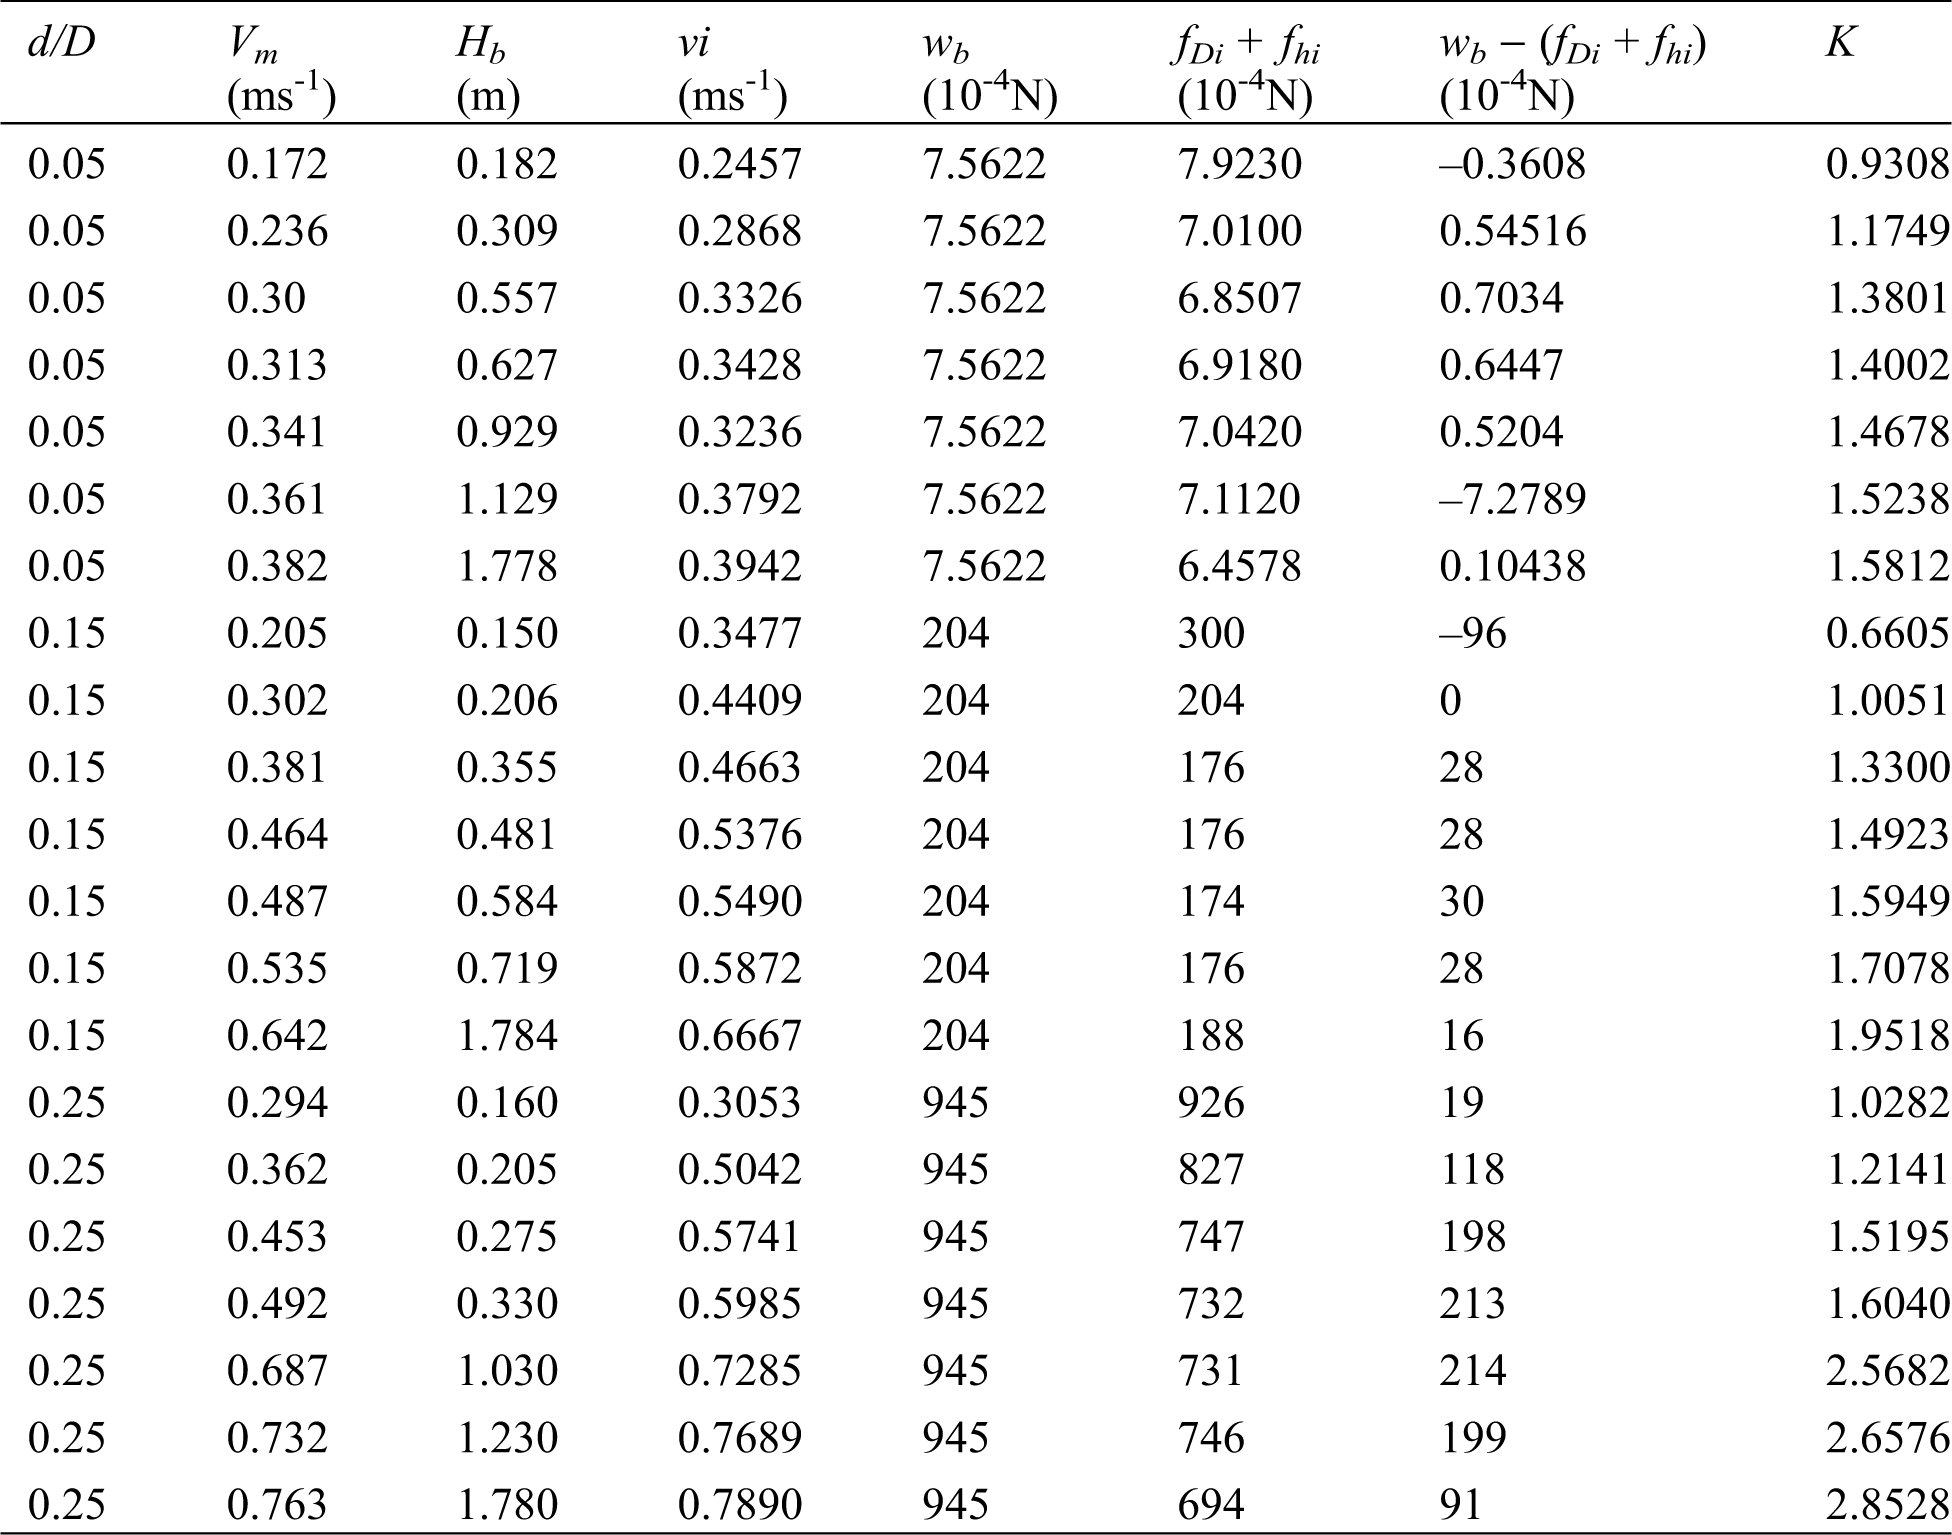
In the fluidization experiment, the average local concentration of particles ranges from 3%~30%, and the average water velocity ranges from 0.172 m/s~0.763 m/s. In the vertical lifting experiment, the average local concentration of particles ranges 3.08%~25.7%, and the flow velocity of pump outlet ranges 1.84 m/s~2.6 m/s. As shown in Tab. 1, 21 groups of effective data were obtained from the fluidization experiment, and 56 groups for particle velocity, slip velocity and hydraulic gradient, respectively.
Table 1: Forces calculation results for fluidization stage
It is considered that the frequency stands the probability of particle appearance-the volume ratio of particle at this position. The specific method is to sample the particle binary image along the radial position, count the number of particles appearing, and get the frequency of particles in each radial position.
In this experiment, the water isolation piercing device is used to avoid excessive particles from entering the plastic pipe. The pressure difference between two points can be directly read by the U-type differential meter. When a certain amount of solid particles is deposited in water tank, particles can be released through the particle exit. The formula of hydraulic gradient im can be defined as follows:
where ∆H is the pressure difference; L is the distance between two points; γm and γ are the proportion of mercury and water, respectively.
In the test, the oil shale particles do not need to pass through pump. The particle size remains unchanged in the test.
3 Analysis of Coarse Particle Mechanical Characteristics
According to the existing results of relevant scholars, there are four forces acting on a single particle when the particles in the slurry are in fluidization state within the experimental tube in Fig. 1 [9,11,13,17]. They are solid particle gravity (fG), the buoyancy of fluid on particle (fB), resistance from liquids (fDi) and interference force from other particles (fhi). Usually, the difference between particle gravity and buoyancy (fG − fB) is called particle effective gravity (wb). When the particles are in a stable state, the force balance equation can be expressed as follows:
The formulas of the three forces in Eq. (2) can refer to the existing relevant research results [18,19].
Submitting the experimental data into Eq. (2), the calculated results are shown in Tab. 1. When the ratio of particle to pipe diameter (d/D) is the same, the inter-granular water velocity (vi) and water flow velocity (Vm) show a positive correlation, meanwhile the former is obviously larger than the latter. The calculation results listed in Tab. 1 show that wb − (fDi + fhi) is positive in most cases, which shows that the factors considered in Eq. (2) are not comprehensive.
The fluidization force of the particles is shown in Fig. 2. It presents that the larger the particle diameter is, the larger the vortex range behind them is, which was proved by the research results of other scholars [13,17]. There is a vortex (fvi) behind the particle, playing a resistance role on the particle, as shown in Fig. 2a. The determination form of vortex resistance (fvi) is more complicated. In order to simplify the problem, Kfhi is used to replace the interference force (fhi) and vortex resistance (fvi), which is shown in Fig. 2b. In the hydraulic lifting experiment shown in Fig. 2c, the direction of Kfhi is slightly different from that of fluidization stage. The coefficient K is called the vortex force resistance factor.
Therefore, the particle force balance equation for the stable fluidization state is defined as [17]:
Thus,
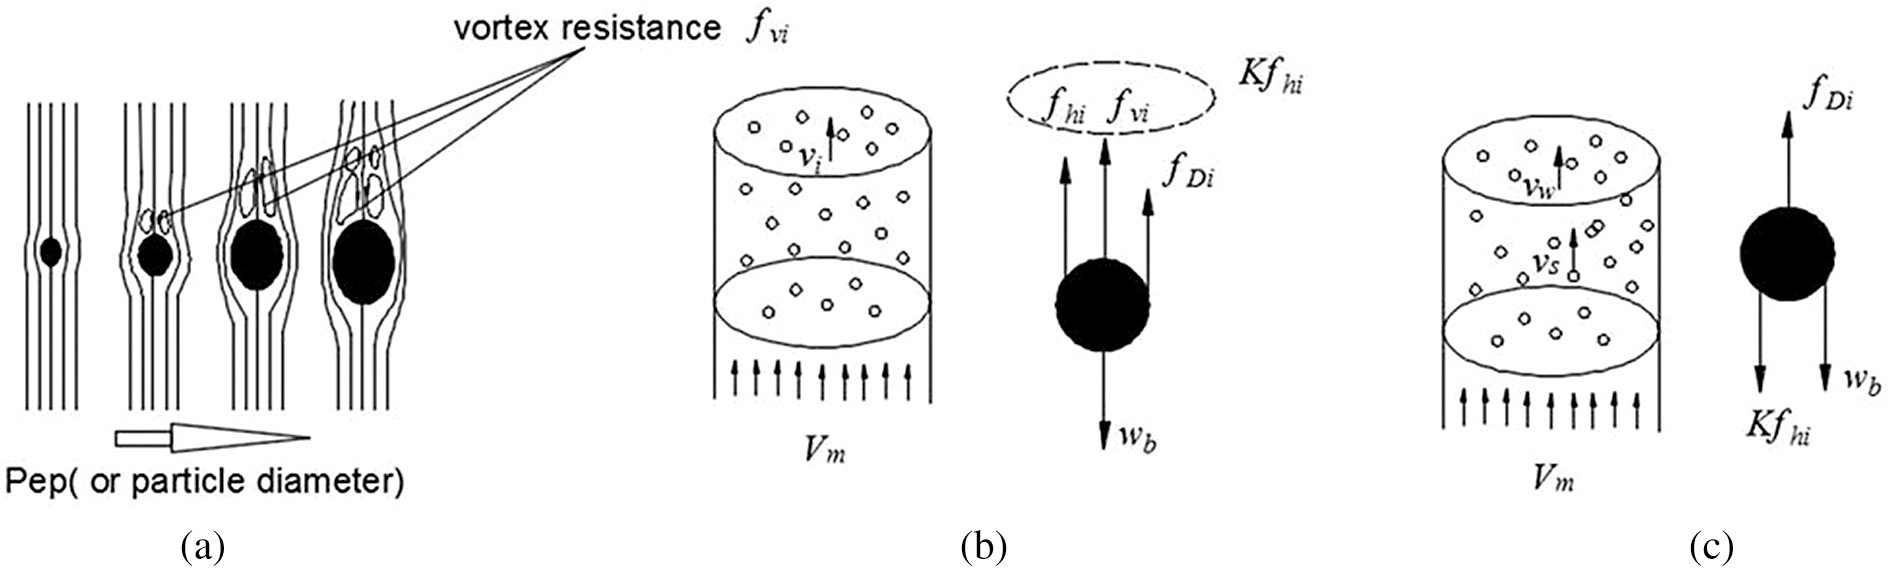
Figure 2: Vortex resistance and its effect on fluidization and vertical lift (a) Formation of vortex resistance (b) Fluidization process (c) Vetical lift process
The vortex force factor in Eq. (4) is calculated by the experimental data of fluidization stage, and the results are shown in Tab. 1. For value of resistance factor (K), only one group of 21 vortex force data is less than 1. When the ratio of particle to pipe diameter (d/D) is the same, the vortex force resistance factor (K) and the water flow velocity (Vm) show a positive correlation.
According Eq. (4) and related references [18,19], the factors influencing the forces (wb, fDi and fhi) are the particle size (d), local concentration (Q), average water velocity (Vm), water density (ρ) and solid density (ρs). The particle density of oil shale in this experiment is almost constant. Hence, it can be concluded that the vortex force resistance factor (K) is related to Froude number Fr(Fr = Vm/(gd)0.5), d/D and Q. After analyzing the fluidization data, K and Fr show a linear relationship through the origin, meanwhile the K/Fr and d/D also show a linear relationship across the origin [17], as shown in Figs. 3 and 4, respectively.
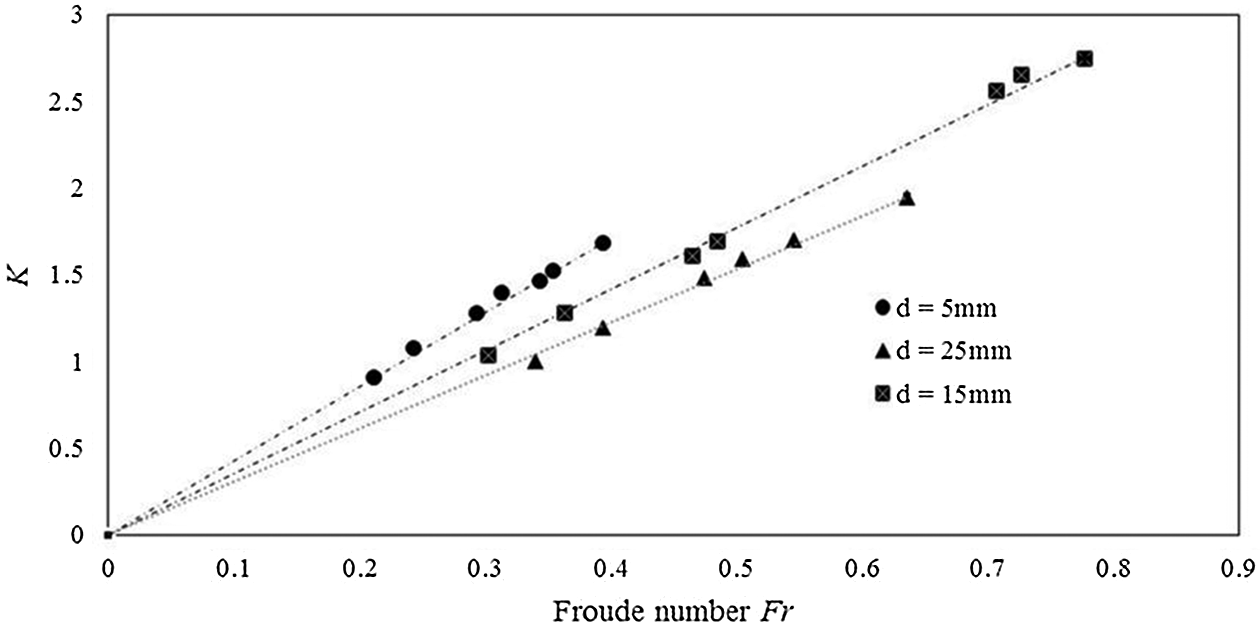
Figure 3: Relationship between K and Fr at different particle sizes
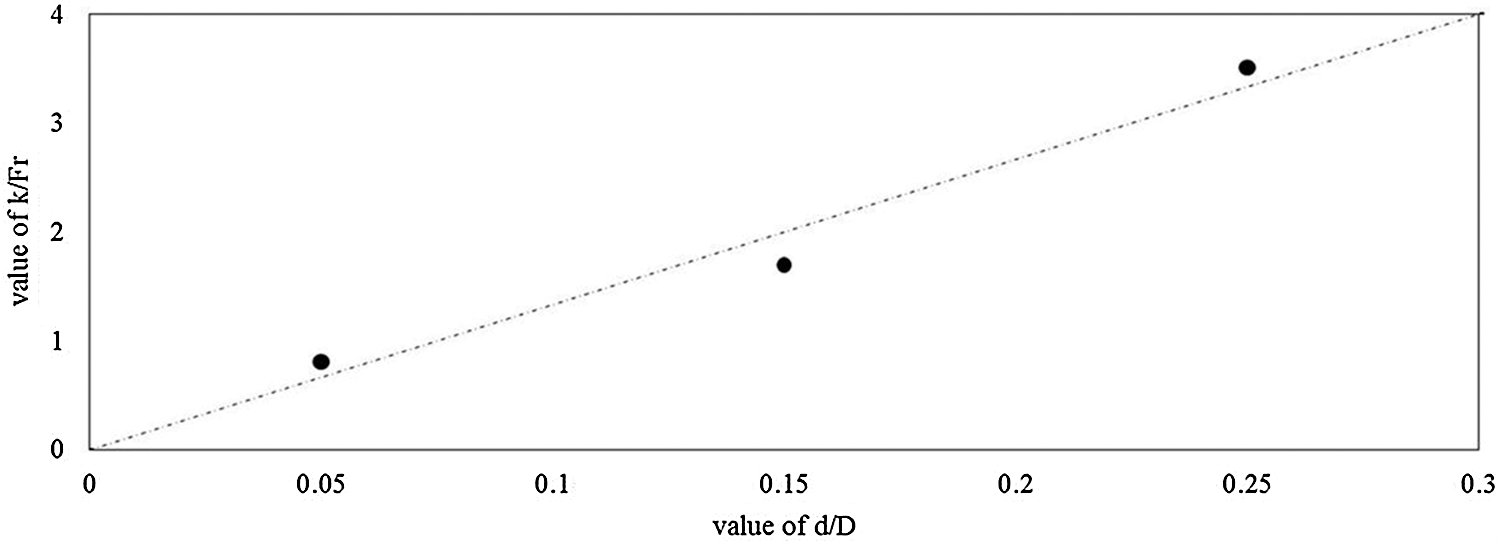
Figure 4: Relationship between K/Fr and d/D for Q = 18%
Therefore, the expression of the vortex force resistance factor (K) can be derived as:
Eq. (5) can be changed into the following form:
The value of f(Q) in different states is calculated by Eq. (6), and then the relationship between f(Q) and corresponding Q is fitted, as shown in Fig. 5. The fitting formula is:
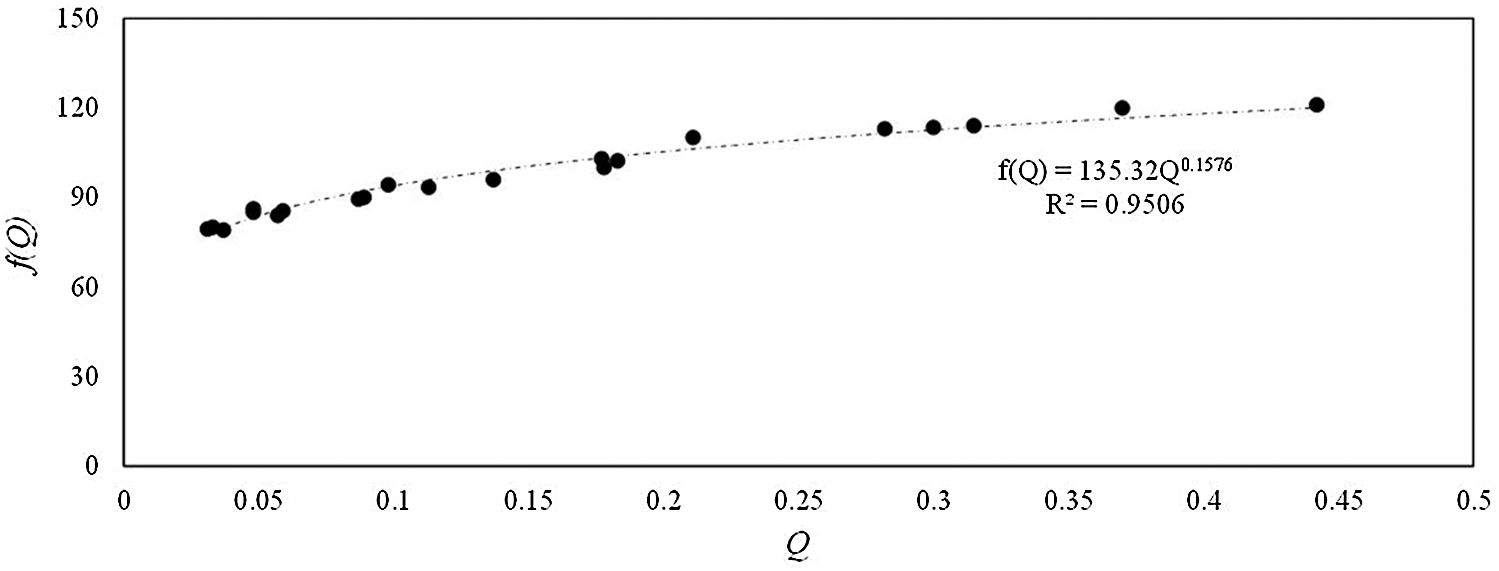
Figure 5: Fitting results for fluidization experimental data
The confidence for fitting of Eq. (7) is 0.9506.
Combining Eqs. (5) and (7), the following formula can be obtained:
4 Effects of Vortex Force Resistance Factor on Vertical Slurry Flow Parameters
4.1 Derivation of Theoretical Formula of Flow Parameters Considering K
During the vertical transport process of coarse-grained slurry as shown in Fig. 2c, when the particles are in constant flow, the force balance equation for a single particle can be expressed as:
The Eq. (9) is obtained by taking the micro section as the research object, considering each force based on the mean significance for the unit pipe section. In this case, fD and fhi will become FD and Fh in the mean sense, which are functions of slip velocity Vslip and average concentration Q, respectively. Eq. (9) can be changed to [17]:
where fh' can be calculated according related references [19];
According to the Eqs. (8), (10) and the previous researches [9,11,13,17], the average slip velocity (Vw − Vs) in the pipeline can be obtained using the iterative method if Q, d/D and Vm are known.
Considering the momentum exchange between liquid and solid and additional pressure of solid particle acceleration, and the following equation exists [20]:
where V is the average velocity of water before exchanging momentum; δ = ρs/ρ; La is the acceleration distance of solid particles and ψ(1) is a coefficient. The calculation method of La and ψ(1) can refer to Xu 1999(a) [13].
According to the flow balance, there exists the following relationship:
In Eq. (12), Vm is the velocity of clear water, which equals average slurry velocity. It can be measured by magnetic flow meter in Fig. 1, and Vs = 0 for fluidization experiment pipe section.
By using Eqs. (10)–(12), Vw, Vs, and V can be obtained.
When the water flow in the pipeline is in a turbulent state, the hydraulic gradient can be expressed as:
where: λ is the Darcy resistance coefficient and g is acceleration of gravity (m/s²).
Obviously, Eq. (13) cannot be used to calculate the hydraulic gradient of slurry. From the Eq. (11) and Fig. 6, the pressure difference (△P) forcing water to flow at velocity (V) within pipe section (L) equals to the slurry resistance to move forward with the velocity (Vm) after the intervention of solid particles. Therefore, the hydraulic gradient caused by the slurry velocity of (Vm) in the pipeline can be considered to be the hydraulic gradient of the clear water flowing in the pipeline at the speed of V. This is the equivalent resistance model, as shown in the Fig. 6. Using the Eqs. (10)–(12), the value of V, Vs and Vw can be achieved. Bring V into the Eq. (13), the hydraulic gradient of the coarse particle oil shale slurry in the vertical pipe can be obtained.
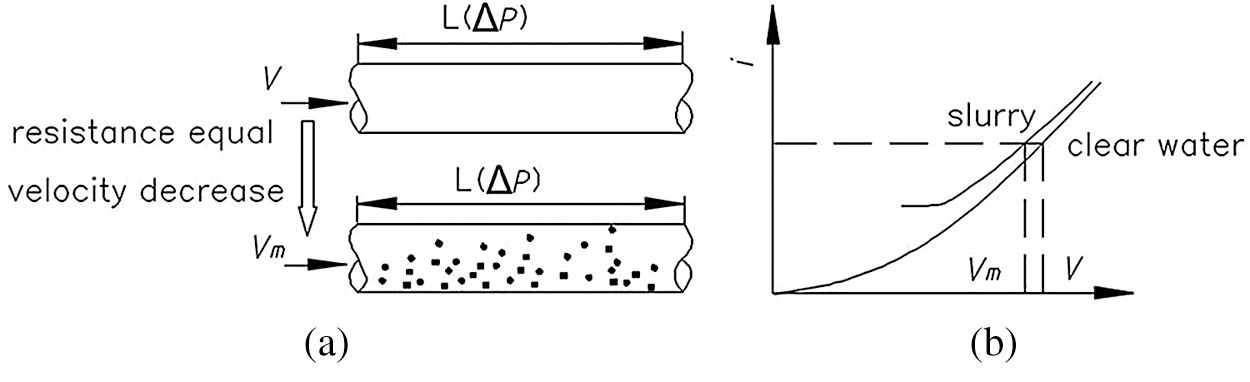
Figure 6: Principles of equivalent resistance model (a) tube flow process (b) i-v curves of water and slurry flow
4.2 Calculation Process of Flow Parameters in Vertical Slurry Pipeline
Calculation process of flow parameters including Vw, Vs, Vslip and im is shown in Fig. 7.
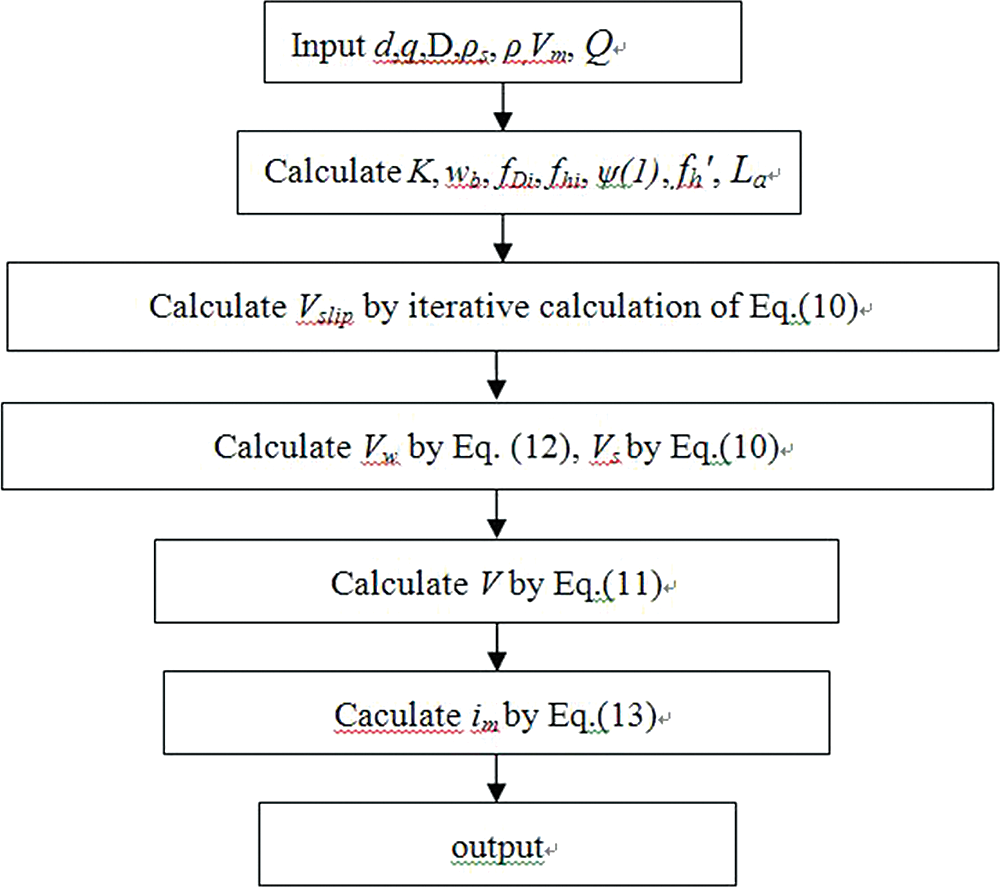
Figure 7: Flow chart of Vw, Vs, Vslip and im
In above process, the initial value of Vslip is 0.001 m/s and the step size is 0.001 m/s when calculating Vslip by iterative calculation of Eq. (10).
4.3 Effects of Vortex Force Resistance Factor on Flow Parameter
The calculated results of particle velocity (Vs), slip velocity (Vslip) and hydraulic gradient im for coarse particle slurry in vertical pipe are shown in Figs. 8–10. The effect of coefficient K on particle velocity is shown in Fig. 8. After considering vortex resistance coefficient K, the deviation between the calculated and measured average particle velocity decreases from 14.14% to 9.18% in the range of 2.51%–7.35% of particle concentration. Data analysis shows that the accuracy of particle velocity calculation is high when the particle concentration is small, and the deviation is large when the particle concentration is large. The possible reason is that the fitting Formula (8) is obtained in the case of large concentration range, so it will lead to certain deviation when the concentration is low. Data analysis shows that the velocity of solid particles decreases after considering K, resulting from the effect of vortex resistance which hinders the movement of particles.
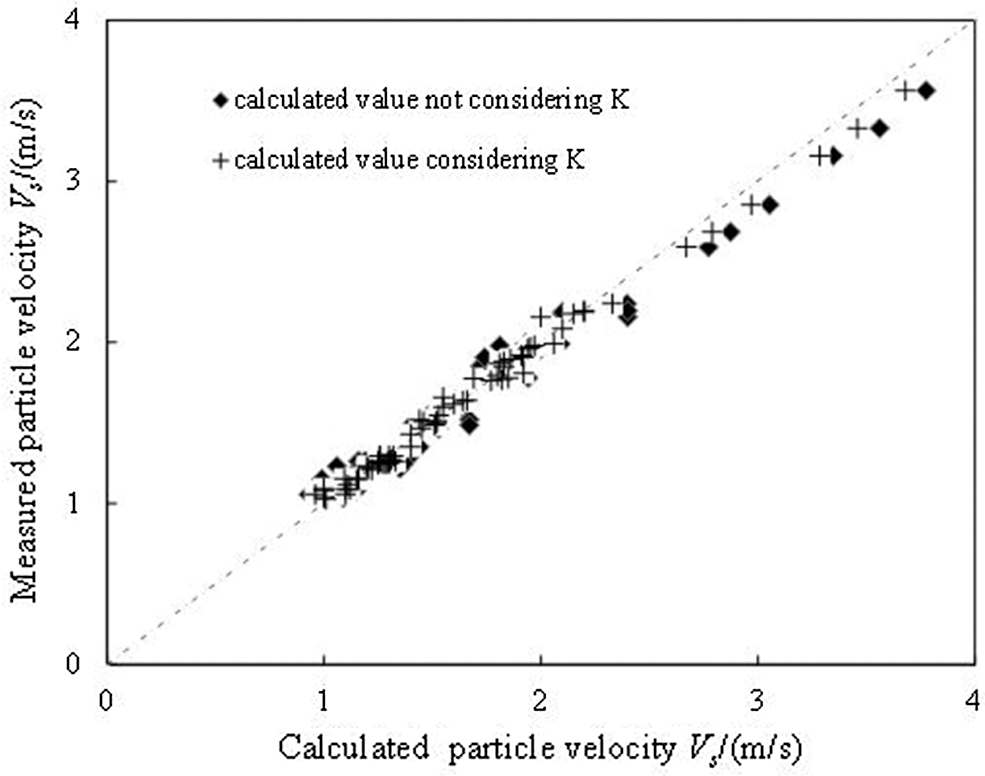
Figure 8: Comparison of calculated and measured average particle velocity
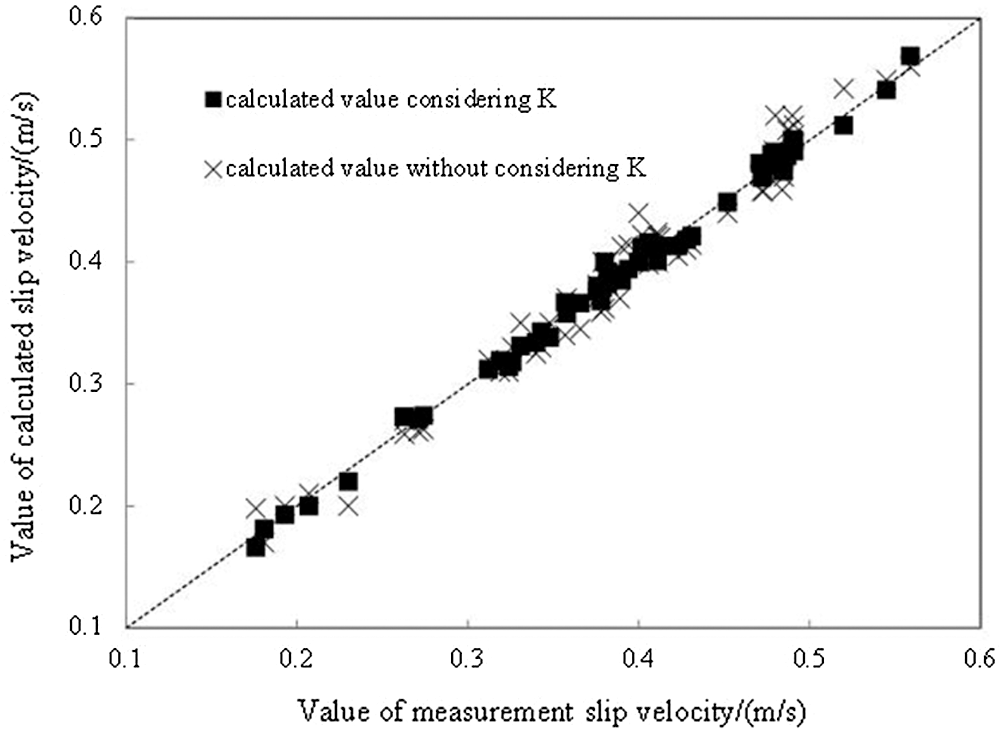
Figure 9: Comparison of calculated and measured average slip velocity
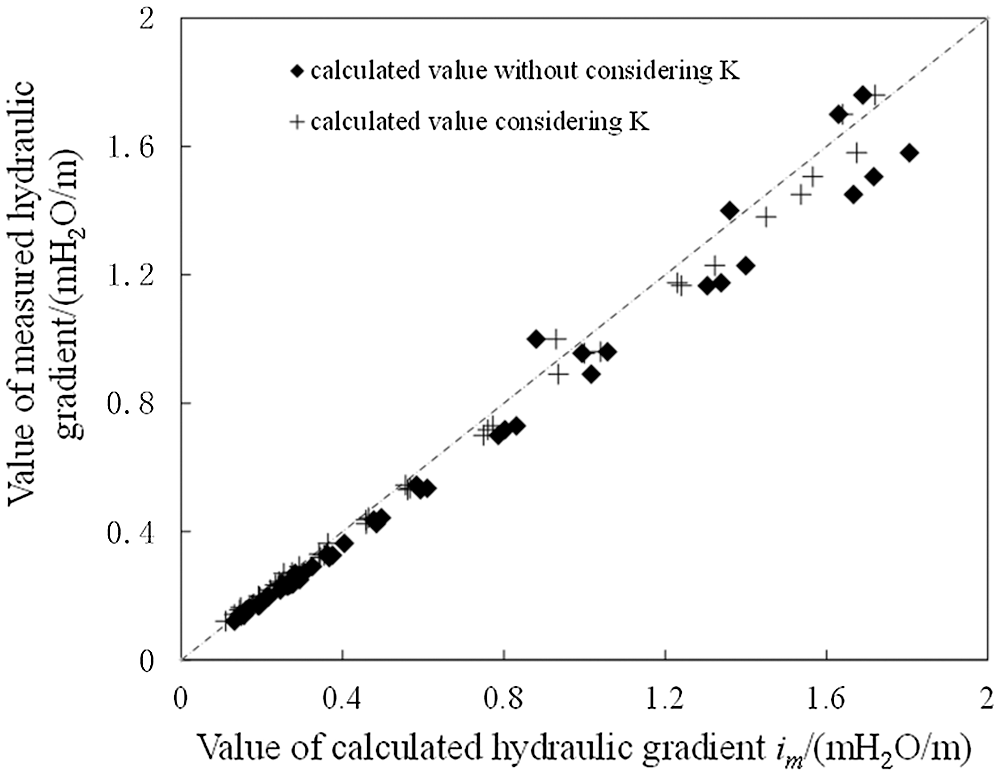
Figure 10: Comparison of calculated and measured friction resistance
The effect of vortex force resistance factor (K) on average slip velocity is shown in Fig. 9. Considering the resistance factor (K), the deviation between the calculated and measured slip velocity decreases from 12.5% to 7.64%. The calculated slip velocity increases with the consideration of the coefficient K and is closer to the measured value.
Effect of vortex force resistance factor (K) on hydraulic gradient is shown in Fig. 10. The calculated hydraulic gradient (im) without considering vortex force resistance factor is larger than that of measured value, and the maximum deviation of the two is 15.26%. The calculated hydraulic gradient (im) considering vortex force resistance factor is also larger than that of measured value, and the maximum deviation of the two is 9.79%. It can be implied that the calculated value of hydraulic gradient without considering vortex force resistance factor is too large, while after considering vortex force resistance factor will be closer to the measured value.
In summary, the vortex resistance reduces the calculated value of particle velocity (Vs) and hydraulic gradient, while increases the slip velocity (Vslip). The calculated particle velocity and hydraulic gradient are closer to the measured ones when the vortex resistance is considered.
Fig. 11 shows the effect of concentration change in slip velocity (Vslip) and resistance factor (K) at water flow velocities of 1.84 m/s and 2.15 m/s. The slip velocity corresponding to low water velocity Vm = 1.84 m/s is higher than that of high water velocity Vm = 2.15 m/s. The resistance factor (K) increases with the concentration (Q) and water velocity (Vm), which is consistent with the law in Eq. (8).
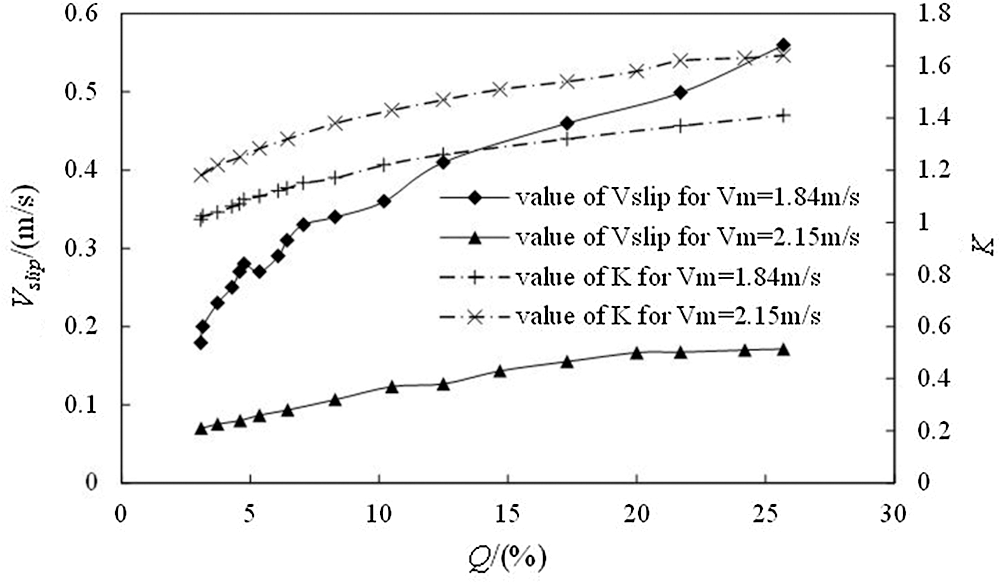
Figure 11: Effect of concentration Q on slip velocity Vslip and coefficient K
Fig. 12 shows the effect of concentration (Q) on slip velocity (Vslip) and resistance factor (K) when the flow velocity (Vm) is 2.3 m/s and 2.6 m/s, respectively. In the figure, the slip velocity of the two kinds of flow velocity is much close.
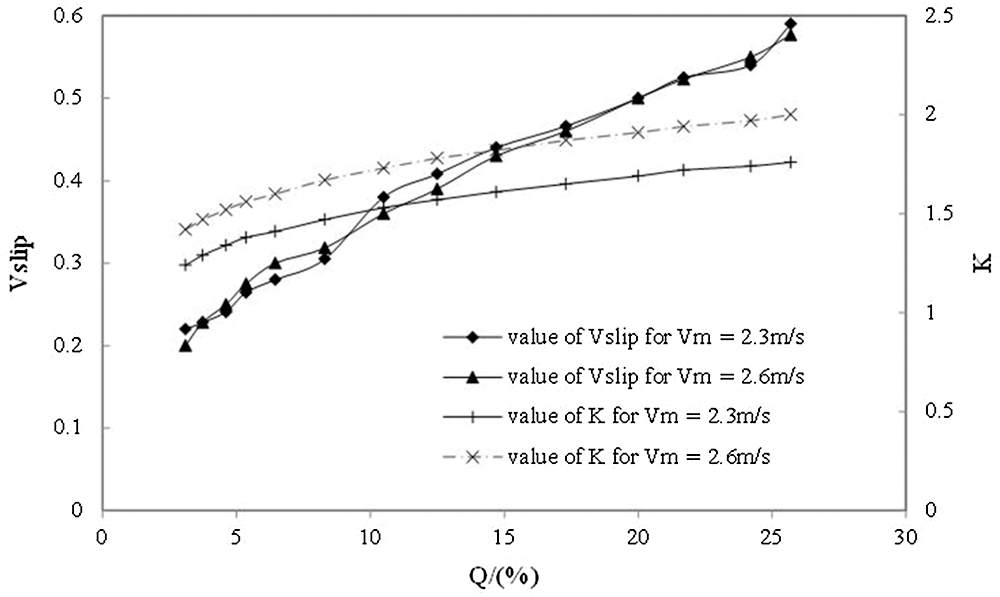
Figure 12: Effect of concentration (Q) on slip velocity Vslip and factor (K)
The above two figures illustrate that the smaller the water flow velocity (Vm), the greater the slip velocity. When the flow velocity is greater than 2.3 m/s, the flow velocity has little effect on the slip velocity. The larger the flow velocity (Vm), the greater the value of resistance factor (K). This is consistent with Formula (8).
Fig. 13 shows the influence curve of flow velocity (Vm) on slip velocity (Vslip) and resistance factor (K) when particle concentration is 3.74% and 21.7%, respectively. When the velocity is low, the slip velocity increases with the increase of the flow velocity, while decreases with the increase of the flow velocity when the flow velocity exceeds 2.13 m/s~2.30 m/s. The reason may be that the fluid in the pipeline is turbulent in most cases in the process of vertical transportation. When the flow velocity is low, the turbulence intensity of clean water is low, and thus the particle following property is poor. With the increase of flow velocity, the slip velocity increases. When the water velocity exceeds a certain limit, the turbulence intensity of the fluid enlarges, and the liquid-solid energy exchange is violent. The water velocity will gradually approach that of solid particles, leading to the decrease of slip velocity.
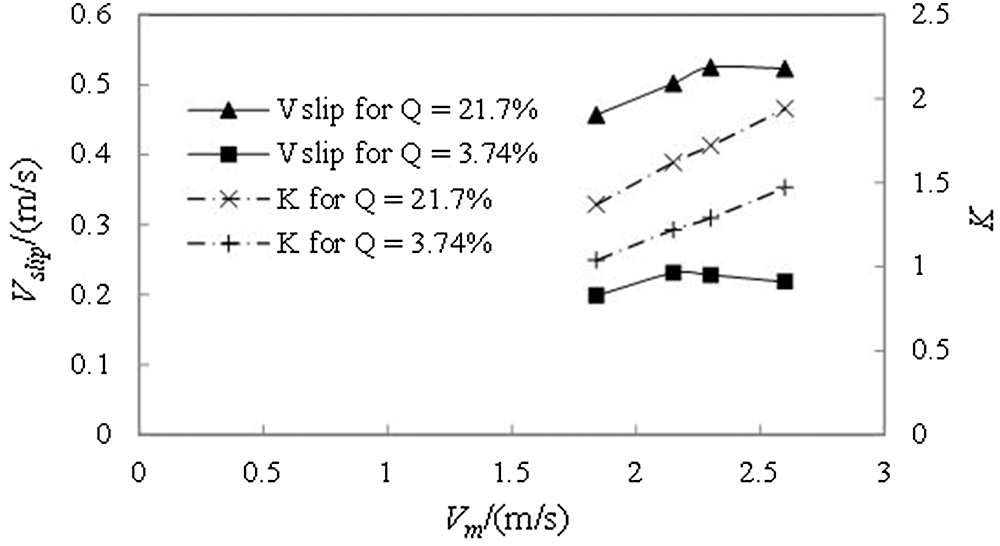
Figure 13: Effect of water velocity (Vm) on slip velocity Vslip and factor (K)
1. The force state of the fluidized bed with coarse oil shale particles is calculated and analyzed. The traditional force balance is defective for coarse particle oil shale slurry. There is a vortex resistance behind the particle. The vortex resistance factor K given by data fitting is proposed to describe the vortex resistance behind the coarse particles.
2. Theoretical calculation models of several flow parameters with influence of vortex resistance are given. The calculated results of the proposed model show that after considering vortex force resistance factor K, both of the average particle velocity and hydraulic gradient decrease, while the slip velocity tends to increase, and those calculated values are much closer to the measured ones. The smaller the water flow velocity, the greater the slip velocity. The slip velocity increases with the water flow velocity in low velocity, but decreases in high velocity.
Acknowledgement: The author sincerely thanks the school colleagues and the leaders at all levels at Liaoning Technical University, as well as the help and collaboration of Pipeline Engineering Institute of Wuhan Design and Research Institute of China Coal Technology and Engineering Group in the pipeline experiment and writing process of this article.
Funding Statement: This study is supported by Liaoning Provincial Education Department Project “Study on gradation degradation and its influence in pipeline transportation of coarse coal slurry”, project number: 20-1054, Approval No. LJ2020JCL004.
Conflicts of Interest: The authors declare that they have no conflicts of interest to report regarding the present study.
1. Wang, Z., Luo, W., Liao, R., Xie, X., Wang, H. (2019). Slug flow characteristics in inclined and vertical channels. Fluid Dynamics & Materials Processing, 15(5), 583–595. DOI 10.32604/fdmp.2019.06847. [Google Scholar] [CrossRef]
2. Liu, Y., Su, Y., Wu, Z., Luo, W., Liao, R. (2020). Effect of the inclination angle on slippage loss in gas-liquid two-phase flow. Fluid Dynamics & Materials Processing, 16(3), 475–488. DOI 10.32604/fdmp.2020.08896. [Google Scholar] [CrossRef]
3. Fu, Y., Xiao, H., Xia, J. (2019). Experimental study on minimal transporting velocity of long particles in vertical pipeline. Oceanographic Engineering, 37(4), 63–69. [Google Scholar]
4. Liu, B., Hou, P., Shang, L., Li, P., Lv, Z. (2018). Numerical simulation of flow characteristics for natural gas hydrate in vertical tube. Journal of Jiangsu University (Natural Science Edition), 39(6), 664–670. [Google Scholar]
5. Gao, W. (2011). Research on fluid transportation of bottom-hole of oil shale and its laboratory bench design (Ms. Thesis). Jilin University, China. [Google Scholar]
6. He, Y. (2011). Research and development of experiment platform for borehole hydraulic mining of oil shale (Ms. Thesis). Jilin University, China. [Google Scholar]
7. Wen, J. (2014). Numerical simulation and experimental research on the jet devices for hydraulic borehole mining of oil shaie (Ph.D. Thesis). Jilin University, China. [Google Scholar]
8. Yan, X., Chen, C., Liu, X., Zhang, Q. (2012). Physical and mechanical parameters of borehole hydraulic mining of nong’an oil shale. Oil Shale, 29(3), 237–247. DOI 10.3176/oil.2012.3.04. [Google Scholar] [CrossRef]
9. Wang, X. (2005). Study on the friction loss of hydraulic lifting large solid particles in vertical pipeline (Ms. Thesis). Liaoning Technical University, China. [Google Scholar]
10. Matousek, V. (2009). Pipe-wall friction in vertical sand-slurry flows. Particulate Science and Technology, 27(5), 456–468. DOI 10.1080/02726350903133179. [Google Scholar] [CrossRef]
11. Zhao, L., Meng, Q. (2007). Research of slurry velocity distribution and friction loss in vertical pipeline. Journal of Anhui University of Technology (China), 24, 297–300. [Google Scholar]
12. Wang, Y., Yang, N., Jin, X. (2012). High speed photographic analysis of characteristics of large particle movement in hydraulic lifting system. Journal of Sediment Research (China), 3, 64–69. [Google Scholar]
13. Xu, Z. (1999). Research on velocity distribution and hydraulic gradient of inhomogeneous flow (Ph.D. Thesis). Northeastern University, China. [Google Scholar]
14. Zhou, M., Kuang, S., Luo, K., Zou, R., Wang, S. et al. (2020). Modeling and analysis of flow regimes in hydraulic conveying of coarse particles. Powder Technology, 373(1), 543–554. DOI 10.1016/j.powtec.2020.06.085. [Google Scholar] [CrossRef]
15. Zhou, M., Wang, S., Kuang, S., Luo, K., Yu, A. (2019). CFD-DEM modelling of hydraulic conveying of solid particles in a vertical pipe. Powder Technology, 354(10), 893–905. DOI 10.1016/j.powtec.2019.07.015. [Google Scholar] [CrossRef]
16. Liu, Y., Chen, L. Y. (2020). Numerical investigation on the pressure loss of coarse particles hydraulic lifting in the riser with the lateral vibration. Powder Technology, 367(1), 105–114. [Google Scholar]
17. Zhao, L., Wang, T., Han, W. (2019). Study on velocity distribution of large particle in vertical slurry pipeline. Measurement and Control, 52(9–10), 1282–1288. [Google Scholar]
18. Zhao, L. (2011). Study on flow of large particle slurry in pipeline (Ph.D. Thesis). Liaoning Technical University, China. [Google Scholar]
19. Zhao, L., Xu, Z. (2013). Velocity distribution and slip velocity of large particle slurry flow in pipe. Clean Coal Technoloty (China), 19, 116–119. [Google Scholar]
20. Zhao, L., Xu, Z., Wang, T. (2018). Theory and technology of slurry pipeline transportation. Beijing, China: Coal Industry Press. [Google Scholar]
 | This work is licensed under a Creative Commons Attribution 4.0 International License, which permits unrestricted use, distribution, and reproduction in any medium, provided the original work is properly cited. |