Materials Processing
| Fluid Dynamics & Materials Processing |
DOI: 10.32604/fdmp.2021.010595
ARTICLE
A Pull-Out Test Study on the Working State of Fully Grouted Bolts
1School of Highway, Chang’an University, Xi’an, 710064, China
2Shandong Hi-speed Group Co., Ltd., Jinan, 250098, China
3Shandong Provincial Communications Planning and Design Co., Ltd., Jinan, 250031, China
*Corresponding Author: Ruixin Zhao. Email: jgzizi0328@163.com
Received: 12 March 2020; Accepted: 20 February 2021
Abstract: The present study examines the working conditions of fully grouted bolts used for the construction and expansion of high slopes. On the basis of a pull out destructive test, the work load and the ultimate load are obtained on site, and the Flac3d numerical simulation method is employed to determine the axial force distribution and the effective anchor length. The test results show that (1) the Q-S (load-displacement) curve of the bolt displays a certain degree of deformation coupled with the creep of the surrounding rock; (2) the working load of the bolt is closely related to the sliding deformation trend of the slope, while the ultimate load depends on the design parameters of the bolt and the lithology of the slope; (3) the distribution of bolt axial force is characterized by a single peak along the bolt length and the effective anchorage length of the bolt is 3 m; (4) after 20 years, the bolt’s ultimate load has a maximum loss of 31.94%.
Keywords: Geotechnical engineering; highway slope; full length grouted anchor; destructive test; stress loss
Widening highways involves a significant number of secondary excavation projects for existing highslopes [1,2]. Both the support measures and the working state of supported bolts have become key issues in the secondary excavation stability of slopes [3]. Bar bolt supports are widely used in high slope as a typical support method.
At present, non-destructive tests and destructive (pull-out) tests are two commonly used detection methods to determine the working state of bolts [4]. Non-destructive tests apply stress wave at the end of the bolt, and the working state of the bolt is inferred by the properties of the reflected wave. The pull-out test is used to record the load-displacement (Q-S) curve, and this test uses the curve catastrophe point to infer workload [5]. An X-ray CT scanner was used to monitor the failure process of the pull-out test model and analyzed the microscopic damage form of the anchor body in the pull-out test [6]. Chen et al. [7] developed a new laboratory short encapsulation pull-test (LSEPT) to simulate the interaction between cable bolts and the surrounding rock mass. Ren FF used a three-fold linear bond-slip constitutive model to describe the failure characteristics of the anchor interface [8]. Based on the bond-slip model, the results of the site pull-out test were verified [9].
Research on the load transfers mechanism of bolts has been carried out by means of pull-out tests. Kilicinvented an effective method for testing the bond strength between the grouting body and the surrounding rock and established an empirical formula for the bonding strength [10]. Srivastava et al. [11,12] studied the influence of the interfacial bond strength between the block of grouting material on the surface and the relative stiffness between (1) rock mass properties, (2) grouting body material properties, (3) beam materials on the anchoring force transmission, and (4) the destruction mechanism. Duan et al. [13,14] used atheoretical solution to investigate the ultimate load of the rock bolt. Zhang et al. [15] proposed the interface shear stress redistribution hypothesis and studied the destruction process of typical components using a pull-out test. You et al. [16] studied the deformation behavior and failure characteristics of the interface between the bolt and the grouting body under the pull load. Liu et al. [17] established the potential energy equation under the ideal elasto-plastic model. Shi [18] identified sliding failure at the end of the bolt, and the deformation was found to be inward facing with the increase in the pull load. Huang et al. [19,20] also studied the load transfer mechanism of the progressive failure process of bolts and established different anchor bolt interface mechanics models.
Although research about the load transfer mechanism has been carried out using pull-out tests, the main purpose of these tests has been to study the quality of the bolt after the construction of the slope. However, there have been few studies on the long-term load mechanism of the bolt. To evaluate the stress loss of a rock bolt, this paper relies on the secondary excavation of the cutting slope in the highway. A pull-out destructive test was used to obtain the working load and ultimate load of the full-length wholly grouted bolt, and the distribution law of bolt axial force under load is proven by numerical analysis.
The K593+260∼K593+555 slope has experienced multiple deformations and instability over the past twenty years, and it was eventually stabilized after being supplementing with Φ32 full-length bolt-supported measures. However, the excavation of the slope will require the removal of the existing bolts, which will affect the stability of the slope.
The slope height is 29.6 m, and the grading height is about 10 m. The slope angle has an inclination of 45°~63° and a tendency of 56°. In the reconstruction and expansion project, the width of the subgrade was increased to 42 m, so that the slope foot line of the slope was moved 10 m inward, and the slope height was increased 29.6 m to 40.7 m.
The moderately weathered limestone strata has the following characteristics: a layered structure, the partial destruction of the original rock structure, a columnar core, secondary hard rock, c = 24 kPa, ϕ = 49°.
The weathered limestone has the following characteristics: layered structure, the partial destruction of the original rock structure, a short columnar core, crushed rock, c = 26 kPa, ϕ = 55° [21].
To study the stress state of a long-term supported bolt, a series of pull-out tests were carried out. The test instrument was a 100T manual hydraulic jack, which was combined with the load system and the displacement gauge system. For the load system, the hollow jack applies a thrust to the bolt. The displacement system records the bolt deformation. The load-displacement (Q-S) curve is recorded by the stepwise load measured during the test. The test system is shown in Fig. 1.
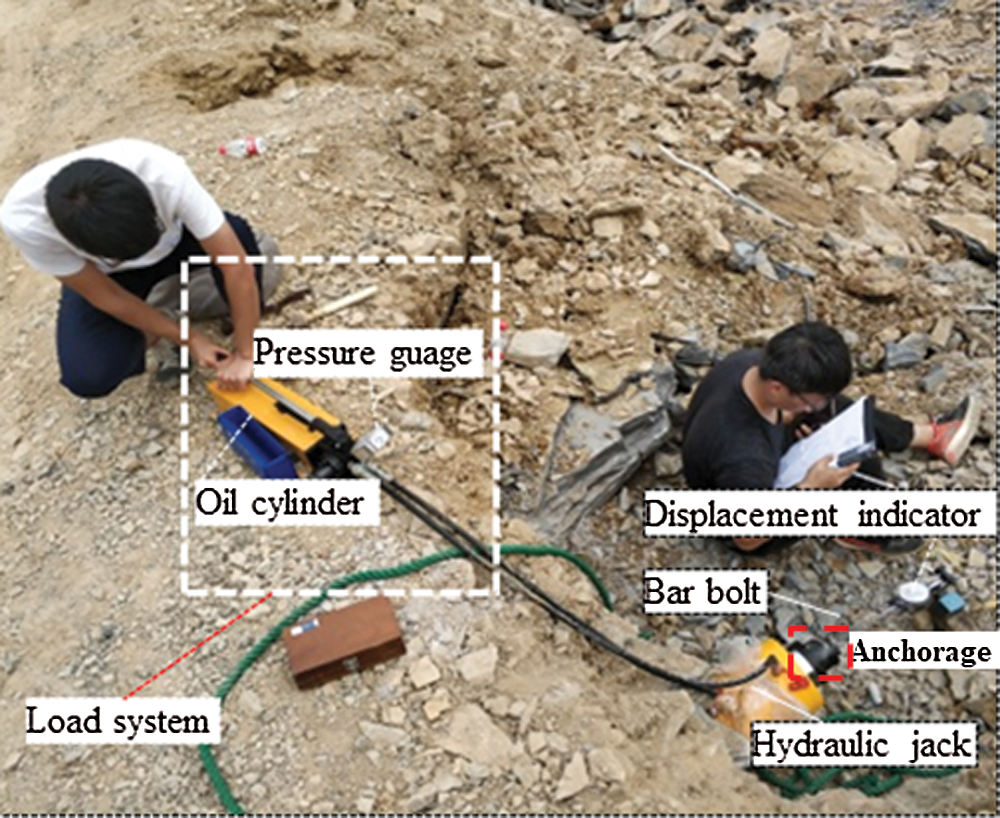
Figure 1: Pull-out test device
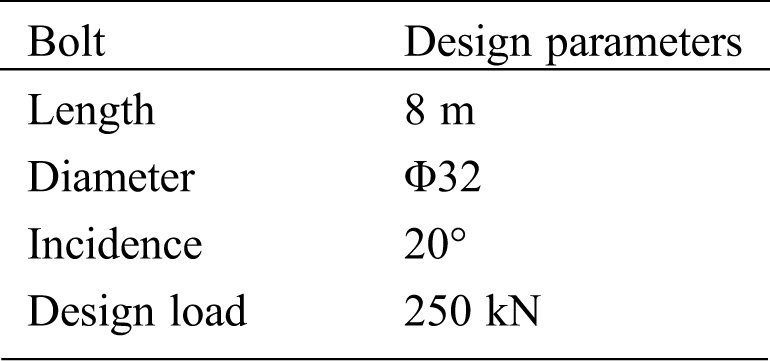
Five tested bolts on the third-level slope, seven tested bolts in the lower row, and nine tested bolts in the second-level slope were selected in this test. The detection position of the tested bolts in the slope is shown in Fig. 2. Tab. 1 lists the design parameters of the tested bolts and geological description of the slope.
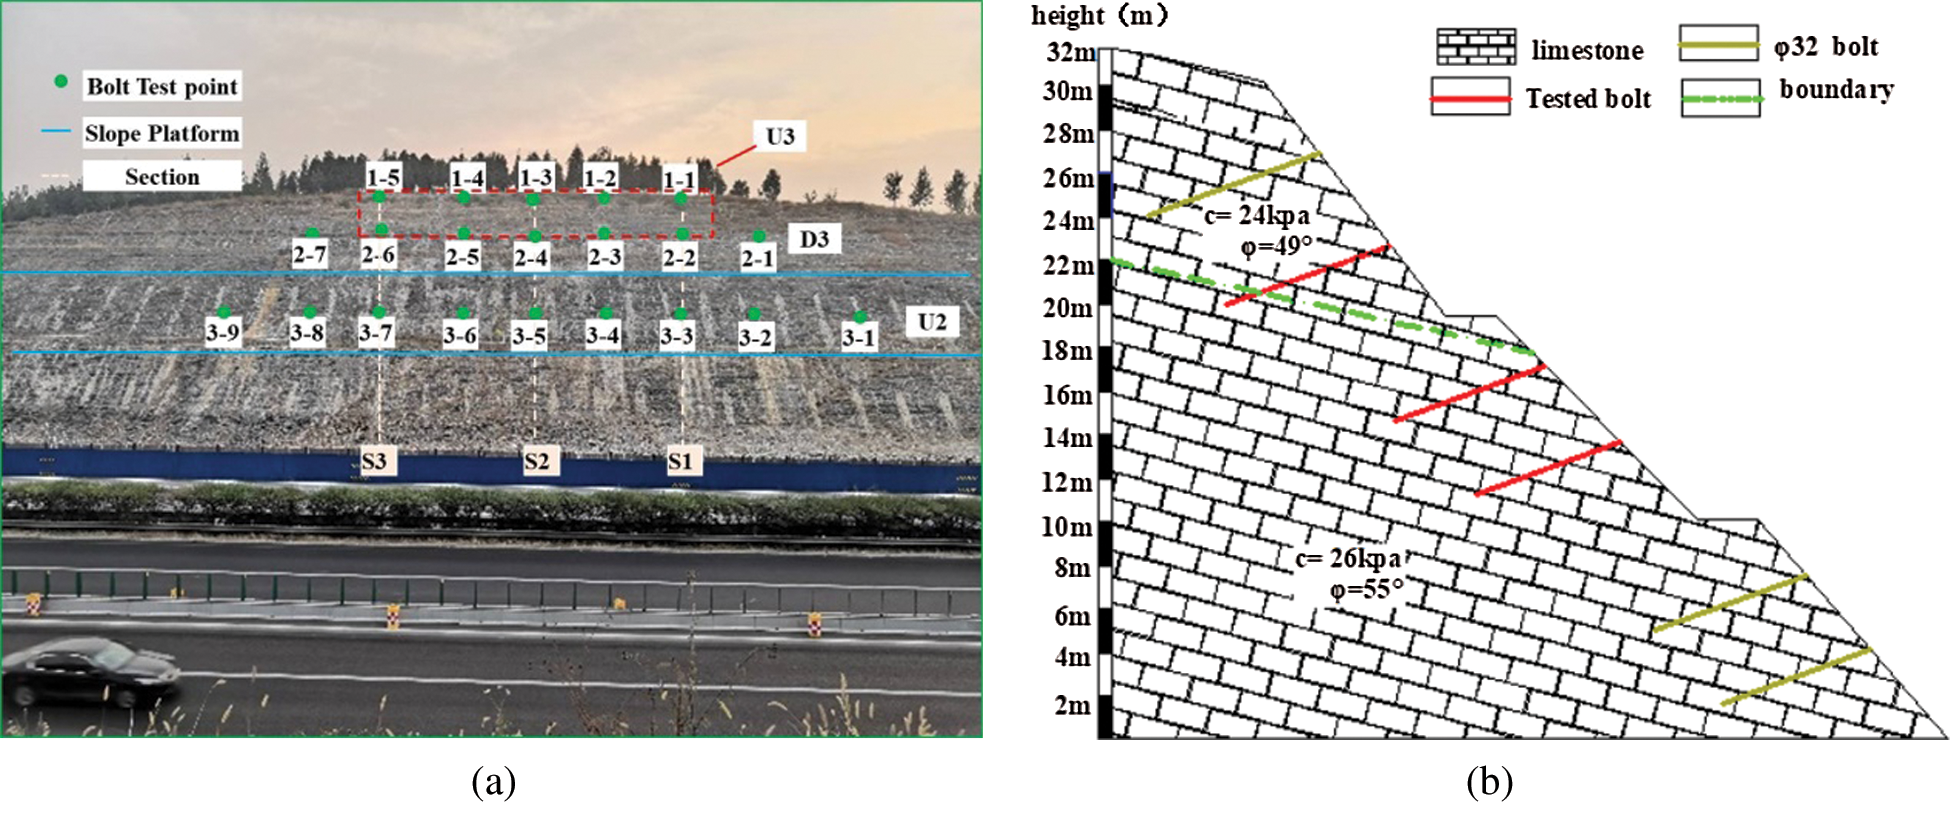
Figure 2: Testedbolt detection points and slope geological description. (a) Tested bolt detection point (b) Slope support structure and geology
Table 1: Physical and strength parameters of the bolt
The test was carried out by the method described below in items (1)–(5). The three sections were selected to detect the working load and the ultimate load of the existing bolts.
1. To ensure that the hydraulic system is connected and the oil quantity is full, the oil quantity and the hand pressure pump cylinder was checked before the pull load was applied.
2. The tested bolt was fitted into the oil cylinder. The tested bolt and the oil cylinder were fixed through the anchorage to prevent relative slippage, and the indicator was fixed at the bolt head.
3. The tested bolt was subjected to a pre-applied load to 20 kN; the load was increased in increments of 10 kN to 200 kN.
4. The displacement was read immediately after the application of each load until the load was stable, and the load-displacement (Q-S) curve was drawn.
5. We stopped applying the load when it was considered that the front-stage load of the sudden point or the mutation zone had been reached.
The curve of the increment displacement of the bolts under pull loads in different positions is shown in Figs. 4–6.
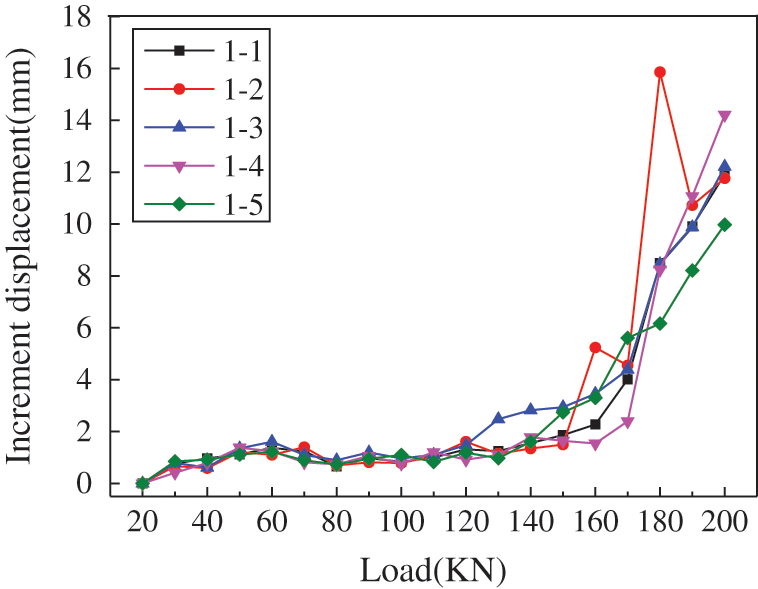
Figure 3: Load-increment displacement curve in upper row in Grade III slope (U3)
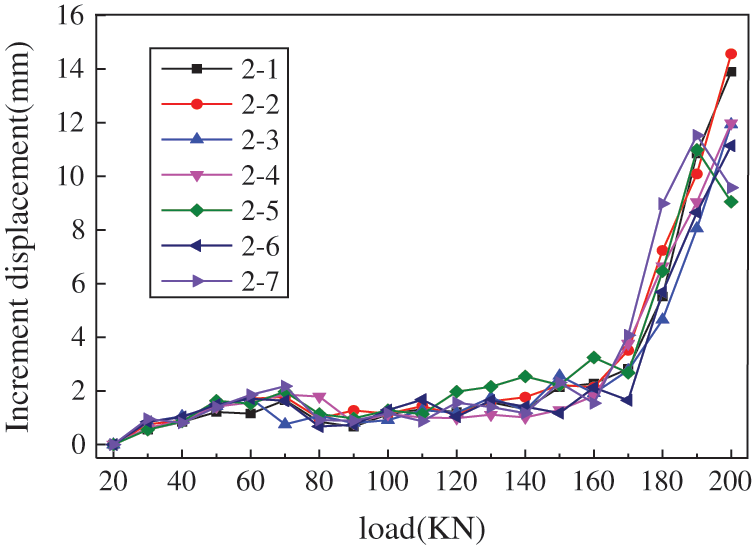
Figure 4: Load-increment displacement curve in Grade III slope (D3)
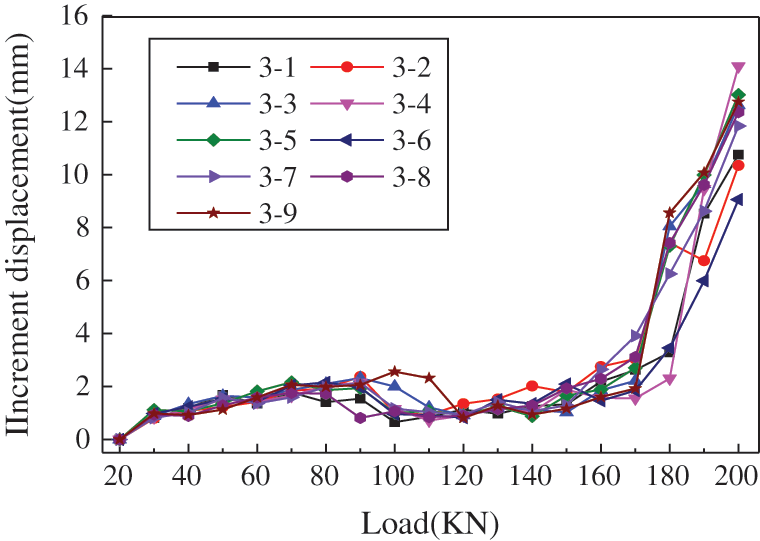
Figure 5: Load-increment displacement in U2
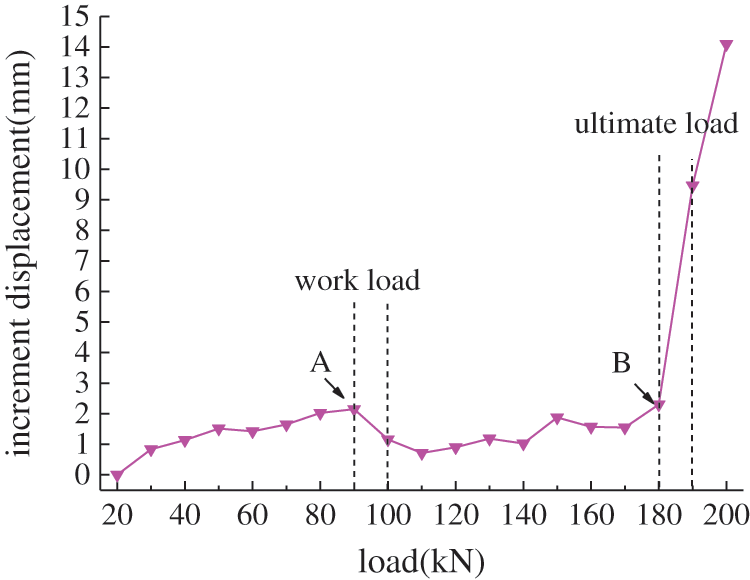
Figure 6: Load-increment displacement curve of the 3–4 bolt in the second grade slope
It can be seen from Figs. 3–5 that the curve of all tested bolts shows a nonlinear trend. When the pulling load increases to the range of 20~60 kN, the increment displacement increases and the displacement appears as bolt elastic deformation. While the applied load reaches 80 kN, the displacement increment suddenly decreases, and the load-displacement curve appears to slow down. When the applied pulling load increases from 80 kN to 160 kN, the increment displacement of bolt increases gradually. When the load applied to the bolt exceeds 160 kN, the displacement increment increases significantly. Eventually, the pulling load is increased to 200 kN, and the increment displacement under the single-stage load nearly exceeds 10 mm. At this time, the bolt and the surrounding grouting body may enter a failure state.
3.2 Work Load and Ultimate Load
In order to certain the working load and the ultimate load of each bolt, bolt (3–4), located in the second grade slope, and was selected as an example. The load-displacement increment curve of the tested bolt is shown in Fig. 7.
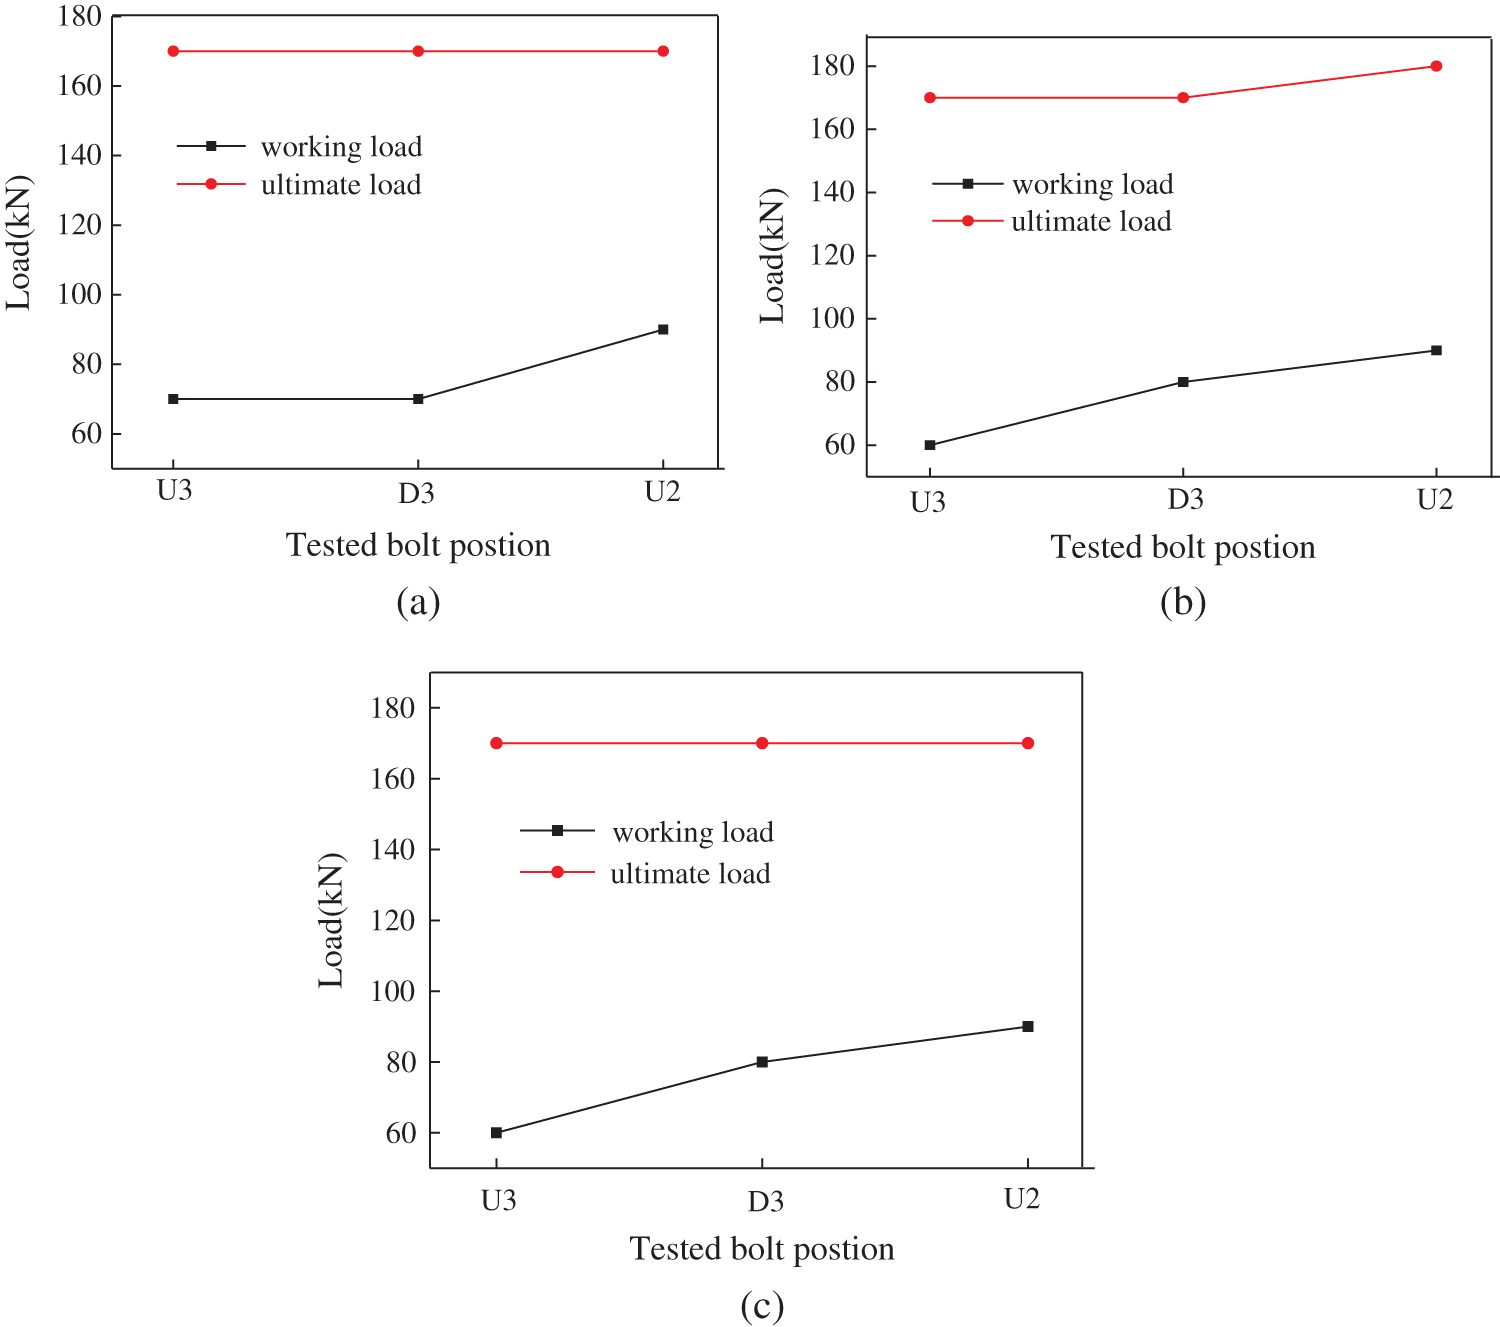
Figure 7: Typical section bolt load. (a) bolt load in Section 1; (b) bolt load in Section 2; (c) bolt load in Section 3
It can be seen from Fig. 7 that the pull load is applied from 20 kN to 90 kN. The increment displacement of the 3–4 bolt shows a trend of gradual increase and then a sudden sharp decrease at point (A) with a load of 90 kN. The displacement increment of each load in the range from 100 kN to 180 kN, and the corresponding break point (B) also appears on the load-increment displacement curveat180 kN, and the increase rate of displacement significantly decreases. It can be seen that the current working load of the 3–4 bolt ranges from 90 kN to 100 kN, and the ultimate load ranges from 180 kN to 190 kN.
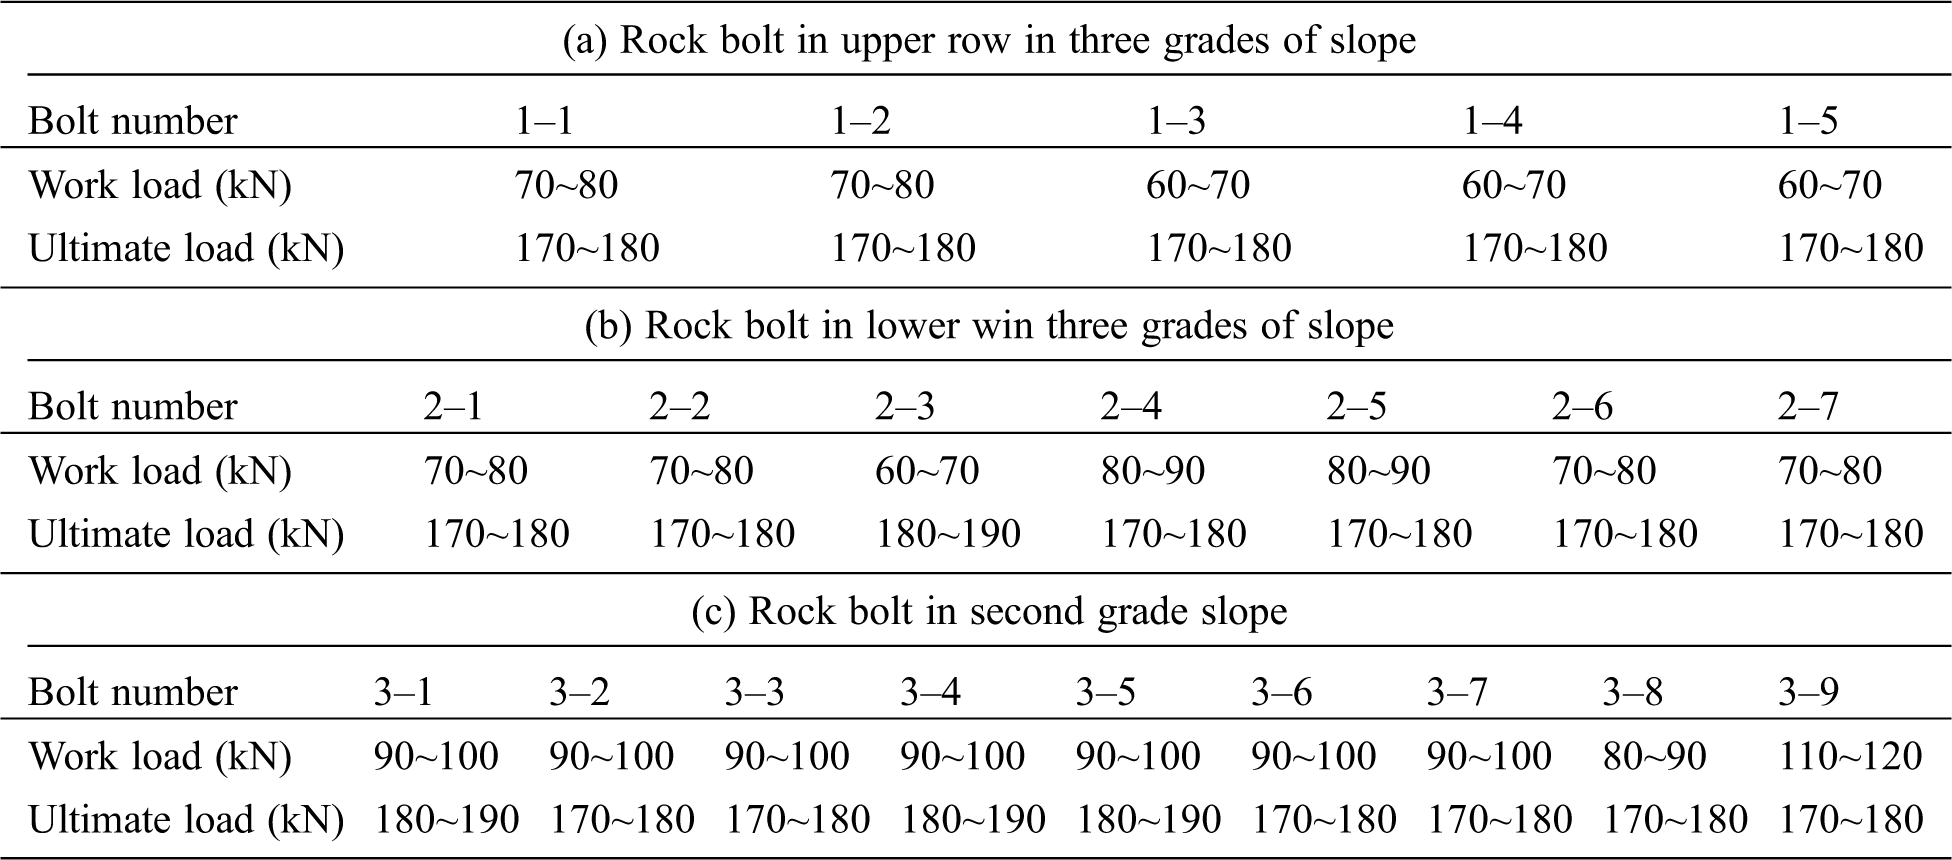
According to the method used, the ultimate load of the existing bolts ranges from 170 kN to190 kN, and the working load ranges from 60 kN to 100 kN. The working load and the ultimate load of all the bolts were obtained by this method, and the results are shown in Tab. 2.
Table 2: The working load and ultimate load of bolts in different positions
The stress loss of bolt under long-term action is β
where β is the stress loss rate,
3.3 Typical Section Bolt Load Analysis
We analyzed the bolt support effect of bolts at different positions and evaluated the influencing factors of the working load and the ultimate load of the bolts. The bolt working load and ultimate load of Sections 1 to 3 in Fig. 5a are plotted in Fig. 8. Where U3 is the upper row bolt in Grade III slope; D3 is the lower row bolt in Grade III slope; and U2 is the lower row bolt in Grade III slope.
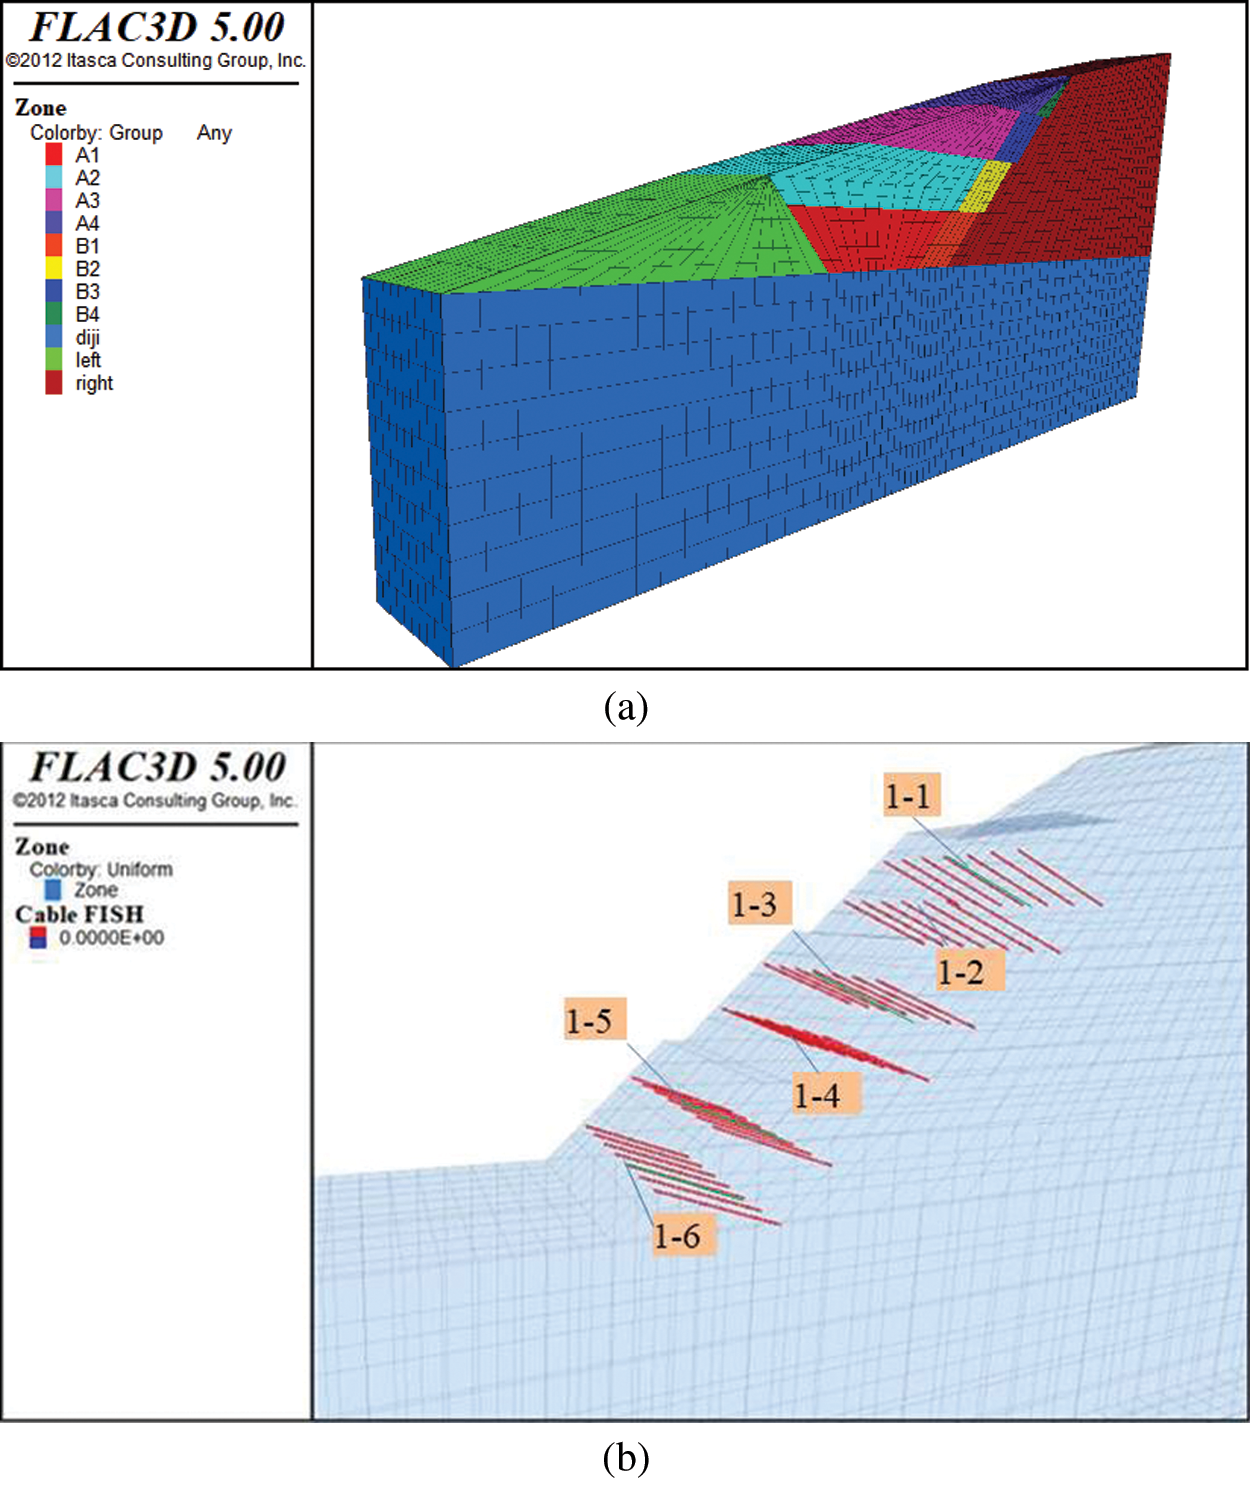
Figure 8: Slope and bolt support model in FLAC3D. (a) Slope model (b) Supported bolt model
As can be seen from Fig. 8, the working load and the ultimate load of the bolts were basically the same in the three sections of the slope. The working load of the bolts ranged from 70 kN to 90 kN in the three sections, showing that the working load depends on the residual sliding force of the unstable rock. Meanwhile, it can be seen that the secondary slope has a stronger sliding deformation trend, which may be caused by a potential sliding surface on the secondary slope. The ultimate load of the bolts was almost the same at different positions, which were all the same in the range of 170 kN. It can be seen that the ultimate load of the bolts is independent of the sliding deformation trend, and may be related only to the bolt design parameters and other factors.
4.1 FLAC3D Fundamental Principle
FLAC3D [22] is a three-dimensional numerical analysis software produced by the Itasca company. The fundamental principle of processing deformation problems is the Lagrange difference formula. The program is appropriate for large deformation geotechnical engineering problems such as rock mass excavation, and it is widely used in the geotechnical engineering field.
Rockbolt elements in FLAC3D were used to simulate the nonlinear behavior, because of their capacity for modeling the strain-softening behavior of the material between the structural element and the grid material. The shear behavior of the rockbolt–grid interface is modeled by a spring-slider system at the rockbolt nodal points. The interfacial shear behavior during the relative displacement between the structural rockbolt nodes and the grid is a function of the coupling spring shear stiffness [23].
where F denotes the sheer force that develops in the shear coupling spring,
cf is the coupling spring shear stiffness,
up refers to the axial displacement of the rockbolt,
um is the axial displacement of the medium,
and L is the contributing element length.
The maximum shear force is correlated to the cohesive strength of the interface and the frictional resistance along the interface. The maximum shear force (Fmax) per the length of the rockbolt can be calculated as follows in formula (3):
where c is the cohesive strength of the shear coupling spring,
σc is the mean effective confining stress that is normal for the rockbolt element,
θs is the friction angle of the shear coupling spring, and
where db is the diameter of the rockbolt,
τ denotes the shear stress along the rockbolt.
and hence, the shear stressτcan be computed as follows:
4.2 Establishment of the Model
The bolt model was established by FLAC3D, according to the topography and stratigraphic litho logy of the right cutting slope of K593+260~K593+555. The border size of the model has a strong impact on the precision of the results [24]. The length of the model is 200 m, the height is 200 m, and the width is 20 m. The number of elements in the slope model is 138,526. The bottom boundary of the model was constrained, while the side boundary was constrained by normal displacement. The cable unit was used to reflect the bolt in FLAC3D. Material constitutive of rock mass adopts the ideal elastic-plastic model, and the yield criterion adopts Drucker-Prager criteria. The stimulated model is shown in Fig. 8.
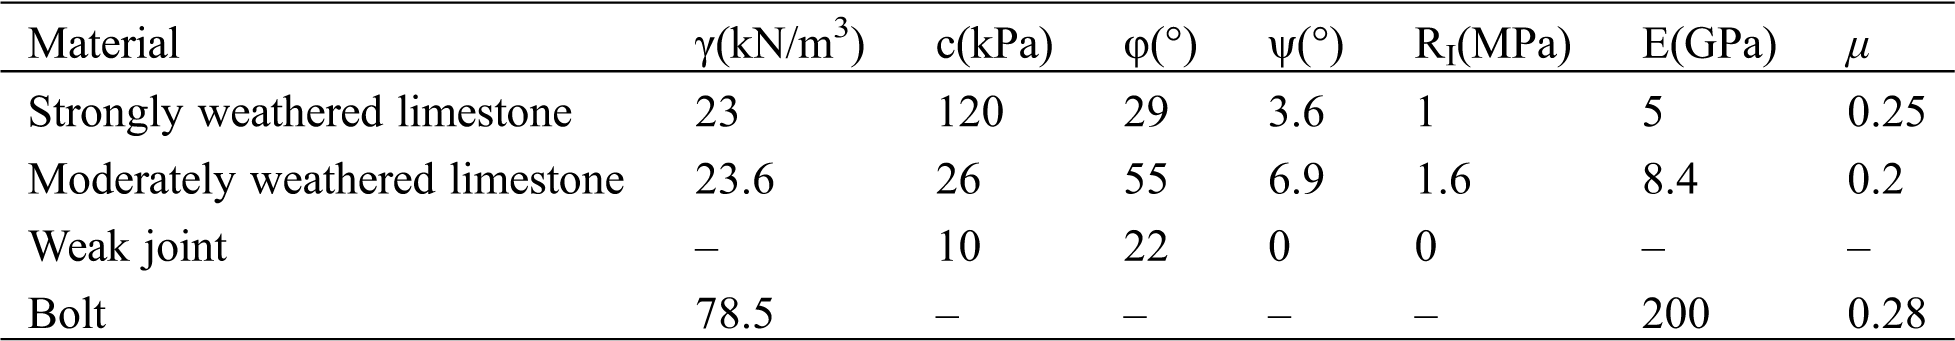
The parameters of rock and supported bolt were selected from the geological survey data and the Technical Specifications for Building Slope Engineering (GB 50330-2013). The rock and bolt parameters are shown in Tab. 3.
Table 3: Rock and bolt parameters
A row of bolts was selected in the middle of the cutting slope model for the pull-out test. The pull load was increased from 0 kN to 300 kN in increments of 10 kN.The position of the tested bolt in the slope is shown in Fig. 8b.
In the numerical model, the bolt was divided into 10 structural units. According to the measured points shown in Fig. 9a, the axial force data of all levels of the slope bolts were extracted. The stress cloud diagram and axial force distribution of the supported bolts are shown in Figs. 9b and 9c.
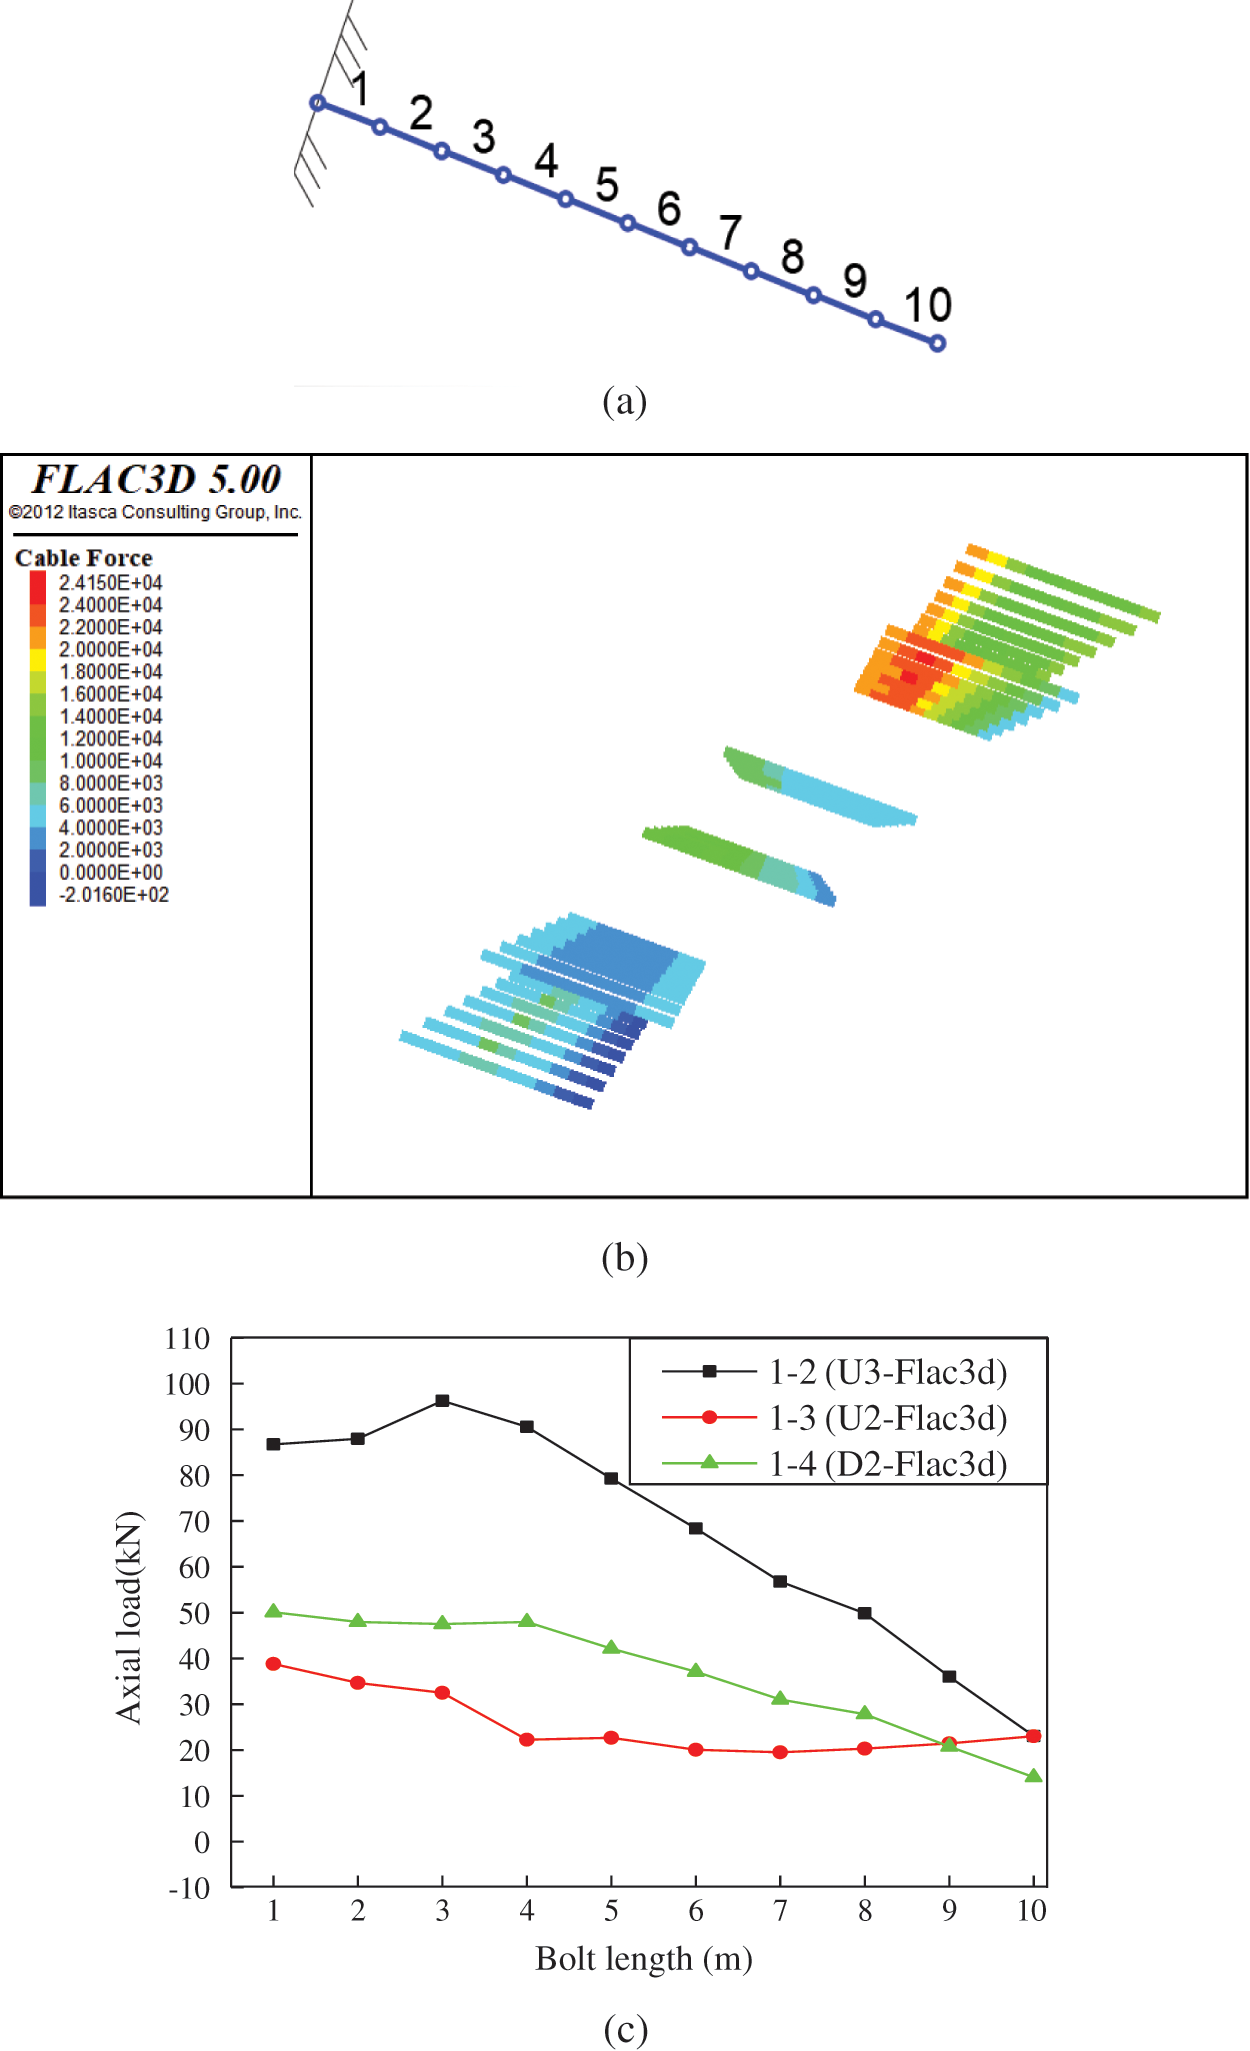
Figure 9: Axial force distribution across the bolt length. (a) Bolt structural unit, (b) Cloud diagramof bolt stress and (c) Distribution stress of Bolt axial
As can be seen from Fig. 9c, the axial force of the upper bolt is in the grade three slope. The axial force distribution of the bolt in the second grade slope is similar to that of the third grade slope, and the axial force trend changes in the area that is 3~4 m away from the bolt head.
The axial force of the upper row bolts in the slope is higher than in the lower row bolts. The maximum load is located at the head along the bolt length. The supporting load of the lower row of bolts ranged from the anchor head at 3 m. The load of the bolts on the slope as a whole is closer to that of the upper load; this means that the closer the bolt is to the top of the slope, the higher the degree of deformation of the rock mass and the more obvious the tendency of instability.
4.4 Axial Force Contrast Analysis
The load-displacement (Q-S) curve of the 1–1~1–6 bolts in the numerical model under different pull loads is shown in Fig. 10, and it is compared with the load-displacement curve of the bolts in Section 2 in the test.
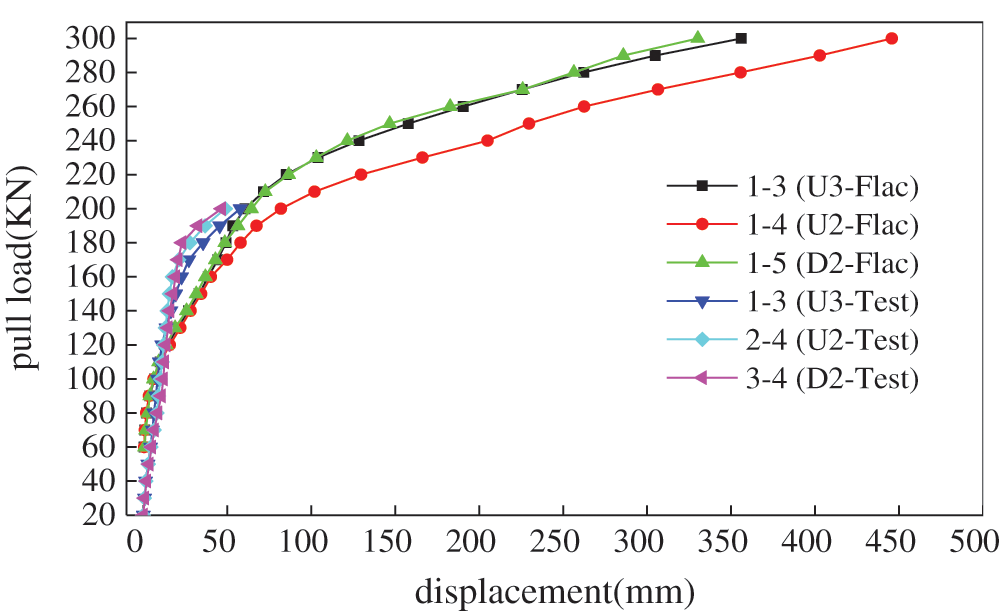
Figure 10: Load-displacement curve in contrast result
It can be seen from Fig. 10 that the load-displacement curve in the site test was the same as that of the numerical simulation. When the pull load reaches 300 kN, the displacement of the bolt exceeds 330 mm, and the maximum displacement is 488.99 mm. Therefore, in this model, it is considered that the bolt enters the yielding state when the pulling load reaches 200 kN, the bolt and the grout are extended, and compression is increased. In summary, the Q-S curve obtained by the numerical simulation shows a slowly increasing trend. The working load is determined by the first displacement bolt head, and the yield load is the curve transition from a slow to a sudden increase. The ultimate load of the bolt may be determined by the bonding strength between the grouting body and the surrounding rock.
The paper analyzed the working load and ultimate load of existing bolts using a pull-out test to study the long-term stress loss of the bolt. Based on the project, a pull-out destructive test and a numerical simulation method were used to detect the working state of the bolts. The results show that the stress loss of the bolt is 23.9~31.94% over a period of 20 years, and we draw the following conclusions.
1. The displacement of bolts at all levels under the pulling load shows a nonlinear trend. The pulling load of the bolts was applied to the working load, and the increment displacement of the bolt sharply decreases. While the applied load exceeds the working load, the displacement increment increases. Finally, the pull load reaches the ultimate load, and the displacement increment sharply increases.
2. The working load of the tested bolts ranged from 70 kN to 90 kN. It was closely related to the sliding trend of the slope, which can be determined by the bonding strength between the grouting body and the bolt.
3. The ultimate load of the tested bolts ranged from 170 kN to190 kN. It was related only to the bolt mechanical parameters and grouting body strength. The ultimate load maximum loss of the bolt is 31.94% during a period of 20 years.
4. The work load and the ultimate load were larger according to the numerical simulation, due to the time effect under the main long-term load, which the numerical simulation did not take into account.
5. The peak axial force of the tested bolts is distributed at the bolt head, and the effective anchorage length of the supported rock bolt is 3 m.
Funding Statement: This study was supported financially by The National Key Research and Development Project (2018YFC1504801), the National Nature Science Foundation of China (41272285), and the Transportation Technology Key Project of Shandong Province (JHLYDKY2).
Conflicts of Interest: The authors declare that they have no conflicts of interest to report regarding the present study.
1. Gu, X., Wang, L., Chen, F. Y., Li, H. R., Zhang, W. G. (2020). Reliability analysis of slope stability considering temporal variations of rock mass properties. Computers, Materials & Continua, 62(3), 263–281. DOI 10.32604/cmc.2020.07535. [Google Scholar] [CrossRef]
2. Liu, C. H., Li, Y. Z. (2018). Research progress in bolting mechanism and theories of fully grouted bolts in jointed rock masses. Chinese Journal of Rock Mechanics and Engineering, 37(8), 1856–1872. [Google Scholar]
3. Fu, D., Guo, H. X., Cheng, X. H., Luo, B., Rao, X. Y. (2012). Working stress measurement of prestressed anchor cables: Detection mechanism and experimental study of lift-off test. Rock and Soil Mechanics, 33(8), 2247–2252. [Google Scholar]
4. Sun, X., Wang, Z., Zheng, H., Bian, J. (2015). Non-destructive test method of rock bolt based on improved spectral kurtosis. 2015 7th International Conference on Modeling, Identification and Control, pp. 1–5. Sousse, Tunisia. [Google Scholar]
5. Frydman, S., Shaham, I. (1990). Pullout capacity of slab anchors in sand. Canadian Geotechnical Journal, 26(3), 385–400. DOI 10.1139/t89-053. [Google Scholar] [CrossRef]
6. Ito, F., Nakahara, F., Kawano, R., Kang, S. S., Obara, Y. (2001). Visualization of failure in a pull-out test of cable bolts using X-ray CT. Construction and Building Materials, 15(5–6), 263–27270. DOI 10.1016/S0950-0618(00)00075-1. [Google Scholar] [CrossRef]
7. Chen, J., Hagan, P. C., Saydam, S. (2016). Parametric study on the axial performance of a fully grouted cable bolt with a new pull-out test. International Journal of Mining Science and Technology, 26(1), 53–58. DOI 10.1016/j.ijmst.2015.11.010. [Google Scholar] [CrossRef]
8. Ren, F. F., Yang, Z. J., Chen, J. F., Chen, W. W. (2010). An analytical analysis of the full-range behaviour of grouted rockbolts based on a tri-linear bond-slip model. Construction and Building Materials, 24(3), 361–370. DOI 10.1016/j.conbuildmat.2009.08.021. [Google Scholar] [CrossRef]
9. Blanco Martín, L., Tijani, M., Hadj-Hassen, F. (2011). A new analytical solution to the mechanical behaviour of fully grouted rockbolts subjected to pull-out tests. Construction and Building Materials, 25(2), 749–755. DOI 10.1016/j.conbuildmat.2010.07.011. [Google Scholar] [CrossRef]
10. Kılıc, A., Yasar, E., Celik, A. (2002). Effect of grout properties on the pull-out load capacity of fully grouted rock bolt. Tunnelling and Underground Space Technology, 17(4), 355–362. DOI 10.1016/S0886-7798(02)00038-X. [Google Scholar] [CrossRef]
11. Srivastava, L. P., Singh, M., Singh, J. (2018). Development of large direct shear test apparatus for passive bolt reinforced mass. Indian Geotechnical Journal, 49(1), 124–131. DOI 10.1007/s40098-018-0306-6. [Google Scholar] [CrossRef]
12. Fan, J. Q., Dong, H. X., Ran, L., Kong, F. L. (2014). Analysis on the shear stress distribution of internal anchorage section of full-length injected bolt. Advanced Materials Research, 1049–1050, 474–478. DOI 10.4028/www.scientific.net/AMR.1049-1050.474. [Google Scholar] [CrossRef]
13. Han, J., Chen, Q., Liu, Y. K., Cheng, L. K. (2005). Bond strength between anchor grout and rock or soil masses. Chinese Journal of Rock Mechanics and Engineering, 24(19), 3482–3486. [Google Scholar]
14. Duan, J., Yan, Z. X., Guo, R. J., Liu, Z. Z., Ren, Z. H. (2012). Failure analysis of soil anchors induced by loose interface under pullout load. Chinese Jonrnal of Geotechnical Engineering, 34(5), 936–941. [Google Scholar]
15. He, S. M., Li, X. P. (2006). Study on mechanism of prestressed anchor bolt. Chinese Journal of Rock Mechanics and Engineering, 25(9), 1876–1880. [Google Scholar]
16. You, C. A., Zhan, Y. B., Liu, Q. Y., Sun, L. L., Wang, K. B. (2013). Shear lag-debonding model for anchorage section of prestressed anchor cable. Chinese Journal of Rock Mechanics and Engineering, 32(4), 800–806. [Google Scholar]
17. Liu, H. J., Li, H. J. (2013). Fuzzy identification method for failure of anchors based on energy principle. Chinese Journal of Geotechnical Engineering, 35(8), 1435–1441. [Google Scholar]
18. Shi, S. (2014). Research on the anchorage mechanism of bolt under the loading of pullout (Degree Thesis). Lanzhou University, Lanzhou,China. [Google Scholar]
19. Huang, M. H., Zhou, Z., Ou, J. P. (2014). Nonlinear full-range analysis of load transfer in fixed segment of tensile anchors. Chinese Journal of Rock Mechanics and Engineering, 33(11), 2190–2199. [Google Scholar]
20. Guo, Y. P., Shi, S., Yan, Z. X. (2015). Shear interaction of anchorage body and rock and soil interface under the action of uplift load. Journal of China Coal Society, 40(1), 58–64. [Google Scholar]
21. Zhou, J. F., Wang, J. X., Chen, W., Luo, B. E. (2004). Application of strength reduction FEM to soil and rock slope. Chinese Journal of Rock Mechanics and Engineering, 23(19), 3381–3388. [Google Scholar]
22. Alghamdi, N. A., Youssef, H. M. (2019). On the application of the adomian’s decomposition method to a generalized thermoelastic infinite medium with a spherical cavity in the framework three different models. Fluid Dynamics & Materials Processing, 15(5), 597–611. DOI 10.32604/fdmp.2019.05131. [Google Scholar] [CrossRef]
23. Chen, Y. M., Xu, D. P. (2008). FLAC/FLAC3D foundation and engineering examples. Beijing: China Water Conservancy and Electricity Press. [Google Scholar]
24. Wang, Z., Luo, W., Liao, R., Xie, X., Wang, H. (2019). Slug flow characteristics in inclined and vertical channels. Fluid Dynamics & Materials Processing, 15(4), 583–595. DOI 10.32604/fdmp.2019.06847. [Google Scholar] [CrossRef]
 | This work is licensed under a Creative Commons Attribution 4.0 International License, which permits unrestricted use, distribution, and reproduction in any medium, provided the original work is properly cited. |