DOI: 10.32604/fdmp.2021.013895
ARTICLE
Analysis of Bubble Behavior in a Horizontal Rectangular Channel under Subcooled Flow Boiling Conditions
School of Energy and Power Engineering, Shandong University, Jinan, 250061, China
*Corresponding Author: Shuzhan Bai. Email: baishuzhan@sdu.edu.cn
Received: 26 August 2019; Accepted: 04 August 2020
Abstract: Experiments on subcooled flow boiling have been conducted using water in a rectangular flow channel. Similar to the coolant channel in internal combustion engines (IC engines), the flow channel in this experiment was asymmetrically heated. Bubble images were captured using a high speed camera from the side view of the channel. The experimental conditions in terms of bulk temperature, bulk velocity, pressure and heat flux ranged from 65°C–75°C, 0.25 m/s–0.75 m/s, 1–1.7 bar and 490 kW/m2–700 kW/m2, respectively. On the basis of these tests, a statistical analysis of the bubble size has been conducted considering a population of 1400 samples. It has been found that the mean Sauter bubble diameter increases with the decrease of subcooling, bulk velocity, pressure and increased heat flux. A modified correlation has been finally proposed to predict the mean Sauter bubble diameter under subcooled flow boiling conditions upstream of the onset of significant void, which shows good accuracy with the experimental results.
Keywords: Subcooled flow boiling; horizontal rectangular channel; mean Sauter bubble diameter
Nomenclature
Latin symbols
| a | minimum diameter of bubble, mm |
| b | maximum diameter of bubble, mm |
| Cp | liquid specific heat, J/kg K |
| Ds | mean Sauter bubble diameter, mm |
| g | gravitational acceleration, m/s2 |
| G | mass flow rate, kg/m2 s |
| H | Distance between thermocouples to heated surface, mm |
| hfg | latent heat, J/kg |
| k | thermal conductivity, W/m2k |
| q | heat flux, kW/m2 |
| T | temperature, °C |
| Am | mean bubble surface area, mm2 |
| Vm | average bubble volume, mm3 |
| Bo | boiling number = q/Ghfg |
| Ja | Jakob number based on liquid subcooling = ρtCp( Ts − Tl)/ρghfg |
| Re | Reynolds number |
Greek symbols
| σ | surface tension, N/m |
| ρ | density, kg/m3 |
| Δρ | density difference, ρl-ρg, kg/m3 |
Subscripts
| l | liquid |
| g | vapor |
| s | saturation |
Subcooled flow boiling has attracted drastic attention since its advantage of high heat transfer capacity with low temperature difference [1–3]. It is effective and economic when applied in nuclear industry, electric electronic chips and internal combustion engines. The required heat flux for the thermal management of internal combustion engines is usually quite high and sometimes the space for heat exchange is limited. However, even with massive industry adoption and scientific research, the published mechanisms of subcooled flow boiling are still yet to be unified.
Multiple factors have been found to affect the subcooled flow boiling heat transfer. For instance, operation conditions (i.e., degree of subcooling, bulk flow velocity and pressure) [4], bulk [5] and heating surface material [6], heating surface roughness [6,7], channel dimension [8] and inclination [9] and so on [10–12]. Nevertheless, some of these factors may affect the heat transfer at the same time, which makes it more complicating to study the process. Essentially, the subcooled flow boiling heat transfer is a process of phase change with massive generated bubbles. In another word, bubble behavior is the core of the whole process. It is commonly accepted that the whole bubble period includes nucleation, growth, lift off and collapse. With the nucleation site activated, small bubble generates and keeps growing as neighboring bulk is evaporated until its lift off. Condensation already begins when the bubble starts departing from the heating surface, and continues till the bubble disappears in the bulk flow. Therefore, it is of crucial significance to study the bubble behavior for understanding the whole process. Among the studied parameters of bubble dynamics, vapor bubble size, attends much attention due to its frequent application in CFD prediction of near-wall boiling heat transfer, as briefly reviewed as follows:
i) Bubble departure diameter is the diameter when bubble leaves its nucleation site. And this diameter is considered as the most important parameter and widely adopted in CFD simulations for calculation of evaporation heat flux in subcooled flow boiling conditions [13,14]. Massive models for predicting bubble departure diameter can be found in [15–19].
ii) Bubble lift-off diameter defines the diameter when bubble detaches from the heated surface. And this diameter equals to bubble departure diameter when bubble detaches from its nucleation site without sliding. It is pointed out that the bubble lift-off diameter should be more appropriate for predicting the heat transfer process considering the effect of bubble sliding [20–22]. Successful application of bubble lift-off diameter can be found in the work of Yun et al. [23].
iii) Maximum bubble diameter is considered as the upper limit the bubble can reach. Ünal [24] claimed this characteristic diameter is closely related to heat transfer rate and proposed a model to predict it, which was applied in the CFD prediction for subcooled flow boiling and a good agreement was obtained [25]. And furthermore correlations for prediction this diameter can be seen in Prodanovic et al. [17,26,27].
iv) The mean Sauter bubble diameter is defined to calculate the interfacial area concentration in two-fluid models in determining the interfacial momentum and heat transport. Zeitoun et al. [28] proposed a non-dimensional correlation to predict this diameter and successful implementation of this model can be found in Yeoh et al. [29,30] by replacing the mean bubble diameter in RELAP5/MOD2 with it.
However, the correlation for predicting mean sauter bubble diameter by Zeitoun et al. [28] was proposed for both regions of upstream and downstream onset of significant void (OSV). However, the void fraction increases significantly after the OSV point, the bubble dimeter tends to increase at a higher rate in this region compared to that in highly subcooled region. Considering the subcooled flow boiling in IC engines, the boiling is in the region upstream of OSV. Therefore, it is necessary to build a mean sauter bubble diameter correlation just for this region.
Besides the differences among experiment layouts and operating conditions, visualization process method might still lead to different conclusions. Generally, bubble pictures are taken from the side view, top view or both. Yoo et al. [31] conducted an experiment in which pictures were taken from both side and top views at same temporal moment, and it was found that bubble pictures captured from top view were less deformed compared to side view. Consequently, this would lead to inaccuracy in measured bubble size. Moreover, various methods were proposed to calculate equivalent bubble diameter based on different assumptions of bubble geometry [32–36]. However, appropriate equations should be chosen to match the captured bubble shape in order to avoid experimental inaccuracies [37].
In this paper, a visualization experiment was conducted for flow boiling in a horizontal rectangular channel. Bubbles on heating surface were captured from the side view. The experimental range for bulk temperature, bulk velocity and pressure were 65°C–75°C, 0.25 m/s–0.75 m/s and 1–1.7 bar, respectively. Statistical analysis was conducted on these conditions and the effect of operation parameters on bubble behavior was investigated. And a modified correlation for predicting mean Sauter bubble diameter in the region upstream of OSV was proposed.
An experiment system was built to investigate the bubble distribution on heating surface of subcooled flow boiling. This system consists of two parts: Flow circulating section which was designed for accomplishing various subcooled boiling conditions and imaging sub-system to obtain photos of bubbles, as shown in Fig. 1.
The closed flow circulating system consists of storage tank, pump, flowmeter, heating apparatus and rectangular test section. The storage tank was designed with the capacity of 250 L for keeping the bulk temperature stable and four immersion heaters with total maximum power of 8 kW are installed on the bottom of it. Water was used as the working fluid. A PID controller, receiving temperature signal from inlet temperature sensor, was adapted to control the heaters so as to achieve and maintain certain bulk temperature. Likewise, a solenoid valve connected to high pressure nitrogen was mounted on the top of the storage tank to adjust the pressure in the loop by a PID controller.
The details of flow boiling test section can be seen in Fig. 2. The horizontal rectangular test section, of 300 mm length and with 38 × 48 mm cross section dimension, lied on 2000 mm downstream of a stainless steel rectangular tube, which was to ensure the flow in test section was fully developed. Three transparent pieces of silica glasses were mounted on the front, top and back surfaces of the test section, which was designed to obtain clear images of bubbles. The test section was welded to the stainless rectangular tube. The copper test specimen had the dimensions of 90 × 10 mm and was placed at 110 mm downstream of the bottom of the test section inlet. The test specimen was heated by ten heating rods mounted at the bottom which can supply maximum 4 kW power. Seven 1.0 mm diameter K-type thermocouples were arranged along the vertical direction of the test specimen in two rows, where three thermocouples were in the upper row and the other four were in the lower row. The distance between the upper row and the test section surface is 3 mm and the distance between upper and lower row is 5 mm. The details of thermocouple location can be seen in Fig. 3. PTFE (Poly tetra fluoro ethylene) and high temperature resistant glue were used to seal the space between test section and test specimen and to minimize heat losses. Thus most of the heat can only be transferred in vertical direction from the bottom part of test specimen to the top surface without thermal diffusion.
Images were taken by a NAC Memrecam HX-6E high speed camera whose maximum frames per second (fps) can reach to 210,000. In this experiment, images were taken at 5,000 fps with resolution of 1280 × 720 pixels. A stainless steel ruler was used to calibrate the length scale in this paper. The calibrated length is 0.013 mm per pixel and the maximum uncertainty of length measurement is 2 pixels. The high speed camera was placed in parallel to the test specimen surface and was located 40 mm downstream from the beginning of test specimen. A 500 W halogen lamp was fitted on the top of the test section for illuminating the test specimen surface when nucleate boiling took place.
And all the thermodynamic properties of fluid concerned in this paper were estimated by equations presented in popiel et al. [38].
Before the formal testing, the bulk fluid was heated to around its boiling point (95°C) for several hours to remove the dissolved gas in the fluid. And subcooled boiling heat transfer experiment was continuously running for around 40 h before generating any experimental data in order to minimize the ageing effect [6]. The detailed experimental conditions are shown in Tab. 1. The inlet temperature was set to a relative low range since bubble density should increase as subcooling decreases, which would make the bubble imaging process more difficult. Three levels of temperature, bulk velocity and pressure were employed to investigate their effects on bubble behavior. In each condition, the copper surface was heated from low heat flux to high heat flux at several discrete values. And the bubble images were taken under steady state condition. Heat flux  and surface temperature Tw are calculated as follows:


where T1 and T2 are the average temperature of upper and lower thermocouple rows, H1 (3 mm) and H2 (5 mm) are the distance from the heated surface to upper and lower thermocouple rows, respectively, as shown in Fig. 4.
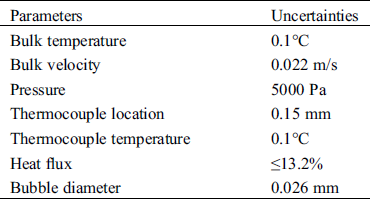
2.3 Experimental Uncertainties
The experimental errors of variables were mainly caused by the accuracy of sensors, manufacturing tolerances, the layout of thermocouples and related functions to calculate indirect variables. Before the experiment, all the thermocouples and correspondent data acquisition system were calibrated between ice and saturation temperature of water. The inlet temperature was measured by a Pt100 temperature sensor and the system pressure was measured with strain-gauge sensors having a range from 0–10 bar. The detailed measured errors for all related variables are listed in Tab. 2. For uncertainties of other indirect measurements such as heat flux, error propagation Eq. (1) was adopted for the calculation. The calculated uncertainty of heat flux is listed in Tab. 2 as well.

where  ,
, …
… are direct measured values and
  ,
, …
… are the uncertainties of these variables.
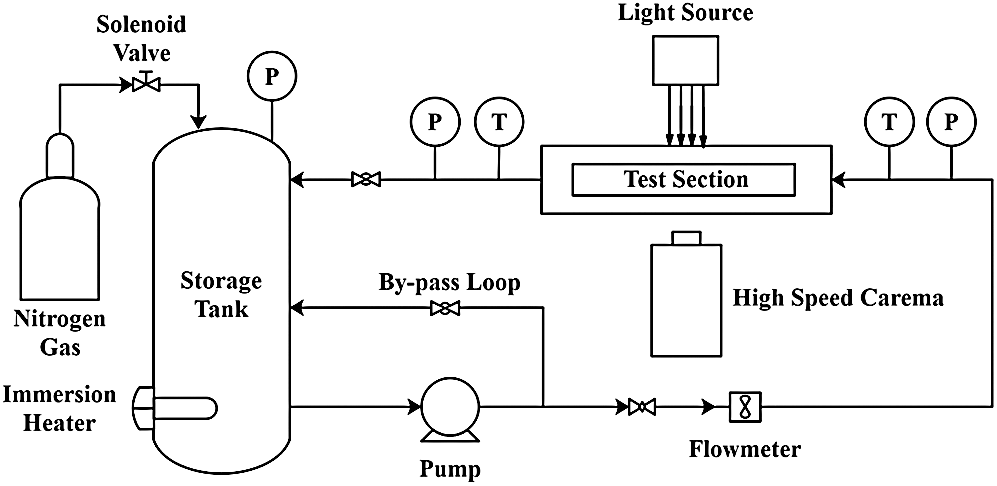
Figure 1: Schematic of boiling system
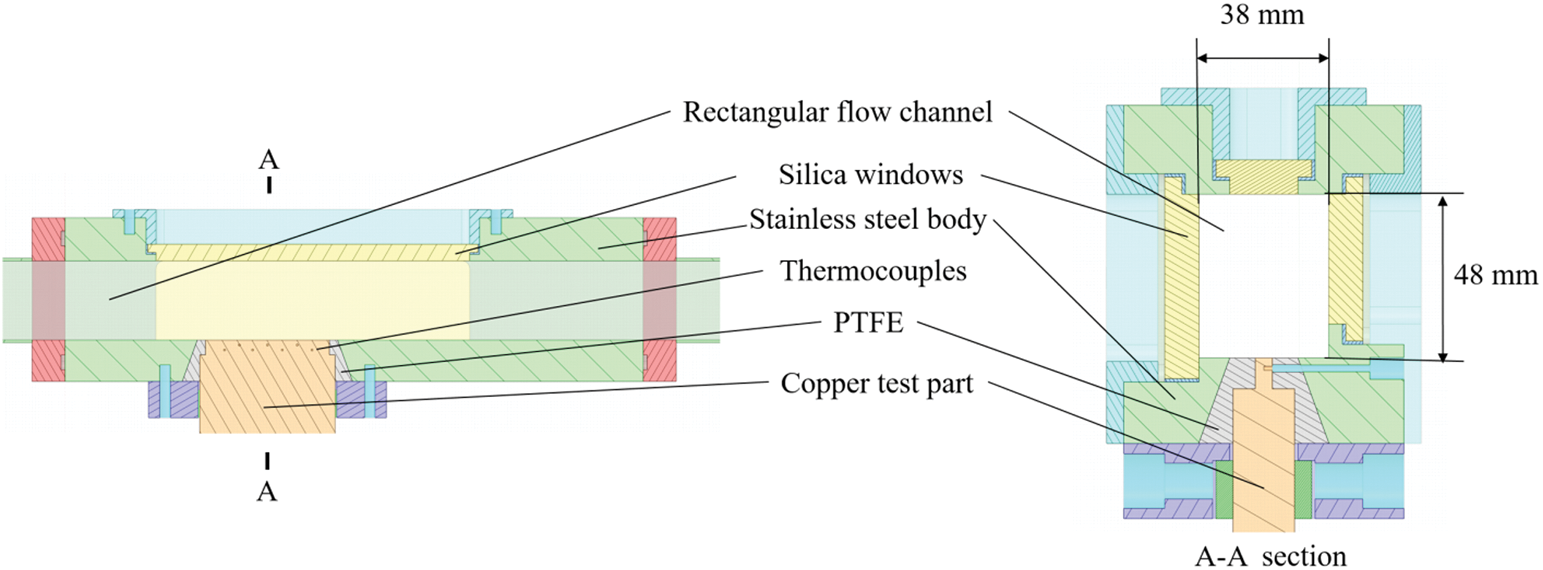
Figure 2: Details of test section
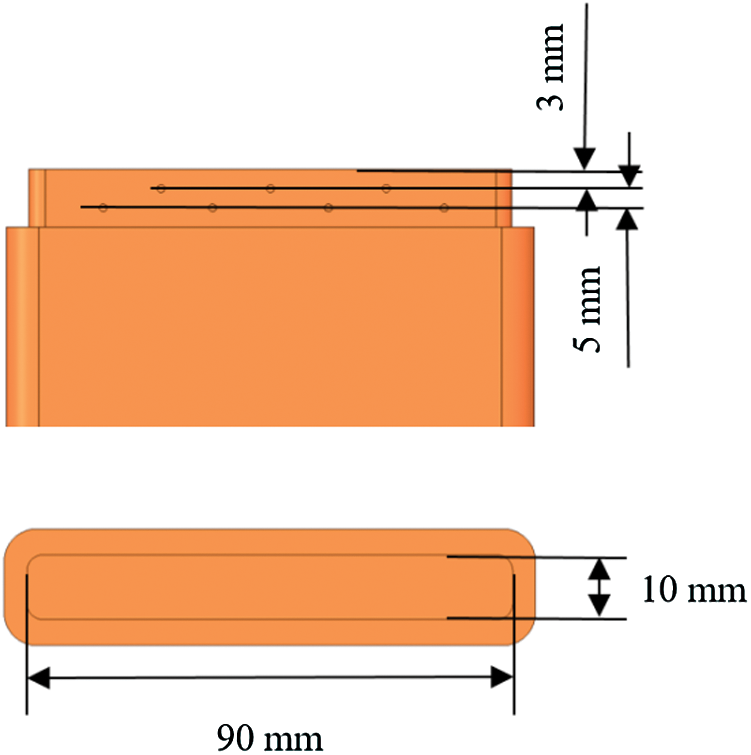
Figure 3: Location of thermocouples and dimension of copper heating surface
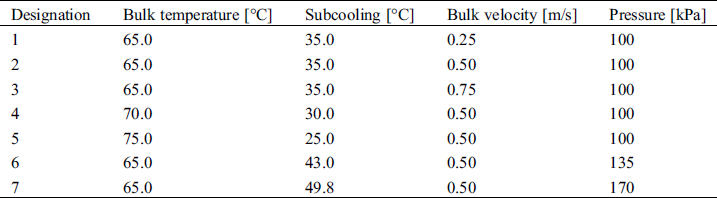
Table 2: Experiment uncertainties
3 Methodology of Data Analysis
3.1 Mean Sauter Bubble Diameter
The cross-sectional area of bubble from side was assumed to be an ellipse [17], as shown in Fig. 4. The major axis and minor axis, which are the maximum diameter of the bubble and that perpendicular to the maximum diameter, can be measured from image process software. The volume and surface area of each bubble were calculated by rotating the ellipse cross section around the maximum diameter. The average bubble surface area Vm and surface area Am were calculated as follows:


where n is the number of bubbles measured. The mean Sauter bubble diameter was defined by:

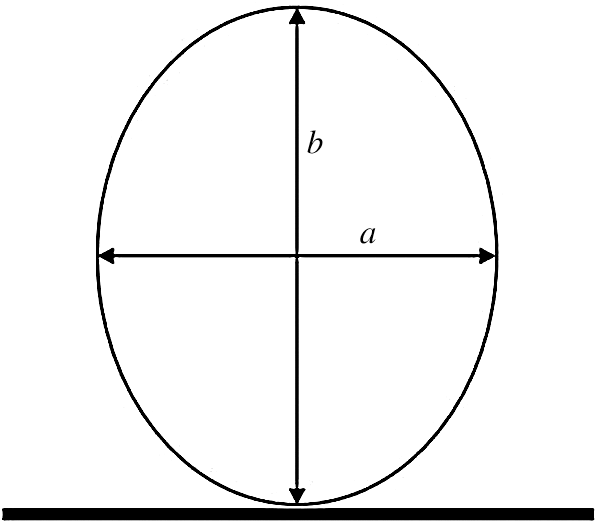
Figure 4: Drawing of a single bubble
The ImageJ and MATLAB software were used to process the bubble images. Fig. 5a presents the original image, and the image was converted to gray, as shown in Fig. 5b. Then the brightness/contrast of the image was adjusted and proper filters were applied to the image, as can be seen in Fig. 5c, and the image was transferred into binary image, as shown in Fig. 5d. An algorithm was implemented to seek the appropriate bubble pattern according to the two shiny areas distance and shape, and the result was illustrated in Fig. 5e. Then the dimensions of the bubbles can be obtained after outlined by software as shown in Fig. 5f. Note that the images were captured from the side view, and the overlapping bubbles are inevitable especially in high heat flux or low velocity conditions. So manual correction is needed to remove the mistakenly identified bubbles.
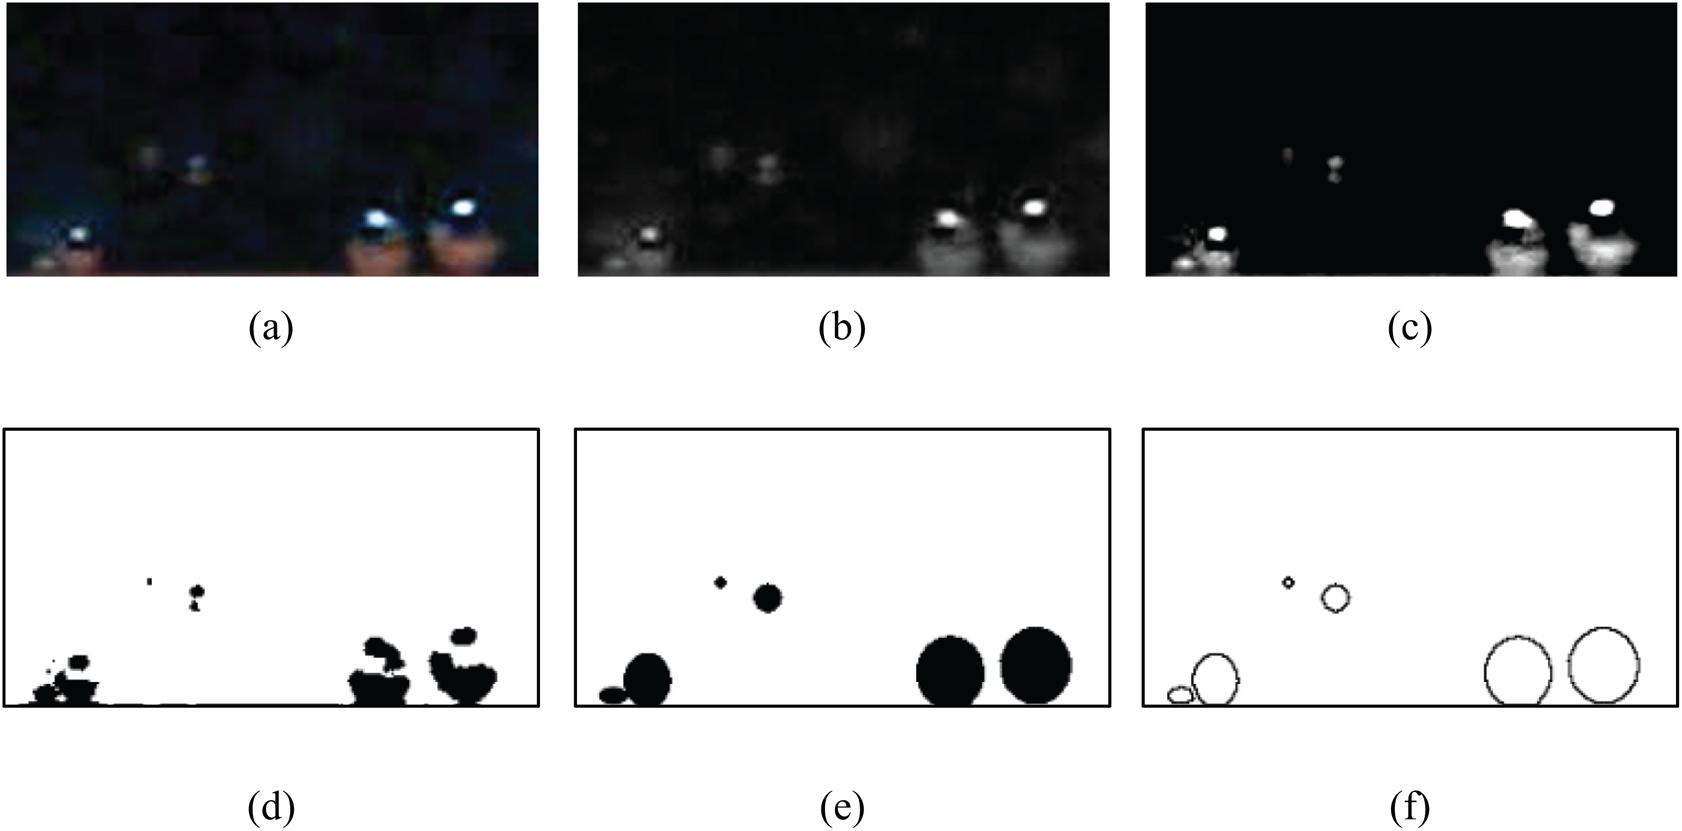
Figure 5: Image processing: (a) Original image, (b) Conversion of RGB to gray, (c) Adjust brightness/contrast and reduce background noise, (d) Binary image, (e) Bubble identification, (f) Outline bubbles
3.2 Sample Size of Statistical Analysis
The size of bubble on the heating surface under a certain experiment condition is different from place to place. As a result, appropriate sample size should be chosen to estimate the bubble size distribution and mean bubble diameter without either decreased accuracy caused by smaller sample size or increased processing cost brought by larger sample size. In this paper, experimental condition (bulk temperature = 75°C, bulk velocity = 0.5 m/s, pressure = 1 bar, heat flux = 688.5 kW/m2) was chosen to estimate the bubble sample size since it has the largest range of bubble size distribution. Then this sample size was adopted in all experiments to conduct statistical analysis.
In the work of Zeitoun et al. [28], a total of 350 bubbles on heating surface were analyzed at each axial location. Paz et al. [39] adopted around 1000–2000 sample size on analyzing bubble distribution on heating surface. In this work, relative deviation ε was defined to present the influence of bubble sample size on the variation of mean diameter.

where  is the mean bubble diameter when sample size is n, and μ is the value considered as truth value of mean bubble diameter.
The mean bubble diameter of sample size 2000 was used as truth value in the present work. Sample size n begins from 200 with a 200 interval till 1800. Note that the interval of two chosen frames was increased to 2 milliseconds or 10 frames so as to guarantee the statistical relevance of the mean value. The result is shown in Fig. 6. It can be seen that, when the sample size was small, the relative deviation was quite high. As the sample size increased, the mean diameter reached to convergence at the quantity of sample size 2000. Fig. 6 also shows, when the sample size exceeded 1400, relative deviation varies only ± 2%. As a result, the sample size for obtaining the mean diameter in this study was set to 1400 for all experiment conditions.
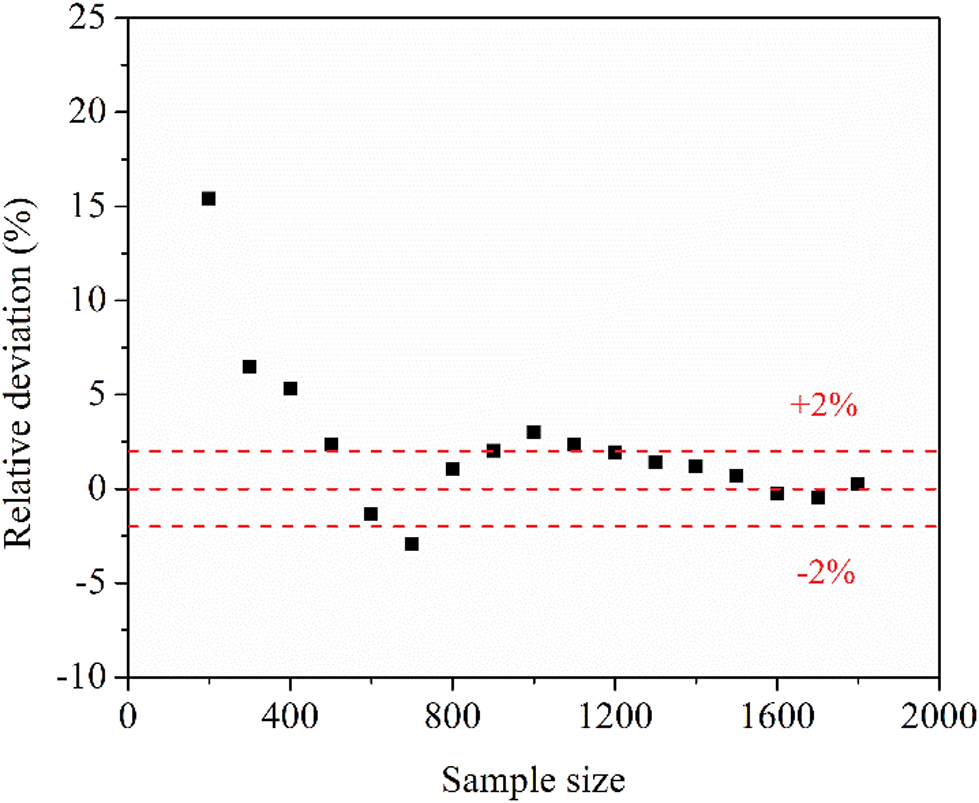
Figure 6: Relative deviation of mean bubble diameter varies with sample size (bulk temperature = 75°C, bulk velocity = 0.5 m/s, pressure = 1 bar, heat flux = 688.5 kW/m2)
4.1 The Effect of the Degree of Subcooling on Mean Bubble Diameter
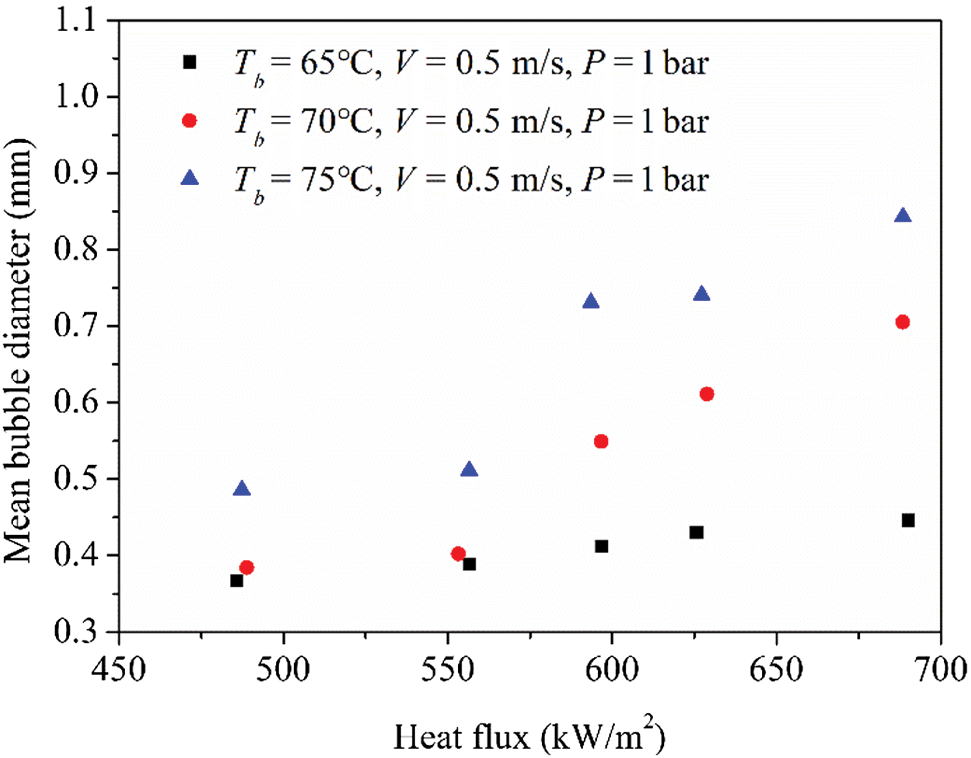
Figure 7: Effect of subcooling on mean bubble diameter at constant bulk velocity and pressure
Fig. 7 shows the relationship between heat flux and mean bubble diameter under different subcooling conditions. It clearly presents that the mean bubble diameter increased with the decrease of subcooling at the same heat flux. The effect of subcooling on mean bubble diameter was in consistency with former published data [40,41]. Resulting from decreased subcooling at fixed mass flow rate and heat flux, the temperature gradients in the liquid surrounding a bubble the bubble would be lower. Thus the condensation rate would be reduced, and a bubble tends to grow larger.
4.2 The Effect of Bulk Velocity on Mean Bubble Diameter
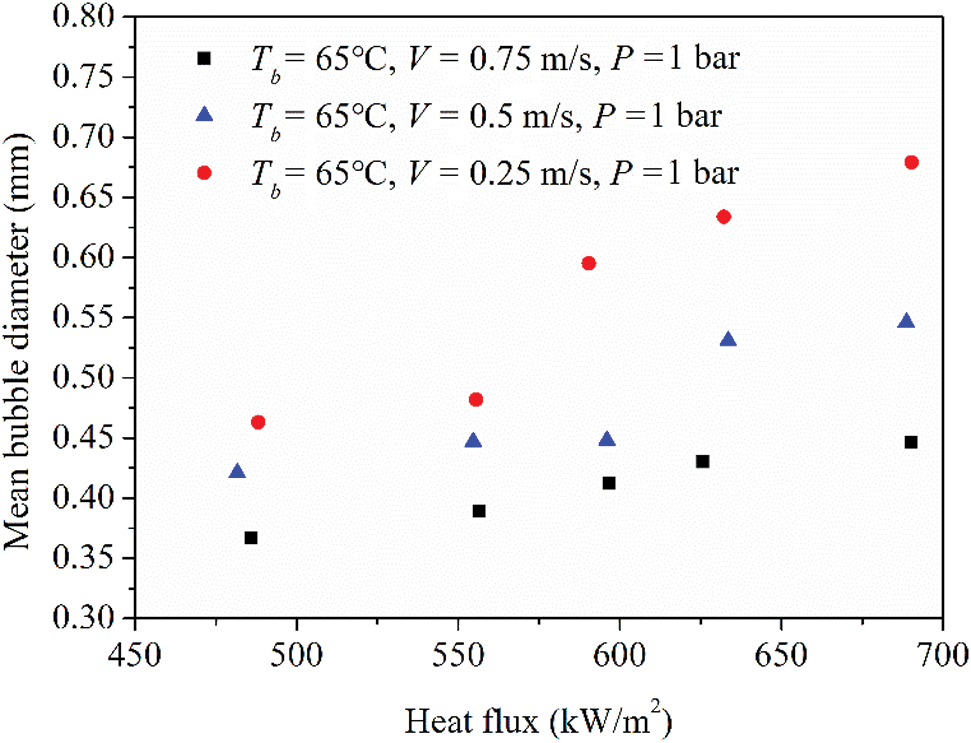
Figure 8: Effect of bulk velocity on mean bubble diameter at constant subcooling and pressure
The influence of fluid velocity on mean bubble diameter is presented in Fig. 8. The experimental velocity ranged from 0.25 m/s to 0.75 m/s and the subcooling and pressure were kept at 65°C and 1 bar, respectively. The effect of bulk velocity on bubble mean diameter can be explained by both force balance approach and energy balance approach. As the bulk velocity increases, the quasi-steady drag force increases, which forces bubbles to depart from heated surface earlier compared to low bulk velocity conditions. As a result, the bubble size would be smaller resulting from shorter bubble growth time. From the view of energy analysis, higher bulk velocity would strength the convection heat transfer rate and take away more heat from heating wall. Therefore, the wall temperature will decrease and the bubble growth rate would be suppressed.
However, the effect of bulk velocity on bubble mean diameter seems to be reversed in high and low subcooling Jakob number region. As pointed by Zeitoun et al. [28], in the high Jakob number region, increasing the bulk velocity would decrease the bubble size. As the subcooling decreases, the above trend is reversed, which means increased bulk velocity would increase the bubble size. This is because in low subcooling region, where the bubble density is high, increased bulk velocity would enhance the bubble coalescence. As in this paper, the experiment was conducted in high subcooling region, the effect of bulk velocity on bubble mean diameter is consistent.
4.3 The Effect of Pressure on Mean Bubble Diameter
Fig. 9 presents the effect of pressure on mean bubble diameter under constant subcooling and bulk velocity conditions, which were kept at 65°C and 0.5 m/s, respectively. As can be seen in the graph, the mean bubble diameter decreased with the increase of pressure. Same tendency can be seen in [40,41]. As the pressure increases, the vapor density would increase. Therefore, the latent heat per unit volume vapor linearly rises with the pressure. Accordingly, the bubble growth requires more energy and is limited at higher pressure. As a result, the bubble growth rate decreases in high pressure conditions and the increased pressure would decrease mean bubble diameter.
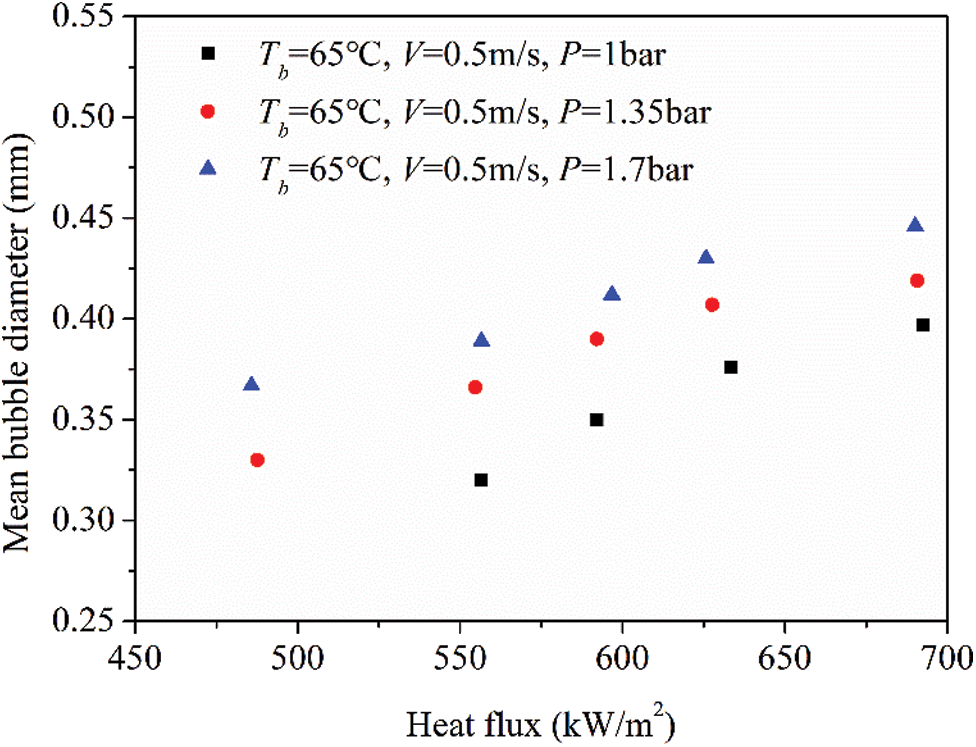
Figure 9: Effect of pressure on mean bubble diameter at constant subcooling and bulk velocity
4.4 The Effect of Heat Flux on Mean Bubble Diameter
As it can be seen from Figs. 7–9, the mean bubble diameter increases with the increase of heat flux at constant subcooling, bulk velocity and system pressure. From the view of force balance analysis, increasing heat flux tends to increase bubble size since the driving force of the bubble formation is increased during the bubble growth process, such as the wall superheat. According to energy balance analysis, an increased thermal boundary layer resulting from the enhanced surface temperature would allow bubbles to grow further.
4.5 Mean Bubble Diameter Correlation
Zeitoun et al. [28] proposed a correlation based on experiment data from a vertical annular channel to predict mean Sauter bubble diameter under subcooling conditions. Dimensionless parameters, such as Re, Ja and Bo, were adopted to reflect the effects of subcooling, bulk velocity, pressure and heat flux.

In this paper, a comparison between experimental mean bubble diameter and predicted mean bubble diameter by Eq. (8) is presented in Fig. 10. And it shows that the proposed equation over predicts the mean bubble diameter. According to the experimental apparatus of Zeitoun et al. [28], the subcooling of flow liquid decreased along the heating rod, which means the proposed equation covers both regions upstream and downstream of OSV. However, in this paper, only the region upstream was considered since in the cooling passages of IC engines subcooled flow boiling is nearly in this region. As in downstream of OSV, where subcooling is in a low level, the bubble coalescence is intensified and condensation rate is decreased. Consequently, bubble growth rate in the region downstream of OSV is higher than the region upstream of OSV.
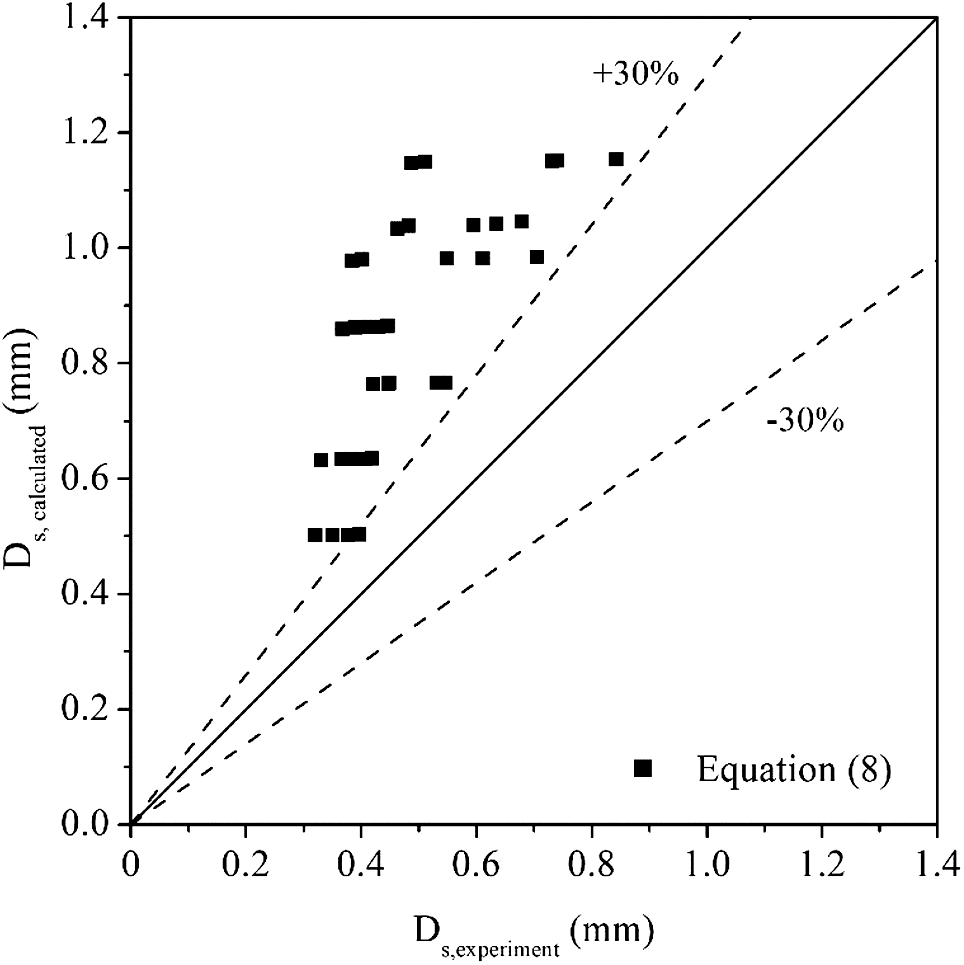
Figure 10: Comparison of experiment mean bubble diameter and predicted mean bubble diameter by Eq. (8)
Although large deviation existed when applying Eq. (8) for predicting the mean bubble diameter in Fig. 10, the equation shows a good trend to cover the data. As a result, a similar form of Eq. (8) was adopted to correlate the experimental data in this paper. And the revised equation is shown as Eq. (9). The comparison between the revised equation and the experiment data can be seen in Fig. 11. The result shows that the deviation between predicted data and experimental data is within ±30%, which means the modified equation can be used to predict the mean bubble diameter in subcooled flow conditions upstream of onset of significant void.
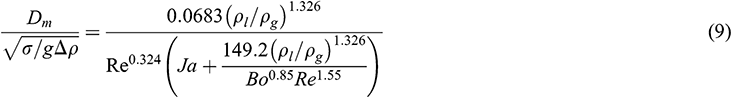
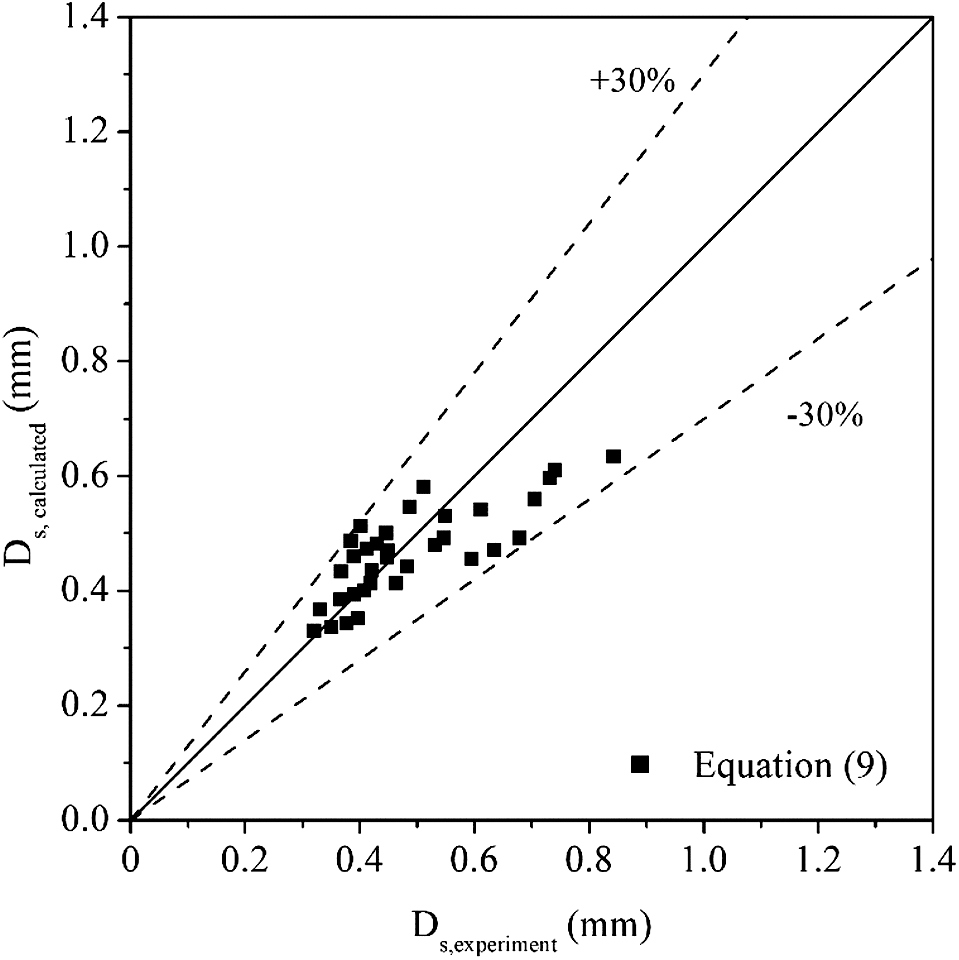
Figure 11: Comparison of experiment mean bubble diameter and predicted mean bubble diameter by Eq. (9)
In this paper, visualization experiments were conducted in horizontal rectangular channel under subcooled flow conditions. The heating surface was located at the bottom of the channel and bubble images on that surface were taken from the side view. The experimental conditions of bulk temperature, bulk velocity and pressure were 65°C to 75°C, 0.25 m/s to 0.75 m/s and 1 bar to 1.7 bar, respectively. The effects of subcooling, bulk velocity, pressure and heat flux on the mean Sauter bubble diameter was investigated. And it was found that decreased subcooling, bulk velocity, pressure and increased heat flux would increase the mean bubble diameter. Over-prediction had been found comparing experimental data in this paper and former proposed equation by Zeitoun et al. [28] for predicting the mean bubble diameter. The main reason is the equation was proposed for both regions upstream and downstream of OSV, while in this paper experimental conations were kept in high subcooled region. As bubble coalescence is intensified downstream of the OSV point, the bubble size tends to grow further, which leads to higher bubble mean diameter. Finally, a modified correlation for predicting the mean bubble diameter under subcooled flow boiling conditions before OSV point was proposed and proved to agree well with the experimental data.
Funding Statement: This work was supported by the National Natural Science Foundation of China (Grant No. 51576116) and the National Natural Science Foundation of Shandong Province (Grant No. ZR2019MEE041). And the authors would also acknowledge financial support from China Scholarship Council.
Conflicts of Interest: The authors declare that they have no conflicts of interest to report regarding the present study.
1. Zangeneh, A., Peyghambarzadeh, S. M., Bayat, A., Vatani, A. (2020). Application of general multilevel factorial design approach in forced convection and subcooled flow boiling heat transfer to CuO/water nanofluids. Journal of Molecular Liquids, 313, 113502. DOI 10.1016/j.molliq.2020.113502. [Google Scholar] [CrossRef]
2. Sarafraz, M. M., Peyghambarzadeh, S. M. (2013). Experimental study on subcooled flow boiling heat transfer to water-diethylene glycol mixtures as a coolant inside a vertical annulus. Experimental Thermal and Fluid Science, 50, 154–162. DOI 10.1016/j.expthermflusci.2013.06.003. [Google Scholar] [CrossRef]
3. Sarafraz, M. M., Peyghambarzadeh, S. M., Vaeli, N. (2012). Subcooled flow boiling heat transfer of ethanol aqueous solutions in vertical annulus space. Chemical Industry and Chemical Engineering Quarterly, 18(2), 315–327. DOI 10.2298/CICEQ111020008S. [Google Scholar] [CrossRef]
4. Steiner, H., Kobor, A., Gebhard, L. (2005). A wall heat transfer model for subcooled boiling flow. International Journal of Heat and Mass Transfer, 48(19–20), 4161–4173. DOI 10.1016/j.ijheatmasstransfer.2005.03.032. [Google Scholar] [CrossRef]
5. Yu, W., France, D. M., Singh, D., Smith, R. K., Ritter, J. et al. (2014). Subcooled flow boiling of ethylene glycol/water mixtures in a bottom-heated tube. International Journal of Heat and Mass Transfer, 72, 637–645. DOI 10.1016/j.ijheatmasstransfer.2014.01.051. [Google Scholar] [CrossRef]
6. Paz, M. C., Conde, M., Suárez, E., Concheiro, M. (2015). On the effect of surface roughness and material on the subcooled flow boiling of water: Experimental study and global correlation. Experimental Thermal and Fluid Science, 64, 114–124. DOI 10.1016/j.expthermflusci.2015.02.016. [Google Scholar] [CrossRef]
7. Soleimani, B., Keshavarz, A. (2016). Heat transfer enhancement of an internal subcooled flow boiling over a hot spot. Applied Thermal Engineering, 99, 206–213. DOI 10.1016/j.applthermaleng.2015.12.043. [Google Scholar] [CrossRef]
8. Abou-Ziyan, H. Z. (2004). Forced convection and subcooled flow boiling heat transfer in asymmetrically heated ducts of T-section. Energy Conversion and Management, 45(7–8), 1043–1065. DOI 10.1016/j.enconman.2003.08.013. [Google Scholar] [CrossRef]
9. Setoodeh, H., Keshavarz, A., Ghasemian, A., Nasouhi, A. (2016). Subcooled flow boiling of ethylene-glycol/water mixture in an inclined channel with a hot spot: An experimental study. International Communications in Heat and Mass Transfer, 78, 285–294. DOI 10.1016/j.icheatmasstransfer.2016.09.020. [Google Scholar] [CrossRef]
10. Wang, J. Y., Han, F. Z., Lei, L., Lee, C. H. (2020). Numerical study of high-temperature nonequilibrium flow around reentry vehicle coupled with thermal radiation. Fluid Dynamics & Materials Processing, 16(3), 601–613. DOI 10.32604/fdmp.2020.09624. [Google Scholar] [CrossRef]
11. Khatra, L., EI Qarnia, H., EI Ganaoui, M. (2019). The effect of the fin length on the solidification process in a rectangular enclosure with internal fins. Fluid Dynamics & Materials Processing, 15(2), 125–137. DOI 10.32604/fdmp.2019.04713. [Google Scholar] [CrossRef]
12. Kriraa, M., Souhar, K., Achemlal, D., Yassine, Y. A., Farchi, A. (2020). Fluid flow and convective heat transfer in a water chemical condenser. Fluid Dynamics & Materials Processing, 16(2), 199–209. DOI 10.32604/fdmp.2020.07986. [Google Scholar] [CrossRef]
13. Amidu, M. A., Addad, Y. (2019). Bubble-induced enhancement of single-phase liquid forced convection heat transfer during subcooled nucleate flow boiling. Annals of Nuclear Energy, 134, 60–66. DOI 10.1016/j.anucene.2019.06.001. [Google Scholar] [CrossRef]
14. Khoshnevis, A., Sarchami, A., Ashgriz, N. (2018). Effect of nucleation bubble departure diameter and frequency on modeling subcooled flow boiling in an annular flow. Applied Thermal Engineering, 135, 280–288. DOI 10.1016/j.applthermaleng.2018.02.032. [Google Scholar] [CrossRef]
15. Brooks, C. S., Hibiki, T. (2015). Wall nucleation modeling in subcooled boiling flow. International Journal of Heat & Mass Transfer, 86, 183–196. DOI 10.1016/j.ijheatmasstransfer.2015.03.005. [Google Scholar] [CrossRef]
16. Kocamustafaogullari, G., Ishii, M. (1983). Interfacial area and nucleation site density in boiling systems. International Journal of Heat and Mass Transfer, 26(9), 1377–1387. DOI 10.1016/S0017-9310(83)80069-6. [Google Scholar] [CrossRef]
17. Prodanovic, V., Fraser, D. (2002). Salcudean M. Bubble behavior in subcooled flow boiling of water at low pressures and low flow rates. International Journal of Multiphase Flow, 28(1), 1–19. DOI 10.1016/S0301-9322(01)00058-1. [Google Scholar] [CrossRef]
18. Basu, N., Warrier, G. R., Dhir, V. K. (2005). Wall heat flux partitioning during subcooled flow boiling: Part 1—Model development. Journal of Heat Transfer, 127(2), 131–140. DOI 10.1115/1.1842784. [Google Scholar] [CrossRef]
19. Du, J., Zhao, C., Bo, H. (2018). Investigation of bubble departure diameter in horizontal and vertical subcooled flow boiling. International Journal of Heat and Mass Transfer, 127, 796–805. DOI 10.1016/j.ijheatmasstransfer.2018.07.019. [Google Scholar] [CrossRef]
20. Klausner, J. F., Mei, R., Bernhard, D. M. (1993). Vapor bubble departure in forced convection boiling. International Journal of Heat and Mass Transfer, 36(3), 651–662. DOI 10.1016/0017-9310(93)80041-R. [Google Scholar] [CrossRef]
21. Situ, R., Hibiki, T., Ishii, M. M. (2005). Bubble lift-off size in forced convective subcooled boiling flow. International Journal of Heat & Mass Transfer, 48(25–26), 5536–5548. DOI 10.1016/j.ijheatmasstransfer.2005.06.031. [Google Scholar] [CrossRef]
22. Chu, I. C., No, H. C., Song, C. H. (2011). Bubble lift-off diameter and nucleation frequency in vertical subcooled boiling flow. Journal of Nuclear Science and Technology, 48(6), 936–949. DOI 10.1080/18811248.2011.9711780. [Google Scholar] [CrossRef]
23. Yun, B. J., Splawski, A., Lo, S., Song, C. H. (2012). Prediction of a subcooled boiling flow with advanced two-phase flow models. Nuclear Engineering and Design, 253, 351–359. DOI 10.1016/j.nucengdes.2011.08.067. [Google Scholar] [CrossRef]
24. Ünal, H. C. (1976). Maximum bubble diameter, maximum bubble-growth time and bubble-growth rate during the subcooled nucleate flow boiling of water up to 17.7 MN/m2. International Journal of Heat and Mass Transfer, 19(6), 643–649. DOI 10.1016/0017-9310(76)90047-8. [Google Scholar] [CrossRef]
25. Tu, J. Y., Yeoh, G. H. (2002). On numerical modelling of low-pressure subcooled boiling flows. International Journal of Heat and Mass Transfer, 45(6), 1197–1209. DOI 10.1016/S0017-9310(01)00230-7. [Google Scholar] [CrossRef]
26. Zuber, N. (1961). The dynamics of vapor bubbles in nonuniform temperature fields. International Journal of Heat and Mass Transfer, 2(1–2), 83–98. DOI 10.1016/0017-9310(61)90016-3. [Google Scholar] [CrossRef]
27. Hoang, N. H., Chu, I., Euh, D. (2016). A mechanistic model for predicting the maximum diameter of vapor bubbles in a subcooled boiling flow. International Journal of Heat and Mass Transfer, 94, 174–179. DOI 10.1016/j.ijheatmasstransfer.2015.11.051. [Google Scholar] [CrossRef]
28. Zeitoun, O., Shoukri, M. (1996). Bubble behavior and mean diameter in subcooled flow boiling. Journal of Heat Transfer, 118(1), 110–116. DOI 10.1115/1.2824023. [Google Scholar] [CrossRef]
29. Yeoh, G. H., Tu, J. Y. (2017). Implementation of a two-phase boiling model into the RELAP5/MOD2 computer code to predict void distribution in low-pressure subcooled boiling flows. Nuclear Science and Engineering, 140(2), 181–188. DOI 10.13182/NSE02-A2254. [Google Scholar] [CrossRef]
30. Li, Y., Yeoh, G. H., Tu, J. Y. (2004). Numerical investigation of static flow instability in a low-pressure subcooled boiling channel. Heat and Mass Transfer, 40(5), 355–364. DOI 10.1007/s00231-003-0442-z. [Google Scholar] [CrossRef]
31. Yoo, J., Estrada-Perez, C. E., Hassan, Y. A. (2014). A proper observation and characterization of wall nucleation phenomena in a forced convective boiling system. International Journal of Heat and Mass Transfer, 76, 568–584. DOI 10.1016/j.ijheatmasstransfer.2014.04.063. [Google Scholar] [CrossRef]
32. Kim, J., Lee, H. C., Do, O. B., Kim, M. H. (2004). Effects of bubble shape assumption on single bubble growth behavior in nucleate pool boiling. Journal of Flow Visualization and Image Processing, 11(1), 73–87. DOI 10.1615/JFlowVisImageProc.v11.i1.50. [Google Scholar] [CrossRef]
33. Chi-Yeh, H., Griffith, P. (1965). The mechanism of heat transfer in nucleate pool boiling—Part I: Bubble initiaton, growth and departure. International Journal of Heat and Mass Transfer, 8(6), 887–904. DOI 10.1016/0017-9310(65)90073-6. [Google Scholar] [CrossRef]
34. Siegel, R., Keshock, E. G. (1964). Effects of reduced gravity on nucleate boiling bubble dynamics in saturated water. AIChE Journal, 10(4), 509–517. DOI 10.1002/aic.690100419. [Google Scholar] [CrossRef]
35. Cole, R., Shulman, H. L. (1966). Bubble growth rates at high Jakob numbers. International Journal of Heat and Mass Transfer, 9(12), 1377–1390. DOI 10.1016/0017-9310(66)90135-9. [Google Scholar] [CrossRef]
36. Van Wijk, W. R., Van Stralen, S. J. (1962). Growth rate of vapour bubbles in water and in a binary mixture boiling at atmospheric pressure. Physica, 28(2), 150–171. DOI 10.1016/0031-8914(62)90101-5. [Google Scholar] [CrossRef]
37. Chen, H., Chen, G., Zou, X., Yao, Y., Gong, M. (2017). Experimental investigations on bubble departure diameter and frequency of methane saturated nucleate pool boiling at four different pressures. International Journal of Heat and Mass Transfer, 112, 662–675. DOI 10.1016/j.ijheatmasstransfer.2017.05.031. [Google Scholar] [CrossRef]
38. Popiel, C. O., Wojtkowiak, J. (1998). Simple formulas for thermophysical properties of liquid water for heat transfer calculations (from 0°C to 150°C). Heat Transfer Engineering, 19(3), 87–101. DOI 10.1080/01457639808939929. [Google Scholar] [CrossRef]
39. Paz, C., Conde, M., Porteiro, J., Concheiro, M. (2015). Effect of heating surface morphology on the size of bubbles during the subcooled flow boiling of water at low pressure. International Journal of Heat and Mass Transfer, 89, 770–782. DOI 10.1016/j.ijheatmasstransfer.2015.06.003. [Google Scholar] [CrossRef]
40. Puli, U., Kumar, R. A. (2012). Parametric effect of pressure on bubble size distribution in subcooled flow boiling of water in a horizontal annulus. Experimental Thermal and Fluid Science, 37, 164–170. DOI 10.1016/j.expthermflusci.2011.11.001. [Google Scholar] [CrossRef]
41. Puli, U., Rajvanshi, A. K., Das, S. K. (2013). Investigation of bubble behavior in subcooled flow boiling of water in a horizontal annulus using high-speed flow visualization. Heat Transfer Engineering, 34(10), 838–851. DOI 10.1080/01457632.2012.746544. [Google Scholar] [CrossRef]
 | This work is licensed under a Creative Commons Attribution 4.0 International License, which permits unrestricted use, distribution, and reproduction in any medium, provided the original work is properly cited. |