DOI: 10.32604/fdmp.2021.012950
ARTICLE
Study on Energy Conversion Characteristics in Volute of Pump as Turbine
1School of Energy and Power Engineering, Lanzhou University of Technology, Lanzhou, China
2Jiangsu Shuangda Pump Valve Group Co., Ltd., Jingjiang, China
*Corresponding Author: Senchun Miao. Email: miaosc88@126.com
Received: 21 July 2020; Accepted: 11 January 2021
Abstract: A volute is a curved funnel with cross-sectional area increasing towards the discharge port. The volute of a centrifugal pump is the casing hosting the fluid being pumped by the impeller. In Pump-as-turbine devices (PAT), vice versa the volute plays the role of energy conversion element. In the present analysis, this process is analyzed using CFD. The results show that in the contraction section of volute the conversion between dynamic pressure energy and static pressure energy essentially depends on the reduction of flow area, while in the spiral section, frictional losses also play a significant role. From the throat to the end of the volute, the flow decreases in a wave-like manner.
Keywords: Pump as turbine; volute; energy conversion; static pressure power; dynamic pressure power
Nomenclature
| D1: | Impeller outlet diameter [mm] |
| D2: | Impeller inlet diameter [mm] |
| D3: | Volute inlet diameter [mm] |
| b2: | Impeller inlet width [mm] |
| b3: | Volute outlet width [mm] |
| z: | Number of blades |
| ns: | Specific speed, |
| n: | Rotational speed [rpm] |
Greek Symbols
| β1: | Blade outlet angle [°] |
| β2: | Blade inlet angle [°] |
| ω: | Rotation angular velocity [rad/s] |
The current energy problem is becoming progressively serious, and energy conservation and emission reduction have now become global responsibilities. Despite this, in most process industries, such as petrochemical [1–2], chemical fertilizer synthetic ammonia process [3–4], reverse osmosis desalination [5], and urban water supply [6–7], a large amount of liquid pressure energy is surplus, which is usually discharged through pressure reducing valves or other pressure relief devices, thereby wasting the energy of high-pressure liquid. A pump as turbine can convert liquid pressure energy into rotating mechanical energy to generate electricity or drive other equipment to run, so as to achieve the purpose of energy conversion and energy saving. Owing to the simple structure, low cost, reliable operation, easy operation and maintenance thereof, the pump as turbine has been employed extensively in industry [8–12].
Presently, research on the pump as turbine primarily shift attention towards the selection of the pump as turbine [13–17], the performance optimization [18–24] and the stability [25–30]. Regarding the selection of the PAT, Yang et al. [13] established a mathematical model for predicting the performance of the pump in reverse operation from the perspective of dimensional analysis, and fitted out the performance prediction formula of the pump in reverse operation, providing a reference for the selection of the pump as a hydraulic turbine. Through experiments and theoretical analysis, Yang et al. [14] determined that the H and Q of the pump under turbine conditions were related to the optimal efficiency and specific speed of the pump, and subsequently determined the corresponding relationship. In terms of the performance optimization of the PAT, Shahram Derakhshan et al. [18] adopted the impeller of a centrifugal pump as the research object, and utilized numerical calculation and a gradient optimization algorithm to optimize the blade shape, in order to render that the efficiency of the blade was higher under the condition of pump reverse as turbine. Singh et al. [19] researched a multitude of schemes to improve the PAT performance by optimizing the geometric parameters of the pump. The findings were that the impeller rounding could improve the performance of the PAT, and the suggestion was provided that the impeller rounding should be used for the reversal of various pumps. At the same time, different rounding standards were offered. Wang et al. [20], assuming the conservation of the velocity moment in the spiral case of a PAT under the optimum working condition, ascertained the inlet and outlet setting angles of the PAT blade, respectively, and designed a special impeller for the PAT by utilizing ANSYS-BladeGen. Subsequently, the optimized PAT and prototype PAT were tested, respectively. The results revealed that the efficiency of the optimized PAT was much higher than that of the prototype PAT. By means of numerical calculation, Shahram et al. [22] investigated the performance of an axial-flow pump under the conditions of forward rotation and reverse rotation. Although the axial-flow pump was found to be usable as a turbine with low energy head, the efficiency of the axial flow pump under turbine conditions was low. Accordingly, the blade of the axial flow pump was optimized through the combination of a genetic algorithm and an artificial neural network. The performance of the axial flow pump under turbine conditions was substantially improved after optimization, and the efficiency was increased by 14%. With regard to hydraulic stability, Yang et al. [24,25] applied a numerical calculation method to observe the axial force, radial force, and the stress of the shaft when a pump with a specific speed of 84.5 was used as a turbine. Shi et al. [26,27] employed ANSYS-FLUENT software to explore the internal pressure fluctuation of a pump as turbine under different guide vane numbers and different inlet cross-section areas. In one study, the flow field analysis software CFX was utilized to thoroughly analyze the pressure pulsation in the pump as turbine [28]. Compared with the volute and draft tube area, the pressure pulsation in the impeller was found to be the strongest, with the largest pressure pulsation occurring in the middle of the impeller. With a view to understand in-depth the pressure pulsation in the volute of the pump as turbine, another study analyzed the pressure pulsation under different flows by setting monitoring points at different radial positions and circumferential positions in the volute flow passage of the pump as turbine [29].
Amongst the background of the aforementioned research on the PAT, researchers have evidently centered research on the impeller. However, research on the volute is scarce [27,29,30], particularly on the energy conversion in the volute. As is well known, the volute is also an integral energy conversion component of the PAT, which determines the energy efficiency and other performance parameters of the PAT. If the energy conversion process and the law thereof can be clearly defined, this will be beneficial to the further design and optimization of the volute. Thus, the present paper took the single-stage single-entry PAT as the research object, and applied the method of sub region to analyze the energy conversion in each region of the volute, in addition to the energy conversion relationship between the impeller and the volute, so as to provide a qualitative guideline for volute performance.
2.1 Main Parameters of Research Object
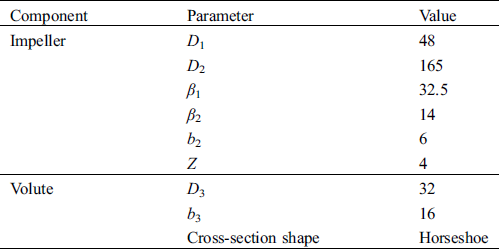
In the present paper, a single-stage single suction centrifugal pump with a specific speed of 48 was selected as the turbine [31]. The performance parameters of the pump were: flow rate Q = 12.5 m3/h, head H = 30.7 m, rotational speed n = 2900 r/min and the impeller rotates clockwise. Fig. 1 exhibits the selected model, and Tab. 1 reports the key geometric parameters.
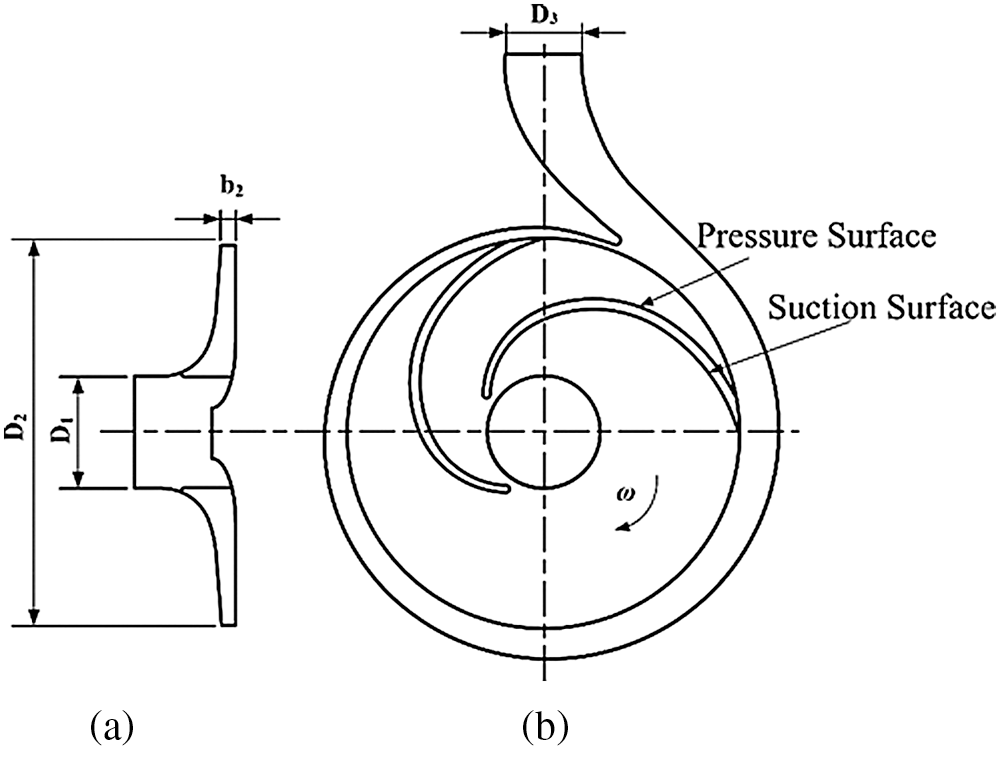
Figure 1: Impeller projection (a) The meridional section (b) The plan view
Table 1: Main geometric parameters of the centrifugal pump as turbine
In the non-inertial coordinate system following the impeller rotation, the flow in the pump as turbine can be considered to be constant. The continuity equation and momentum equation of incompressible fluid are as follows:

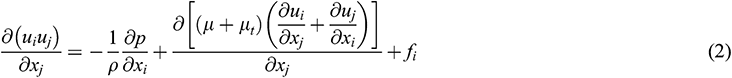
In which p is the intensity of pressure,  is the Coriolis force, u is the relative velocity,
  is the kinetic viscosity, and
  is the turbulent viscosity.
The turbulence model selected in this paper was the standard  turbulence model. First proposed by Launder et al. [32] in 1972, the standard
  turbulence model is formed by introducing a turbulence dissipation rate
  equation on the basis of the turbulence kinetic energy
  equation. In this model, the newly introduced turbulent dissipation rate
  is defined as presented in Eq. (3):

The turbulent viscosity  can be expressed as
  function of
  and
and  , namely:

where  = 0.09.
In the standard  turbulence model, the transport equation of turbulent kinetic energy
  and turbulent dissipation rate
  are displayed as follows:


where  stands for generation of turbulence kinetic energy due to mean velocity gradients,
  for the generation of turbulence kinetic energy due to buoyancy,
  for contribution of the fluctuating dilatation in compressible turbulence to the overall dissipation rate.
  = 1.44,
  = 1.92.
  = 1.0 and
  = 1.3 are the turbulent Prandtl numbers for
  and
and  , respectively.
  and
and  stand for user-defined source terms. Since the fluid medium in this paper is water, it is an incompressible fluid, so
  ,
,  ,
,  and
and  are all equal 0.
2.3 3D Modeling and Mesh Generation
Pro/E software was employed to generate models of various components of the PAT, as revealed in Fig. 2. After the establishment of the computational domain model, the model was meshed by ICEM [33]. Fig. 3 depicts the impeller grid diagram and the full flow field grid assembly diagram.
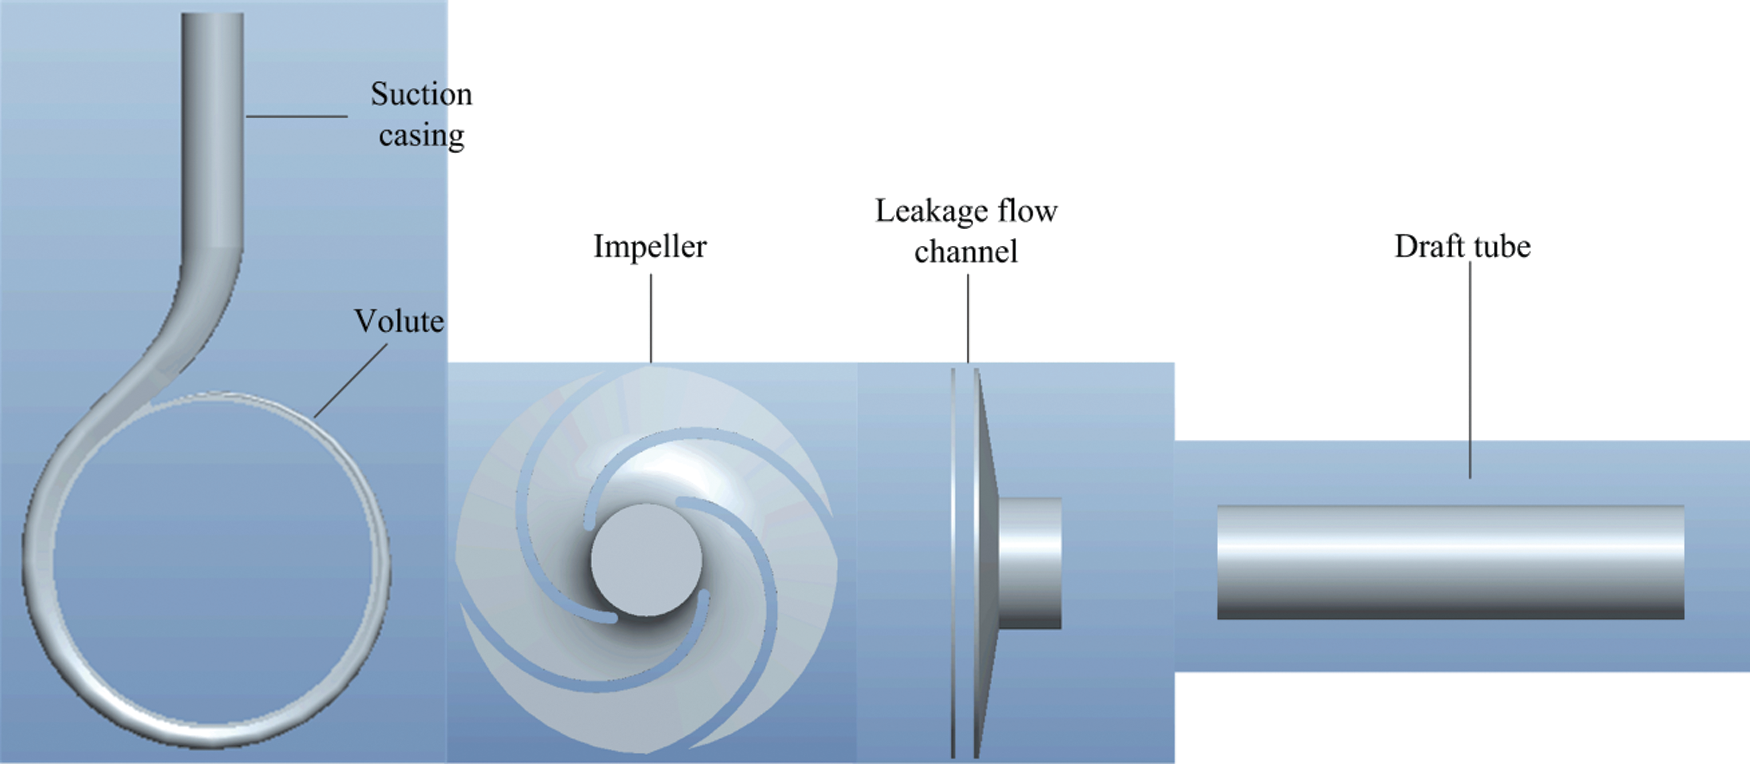
Figure 2: 3-D model of the PAT’s each part
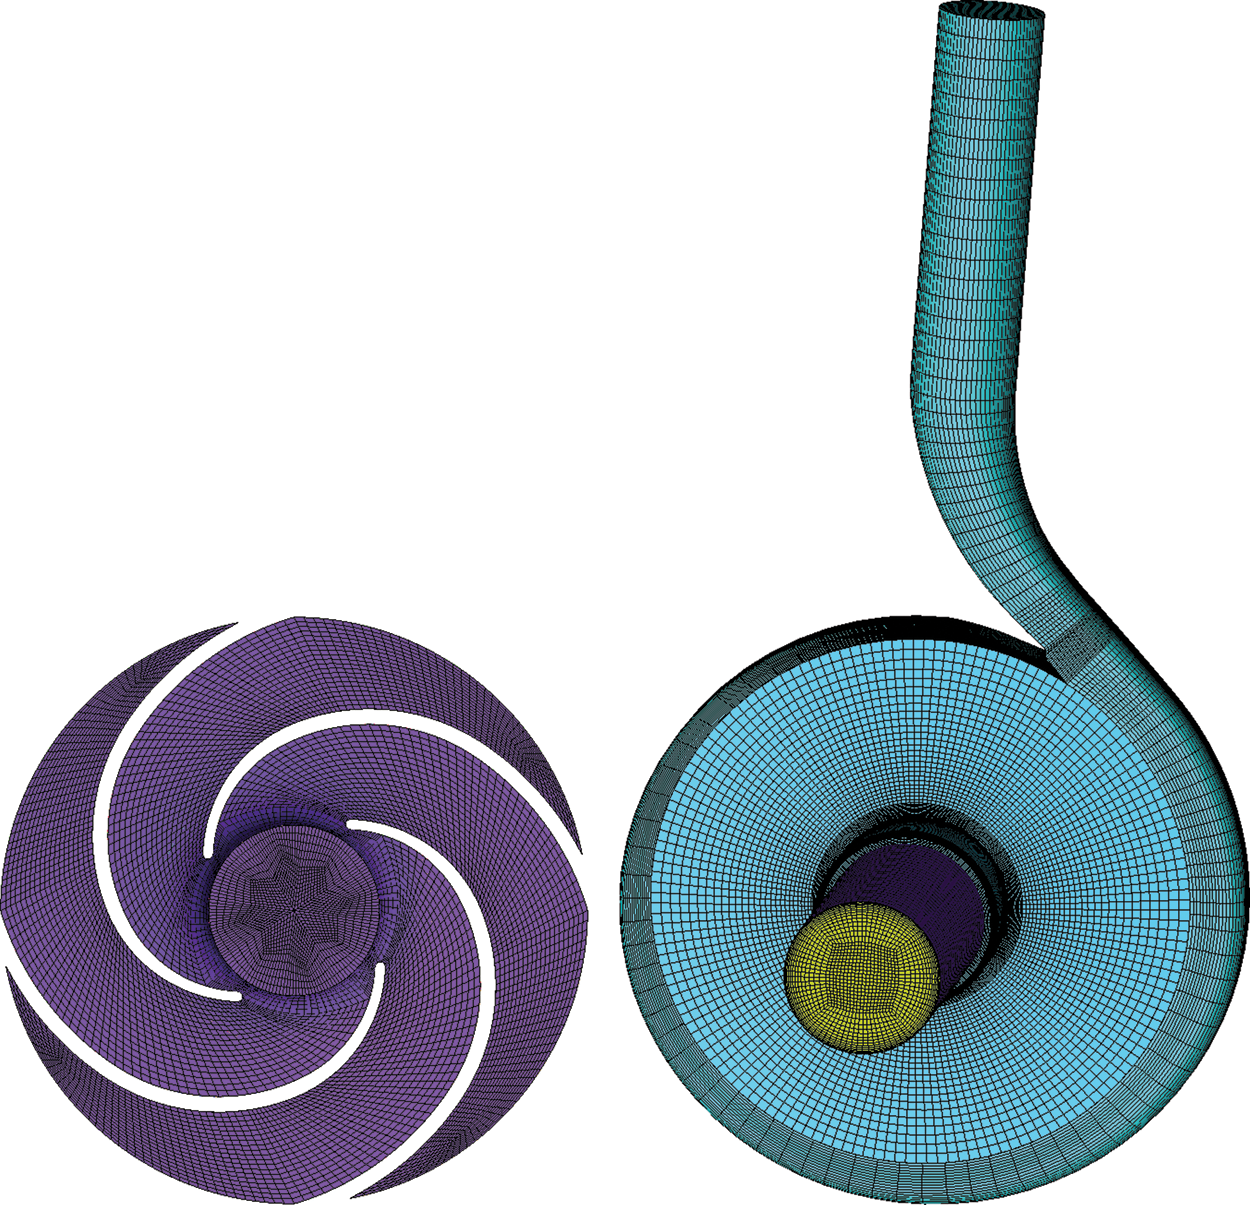
Figure 3: Mesh of impeller and assembly
For the purpose of studying the influence of grid number on model performance prediction, six sets of grids were set up in this paper, with the total grid points being 506 484, 694 260, 926 242, 1178 560, 1 368 766 and 1 608 472, respectively. One finding was that from the fourth grid, the efficiency of the PAT changed within 0.5%, as exhibited in Fig. 4. Therefore, for the consideration of computing resources and computing time, the present paper selected the fourth grid set as the grid for subsequent numerical calculation.
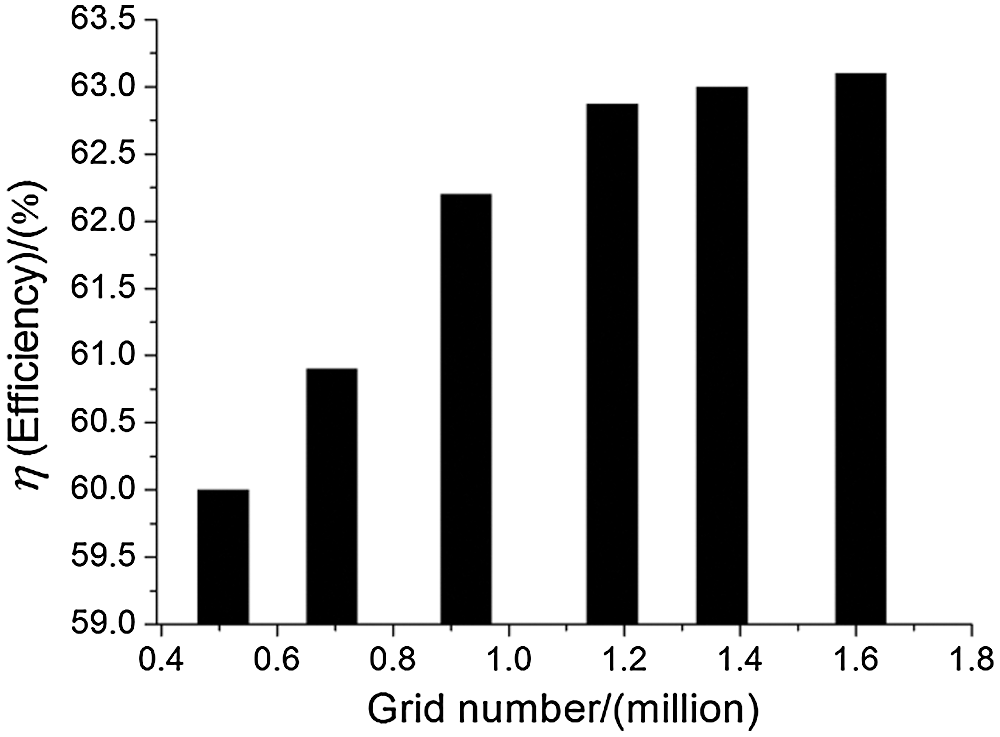
Figure 4: The relationship between PAT efficiency and mesh numbers
ANSYS-FLUENT software [34] was employed to calculate the incompressible Navier Stokes equations, and the medium was clean water under 101 kPa and 25°C. The standard k-ε model was selected as the calculation model. The continuity equation, turbulent kinetic energy equation, momentum equation and turbulent kinetic energy dissipation equation were all discretized by the second-order upwind scheme of finite volume method. The boundary conditions for the inlet and the outlet were velocity inlet and static pressure outlet, respectively. Interface boundary conditions were applied between the rotating part and the stationary parts. The standard wall function was utilized to define the flow of the near-wall region. Pressure-based is used as the coupling scheme of pressure-velocity, and pressure-velocity coupling adopt the SIMPLE algorithm [35–37]. Considering the numerical calculation accuracy and time cost, the calculation takes every 4° of the impeller as a time step, that is, one revolution of the impeller is 90 steps, the impeller rotates 6 times in total, and the total time is about 0.1241 s. The calculation convergence standard was set to 10−5.
Further, verification of the numerical prediction accuracy in the present manuscript has been conducted in a previous paper [38], while numerical calculation has been successfully applied in heat exchange [39–40], wind turbines [41–44] and so on. Since the pump as turbine and wind turbines both belong to rotating machinery, the numerical calculation method is an adequate choice for conducting research.
3 Fluid Energy Conversion Characteristics in the Volute of PAT
In a PAT, the primary function of the volute is to generate a certain circulation of high-pressure liquid and introduce it into the impeller. The high-pressure liquid gradually flows from the volute inlet along the direction of narrowing of the flow passage, allowing for the hydrostatic energy and kinetic energy of the fluid to transform each other. Therefore, in the PAT, the role of the volute is not only as a diversion component, but also as an energy conversion device. In the vein of clarifying the law of liquid energy conversion in the volute, the volute was divided into several parts for analysis, as depicted in Figs. 5 and 6.
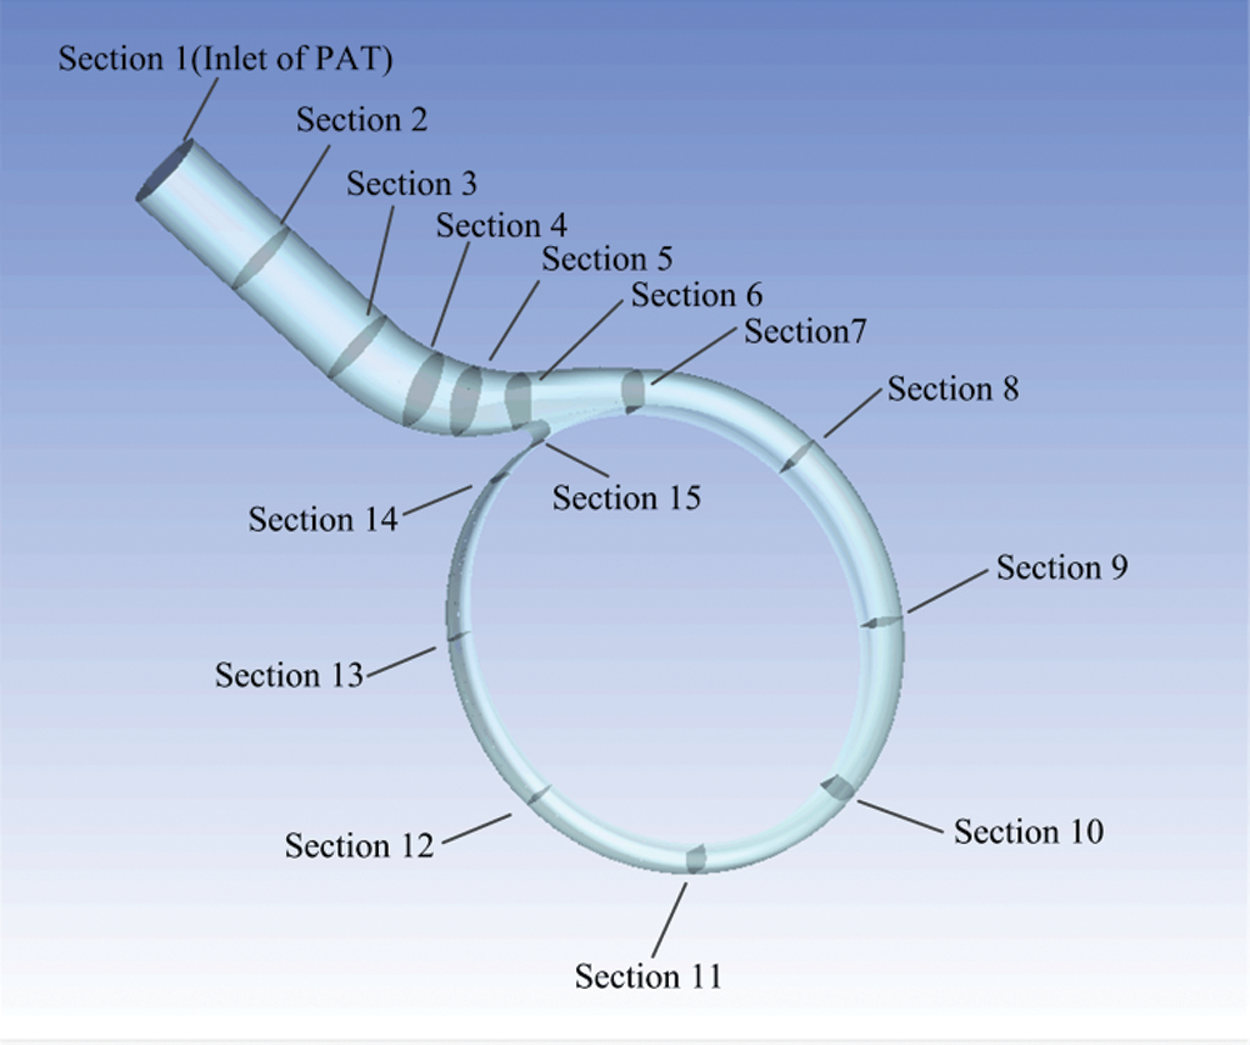
Figure 5: Schematic diagram of each section position of PAT volute
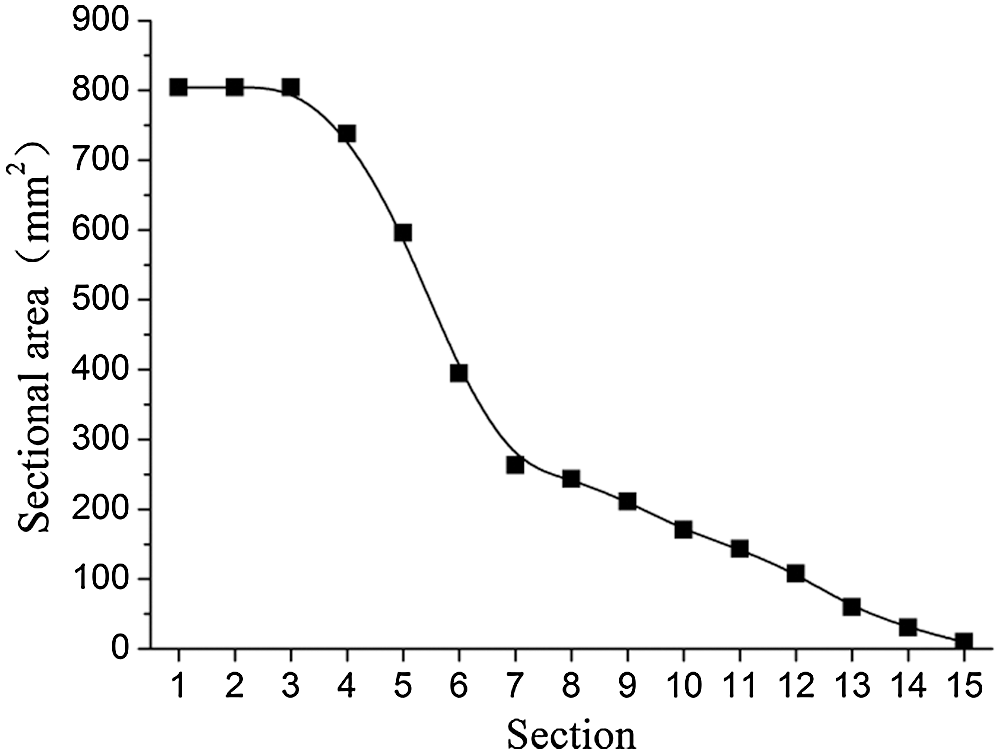
Figure 6: Variation curve of section area of PAT volute
3.1 The Variation Law of Dynamic and Static Pressure Power in the Volute
Fig. 7 demonstrates the distribution of hydrostatic power and hydrodynamic power on each section of the volute under different flows. The hydrostatic power and hydrodynamic power on each section were calculated by Formulas (7) and (8), respectively.


where  and
and  are the dynamic pressure power and static pressure power, respectively; and
  , and
, and  are the dynamic pressure and static pressure in the absolute coordinate system, respectively.
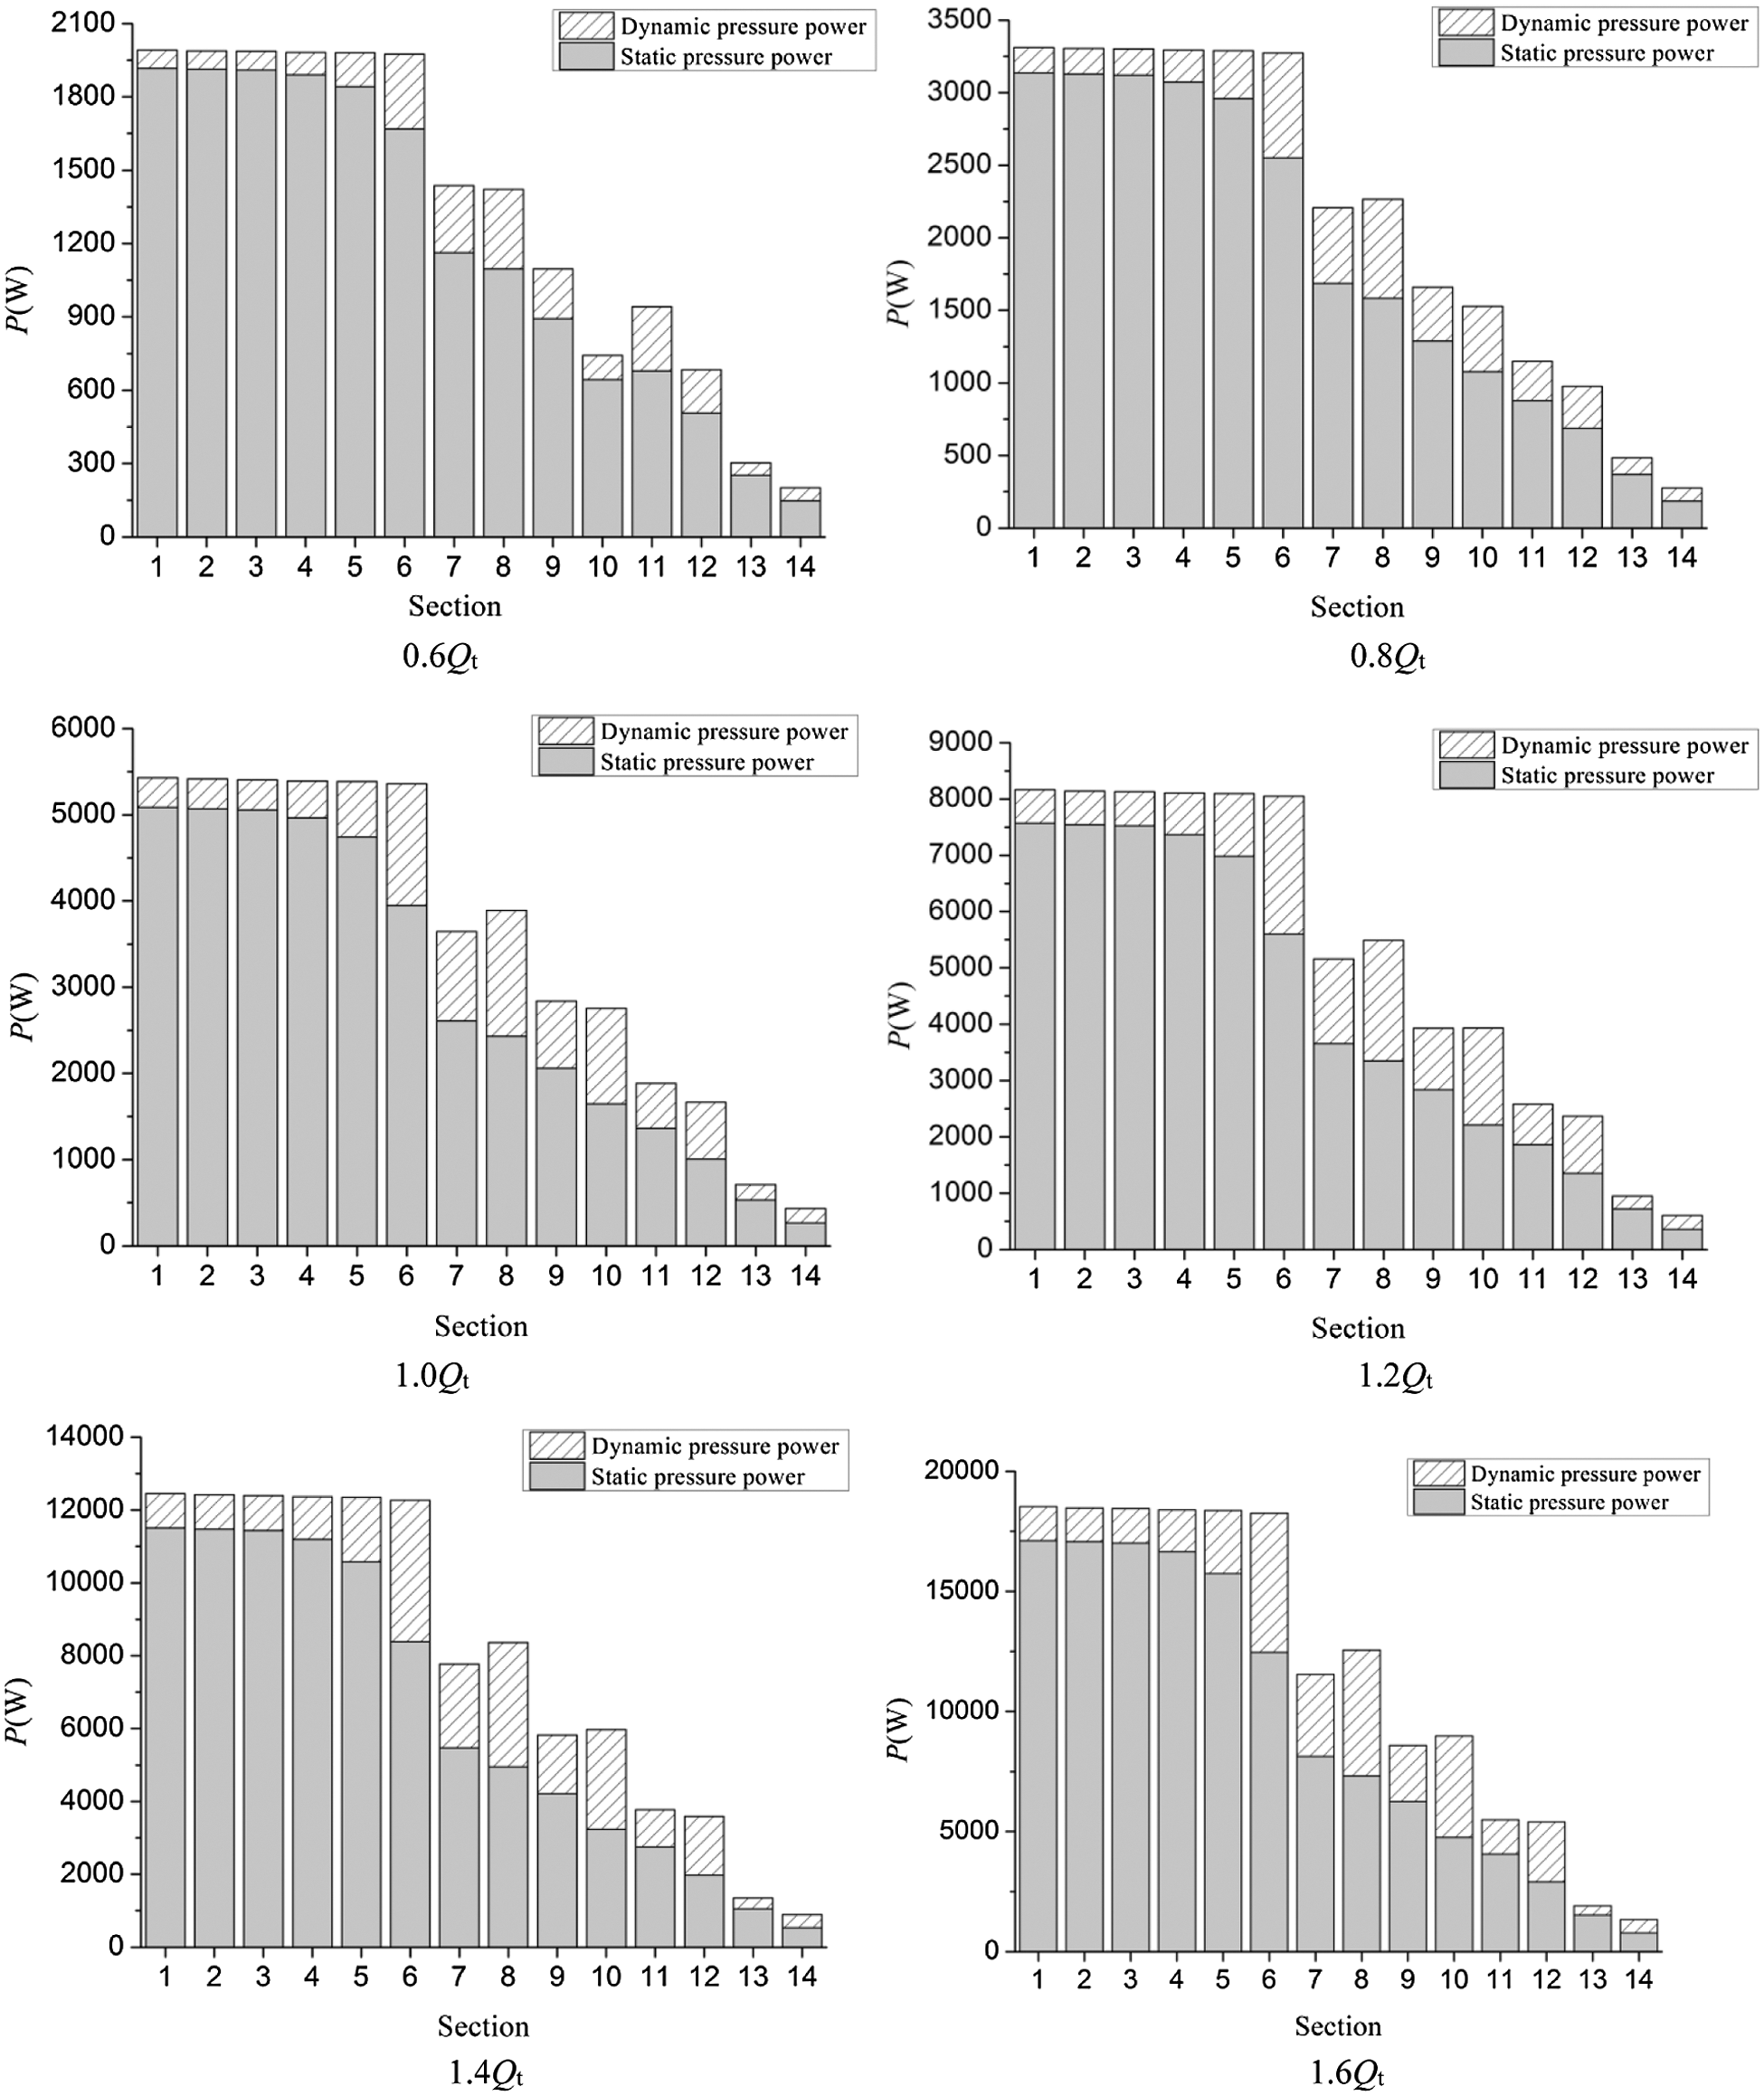
Figure 7: Dynamic and static pressure power distribution of each overcurrent section of the volute (a) 0.6Qt (b) 0.8Qt (c) 1.0Qt (d) 1.2Qt (e) 1.4Qt (f) 1.6Qt
According to Fig. 7, an observation can be made that the dynamic and static pressure power of the volute from Sections 1 to 14 were similar in different flows. From Sections 1 to 3, the dynamic and static pressure energy demonstrated almost no change. From Sections 3 to 6, the dynamic pressure energy gradually increased, while the static pressure energy gradually decreased. From Sections 7 to 14, the total energy demonstrated a downward trend. The static pressure energy essentially displayed a linear downward trend, while the dynamic pressure energy changes were slightly more complex. The main reason for the change of dynamic and static pressure energy in the first six sections is that the flow area of the volute changed along the flow direction. As seen in Fig. 6, the flow area was equal from Sections 1 to 3 of the volute, thus, the dynamic pressure energy and the static pressure energy on the three sections were basically the same. From Sections 3 to 6, the flow area of the volute gradually decreased, resulting in the increase of the velocity of the fluid due to the decrease of the flow area. Therefore, the kinetic pressure energy gradually increased, while the static pressure energy gradually increased. Since energy equals the total energy minus the sum of kinetic pressure energy and energy loss, the static pressure energy decreased gradually. From Sections 6 to 14, on the one hand, the change of dynamic and static pressure energy was caused by the change of over-current area and flow loss. On the other hand, the flow of fluid in the volute was affected by the impeller, as the volute and impeller were connected from Sections 6 to 14. This made the dynamic and static pressure energy of each section change. Further, an observation can be made from the figure that with the increase of flow rate, the proportion of dynamic pressure power in the total power gradually increased.
Through the analysis of the energy conversion process in the volute, a finding was that the energy conversion process in the volute of the pump as turbine is more complex, particularly in the area from Sections 6 to 14. Hence, further in-depth study on the energy conversion process in the volute is required. Fig. 8 exhibits the flow distribution through each section of the volute under different flows.
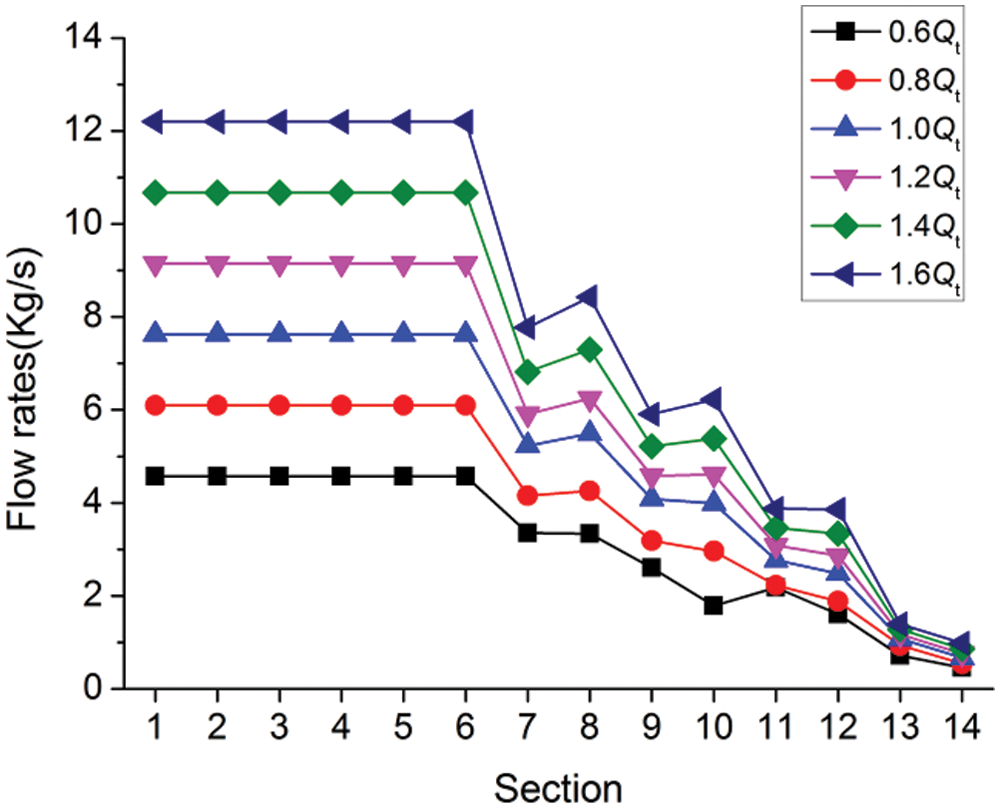
Figure 8: Flow distribution of each section through the volute at different flows
As can be observed in Fig. 8, the flow rate on the first six sections demonstrated a horizontal straight line distribution under different flows, which is not difficult to understand. From Sections 6 to 14, the flow rate changed in a wave-like downward trend. This change of flow rate was related to the flow situation of fluid from the volute to the impeller inlet, and the flow situation at impeller inlet would affect the flow in the volute in turn. Fig. 9 depicts the velocity streamline of the middle section of the PAT at 1.0Qt. At the inlet of each blade working face, there existed a relatively large vortex (as shown in Fig. 9, Vortex 1, 2, 3 and 4). Vortex 1 was located below the area surrounded by Sections 7 and 8. Under the action of the vortex, some of the fluids (net fluids) re-entered the volute, leading to an increase in the flow through Section 8. The principle of flow increases in Sections 10 and 12 was similar to that in Section 8, but there was a vortex (Vortex 4) below the area around Sections 13 and 14, with the flow through Section 14 being less than that through Section 13. This was because from Sections 13 to 14, owing to the action of the vortex, the fluid from the volute into the impeller was more than the fluid from the impeller into the volute. Moreover, an observation can be made from the figure that the flow rate variation law of each section was similar to that of 1.0Qt, indicating that the internal flow law of fluid is similar under these conditions. After clarifying the reasons for the increase of flow rate in Sections 8, 10 and 12 under (0.6–1.6) Qt flow rates, the reasons for the increase of dynamic pressure power on the three sections in Fig. 7 can be understood.
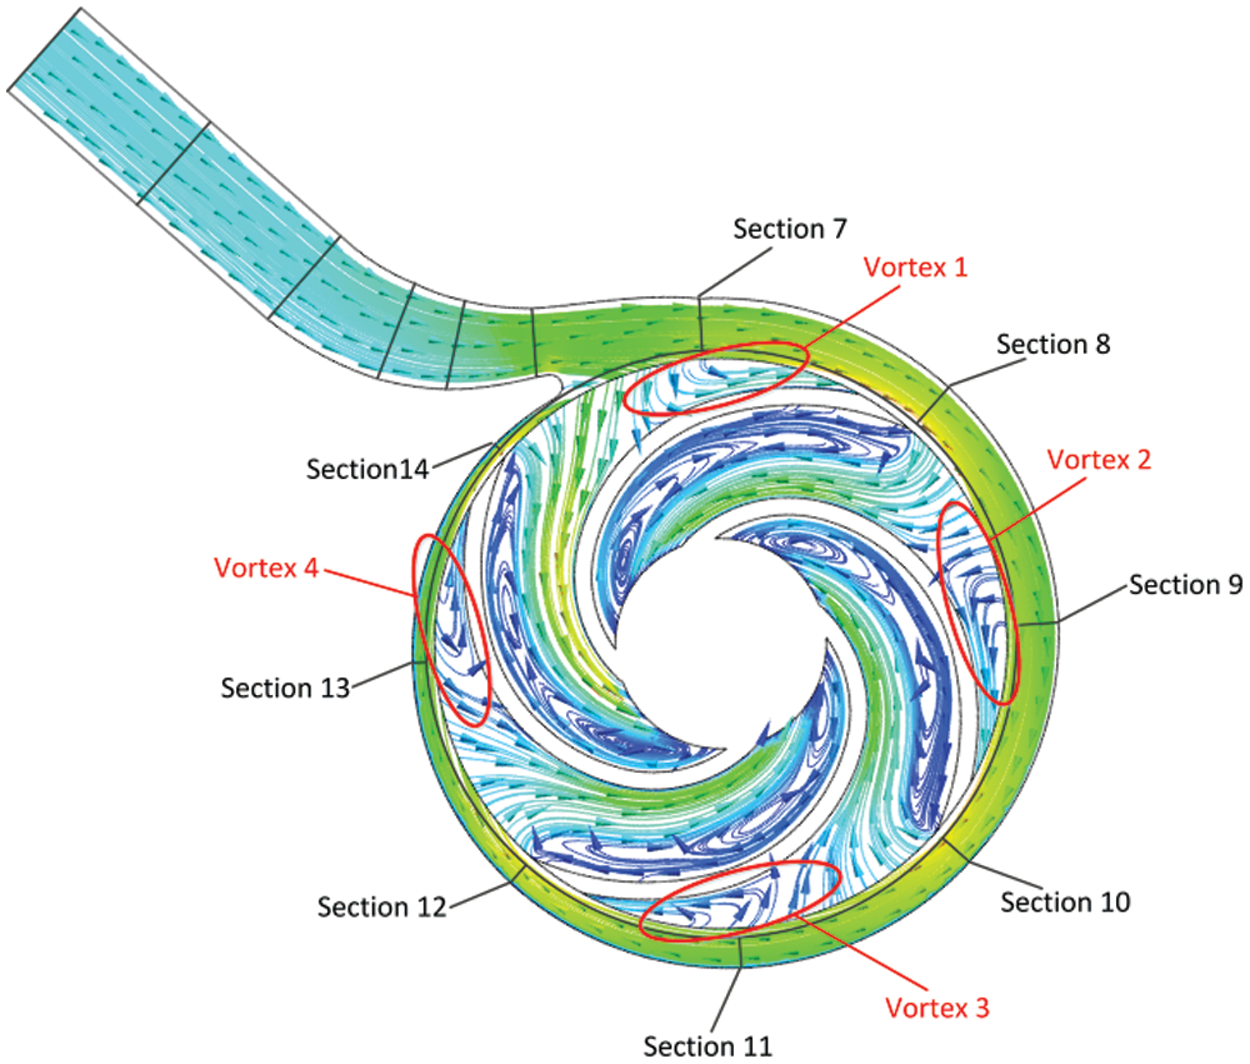
Figure 9: Streamline on the middle section of the pump as turbine
3.2 Fluid Energy Loss in the Volute
The energy of the fluid was not wholly transferred to the impeller through the volute. This is because the movement of the fluid in the volute was accompanied by hydraulic friction loss, which refers to hydraulic loss caused by the change of velocity and direction that consumed part of the energy. Fig. 10 exhibits the power loss in the volute of the PAT at different flows. As can be seen from Fig. 10, with the flow rate from 0.6-Qt to 1.6-Qt, the energy loss in the volute increased from 181.55 W to 1632.59 W, that is, when the flow rate of the PAT increased by 2.67 times, the power loss in the volute increased by about 9 times.
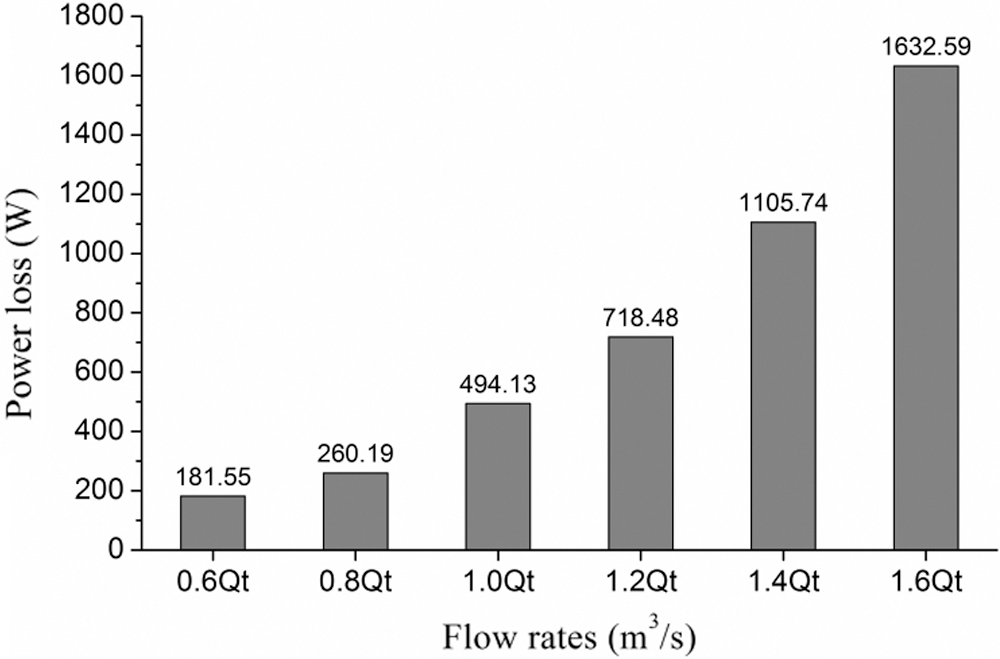
Figure 10: Energy loss in the volute under different flows
Fig. 10 reveals the distribution of energy loss in volutes of PAT at different flows. For the purpose of studying the energy loss in the volute in more detail, the volute was divided into 13 regions according to the section shown in Fig. 5. Sections 1–2 make up the first region, while the second region consisted of Sections 2–3. By analogy, the volute was eventually divided into 13 regions, of which Area 6 was the area surrounded by Sections 6, 7 and 14, as shown in Fig. 11. After zoning, the calculation of power loss in each region was equal to the total energy of all import sections in the region minus the total energy of all outlet sections. From Regions 1 to 5, each region had only one inlet section and one outlet section. From Regions 6 to 13, each region had two outlets, one being the junction with the downstream region and the other being the outlet of the volute. Additionally, the sixth area of the volute had two inlet surfaces, and the other areas were all one inlet surface. The total energy at the cross section of the inlet and outlet was calculated by Formula (9). Fig. 12 depicts the distribution of power loss in different areas of the volute under different flows.

where  is the total pressure in the absolute coordinate system,
  is the velocity obtained by solving the mass conservation equation, and the part within the integral symbol is the power density.
As can be observed in Fig. 12, the distribution of energy loss in each region was similar under different flows, and the loss in each region increased with the increase of flow rate. This is because the fixed area and shape of the cross section of the volute determined that the velocity of the fluid in the volute increased with the increase of flow rate, leading to the increase of the loss in the volute. In the first four and thirteenth regions of the volute, the energy loss was relatively small, while from the fifth region to the twelfth region, the energy loss in each region was relatively large. The reason is not only that the velocity and direction of the fluid passing through these sections in turn changed, but also that these regions were connected with the impeller and flow in the volute. Motion was affected by the flow in the impeller, rendering the internal flow more complex and correspondingly increasing the turbulent dissipation loss in volute.
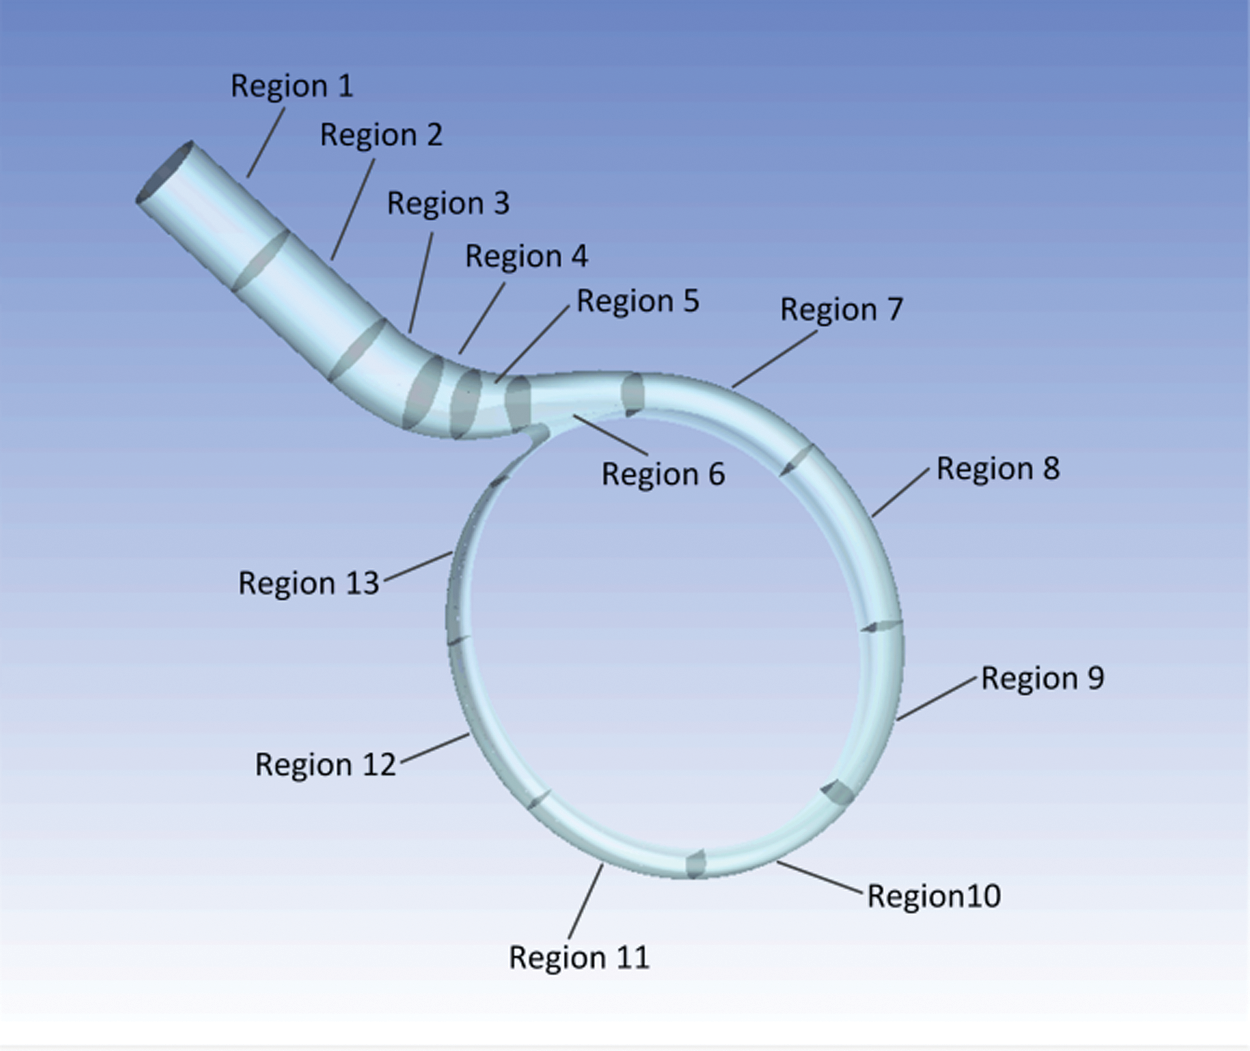
Figure 11: Schematic diagram of volute block division
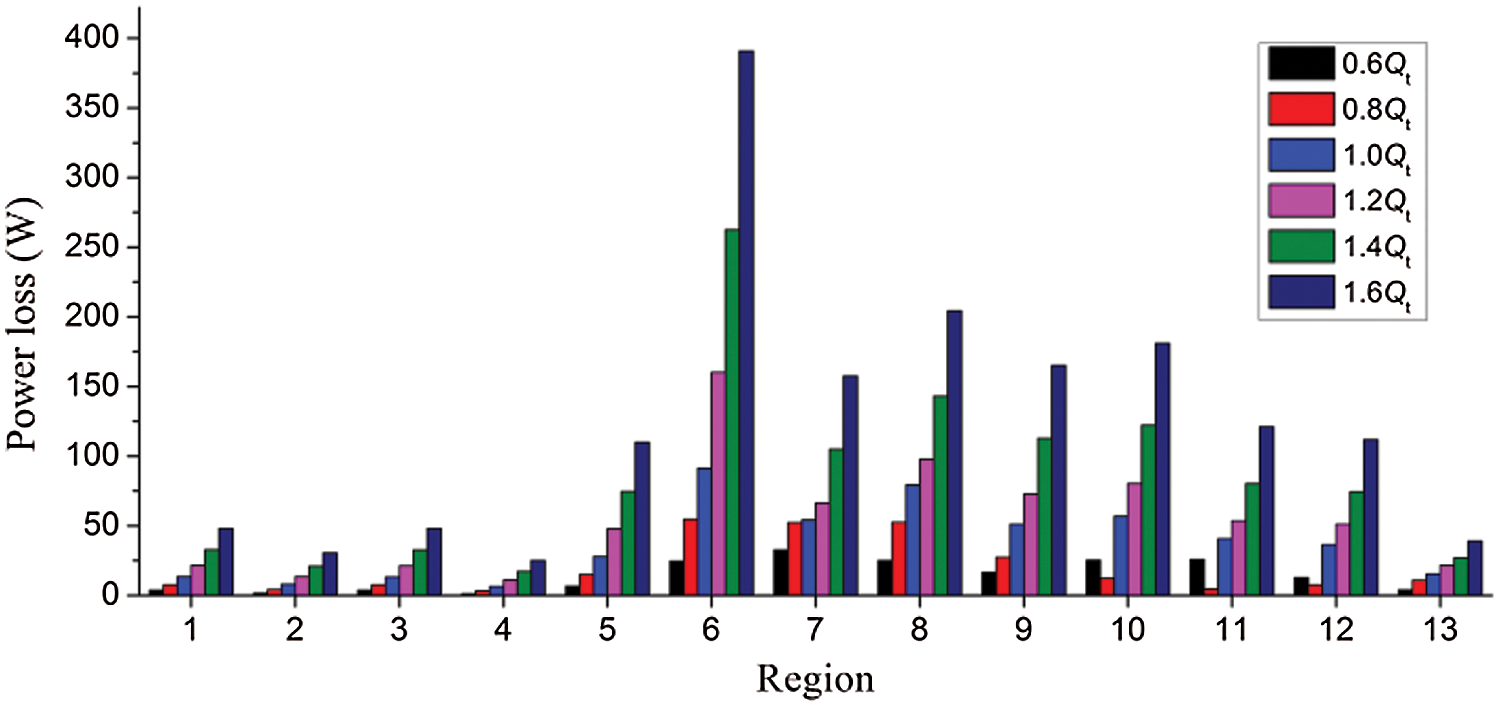
Figure 12: Power loss distribution in each region of the volute under different flows
(1) In the contraction section of volute, the energy conversion of fluid was mainly related to the flow area, while in the spiral section of volute, the change of energy conversion was caused by the change of flow area and flow frictional loss. However, as the volute was connected with the impeller from the throat to the end, the flow of fluid in the volute was affected by the impeller, rendering changes in the dynamic and static pressure energy of each section.
(2) From the throat to the end of the volute, the change of flow rates demonstrated a wave like downward trend. This change of flow rates was primarily attributed to the fact that a part of the fluid returned to the volute after entering the impeller because of the unreasonable inlet angle of the blade.
(3) In the volute, the loss in the spiral section was larger than that in the contraction section. This was attributed to the change of velocity and direction when the fluid passed through these sections in turn, in addition to these areas being connected with the impeller. Here, the flow in the volute was affected by the flow in the impeller, rendering the internal flow more complex, and correspondingly increasing the turbulent dissipation loss in the volute.
Funding Statement: This work was supported by Gansu province science and Technology Fund of China [Grant Nos. 20JR10RA174, 20JR5RA447]; Open Research Subject of Key Laboratory of Fluid and Power Machinery (Xihua University), Ministry of Education [Grant Nos. LTDL2020-007, szjj2019-016]; and Lanzhou University of Technology Hongliu Outstanding Young Teachers Program.
Conflicts of Interest: The authors declare that we have no conflicts of interest to report regarding the present study.
1. Hao, J. (2019). Application of hydraulic turbine in hydrogenation unit. Oil and Gas Production, 45(10), 59–61. [Google Scholar]
2. Jing, R., Chen, Z. G., Chen, Y. Q., Yu, J., Ma, H. J. (2019). Exploration and analysis of energy saving measures in hydrocracking unit. Technology and Equipment, 43(6), 93. [Google Scholar]
3. Duan, Y. H., Zhang, Y. Y., Liu, X., Duan, D. L., Gu, Z. H. (2017). Application of new type of hydraulic turbine in the shift gas desulfurization system of ammonia synthesis. Coal Chemical Industry, 45(2), 55–57. [Google Scholar]
4. Yang, L., Wu, S. J., Li, C. P. (2018). Application of hydraulic turbine pump in low temperature methanol washing section. Chemical Fertilizer Industry, 45(6), 44–47. [Google Scholar]
5. Raja, W. A., Piazza, R. W. (1981). Reverse running centrifugal pumps as hydraulic power recovery turbines for seawater reverse osmosis systems. Desalination, 38(8), 123–134. DOI 10.1016/S0011-9164(00)86054-3. [Google Scholar] [CrossRef]
6. Mauro, D. M., Barbara, M., Roberto, V., Antonio, M. (2016). Energy saving in water distribution network through pump as turbine generators: Economic and environmental analysis. Energies, 9(12), 1–15. [Google Scholar]
7. Orchard, B., Klos, S. (2009). Pumps as turbines for water industry. World Pumps, 2009(8), 22–23. DOI 10.1016/S0262-1762(09)70283-4. [Google Scholar] [CrossRef]
8. Garcia, I. F., Mc, N. A. (2020). Maximizing hydropower generation in gravity water distribution networks: determining the optimal location and number of pumps as turbines. Journal of Water Resources Planning and Management, 146(1), 1–12. [Google Scholar]
9. Mojtaba, T., Hossein, Y., Younes, N., Roshanak, F. (2019). Application of nature inspired optimization algorithms in optimum positioning of pump-as-turbines in water distribution networks. Neural Computing and Applications, 31(11), 7489–7499. DOI 10.1007/s00521-018-3566-2. [Google Scholar] [CrossRef]
10. Alberizzi, J. C., Renzi, M., Righetti, M., Pisturo, G. R. (2019). Speed and pressure controls of pumps-as-turbines installed in branch of water-distribution network subjected to highly variable flow rates. Energies, 12(24), 4738. DOI 10.3390/en12244738. [Google Scholar] [CrossRef]
11. Ramos, H., Borga, A. (1999). Pumps as turbines: an unconventional solution to energy production. Urban Water, 1(3), 261–263. DOI 10.1016/S1462-0758(00)00016-9. [Google Scholar] [CrossRef]
12. Raja, W. A., Piazza, R. W. (1981). Reverse running centrifugal pumps as hydraulic power recovery turbines for seawater reverse osmosis systems. Desalination, 38, 123–134. DOI 10.1016/S0011-9164(00)86054-3. [Google Scholar] [CrossRef]
13. Yang, J. H., Yuan, Y. F., Jiang, Y. G., Ma, W. Y., Song, H. D. (2010). Performance predictions of reversed centrifugal pumps working as energy recovery turbines. Journal of Lanzhou University of Technology, 36(1), 54–56. [Google Scholar]
14. Yang, S. S., Shahram, D., Kong, F. Y. (2012). Theoretical, numerical and experimental prediction of pump as turbine performance. Renewable Energy, 48, 507–513. DOI 10.1016/j.renene.2012.06.002. [Google Scholar] [CrossRef]
15. Derakhshan S., Nourbakhsh A. (2008). Experimental study of characteristic curves of centrifugal pumps working as turbines in different specific speeds. Experimental Thermal and Fluid Science, 32(3), 800–807. DOI 10.1016/j.expthermflusci.2007.10.004. [Google Scholar] [CrossRef]
16. Singh, P., Nestmann, F. (2010). An optimization routine on a prediction and selection model for the turbine operation of centrifugal pumps. Experimental Thermal and Fluid Science, 34(2), 152–164. DOI 10.1016/j.expthermflusci.2009.10.004. [Google Scholar] [CrossRef]
17. Himanshu, N., Varun, V., Anoop, K., Sanjay, Y. (2011). Experimental investigation of centrifugal pump working as turbine for small hydropower systems. Energy Science and Technology, 1(1), 79–86. [Google Scholar]
18. Shahram, D., Bijan, M., Ahmad, N. (2009). Efficiency improvement of centrifugal reverse pumps. Journal of Fluids Engineering, 131(2), 800. DOI 10.1115/1.3059700. [Google Scholar] [CrossRef]
19. Singh P., Nestmann F. (2011). Internal hydraulic analysis of impeller rounding in centrifugal pumps as turbines. Experimental Thermal and Fluid Science, 35(1), 121–134. DOI 10.1016/j.expthermflusci.2010.08.013. [Google Scholar] [CrossRef]
20. Wang, T., Kong, F. Y., Yuan, S. Q., Yang, S. S., Chen, K. (2014). Design and experiment on pump as turbine with forward curved blades. Transactions of the Chinese Society for Agricultural Machinery, 45(12), 75–79. [Google Scholar]
21. Miao, S. C., Shi, Z. X., Wang, X. H., Shi, F. X., Shi, G. T. (2019). Impeller meridional plane optimization of pump as turbine. Science Progress, 103(1), 1–9. [Google Scholar]
22. Shahram, D., Nemat, K. (2014). Optimization, numerical, and experimental study of a propeller pump as turbine. Journal of Energy Resources Technology, 136(1), 91. DOI 10.1115/1.4026312. [Google Scholar] [CrossRef]
23. Tian, P., Huang, J., Shi, W. D., Zhou, L. (2019). Optimization of a centrifugal pump used as a turbine impeller by means of an orthogonal test approach. Fluid Dynamics and Materials Processing, 15(2), 139–151. [Google Scholar]
24. Yang, J. H., Li, H. L., Gong, Z. H., Xia, S. Q., Luo, K. K. (2014). Radial thrust behavior in centrifugal pump as hydro-turbine. Journal of Drainage and Irrigation Machinery Engineering, 32(1), 12–16. [Google Scholar]
25. Yang, J. H., Luo, K. K., Xia, S. Q., Li, H. L. (2014). Numerical calculation of axial thrust in a centrifugal pump working as hydraulic turbine. Journal of Lanzhou University of Technology, 40(1), 41–45. [Google Scholar]
26. Shi, G. T., Yang, J. H., Miao, S. C., Wang, X. H. (2016). Unsteady calculation of pressure pulsations within hydraulic turbine under different entrance sections. Journal of Aerospace Power, 31(3), 1228–1235. [Google Scholar]
27. Shi, G. T., Yang, J. H., Miao, S. C., Li, T. L. (2015). Calculation of pressure fluctuation within volute of hydraulic turbine under different guide vane numbers. Journal of Aerospace Power, 30(5), 1228–1235. [Google Scholar]
28. Yang, S. S., Kong, F. Y., Zhang, X. P., Huang, Z. P., Cheng, J. (2012). Simulation and analysis of unsteady pressure fluctuation in hydraulic turbine. Transactions of the Chinese Society of Agricultural Engineering, 28(7), 67–72. [Google Scholar]
29. Yang, S. S., Kong, F. Y., Cheng, J., Huang, Z. P., Zhang, X. P. (2013). Research on unsteady pressure field within a hydraulic turbine volute. Engineering Mechanics, 30(2), 388–393. [Google Scholar]
30. Yang, J. H., Li, T. L. (2015). Influence of volute configurations on radial force of hydraulic turbine. Journal of Drainage and Irrigation Machinery Engineering, 33(8), 651–655, 680. [Google Scholar]
31. Miao, S. C., Yang, J. H., Shi, G. T., Wang, T. T. (2015). Blade profile optimization of pump as turbine. Advances in Mechanical Engineering, 7(9), 1–9. DOI 10.1177/1687814015605748. [Google Scholar] [CrossRef]
32. Launder, B. E., Spalding, D. B. (1972). Lectures in mathematic models of turbulence. London: Academic press. [Google Scholar]
33. Help Navigator (2019). ANSYS CFX, release 12.0 cfx-solver modeling guide. [Google Scholar]
34. ANSYS. Inc. (2009). ANSYS fluent 12. 0 user’s guide. New Hapmpshire: ANSYS Inc. [Google Scholar]
35. John, D. A. (1995). Computational fluid dynamics: the basic with application. McGraw Hill: USA. [Google Scholar]
36. Wu, W. M., Zhou, C. D. (2020). A numerical study of the tip wake of a wind turbine impeller using extended proper orthogonal decomposition. Fluid Dynamics & Materials Processing, 16(5), 883–901. DOI 10.32604/fdmp.2020.010407. [Google Scholar] [CrossRef]
37. Lappa, M., Gili, P., Frulla, G., D’Oriano, V., Visone, M. (2015). A practical engineering approach to the design and manufacturing of a mini kw bladewind turbine: definition, optimization and CFD Analysis. Fluid Dynamics and Materials Processing, 11(3), 257–277. [Google Scholar]
38. Miao, S. C., Yang, J. H., Shi, F. X., Wang, X. H., Shi, G. T. (2018). Research on energy conversion characteristic of pump as turbine. Advances in Mechanical Engineering, 10(4), 1–10. DOI 10.1177/1687814018770836. [Google Scholar] [CrossRef]
39. Hatami, M., Ganji, D. D., Gorji-Bandpy, M. (2014). Numerical study of finned type heat exchangers for ICEs exhaust waste heat recovery. Case Studies in Thermal Engineering, 4, 53–64. DOI 10.1016/j.csite.2014.07.002. [Google Scholar] [CrossRef]
40. Hatami, M., Ganji, D. D., Gorji-Bandpy, M. (2015). Experimental and numerical analysis of the optimized finned-tube heat exchanger for OM314 diesel exhaust exergy recovery. Energy Conversion and Management, 97, 26–41. DOI 10.1016/j.enconman.2015.03.032. [Google Scholar] [CrossRef]
41. Hatami, M., Cuijpers, M. C. M., Boot, M. D. (2015). Experimental optimization of the vanes geometry for a variable geometry turbocharger (VGT) using a Design of Experiment (DoE) approach. Energy Conversion and Management, 106, 1057–1070. DOI 10.1016/j.enconman.2015.10.040. [Google Scholar] [CrossRef]
42. Jafaryar, M., Kamrani, R., Gorji-Bandpy, M., Hatami, M., Ganji, D. D. (2016). Numerical optimization of the asymmetric blades mounted on a vertical axis cross-flow wind turbine. International Communications in Heat and Mass Transfer, 70, 93–104. DOI 10.1016/j.icheatmasstransfer.2015.12.003. [Google Scholar] [CrossRef]
43. Wang, L., An, C. G., Wang, N. N., Ping, Y. M. (2020). Numerical simulation of axial inflow characteristics and aerodynamic noise in a large-scale adjustable-blade fan. Fluid Dynamics & Materials Processing, 16(3), 585–600. DOI 10.32604/fdmp.2020.09611. [Google Scholar] [CrossRef]
44. Cheng, H., Du, G. S., Zhang, M., Wang, K., Bai, W. B. (2020). Determination of the circulation for a large-scale wind turbine blade using computational fluid dynamics. Fluid Dynamics & Materials Processing, 16(4), 685–698. DOI 10.32604/fdmp.2020.09673. [Google Scholar] [CrossRef]
 | This work is licensed under a Creative Commons Attribution 4.0 International License, which permits unrestricted use, distribution, and reproduction in any medium, provided the original work is properly cited. |