DOI: 10.32604/fdmp.2021.011744
ARTICLE
Numerical Study of Airborne Droplets Propagation Inside a Hospital Consulting Room
1North China Electric Power University, Baoding, 071000, China
2Affiliated Hospital of Hebei University, Baoding, 071000, China
*Corresponding Authors: Yu Zhou. Email: zhou_yu0707@163.com; Shen Ji. Email: jishen1005@163.com
Received: 28 May 2020; Accepted: 21 December 2020
Abstract: The outbreak of Corona Virus (COVID-19) has spread over a large number of countries. The virus is typically transported inside liquid droplets produced by human beings. As a result, doctors operating in the consulting rooms of hospitals are potentially exposed to high risk. Taking into account the evaporation of droplets and using a hybrid Eulerian-Lagrangian framework to determine the airflow pattern and corresponding motion of droplets, in the present study, the motion of droplets is investigated with regard to the situation in which doctors check patients in front of their bed. A turbulence model (RNG k-ɛ) is used. The purification capacity of different ventilation systems is compared. The risk of cross-infection between doctors and patients is also evaluated.
Keywords: Droplet aerosols; numerical simulation; infection risk
In recent years, outbreaks of infectious diseases have become increasingly frequent, seriously endangering public health. Tuberculosis, severe acute respiratory syndrome (SARS) and influenza not only disrupt normal production and life but also cause a large number of infections and even death. Coronavirus disease 2019 (COVID-19) [1,2], which broke out in late 2019, has spread to most countries worldwide and infected more than 20 million people to date. Most patients emit aerosol particles carrying bacteria or viruses and spread respiratory infectious diseases to healthy people through breathing, coughing and sneezing, exposing doctors and patients in a consulting room to an elevated risk of cross-infection [3,4]. Therefore, improving the purification effects of existing ventilation systems and reducing cross-infection caused by the poor diffusion of aerosol particles is particularly important.
The diffusion of aerosol particles indoors has been studied extensively by many researchers. Zhang et al. [5] adopted a standard k-ε model and discrete random walk model to simulate particle distributions in a room with an under-floor air distribution system, and an experiment was carried out in a full-scale environmental chamber to verify the simulation results. The transmission of droplets produced by coughing was simulated by Kato et al. [6], while the propagation distance of the droplets was studied experimentally. Richmond Bryant et al. [7] conducted an experimental study on the propagation characteristics of droplet aerosols indoors with ordinary particles as the research object. Brohus [8] analyzed the hazards of personnel exposure to pollutants in a ventilated room by experimental and simulation methods.
Isolation rooms and operating rooms in hospitals have been used as the research objects in many studies. Many factors have a great influence on the airflow and pollutant distribution patterns in an isolation room, such as the ventilation strategies, furniture layout [9], movement of people and door opening/closing [10]. A numerical simulation was conducted by Zhao et al. [11] to quantify the number of particles emitted from a nurse that will enter the breathing zone or reach the body surface of a patient during patient care in an ISO Class-5 single-bed protective environment. These results were useful for developing best practices for preventing cross-infection during patient care. To obtain more accurate simulation results, Kao et al. [12] and Balocco et al. [13] established a cough model to numerically simulate the spread of viruses in isolation rooms with different ventilation system configurations and study the effect of ventilation systems on particle diffusion. Chow et al. [14] performed a laminar airflow study in a standard operating theatre using seven cases of computer simulation; the results stressed that a successful outcome in preventing airborne infection depends as much on resolving human factors as on overcoming technical obstacles.
The object studied in this manuscript is a typical consulting room in many hospitals, which has a specific ventilation system and layout of facilities. Since droplets are emitted by occupants indoors, the influence of personnel on their transmission is also considered to investigate the transport of droplet aerosols and the risk of cross-infection. The purification capacity of the ventilation system is numerically studied in different examination bed arrangements and inlet velocities. Compared to experimental methods, numerical simulations are not only useful for predicting droplet aerosol diffusion tracks and regional concentrations but also save time and reduce costs.
Considering the efficiency and accuracy of calculation [15], the RNG  turbulence model is adopted in this manuscript to simulate indoor airflow. Air can be regarded as a three-dimensional, incompressible, stable, turbulent and continuous fluid, which is governed by a series of equations as follows [16]:
Mass equation:

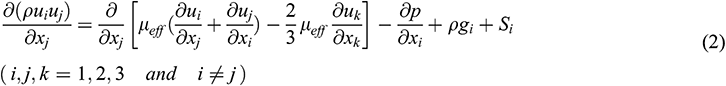
Momentum equation:
Energy equation:

where ui and gi are the velocity and the gravitational acceleration in the xi direction, respectively. The pressure is expressed as p, the air density is ρ and the temperature is T. The subscript below each variable refers to the effective parameter, such as µeff is the dynamic viscosity, τeff is the stress tensor and λeff is the thermal conductivity. The specific energy e, momentum sink Si and heat source Sh are all defined as zero in the equation.
For indoor air, which is regarded as a continuum, because particles are regarded as discrete media, the Lagrangian method [17] is used to track the propagation trajectory. By equating the particle inertia with external forces, the motion equation of the particle in the x-direction in Cartesian coordinates can be obtained as:

where up and ρp are the velocity and density of the particle, respectively. Considering that the particles are subject to the Saffman lifting force and thermophoretic force, Fi represents the additional forces per unit mass [18]. FD(u-up) is the drag force per unit particle mass, and for microscopic particles (diameter = 1–10 μm), FD is set as:

where µ is the dynamic air viscosity and dp is the diameter of the particle. The Cunningham correction coefficient in the Stokes drag formula (5) can be expressed as:

when we consider the velocity slip of the wall in the mechanics of rarefied gas. Here, γ is the mean free path of gaseous molecules.
Ignoring the effect of nonvolatile on droplet aerosols, the evaporation model is simplified as a single component. The evaporation rate of droplets depends on the gradient of diffusion flux, and the velocity of vapor entering the air term on the surface of droplets is determined by the gradient of vapor concentration on the surface of droplets and air.

where  refers to the droplet evaporation rate. c is the mass transfer coefficient, which is estimated by the correlation at the air-water interface [19]. Cs and C∞ are the water vapor molar concentrations at the droplet aerosol surface and in the carrier phase, respectively.
The above equations are discretized into algebraic equations by the finite volume method, and the coupling between velocity and pressure is solved by the semi-implicit method for pressure linked equations (SIMPLE) algorithm [20]. In the course of discretization, the power-law scheme and the 2nd-order central difference are implemented for the convection and diffusion terms, respectively.
2.2 Physical Model and Computational Grids
A hospital consulting room is taken as the modelling object. To facilitate the calculation, the physical models in the room are simplified. The air inlet and outlet are rectangular settings at the top of the room. The table and cabinet are placed against the inner wall. There are two arrangements of the examination bed: one is located at the corner, and the other is located in the middle of the room, named Position A and Position B, respectively. The main structure and arrangement of the consulting room is shown in Fig. 1, and the indoor related parameters are listed in Tab. 1.
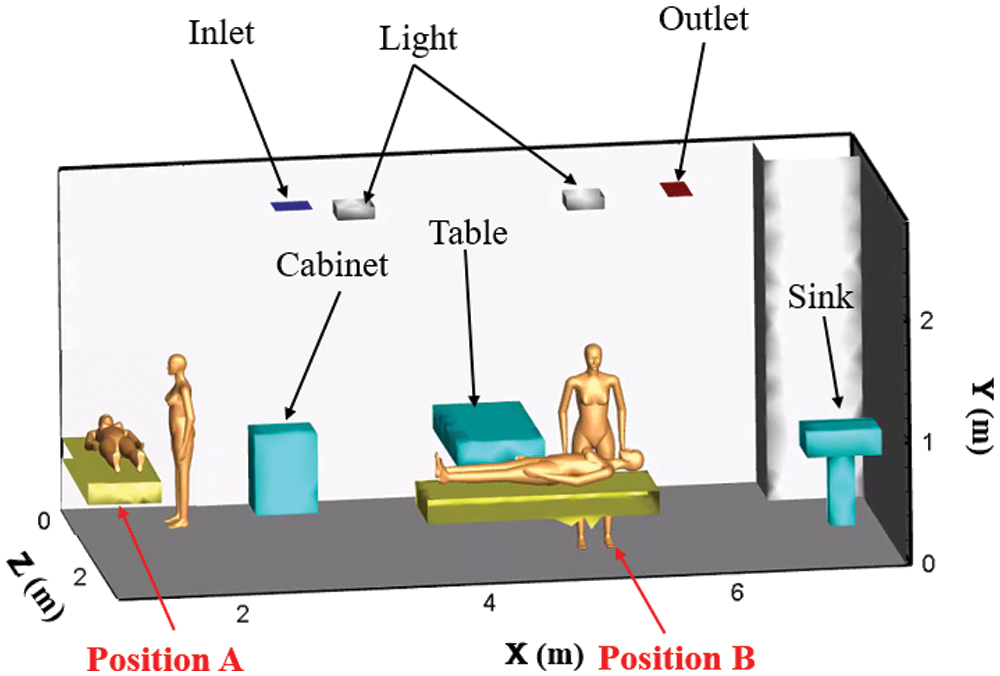
Figure 1: The main structure and arrangement of the consulting room
Table 1: Indoor related parameters
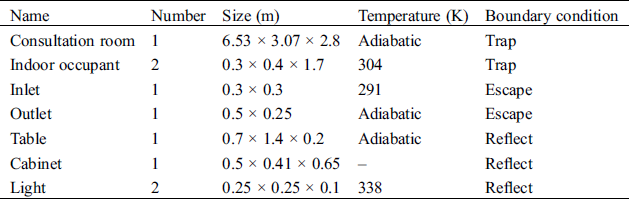
The accuracy of the numerical simulation is improved with the increase in grids [21]. To ensure accuracy, ICEM software is used to discretize the geometric model. The nonuniform staggered grid system is employed in the present study with denser grid clustering near the bounded walls to resolve the boundary layer properly. According to different meshing methods in Position A, the relative error is calculated by the average velocity of the X = 2.6 m surface in Tab. 2. The grid cell sizes of the human body and wall are set as 1.5 cm and 5 cm, respectively, according to which the relative error of the grid can be less than 5%. Moreover, when the number of grids is increased to 371,856, the relative error between two coherent meshes is quite small. As mentioned above, 320,426 is chosen as the total number of grids. The mesh generation of Position A is displayed in Fig. 2, and the same approach is also applied to Position B.
Table 2: Independence verification of grid
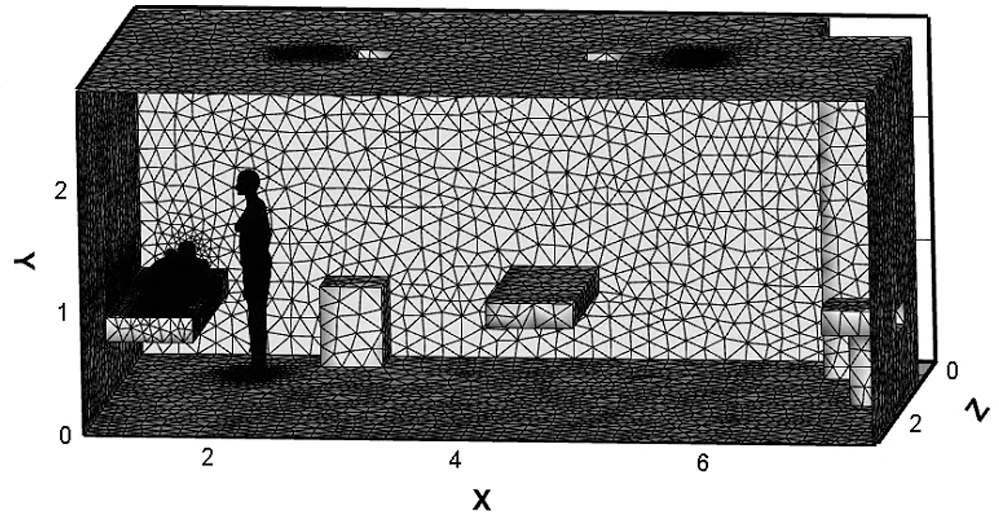
Figure 2: Mesh generation
2.3 Validation of Numerical Model
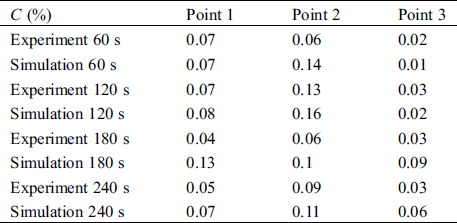
The accuracy of the model is particularly important for the results. For verification of the numerical model, the same test points are selected by Zhang et al. [22], as shown in Tab. 3. The results are compared by a dimensionless concentration, which can be defined as:

where C(x,t) is the average concentration of droplet aerosols at the test point and C0 is the initial concentration of droplet aerosols expelled from the mouth. It is observed that the simulation values are in good agreement with the experimental data. For the three different points, the maximum differences of C(%) are 0.09%, 0.08% and 0.06%, indicating that the present numerical method can reasonably predict the droplet aerosol distribution.
Table 3: The dimensionless concentration of experiment and simulation results
In the simulation, the inlet and outlet boundary conditions for the particles are set as “Escape”, and the boundary conditions on the walls for the particles are set as “Trap” [23]. In a realistic diffusion process, a particle may either rebound from or remain attached to a surface when it impacts the surface [24]. Moreover, the attached particle may be resuspended again in the air flow fields [25]. Nevertheless, particle rebound and resuspension are not considered in this study. It is assumed that all the particles will be attached to the surface and will never be resuspended once they impact the walls. Under the condition of convergence, the time step of the numerical simulation is 0.1 s. Based on this condition, the tracking simulation is set to 300 s.
A cough is used as the injection mode of the droplet aerosols in this manuscript. The time of occurrence is 0 s, lasting for 2 s, with a velocity of 10.8 m/s. The diameter and density of droplet aerosols are chosen as 3 µm and 1000 kg/m3, respectively [26]. The airflow temperature of coughing is 308 K. Considering evaporation, the initial droplet aerosols are assumed to consist of 98.2% water and 1.8% solid in volume [27]. All the simulated cases are shown in Tab. 4.
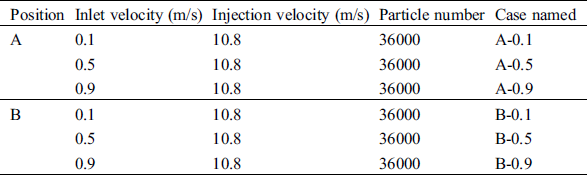
Fig. 3 shows the distribution of droplet aerosols under six different cases. The droplet aerosols are concentrated in the facial area of the patient and doctor first and spread to the upper space gradually. At the same time, almost no particles exist on the right side of the room from 1 s to 20 s. At the end of the numerical simulation, the droplet aerosols are spread to the whole indoor space. With the increase in the inlet velocity, the change in particle distribution during the first 20 s is not obvious.
Figure 3: Droplet aerosols diffusion under different cases (a) A-0.1: 1 s, 3 s, 20 s and 300 s (b) A-0.5: 1 s, 3 s, 20 s and 300 s (c) A-0.9: 1 s, 3 s, 20 s and 300 s (d) B-0.1: 1 s, 3 s, 20 s and 300 s (e) B-0.5: 1 s, 3 s, 20 s and 300 s (f) B-0.9: 1 s, 3 s, 20 s and 300 s
In Position B, the diffusion area of droplet aerosols from 20 s to 300 s is larger than that in the corner. Especially at 300 s, even if the inlet velocity is only 0.1 m/s, the particle diffusion effect is greatly improved. The formation of vortices at the corner of the room is not conducive to the spread of droplet aerosols. However, when the examination bed is close to the center of the indoor flow field, the airflow organization is improved. Therefore, Position B is more conducive to the diffusion of droplet aerosols. All the flow fields are shown in Fig. 4.
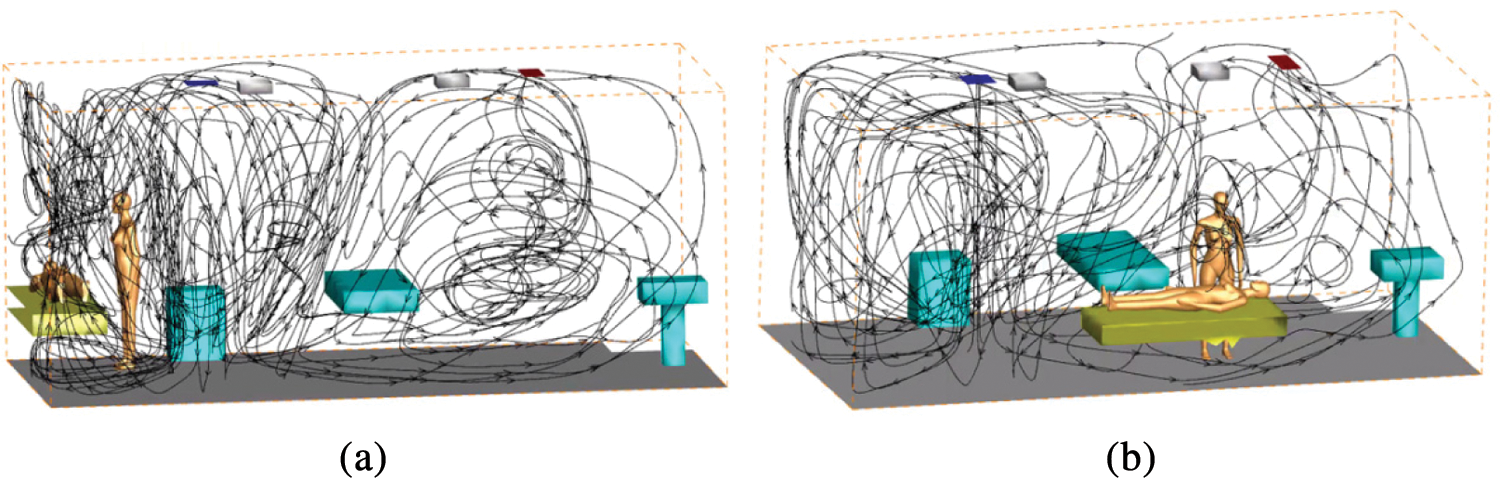
Figure 4: The streamline of numerical simulation of entire indoor area (a) Position A (b) Position B
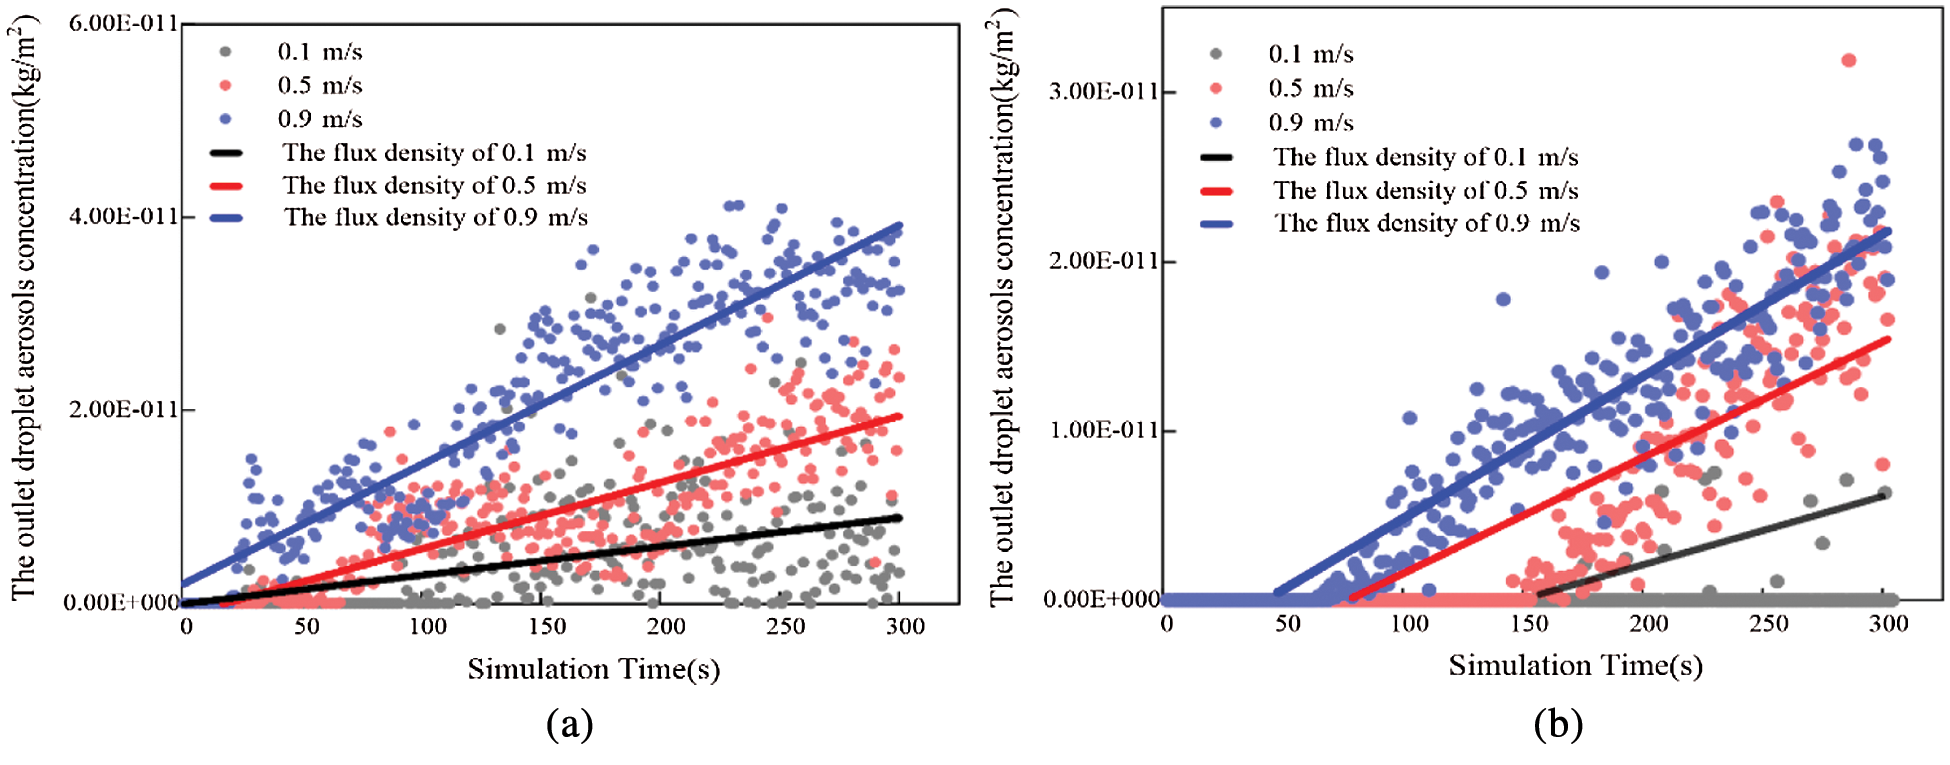
Figure 5: The variation tendency of outlet droplet aerosols concentration in different positions (a) Position A (b) Position B
Fig. 5a shows that with increasing simulation time, the droplet aerosol concentration at the outlet also increases gradually. Therefore, the number of droplet aerosols discharged from the room to the outside is enlarged. The time when droplet aerosols appear at the outlet is delayed with increasing inlet velocity. When the velocities are 0.1 m/s, 0.5 m/s and 0.9 m/s, the occurrence times of droplet aerosols at the outlet are 62 s, 146 s and 176 s, respectively. The earliest time is presented in the case of A-0.9, the particle concentration plot of which is also larger than the others. The flux densities through the outlet are 1.36E-13 kg/(m2·s), 6.17E-14 kg/(m2·s) and 2.91E-14 kg/(m2·s) when the velocities are enlarged from 0.1 m/s to 0.9 m/s, respectively. The larger the inlet velocity is, the higher the efficiency of discharging indoor particles.
Under three different inlet velocities, the time when droplet aerosols appear at the outlet is approximately 22 s in Position B. The flux density through the outlet at high inlet velocity is generally larger than that at low velocity during the whole simulation time. Compared to the corresponding cases, the droplet aerosols are purified earlier, and the amount of particles is larger in Fig. 5b. Therefore, the purification effect of Position B is better than that at Position A.
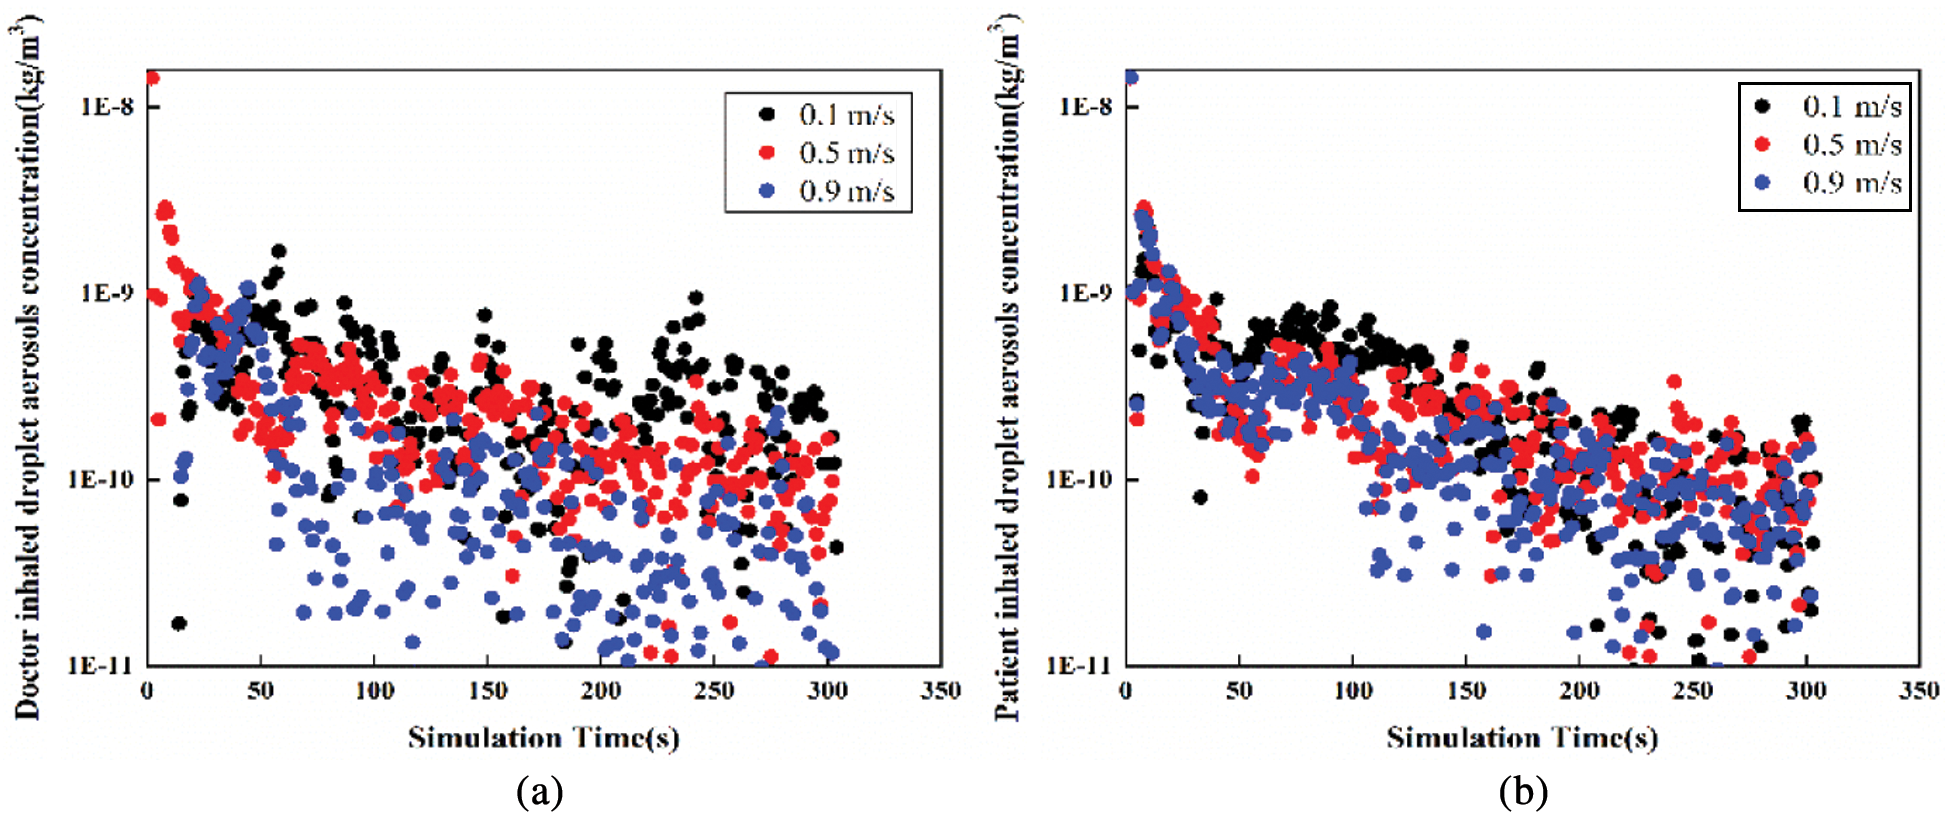
Figure 6: The variation tendency of droplet aerosols concentration with time in Position A (a) Doctor inhaled (b) Patient inhaled
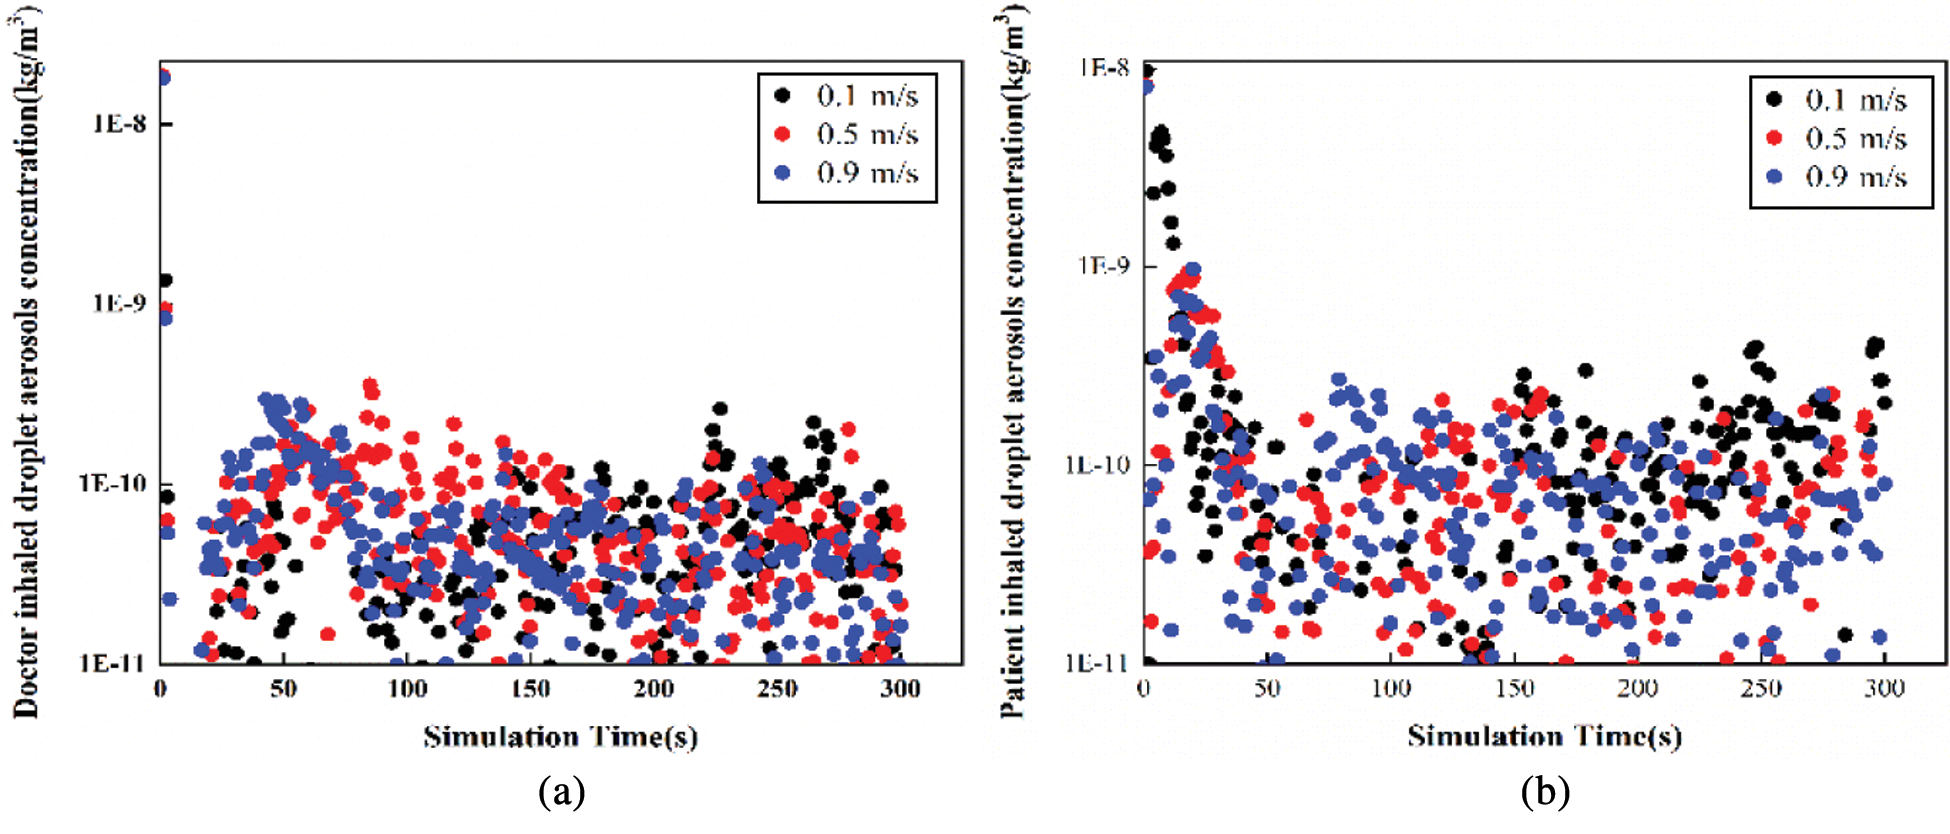
Figure 7: The variation tendency of droplet aerosols concentration with time in Position B (a) Doctor inhaled (b) Patient inhaled
According to Figs. 6 and 7, the variation tendency of droplet aerosol concentration with time is shown in two positions. In Position A, the concentration of droplet aerosols inhaled by patients and doctors decreased with increasing simulation time. The maximum droplet aerosol concentrations of the occupants are both presented in the initial time with a value of 1.4E-8 kg/m3. The increasing inlet velocity leads to a lower concentration of droplet aerosols inhaled by the occupants. However, under the three different cases, the concentration of particles inhaled by the patients and doctors is more even in Position B. The inlet velocity is not sensitive to the effect of the patient’s or doctor’s inhaled droplet aerosol concentration; both concentrations are mainly concentrated in a range of 1E-11 to 2.5E-10 kg/m3. Low inlet velocity can have a good diffusion effect.
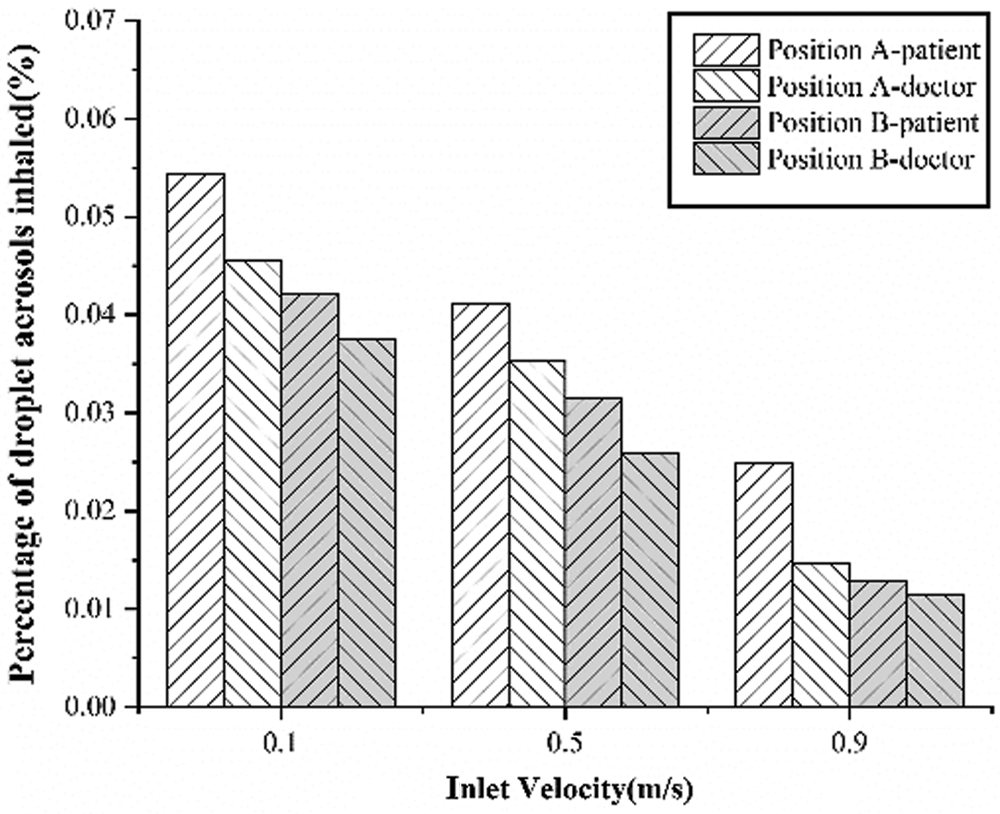
Figure 8: The variation tendency of the percentage of droplet aerosols inhaled
Fig. 8 shows the variation tendency of the percentage of droplet aerosols inhaled with inlet velocity. With increasing inlet velocity, the percentages of droplet aerosols inhaled by the doctors and patients both decrease. At all inlet velocities, the droplet aerosols inhaled by the patient are higher than those inhaled by the doctor. In addition, the droplet aerosol inhalation rate of the indoor occupants in Position B is lower than that in Position A at the same inlet velocity. It is shown that this approach can effectively reduce the risk of cross-infection when the examination bed is located in the middle of the room.
Taking a consulting room as an object, two common examination bed arrangements and the transmission characteristics of indoor droplet aerosols under different inlet velocities are analyzed by numerical simulation in this manuscript. The following conclusions are obtained.
1. Under the same conditions, when the examination bed is arranged in the centre of the room, droplet aerosols are discharged earlier by the existing ventilation system, which is more conducive to the diffusion of indoor particulate matter.
2. In both arrangements, the purification capacity of the ventilation system increases with increasing air velocity. In contrast, the ventilation system in Position B performs better at low air velocities.
3. By changing Position A to Position B, the infection risks of both doctors and patients are reduced with an increase in the percentage of droplet aerosols inhaled by the patient.
Funding Statement: The authors received no specific funding for this study.
Conflicts of Interest: The authors declare that they have no conflicts of interest to report regarding the present study.
1. Jensen, P. A., Lambert, L. A., Iademarco, M. F., Ridzon, R. (2006). Guidelines for preventing the transmission of mycobacterium tuberculosis in health-care settings, 2005. MMWR. Recommendations and reports/Centers for Disease Control, 54(R–17), 1–141. [Google Scholar]
2. World Health Organization. (2020). Risk communication and community engagement (RCCE) readiness and response to the 2019 novel Coronavirus (2019-nCoV). https://apps.who.int/iris/handle/10665/272767?locale-attribute=en&. [Google Scholar]
3. Tang, J. W., Li, Y., Eames, I., Chan, P. K. S., Ridgway, G. L. (2006). Factors involved in the aerosol transmission of infection and control of ventilation in healthcare premises. Journal of Hospital Infection, 64(2), 100–114. DOI 10.1016/j.jhin.2006.05.022. [Google Scholar] [CrossRef]
4. Grinchuk, P. S., Fisenko, E. I., Fisenko, S. P., Danilova-Tretiak, S. M. (2020). Isothermal evaporation rate of deposited liquid aerosols and the SARS-CoV-2 coronavirus survival. Aerosol and Air Quality Research, 20, 1–6. DOI 10.4209/aaqr.2020.07.0428. [Google Scholar] [CrossRef]
5. Zhang, Z., Chen, Q. (2006). Experimental measurements and numerical simulations of particle transport and distribution in ventilated rooms. Atmospheric Environment, 40(18), 3396–3408. DOI 10.1016/j.atmosenv.2006.01.014. [Google Scholar] [CrossRef]
6. Zhu, S., Kato, S., Yang, J. H. (2006). Study on transport characteristics of saliva droplets produced by coughing in a calm indoor environment. Building and Environment, 41(12), 1691–1702. DOI 10.1016/j.buildenv.2005.06.024. [Google Scholar] [CrossRef]
7. Richmond-Bryant, J., Eisner, A. D., Brixey, L. A., Wiener, R. W. (2010). Transport of airborne particles within a room. Indoor Air, 16(1), 48–55. DOI 10.1111/j.1600-0668.2005.00398.x. [Google Scholar] [CrossRef]
8. Brohus, H. (1997). Personal exposure to contaminant sources in ventilated rooms (Ph.D. Thesis). Aalborg University, Denmark. [Google Scholar]
9. Cheong, K. W. D., Phua, S. Y. (2006). Development of ventilation design strategy for effective removal of pollutant in the isolation room of a hospital. Building and Environment, 41(9), 1161–1170. DOI 10.1016/j.buildenv.2005.05.007. [Google Scholar] [CrossRef]
10. Eames, I., Shoaib, D., Klettner, C. A., Taban, V. (2009). Movement of airborne contaminants in a hospital isolation room. Journal of the Royal Society Interface, 6(Suppl_6), S757–S766. [Google Scholar]
11. Zhao, B., Yang, C., Chen, C., Feng, C., Yang, X. et al. (2009). How many airborne particles emitted from a nurse will reach the breathing zone/body surface of the patient in iso class-5 single-bed hospital protective environments?—A numerical analysis. Aerosol Science and Technology, 43(10), 990–1005. DOI 10.1080/02786820903107925. [Google Scholar] [CrossRef]
12. Kao, P. H., Yang, R. J. (2006). Virus diffusion in isolation rooms. Journal of Hospital Infection, 62(3), 338–345. DOI 10.1016/j.jhin.2005.07.019. [Google Scholar] [CrossRef]
13. Balocco, C., Liò, P. (2010). Modelling infection spreading control in a hospital isolation room. Journal of Biomedical Science and Engineering, 03(07), 653–663. DOI 10.4236/jbise.2010.37089. [Google Scholar] [CrossRef]
14. Chow, T. T., Yang, X. Y. (2005). Ventilation performance in the operating theatre against airborne infection: Numerical study on an ultra-clean system. Journal of Hospital Infection, 59(2), 138–147. DOI 10.1016/j.jhin.2004.09.006. [Google Scholar] [CrossRef]
15. Chen, Q. (1995). Comparison of different models for indoor airflow computations. Numerical Heat Transfer, Part B: Fundamentals, 28(B), 353–369. DOI 10.1080/10407799508928838. [Google Scholar] [CrossRef]
16. Li, G. (2020). Simulation of the thermal environment and velocity distribution in a lecture hall. Fluid Dynamics & Materials Processing, 16(3), 549–559. DOI 10.32604/fdmp.2020.09219. [Google Scholar] [CrossRef]
17. Li, H., Yu, M., Zhang, Q., Wen, H. (2020). A numerical study of the aerodynamic characteristics of a high-speed train under the effect of crosswind and rain. Fluid Dynamics & Materials Processing, 16(1), 77–90. DOI 10.32604/fdmp.2020.07797. [Google Scholar] [CrossRef]
18. Li, A., Ahmadi, G. (1992). Dispersion and deposition of spherical particles from point sources in a turbulent channel flow. Aerosol Science and Technology, 16(4), 209–226. DOI 10.1080/02786829208959550. [Google Scholar] [CrossRef]
19. Ranz, W. E., Marshall, W. R. (1952). Evaporation from drops. Chemical Engineering Progress, 48(3), 141–146. [Google Scholar]
20. Patankar, S. K. (1980). Numerical heat transfer and fluid flow (Ph.D. Thesis). Hemisphere, Washington DC. [Google Scholar]
21. Dai, Z. Y., Li, T., Zhang, W. H., Zhang, J. Y. (2020). Numerical study on aerodynamic performance of high-speed pantograph with double strips. Fluid Dynamics & Materials Processing, 16(1), 31–40. DOI 10.32604/fdmp.2020.07661. [Google Scholar] [CrossRef]
22. Zhang, Y., Feng, G., Bi, Y., Cai, Y., Cao, G. (2019). Distribution of droplet aerosols generated by mouth coughing and nose breathing in an air-conditioned room. Sustainable Cities and Society, 51, 101721. DOI 10.1016/j.scs.2019.101721. [Google Scholar] [CrossRef]
23. Zhao, B., Zhang, Y., Li, X., Yang, X., Huang, D. (2004). Comparison of indoor aerosol particle concentration and deposition in different ventilated rooms by numerical method. Building and Environment, 39(1), 1–8. DOI 10.1016/j.buildenv.2003.08.002. [Google Scholar] [CrossRef]
24. Zhao, B., Chen, C., Yang, X., Lai, A. C. K. (2010). Comparison of three approaches to model particle penetration coefficient through a single straight crack in a building envelope. Aerosol Science and Technology, 44(6), 405–416. DOI 10.1080/02786821003689937. [Google Scholar] [CrossRef]
25. Zhou, B., Tan, B. Z., Tan, Z. C. (2011). How particle resuspension from inner surfaces of ventilation ducts affects indoor air quality—A modeling analysis. Aerosol Science and Technology, 45(8), 996–1009. DOI 10.1080/02786826.2011.576281. [Google Scholar] [CrossRef]
26. Cheng, Y. H., Wang, C. H., You, S. H., Hsieh, N. H., Chen, W. Y. et al. (2016). Assessing coughing-induced influenza droplet transmission and implications for infection risk control. Epidemiology and Infection, 144(2), 333–345. DOI 10.1017/S0950268815001739. [Google Scholar] [CrossRef]
27. Graham, D. I., James, P. W. (1996). Turbulent dispersion of particles using eddy interaction models. International Journal of Multiphase Flow, 22(1), 157–175. DOI 10.1016/0301-9322(95)00061-5. [Google Scholar] [CrossRef]
 | This work is licensed under a Creative Commons Attribution 4.0 International License, which permits unrestricted use, distribution, and reproduction in any medium, provided the original work is properly cited. |