DOI: 10.32604/fdmp.2021.011443
ARTICLE
Improving Mechanical Properties of Vitrified Umbilical Arteries with Magnetic Warming
Institute of Biothermal Science & Technology, University of Shanghai for Science and Technology, Shanghai, 200093, China
*Corresponding Author: Yi Xu. Email: xuyi@usst.edu.cn
Received: 09 May 2020; Accepted: 14 December 2020
Abstract: The damage caused by thermal stress during rewarming vitrified biosamples is one of the major obstacles for clinical purposes. Magnetic warming is a highly effective approach to overcome this hurdle and can achieve rapid and spatially homogeneous heating. The current research investigates the effects of magnetic warming on the histological and biomechanical properties of the vitrified umbilical arteries (UAs) through experiments and simulation. The results of experiments show that, for the case of magnetic warming comparing with the conventional water bath, magnetic warming presents better preservation of extracellular matrix (ECM), collagen fibers, elastic fibers, and muscle fibers of the umbilical artery. There is no significant difference between magnetothermal and fresh UAs (p > 0.05) in the elastic modulus and the ultimate stress. The theoretical results reveal that the maximum temperature difference  inside the biosample is 1.117 ± 0.649°C, and the maximum thermal stress
  is 0.026 ± 0.016 MPa. However, for the case of conventional water bath,
  is 32.342 ± 0.967°C and
  is 1.453 ± 0.047 MPa. Moreover, we have arrived at the same conclusion by simulation as theoretical calculation have. Therefore, magnetic warming can effectively reduce the thermal stress damage of biological samples during the warming period due to more uniform and rapid warming. These results confirm that magnetothermal can significantly improve the mechanical properties of large size cryopreserved tissues or organs such as UAs.
Keywords: Umbilical artery; vitrified; magnetic warming; mechanical properties; thermal stress
Vessels disease is a common clinical disease, which can lead to vessel occlusion or bleeding [1]. Some severe cases may also need vessel transplantation. As an ideal material for small-caliber homologous transplantation of vessels, umbilical arteries (UAs) can be used to solve vascular defects and other problems in clinical surgery [2,3]. To improve the utilization of donor umbilical arteries, the effective and long-term cryopreservation of them before treatment is essential [4–6]. Recently many methods are applied to the cryopreservation of biomaterials, such as slow freezing and vitrification. So far, vitrified preservation is one of the most effective cryopreservation methods without phase transition from liquid to ice crystal [7], which may represent an interesting alternative to costly and time slow freezing of biological samples [8]. vitrification has been successfully applied to preserve human sperm and human ovarian tissue [9,10], and superior results of biomaterials have been obtained with vitrification compared to slow freezing. Vitrified blood vessels can maintain not only the viability of cells but also the structural integrity of collagen fibers and elastic fibers [11,12]. By using histological methods, cellular viability, and mechanical properties, Dahl et al. found that vitrification is a feasible storage method for blood vessel construct [13]. However, due to the low thermal conductivity of biological samples, non-uniform distribution temperature can induce thermal stress, and cracks may develop as a result of it [14]. Moreover, devitrification and ice crystal will occur if the temperature cannot exceed the critical cooling rates. The thermal stress and devitrification during warming can cause severe irreversible damage to blood vessels [15,16]. Therefore, it is still an urgent challenge to choose a fast and uniform warming method for vitrified blood vessels.
At present, warming biological materials can be achieved by several physical mechanisms including water bath, microwave, laser irradiation, and magnetic warming [17]. However, due to conduction or convection heating and low thermal conductivity of biological samples, the conventional approach of warming in the water bath creates a large temperature gradient, which induces non-uniformity thermal stresses and results in harmful or undesirable effects on the cryopreserved sample [18–20]. The microwave warming is susceptible to the characteristics of the biological material and the environment, and the depth of microwave penetration is limited. It is difficult to heat in a resonant cavity fast and uniformly [17,21]. Although the laser can realize a rapid warming, it is only applicable to warm small cell suspension [22]. Bischof’s group [23] developed a rapid and uniform heating method called nanowarming which uses mNPS to generate heat under an alternating magnetic field for thawing large biological samples. Nanoparticles (mNPS) have confirmed with biocompatibility and thermal properties, which are widely applied in medicine, such as translational advances in magnetic actuation, drug delivery, hyperthermia, and MRI [24,25]. Michael et al indicated that a heating rate of 150 °C/min was reached when a 1 mL solution system (water, glycerol, VS55) with 10 mg/ml Fe magnetic nanoparticle was heated in an insulated, inductive coil at 360 kHz and 20 kA/m. mNPs generate heating rates as high as 300 °C/min through the use of RF heating of magnetic nanoparticles, which reduces dramatically devitrification of vitrified samples [26,27]. Xu et al. [28] investigated the growth of ice crystals inhibited by mNPA by differential scanning calorimetry (DSC), which can reduce the damage of ice crystals to biomaterials during rewarming. The incorporation of the nanoparticles into fluid enhances heat transfer and the thermal conductivity is affected by the volume fraction and particle size of magnetic nanoparticles by computational work [29,30]. Manuchehrabadi et al. [31] further confirmed that magnetic warming can effectively improve the biological activity of human dermal fibroblasts, porcine arteries and porcine heart valves in volumes ranging from 1 to 50 ml. However, the research and application of magnetic warming are still in its infancy. The warming mechanism of magnetic warming on other biomaterials such as the UAs still has no systematic study, and the mechanical properties of vitrified biomaterials after magnetic warming remains to be further studied.
In this study, we utilized mNPs to warm vitrified UAs and analyzed the mechanical properties of UAs systematically. The results showed that mNPs improved the mechanical properties of cryopreserved UAs significantly. It is expected to provide important guidance for thawing the large size cryopreserved tissues or organs.
Umbilical cord tissues (about 20 cm in length) were obtained from a healthy newborn baby in aseptic condition, they were transferred to the laboratory immediately at 4°C for dissection. The human umbilical cord consists of one vein and two arteries, and each UA was cut into segments of 5 cm in length and flushed with phosphate-buffered saline (PBS, pH 7.4) for the following experiments. Different warming procedures were attempted including fresh group, water bath warming without drivepipe (W/O pipe, 37°C), water bath warming with drivepipe (W/ pipe, 37°C), and magnetic warming (Mag-warming). Each group repeated 4 times at least. The mNPs were iron oxide (Fe3O4) nanoparticles, 10 mg/ml. The particle size was about 10 nm. Except for special markings, all the reagents were purchased from Shanghai Pharmaceutical Group Chemical Reagent Co., Ltd., Shanghai, China.
2.2 Loading and Removal of Magnetic Nanoparticles
The UA segments were immersed 6 times for 15 min into vitrification solution VS55, which is a typical cryoprotectant mixture of 3.1 M DMSO, 2.2M propylene glycol, and 3.1 M formamide in a base Euro-Collins solution. To avoid osmotic damage, VS55 was loaded and removed with changing concentrations step-by-step, as Fig. 1A shown.
To avoid the toxicity of mNPs, UAs were immersed in VS55 solution for 6 times, and mNPs was added in the seventh round (as shown in Fig. 1B). The UAs were stored in PBS solution at 4°C for the next steps. The removal of VS55 and mNPs from the UAs samples must be done before further tests were conducted.
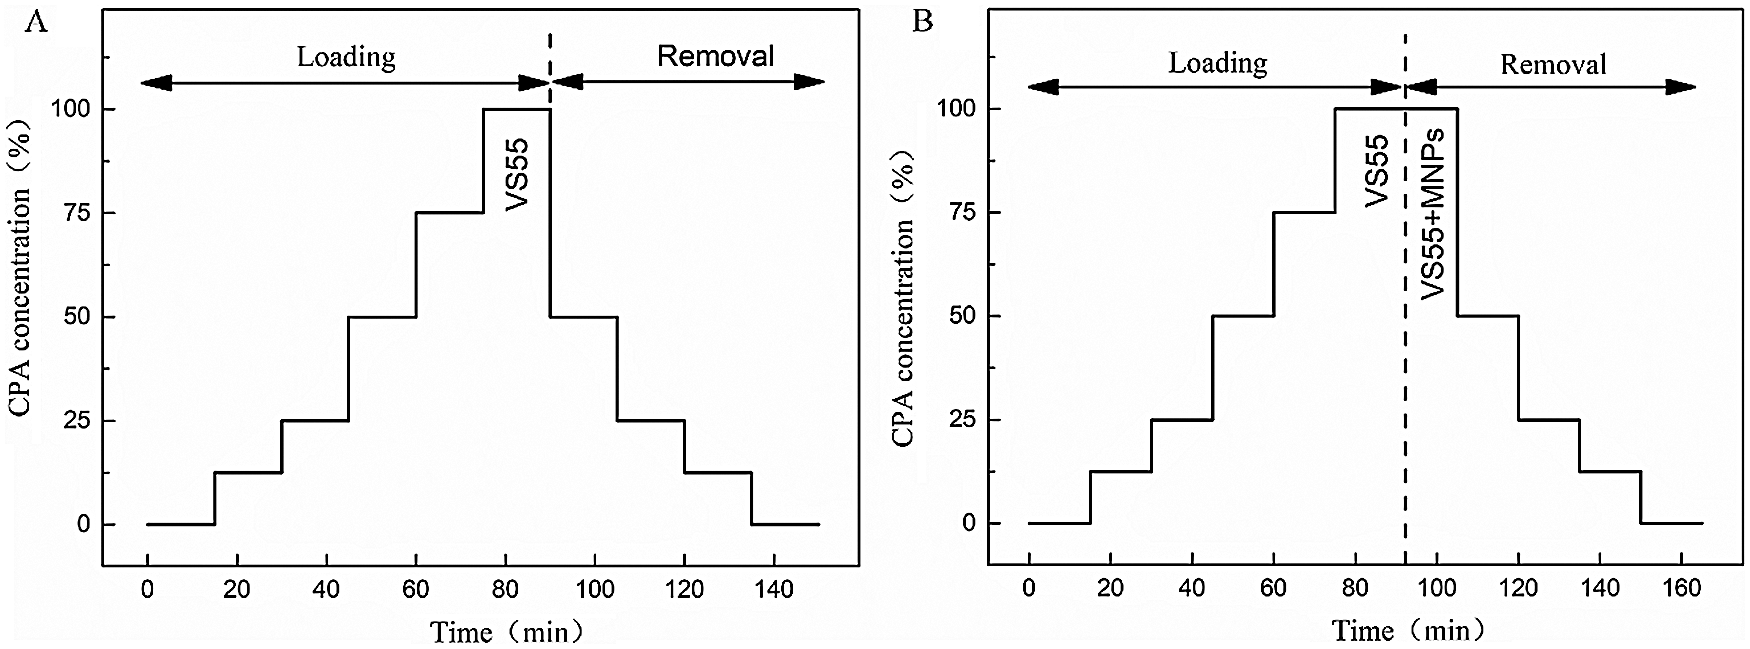
Figure 1: The loading and removal protocols of VS55 and mNPs. A. VS55 solution loading and removal for water bath warming case. B. VS55 and mNPs loading and removal for Mag-warming case
All samples were successfully vitrified and stored in liquid nitrogen, and the average cooling rate was around 18 °C/min which is fast enough to cover the critical cooling rate 2 °C/min of VS55. During warming, different warming procedures were attempted including water bath at 37°C without the outer drivepipe, water bath at 37°C with outer drivepipe, and magnetic warming. For the Mag-warming groups, the vitrified samples were warmed with an AC magnetic field at 764.8 kHz with 300 Gs (DM100, Nanoscale Biomagnetic, Spain) as shown in Fig. 2.
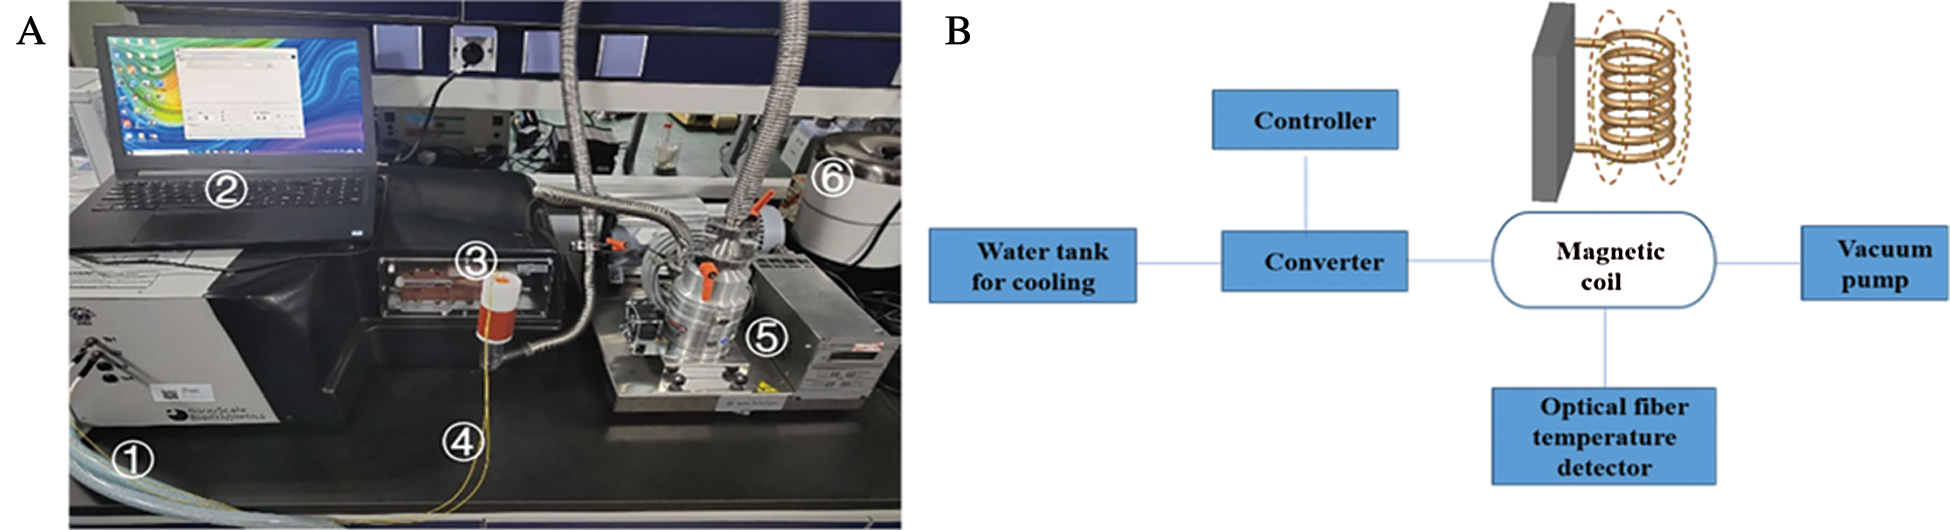
Figure 2: Photograph (A) and schematic illustration (B) of the magnetic induction heating system. The whole magnetic induction heating system consisted of ① pipe is connected to a water tank for cooling, ② controller, ③ a magnetic induction heating equipment, ④ an optical fiber temperature detector, ⑤ a vacuum pump, ⑥ a 37°C water bath and so on
Different concentrations of 1 mL mNPs solution were measured to obtain the average warming rate of mNPs solution at −150°C~−50°C under the conditions of different magnetic field strength and magnetic field frequency. As shown in Fig. 3, it presented that the magnetic warming rate had a positive relationship with magnetic field frequency. The warming rate reached the maximum 175 °C/min, when the mNPs concentration was 10 mg/mL, magnetic field strength was 300 Gs and magnetic field frequency was 764.8 kHz. To achieve the vitrification of UAs at the cooling and the maximum warming rate at the warming, the mNPs concentration in the VS55 solution was 4.6 mg/ml.
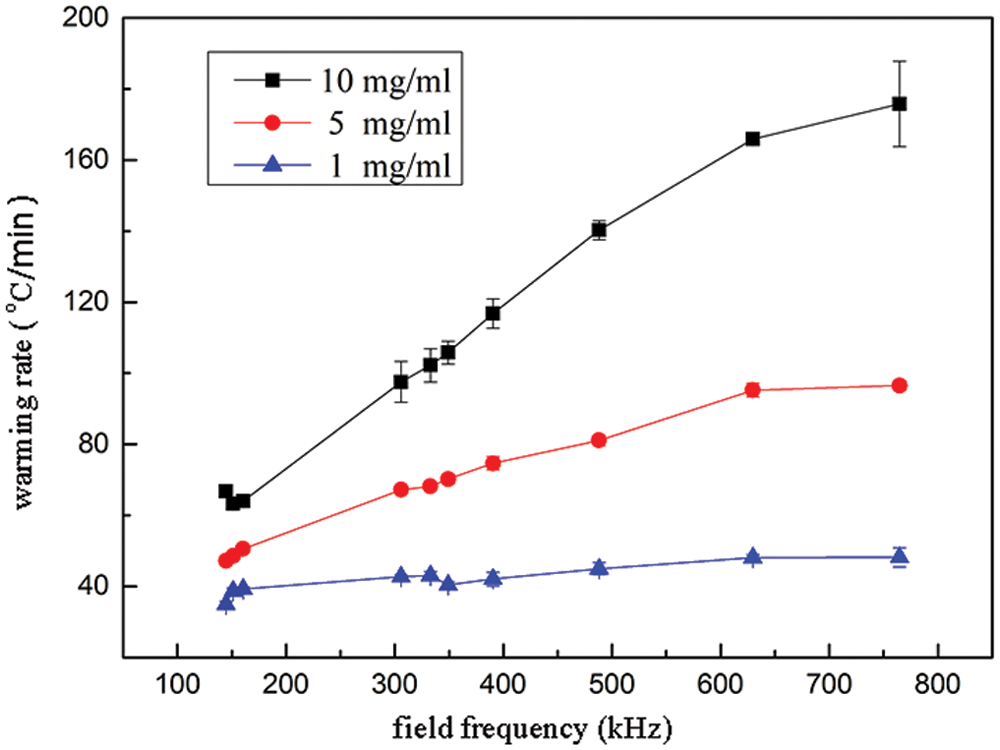
Figure 3: mNPs warming rate with different concentrations with magnetic field frequency
To evaluate the effect of warming methods on the tissue structure, UAs were processed for histomorphological observation. UAs were fixed in neutral-buffered formalin for 1 h, then emended in paraffin, sliced, and stained. H&E, Masson staining, and Weigert staining were performed to determine the presence of the extracellular matrix (ECM), collagen fibers, and elastic fibers. Images were acquired with a light microscope (Nikon Eclipse E100, Nikon, Japan).
As UAs is a viscoelastic material, and a comprehensive assessment is necessary to evaluate mechanical properties. The mechanical test of UAs was performed with the Dynamic Thermomechanical Analysis [32] (DMA Q800, TA Instruments, America). Three working modes were adopted as the following [33,34].
Control force mode: The UAs were stretched at a rate of 0.2 N/min until fracture failure. The tensile strain and stress were recorded to get the elastic modulus of samples.
Stress relaxation mode: The UAs were stretched at a rate of 50%/min to an initial strain of 50% and held for 20 min. The stress relaxation rate  was calculated as Eq. (1).

where  means the initial stress on the sample,
  means the stress at a specific time t.
Creep mode: The UAs were stretched to the stress of 0.4 N at a rate of 0.4 N/min and held for 20 min. The creep rate  was calculated as Eq. (2).

where  means the initial strain on the sample,
  means the strain at a specific time t.
To measure the elasticity modulus of UAs, the UAs was frozen to −20°C, −40°C, −60°C, −80°C, −100°C, −120°C, and −140°C at a rate of −10 °C/min respectively, and held for 5 min at these points. Then the UA sample was stretched at a rate of 1 N/min until fracture failure. The tensile strain and stress were recorded to get the elastic modulus of samples. E tests were repeated three times for the same condition.
To measure the thermal expansion coefficient β during cooling, the UAs soaked in VS55 were frozen to −140°C at a cooling rate of −10 °C/min, and then the temperature was raised to 0°C at a rate of 10 °C/min. A strain versus temperature was recorded.
2.6 Thermal Stress Studies Using COMSOL Multiphysics
A computational analysis was conducted for UAs which were considered as an infinitely long cylinder to evaluate the applicability and accuracy of our theoretical calculation results. After obtaining the elastic modulus E and thermal expansion coefficient β of UAs, the thermal stress of UAs during rewarming was predicted by using the thermal stress module in COMSOL. We assumed that mNPs were presented inside the UAs and VS55 solution uniformly. To know the temperature and stress change of the UAs during warming, the stress of the center, the external surfaces, and the internal surface of the UAs were calculated respectively. The schematic diagram of UAs cross-section nodes is shown in Fig. 4.
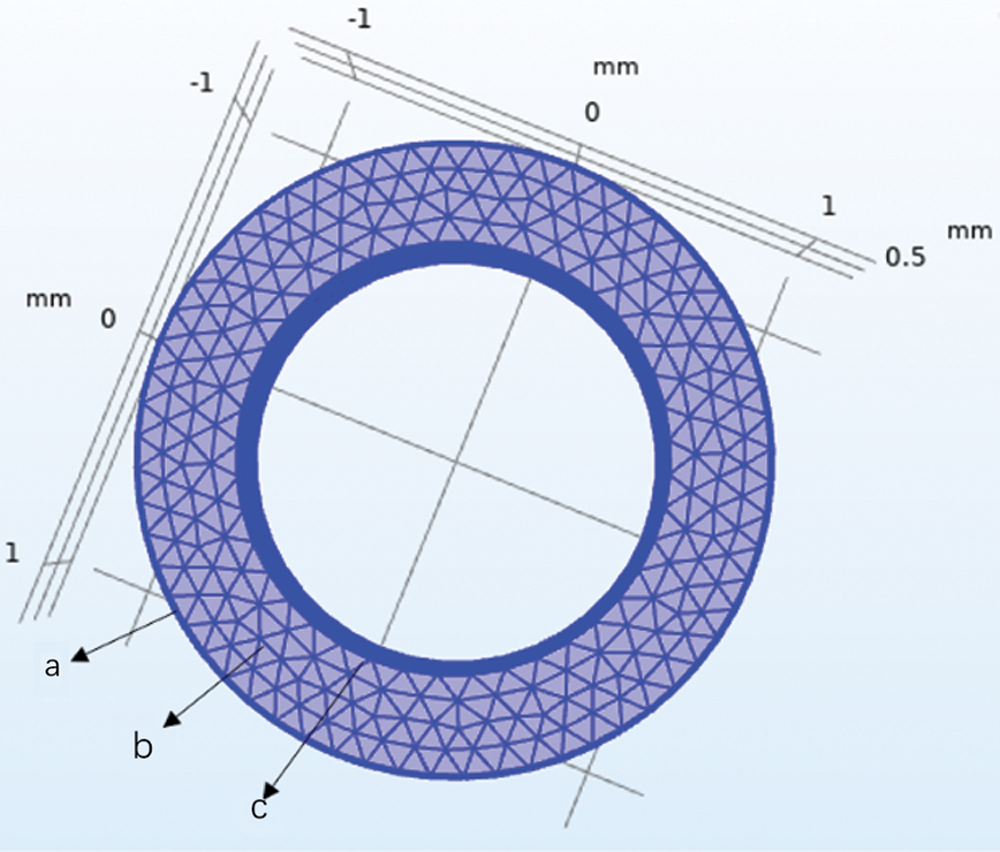
Figure 4: Schematic diagram of UAs cross-section nodes. a-External surfaces, b-Center surface, c-Internal surface
The physical model we chose to use was solid heat transfer. In this temperature range, heat transfer during the rewarming of biological tissue can be accurately described by the simplified equation:

where  is the density of tissue,
  is the thermal capacity of the tissue, T is the temperature, t is the time, k is the thermal conductivity, and Q is the energy generated due to nanowarmers.
The boundary and initial conditions during rewarming (convective) were taken as:

where T is the temperature the tissue surface, T = −196°C,  is the temperature of environment. Thermal properties were averaged to: k = 0.5 W/mK, Cp = 2100 J/kgK,
  = 1100 kg/m3 [31].
Assuming that the mechanical behavior of UAs can be described by an elastic model. According to [35], we obtained the radial stress  , circumferential stress
  and axial stress
  respectively as


where R1 is the internal diameter, R1 = 0.85 mm, R2 is the external diameter, R2 = 1.25 mm, E is the modulus of elasticity, is Poisson’s ratio,
  is the thermal expansion coefficient.
Data are expressed as mean ± standard deviation (SD). Statistical significance was determined by Duncan’s test, and the statistical significance was considered when p < 0.05, and p < 0.01 indicates a highly significant difference.
3.1 Morphological Analysis of Cryopreserved Umbilical Arteries
All samples dealt with warming methods showed well-defined normal morphology and structure macroscopically. However, the UAs in W/O pipe group were grossly fractured (n = 8, the fracture rate was 100%), while the fractures of UAs in the W/ pipe group and Mag-warming group were 12.5%, which was significantly reduced.
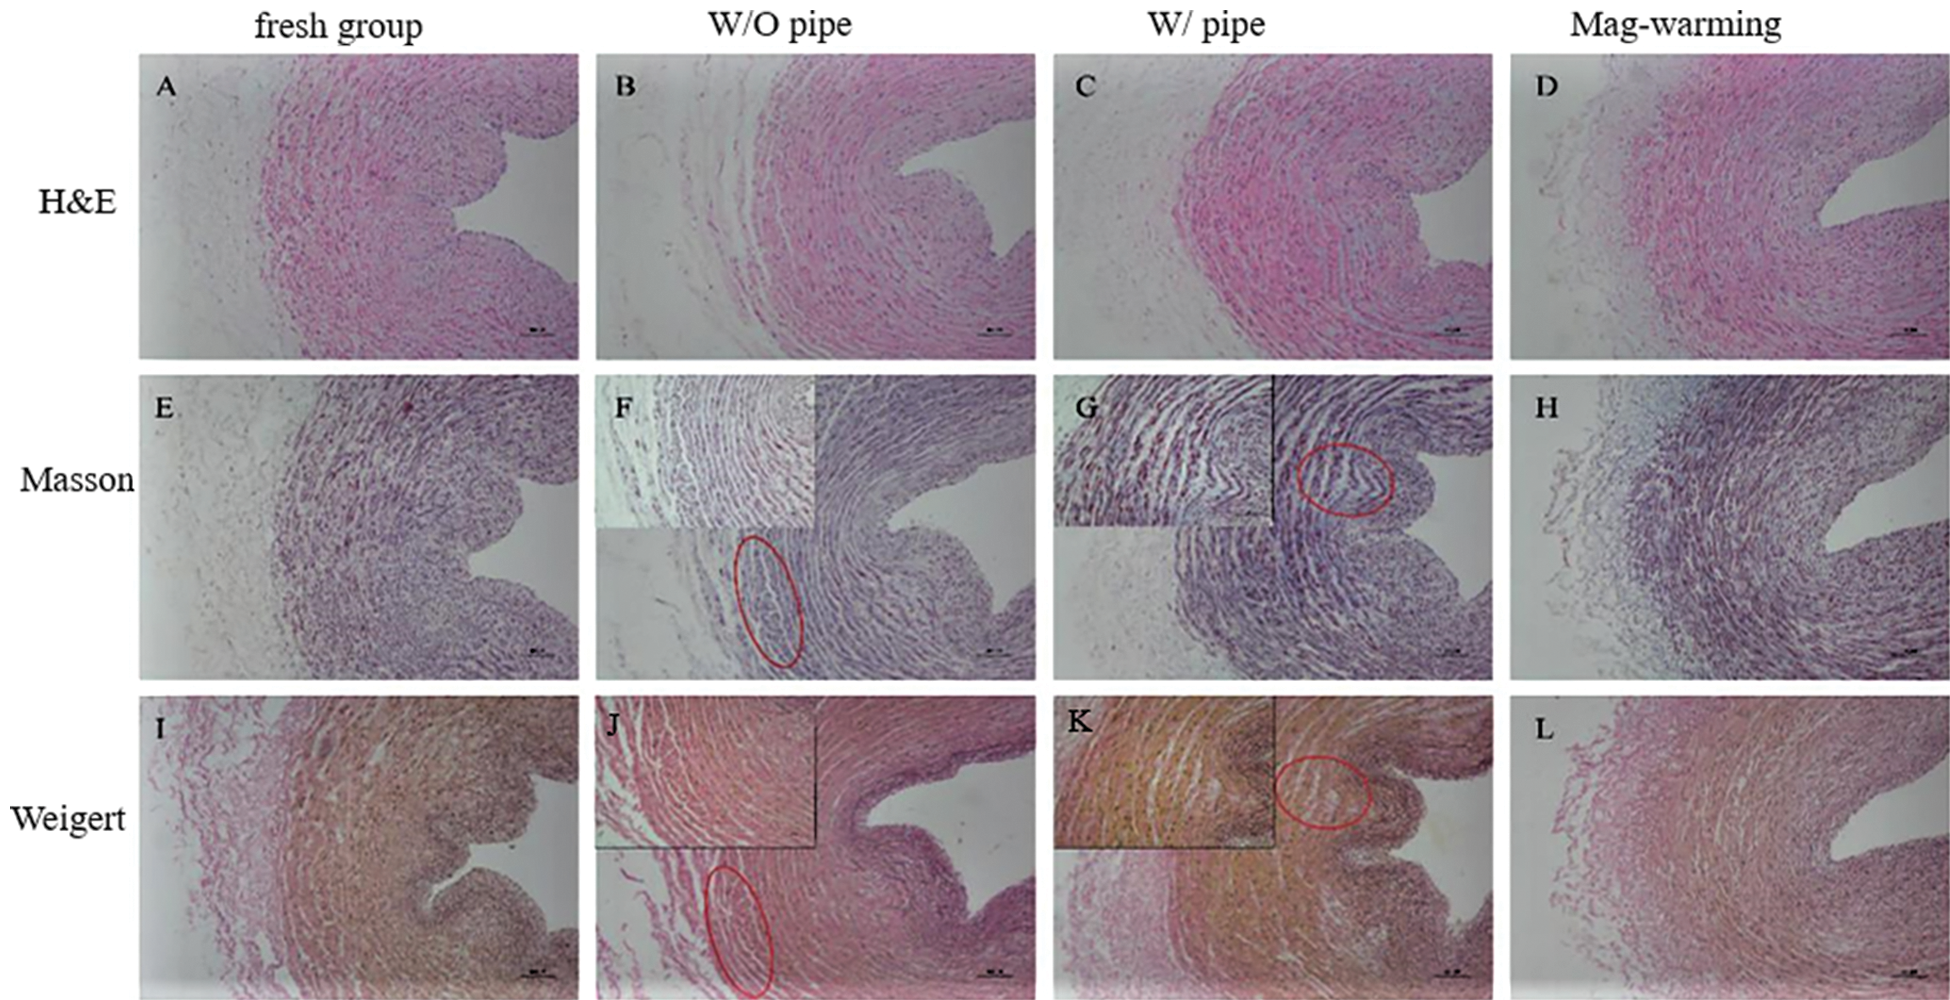
Figure 5: Histomorphology of samples dealt with different rewarming methods. H&E staining (A–D), Masson staining (E–H, collagen fibers), and Weigert staining (I–L, elastic fibers)
The results of UAs staining in the fresh group and the warming group are different, as shown in Fig. 5. It can be seen from Figs. 5A, 5E, and 5I, the cells in the fresh group were tightly arranged, and ECM presented a uniform distribution. For W/O pipe group (Figs. 5B, 5F, 5J), a small crack appeared on the periphery of the UAs, and the distribution of ECM, collagen fiber, elastic fiber, and muscle fiber was slightly uneven. The UAs in W/ pipe group also had slight damage (Figs. 5C, 5G, 5K). No significant microstructure changes of the UAs were noted after Mag-warming (Figs. 5D, 5H, 5L) compared with fresh groups, and the cells and ECM were well-spread and exhibited a relatively uniform structure without layered cracks.
3.2.1 Unidirectional Tensile of Umbilical Arteries
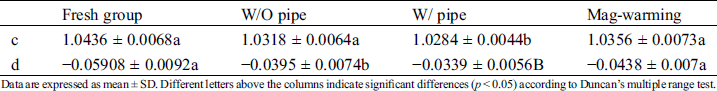
The elastic modulus and ultimate stress of the UAs are shown in Fig. 6. Fig. 6A shows that the elastic modulus of the UAs dealt with Mag-warming was significantly higher than that in the water bath warming group (p < 0.05). In addition, no significant elastic modulus of the UAs was found after the Mag-warming group (0.96 ± 0.04 MPa) compared with the fresh group (0.93 ± 0.04 MPa) (p > 0.05). Fig. 3B shows that no significant difference in the ultimate stress of UAs was identified between different warming methods (p > 0.05). Data are described further in Tab. 3.
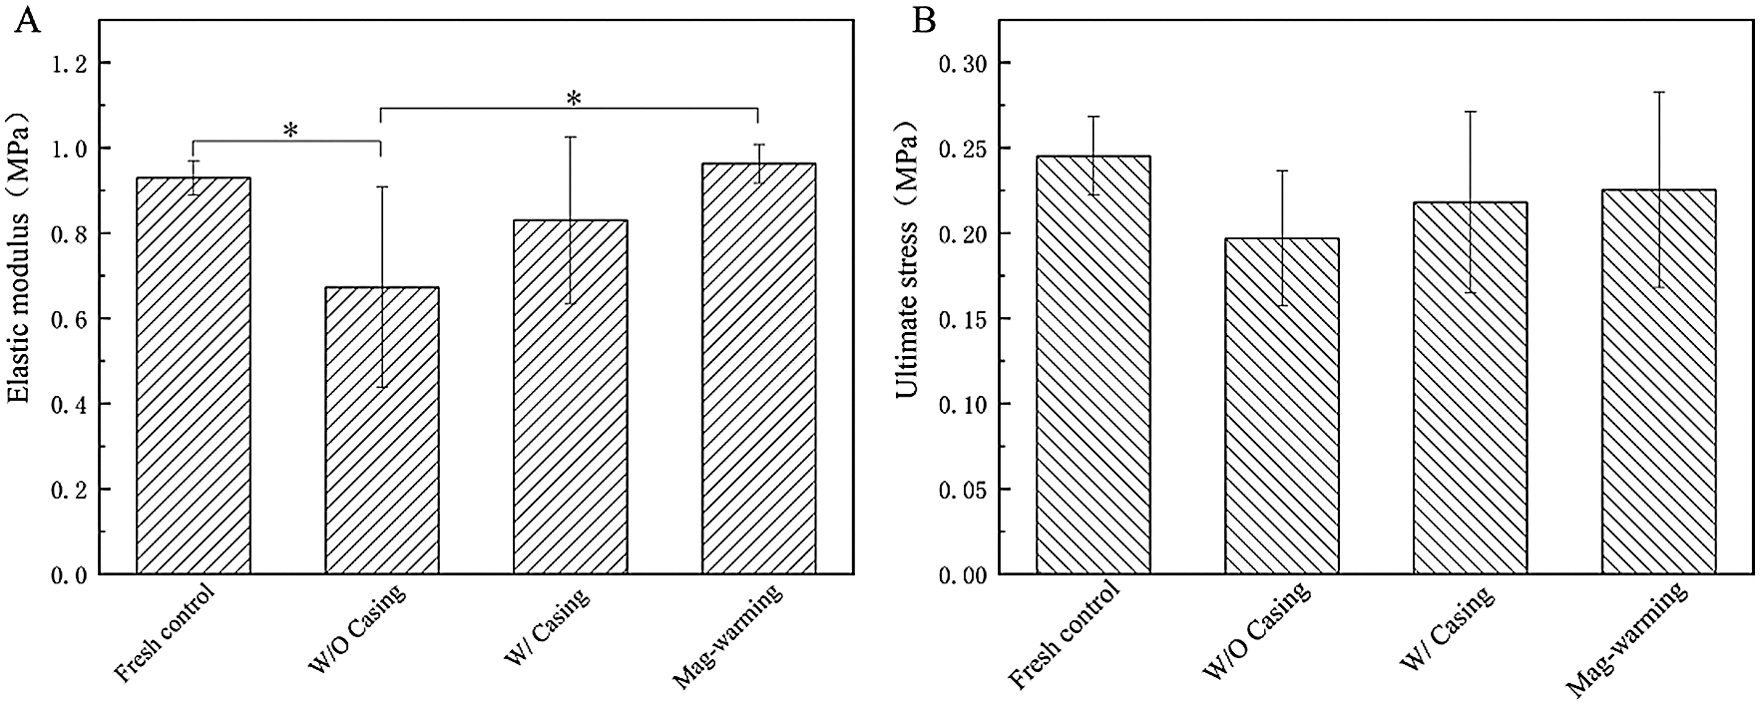
Figure 6: The elastic modulus and the ultimate stress of the vitrified UAs. Data are presented as mean ± SD. *the significant differences of different groups
The mechanical performance of UAs was determined mostly by their characteristics, composition content, and spatial structure of elastic fibers, smooth muscles, and collagen fibers [32]. Elastic fibers and smooth muscles of UAs bear stress mainly in the high-stress range, and their relative content affects the elastic modulus of UAs. In the low-stress range, collagen fibers load-bear the stress mainly [36], and the ultimate stress of UAs mostly affected by the content of collagen fibers. The results of the elastic modulus and ultimate stress for the Mag-warming group indicate that no obvious variation of the elastic fiber, muscle fiber, and collagen fiber structure, and revealed the successful preservation of UAs. On the other hand, conventional water bath warming failed to keep the initial structure of UAs including the elastic fiber, muscle fiber, and collagen fiber structure, which characterized by the significant difference in the elastic modulus and ultimate stress compared with fresh UAs. These studies show similar sorts of outcomes to the results of staining analysis (as shown in Fig. 5).
3.2.2 Stress Relaxation of Umbilical Arteries
According to the stress relaxation variation of the UAs with time, it presents a logarithmic function. To study the normalized stress relaxation function G(t) based on the quasi-linear theory of the viscoelastic material [32], the normalized experimental value G0 (t) can be expressed as G0 (t) =  /
/ . Then G(t) can be obtained by fitting the experimental function G0(t) [34].

The values of the characteristic parameters of normalized stress relaxation function a and b are shown in Tab. 1.
Table 1: The coefficients a and b of normalized stress relaxation function
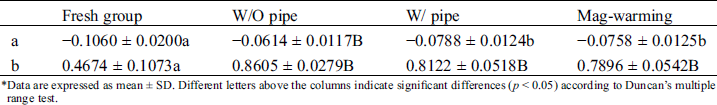
*Data are expressed as mean ± SD. Different letters above the columns indicate significant differences (p < 0.05) according to Duncan’s multiple range test.
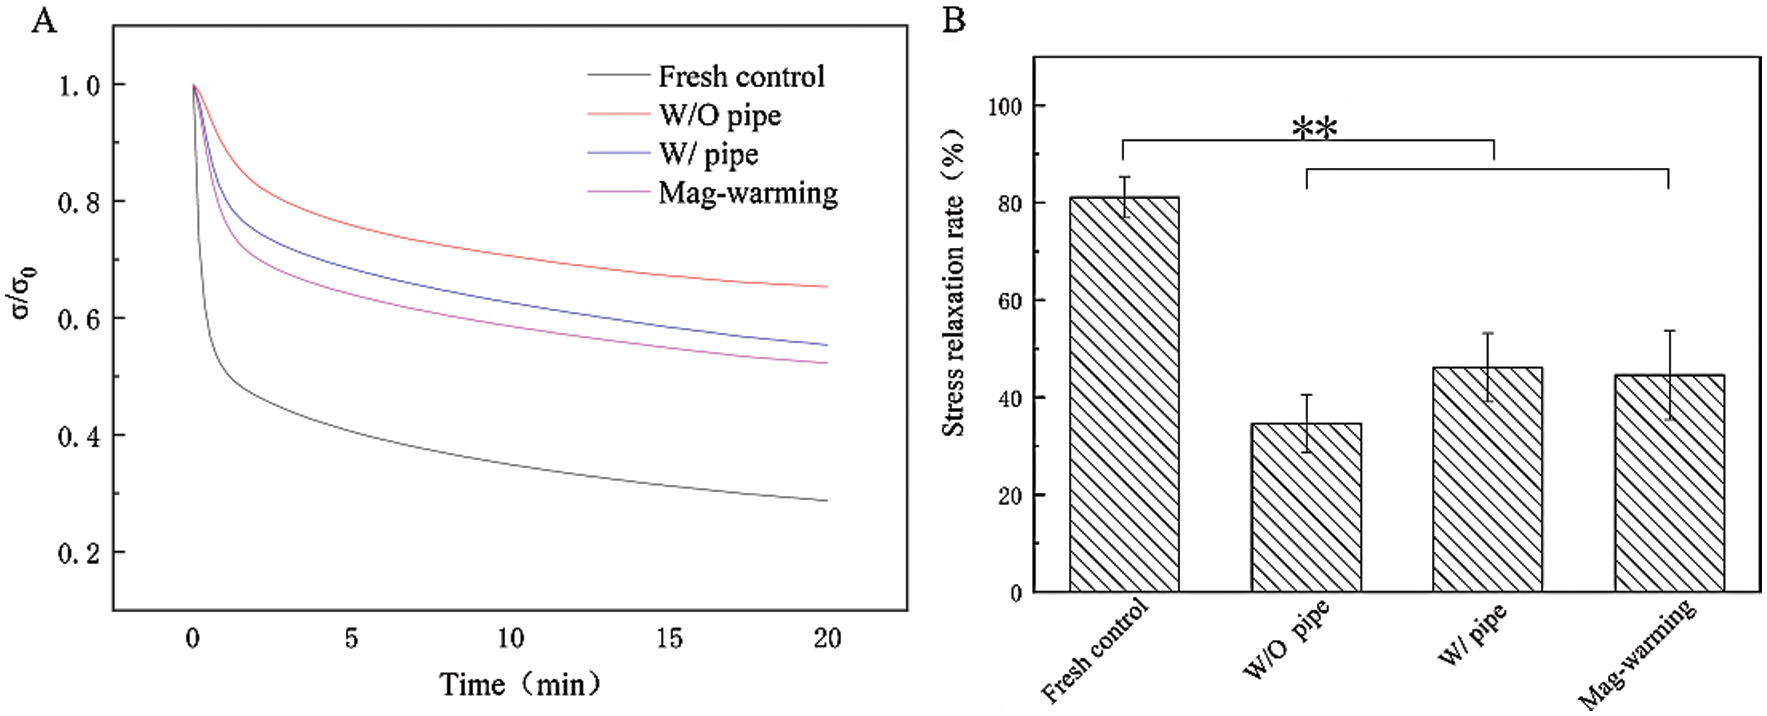
Figure 7: Normalized stress relaxation curve and stress relaxation rate. Data are presented as mean ± SD.* the significant differences of stress relaxation rate of different groups
The effect of magnetic warming on the stress relaxation of UAs is shown in Fig. 7. Data are described further in Tab. 3. Obviously, there are different levels of stress relaxation between the warming and fresh group. The result also can be seen from the G (t) function, statistically significant differences (p < 0.05) were observed in the coefficients a and b of the stress relaxation curve between warming group and the fresh group (p < 0.05). Fig. 7B shows the maximum relaxation rate of UAs. It can be seen that the maximum stress relaxation rate of the UAs warmed was extremely significantly reduced (p < 0.01) when compared with the fresh group (81.15 ± 4.25%). The results of stress relaxation are reduced, and the coefficients of stress relaxation fitting functions also exhibited certain differences. The findings are also consistent with numerous reports documenting [37–39], with the frozen tissues being slightly stiffer than the fresh tissues, frozen UAs demonstrating slightly lessened relaxation. Despite the decrease of stress relaxation in the Mag-warming group, the gross biomechanical behavior of the UAs was not substantially affected by magnetic warming, as indicated by no significant differences in the elastic modulus and the ultimate stress in Fig. 6 and the staining analysis in Fig. 5.
3.2.3 Creep of Umbilical Arteries
According to the creep variation of UAs with time, it exhibits the relationship in an exponential form. To study normalized creep function  , The normalized experimental value
  can be expressed as
 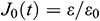 . Then
  can be obtained by fitting the function
  [34].
[34].

The coefficients c and d of normalized creep function are listed in Tab. 2.
Table 2: The coefficients c and d of normalized creep fitting function
Data are expressed as mean ± SD. Different letters above the columns indicate significant differences (p < 0.05) according to Duncan’s multiple range test.

Figure 8: Normalized creep curve and creep rate
The effect of magnetic warming on the creep of UAs is shown in Fig. 8. As shown from the normalized creep curve in Fig. 8A, there is no significant difference between magnetic warming and fresh groups. No statistically significant differences were observed in parameters c and d of the creep curve shown in Tab. 2 between different warming ways (p > 0.05), which is similar to the results shown in Fig. 8A. Fig. 8B shows the maximum creep rate of UAs. Data are described further in Tab. 3. Compared with the fresh group, the creep rate of the Mag-warming group decreased slightly, but no significant differences were obtained. The results also can be inferred from the normalized creep fitting function. Almost all the UAs in warming group had mechanical property loss to some degree. The findings are also consistent with another group’s work [40].
Table 3: Data supplement of biomechanical properties
* Data are expressed as mean ± SD. Different letters above the columns indicate significant differences (p < 0.05) according to Duncan’s multiple range test.
3.3 Thermal Stress Analysis for Cryopreserved Samples
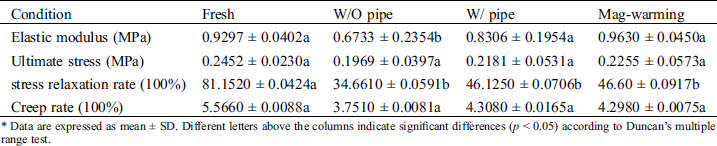
The coefficient of thermal expansion (β) represents the physical characteristics of the rate of thermal strain change with temperature. The thermal expansion coefficient during warming was chosen in Fig. 9A (Curve II) to calculate the thermal stress of UAs. And the elastic modulus (E) of UAs at different temperatures is shown in Fig. 9B.
Figure 9: Thermal expansion coefficient and elastic modulus of UAs
The results showed that in the temperature range of −100°C~0°C, UAs had a small elastic modulus (E) with no obvious change, mainly manifested as the viscoelasticity of UAs. In the temperature range of −140°C~−100°C, due to the phase transition of VS55, the elastic modulus decreased significantly. The elastic modulus of UAs begins to increase significantly at −120°C. The variation of elastic modulus can be obtained by linear fitting (10).

The temperature profile of the center and edge in the solution was recorded with the thermocouples, as shown in Fig. 10A. Fig. 10B shows the temperature profile of the edge and center and warming rate. For the case of the W/O pipe group, the temperature difference increased and then decreased, a maximum approached in the temperature range of −150°C~−80°C. The average heating rate in the center of this group was 138.6 °C/min. However, for the case of the Mag-waring group, there was uniform with no obvious change in the temperature profile of the edge and center, and the average heating rate is 42.2 °C/min.
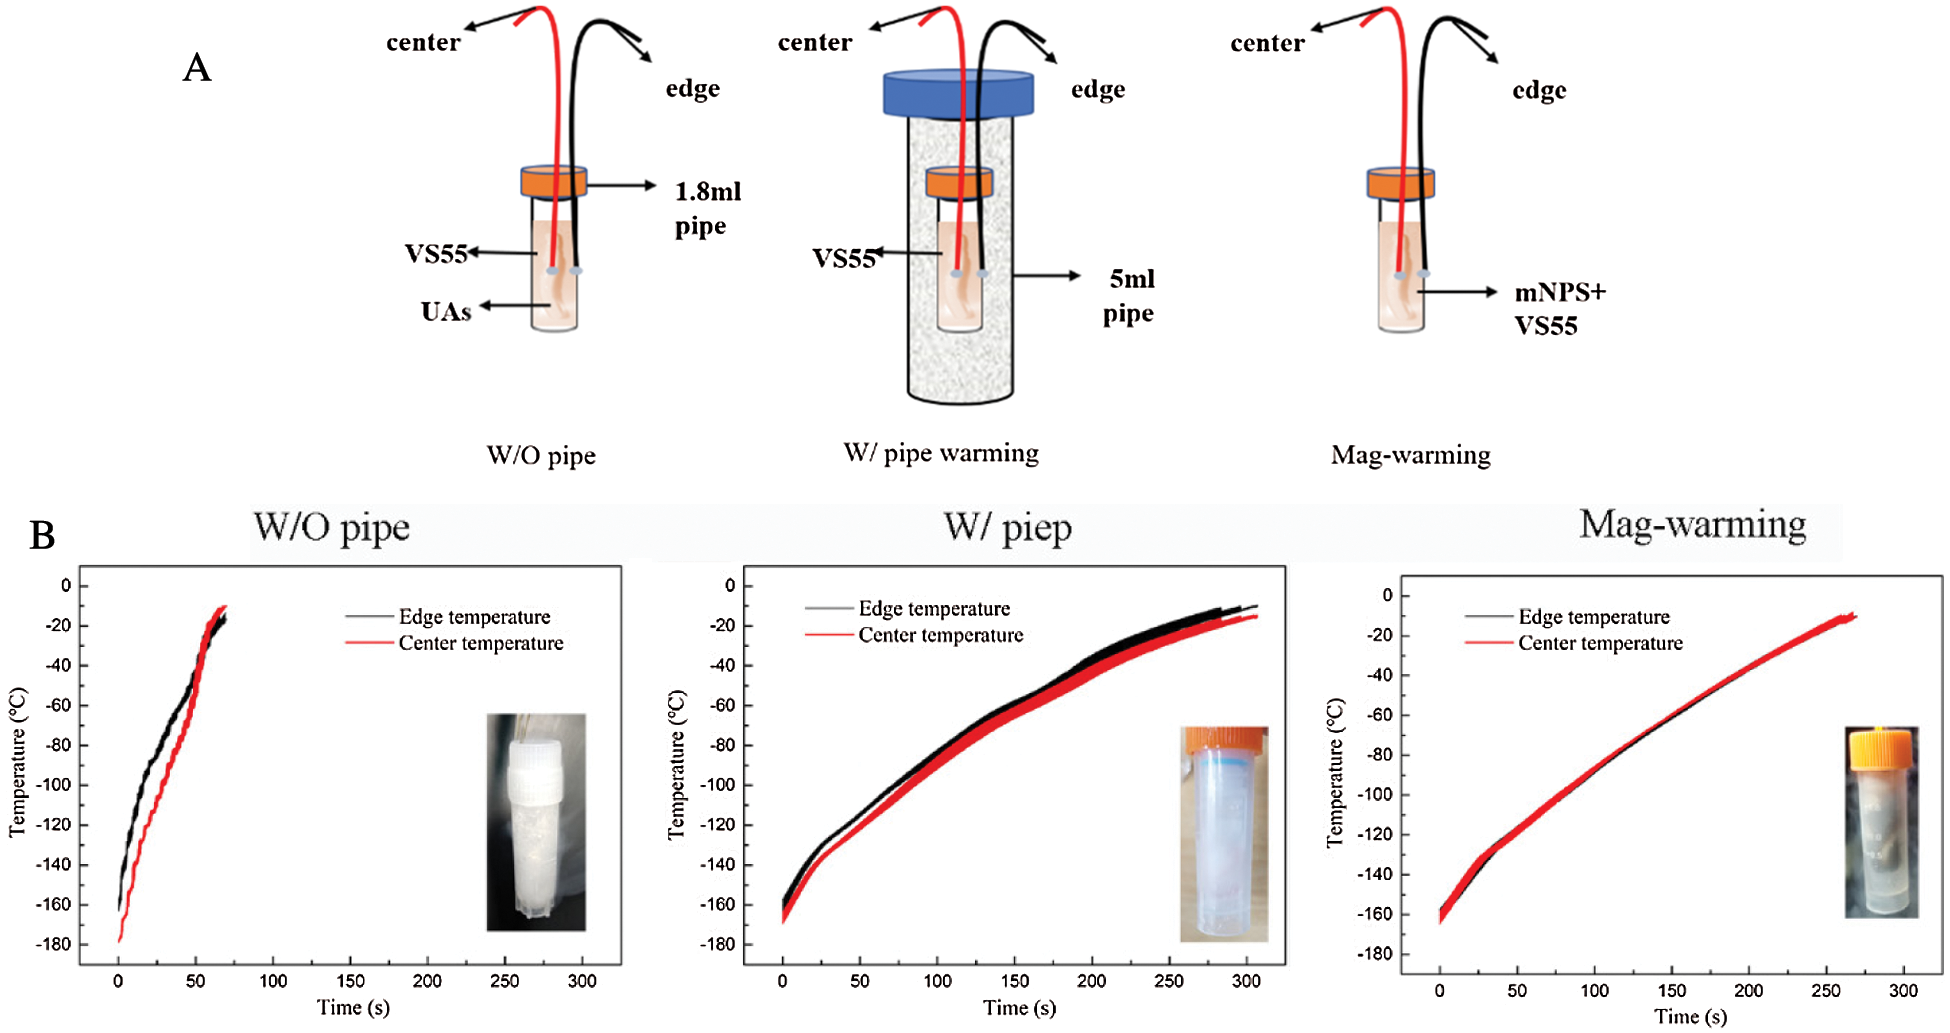
Figure 10: Schematic diagram of the experimental drivepipe (A) and the temperature profile of edge and center and warming rate (B). The ‘center’ is represented by red and ‘edge’ by black in the graphs
Thermal stress during the warming phase of the cryopreservation protocol is responsible for structural damage of UAs. The maximum thermal stress  in the ideal shape can be expressed as a simplified “thermal shock equation” as Formula (11) described [31,41].

We considered the UAs and VS55 solution as a cylinder, g is 0.5 for cylindrical geometry,  is the thermal gradient from the heat transfer calculation, and the maximum temperature difference
  max is considered below the set temperature of VS55 (−105°C). E means the elasticity modulus,
  is the thermal expansion coefficient (The values of E and
  are from Fig. 9, measured by the experiment).
  is the Poisson’s ratio [41], estimated at 0.2.
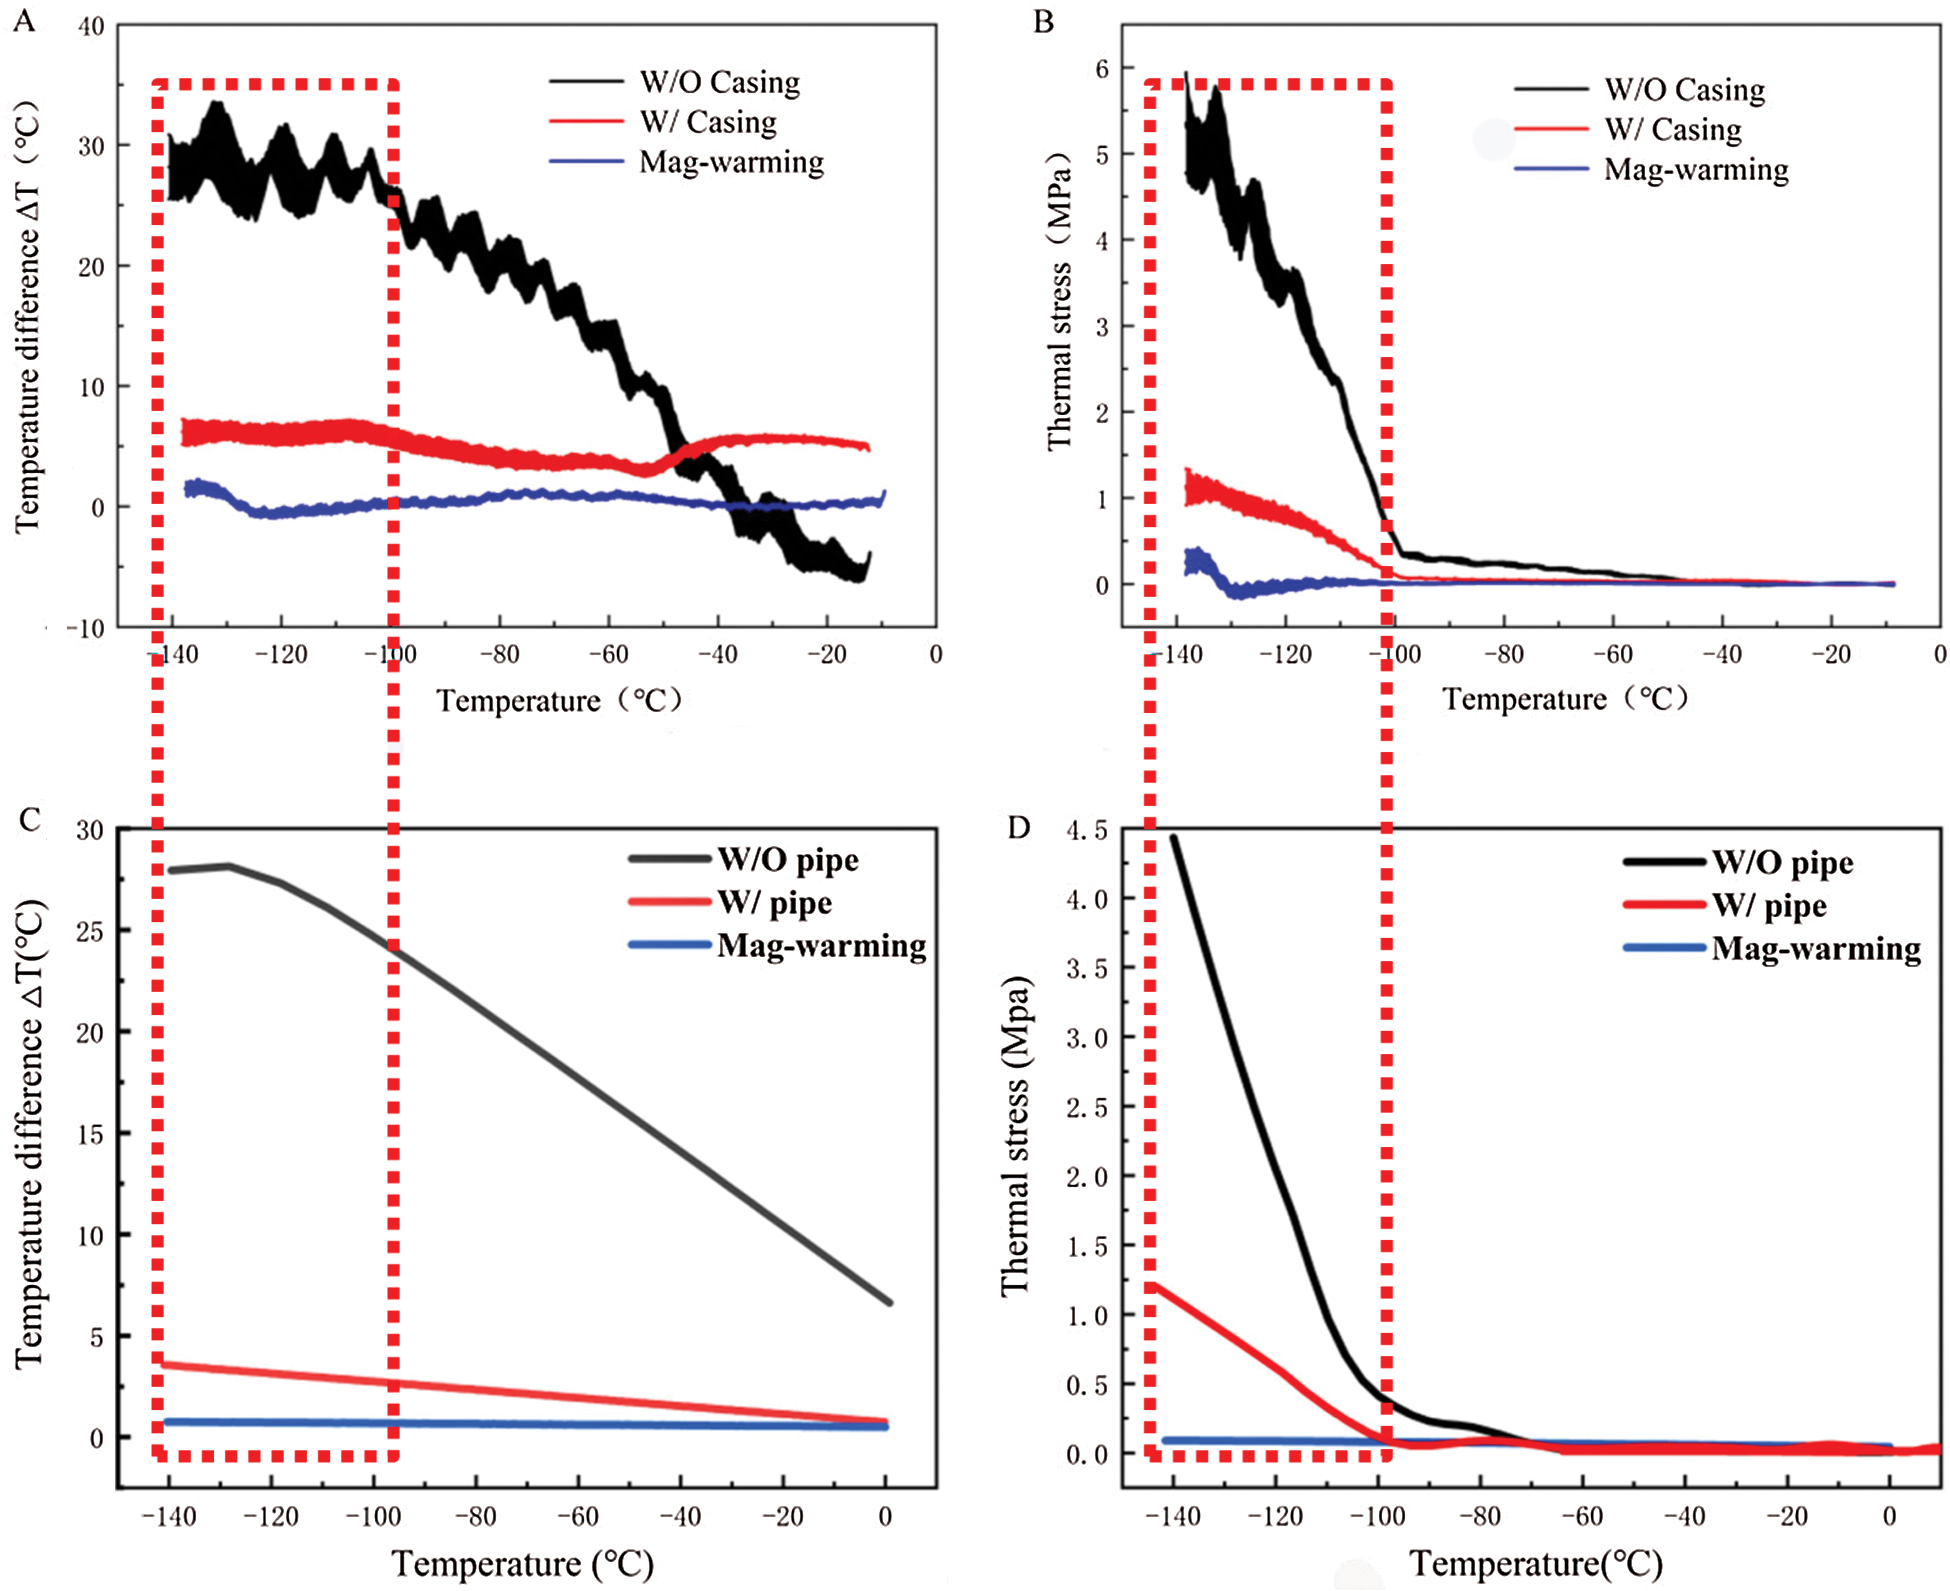
Figure 11: Temperature difference and thermal stress of theoretical calculation (A, B) and COMSOL Multiphysics (C, D) during warming
The work by Pegg et al. [16] showed that the fracture occurred mainly in the temperature range of −150°C ~ −100°C. Therefore, the current study on the thermal stress analysis of UAs mainly focuses on this temperature zone during warming. With the theoretical calculation and computational analysis, as shown in Fig. 11, the thermal stress of UAs dramatically decreased and then became flat after −100°C in the water bath group. Both of them  and
and  in the mag-warming group were less than those of the water bath group at −140°C~−100°C. As rational elastomers, the thermal stress of frozen UAs tends to exceed the ultimate stress easily at −150°C~0°C. With the increase of temperature, the phase transition of VS55 occurred and the elastic modulus increased significantly.
The  and
and  of theoretical calculation at this stage were illustrated in Tab. 4. Significantly,
  and
and  of the Mag-warming
  and
and  of Mag-warming group become smaller significantly.
Table 4: Maximum temperature difference  and maximum thermal stress
  of samples during warming
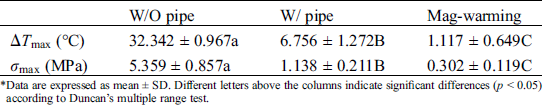
*Data are expressed as mean ± SD. Different letters above the columns indicate significant differences (p < 0.05) according to Duncan’s multiple range test.
Fig. 12 shows the thermal stress distribution of UAs warmed in the water and magnetic field. The results show that the warmed UAs have the largest stress on the external surface, followed by the stress on the internal surface, and the smallest thermal stress at the center. when UAs is reheated, the outer wall stress is the largest, the inner wall is the second, and the thermal stress in the center is the smallest. Cracks are prone to appear on the external surface of UAs, which staining results can also be seen. The comparison of thermal stress between the two groups shows that thermal stress in the water bath group was a great difference and the internal temperature of UAs is not uniform. The thermal stress in the magnetic group is uniform and significantly less than that of the water bath.
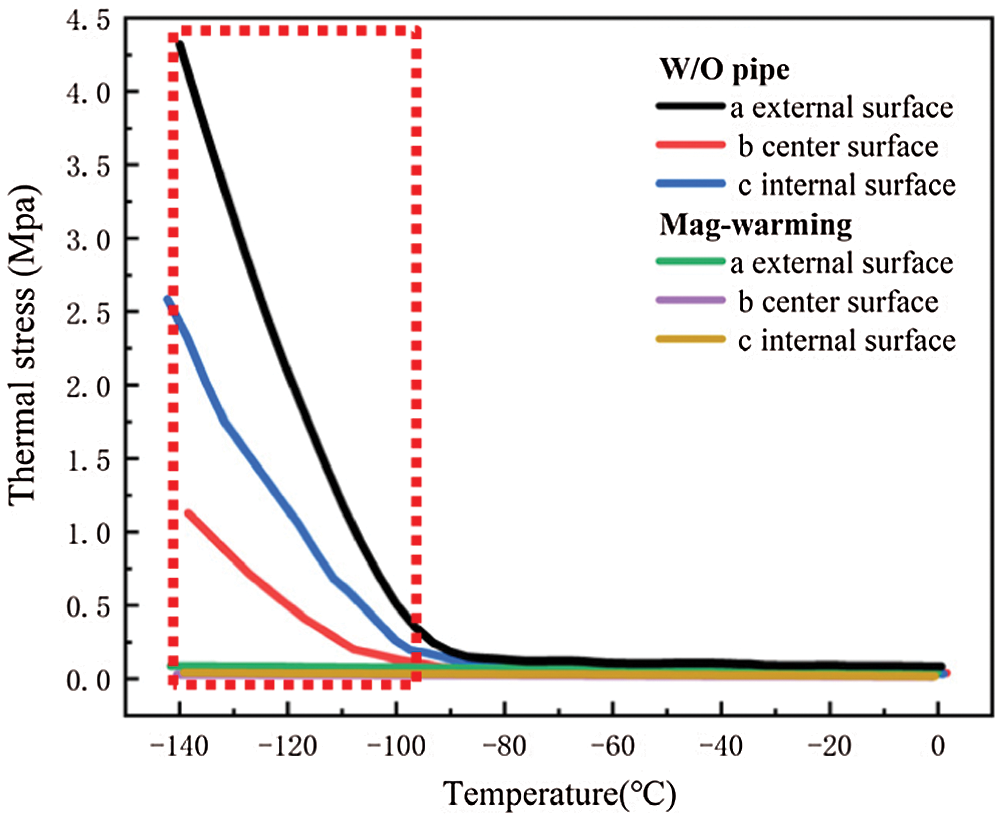
Figure 12: Computing thermal stress of UAs external surface, center surface, and internal surface in different warming methods
Eisenberg et al. [42] analyzed the thermal stress of vitrification preservation by simulations and found that the thermal stress generated in the warming process is significantly greater than that in the cooling process. Based on the results of thermal stress during warming. We could inform that thermal stress is driven by the phenomenon of thermal expansion, due to one or more of the following effects: (i) Phase transition, where water expands upon freezing; (ii) Temperature gradient across the sample; (iii) Thermal expansion mismatch between the sample, and the container, imposing mechanical stress on the sample (such as elastic modulus, fracture strength) [43]. Fig. 11B shows a jump increasing in thermal stress below −100°C because the elastic modulus becomes higher abruptly due to phase transition. A similar conclusion can be obtained from Bischof’s research [31]. In addition, Rubinsky et al. [44] carried out a theoretical calculation and demonstrated that the larger the temperature gradient inside the sample, the higher the thermal stress inside the sample. Some researchers are demonstrating that the warming rates within 50 °C/min can reduce the probability of vessel rupture effectively [45–47]. In our study, large temperature difference and thermal stress accompanied by rapid warming rate (138.6°C/min) in the W/O pipe group, as shown in Fig. 11 and Tab. 4. Since the thermal stress exceeds the ultimate stress, microcracks, and fractures of UAs occur [48]. After a computational analysis, it can be seen that microcracks are most likely to appear on the external surface of UAs. For the case of drivepipe with water bath warming, the warming rate is decreased significantly (38.2 °C/min) due to the poor thermal conductivity of an air layer between the cryotube and water bath medium, which certainly reduces the thermal stress damage. But it is very difficult to reach enough warming rate to overcome the secondary damage of devitrification with a 37°C water bath. For the case of magnetic warming, mNPs in solution makes it easier for vitrified biosample to achieve a uniform and fast warming under an AC magnetic field if mNPs are supposed to be homogeneously distributed, which obviously reduces temperature differences and devitrification of UAs [49] to avoid the damage of vitrified UAs during the warming process.
In this study, we measured the elastic modulus E, thermal expansion coefficient  of the UAs, and the temperature difference
  during the warming process. The mechanical properties of UAs after warming were analyzed systematically, and the thermal stress was further calculated simulated under different warming conditions. Computational analysis and theoretical calculation showed that the temperature gradient and thermal stress generated by magnetic warming were significantly less than those of the water bath warming, which could achieve more uniform and rapid heating and reduce the thermal stress damage. Therefore, magnetic warming performed more effectively to protect the mechanical structure of vitrified UAs. And more experiments should be carried out in the future to improve the post-vitrification survival and thawing the large size cryopreserved tissues or organs for clinical purposes.
Funding Statement: This work was supported by the National Natural Science Foundation of China (Nos. 51576132, 52076140) and the National Science and Technology Major Project on Important Infectious Diseases Prevention and Control (2018ZX10734404).
Conflicts of Interest: The authors declare that they have no conflicts of interest to report regarding the present study.
1. Nishiwaki, T., Enomoto, Y., Egashira, Y., Iwama, T. (2019). Acute thrombectomy for atherothrombotic major vessel occlusion. No Shinkei Geka. Neurological Surgery, 47(7), 745–752. [Google Scholar]
2. Irina, A., Andrey, E., Andrey, M., Timur, F. (2016). Umbilical cord as prospective source for mesenchymal stem cell-based therapy. Stem Cells International, 3, 1–17. [Google Scholar]
3. Arutyunyan, I., Fatkhudinov, T., Sukhikh, G. (2018). Umbilical cord tissue cryopreservation: A short review. Stem Cell Research & Therapy, 9(1), 357. DOI 10.1186/s13287-018-0992-0. [Google Scholar] [CrossRef]
4. Weymann, A., Ruhparwar, A., Karck, M. (2016). Management of abdominal stent graft infection with cryopreserved aortic allograft. Asian Cardiovascular and Thoracic Annals, 24(9), 904. DOI 10.1177/0218492314532848. [Google Scholar] [CrossRef]
5. Hou, Y., Lu, C., Dou, M., Zhang, C., Rao, W. (2020). Soft liquid metal nanoparticles achieve reduced crystal nucleation and ultrarapid rewarming for human bone marrow stromal cell and blood vessel cryopreservation. Acta Biomaterialia, 102, 403–415. DOI 10.1016/j.actbio.2019.11.023. [Google Scholar] [CrossRef]
6. Antonopoulos, C. N., Papakonstantinou, N. A., Hardy, D., Lyden, S. P. (2019). Cryopreserved allografts for arterial reconstruction after aorto-iliac infection: A systematic review and meta-analysis. Journal of Vascular Surgery, 58(1), 120–128. [Google Scholar]
7. Finger, E. B., Bischof, J. C. (2018). Cryopreservation by vitrification: A promising approach for transplant organ banking. Current Opinion in Organ Transplantation, 23(3), 353–360. DOI 10.1097/MOT.0000000000000534. [Google Scholar] [CrossRef]
8. Cerdeira, J., Sánchez-Calabuig, M. J., Pérez-Gutiérrez, J. F., Hijon, M. Castaño, C. et al. (2020). Cryopreservation effects on canine sperm morphometric variables and ultrastructure: Comparison between vitrification and conventional freezing—Sciencedirect. Cryobiology, 95, 164–170. DOI 10.1016/j.cryobiol.2020.03.007. [Google Scholar] [CrossRef]
9. O’Neill, H. C., Nikoloska, M., Ho, H. T., Doshi, A., Maalouf, W. (2019). Improved cryopreservation of spermatozoa using vitrification: Comparison of cryoprotectants and a novel device for long-term storage. Journal of Assisted Reproduction and Genetics, 36(8), 1713–1720. DOI 10.1007/s10815-019-01505-x. [Google Scholar] [CrossRef]
10. Leonel, E. C. R., Corral, A., Risco, R., Camboni, A., Taboga, S. R. et al. (2019). Stepped vitrification technique for human ovarian tissue cryopreservation. Scientific Reports, 9(1), 775. DOI 10.1038/s41598-019-56585-7. [Google Scholar] [CrossRef]
11. Baicu, S., Taylor, M. J., Chen, Z., Rabin, Y. (2008). Cryopreservation of carotid artery segments via vitrification subject to marginal thermal conditions: Correlation of freezing visualization with functional recovery. Cryobiology, 57(1), 1–8. DOI 10.1016/j.cryobiol.2008.03.002. [Google Scholar] [CrossRef]
12. Mallis, P., Katsimpoulas, M., Kostakis, A., Dipresa, D., Korossis, S. et al. (2020). Vitrified human umbilical arteries as potential grafts for vascular tissue engineering. Tissue Engineering and Regenerative Medicine, 17(3), 285–299. DOI 10.1007/s13770-020-00243-x. [Google Scholar] [CrossRef]
13. Dahl, S. L. M., Chen, Z., Solan, A. K., Brockbank, K. G. M., Niklason, L. E. et al. (2006). Feasibility of vitrification as a storage method for tissue-engineered blood vessels. Tissue Engineering, 12(2), 291–300. DOI 10.1089/ten.2006.12.291. [Google Scholar] [CrossRef]
14. Wassenaar, C., Wijsmuller, E. G., Van Herwerden, L. A., Aghai, Z., Van Tricht, C. L. et al. (1995). Cracks in cryopreserved aortic allografts and rapid thawing. Annals of Thoracic Surgery, 60(2), S165–S167. DOI 10.1016/0003-4975(95)00264-L. [Google Scholar] [CrossRef]
15. Mallis, P., Gontika, I., Poulogiannopoulos, T., Zoidakis, J., Vlahou, A. et al. (2014). Evaluation of decellularization in umbilical cord artery. Transplantation Proceedings, 46(9), 3232–3239. DOI 10.1016/j.transproceed.2014.10.027. [Google Scholar] [CrossRef]
16. Pegg, D. E., Wusteman, M. C., Boylan, S. (1997). Fractures in cryopreserved elastic arteries. Cryobiology, 34(2), 183–192. DOI 10.1006/cryo.1996.1997. [Google Scholar] [CrossRef]
17. Zhang, H. C., Xu, Y. (2015). Study on rapid thawing methods of cryopreserved biological materials. Chinese Journal of Medical Physics, 32(1), 144–148. [Google Scholar]
18. Kleinhans, F. W., Seki, S., Mazur, P. (2010). Simple, inexpensive attainment and measurement of very high cooling and warming rates. Cryobiology, 61(2), 231–233. DOI 10.1016/j.cryobiol.2010.06.011. [Google Scholar] [CrossRef]
19. Malhotra, M. S., Mathew, L. (1978). Effect of rewarming at various water bath temperatures in experimental frostbite. Aviation, Space, and Environmental Medicine, 49(7), 874–876. [Google Scholar]
20. Koshimoto, C., Mazur, P. (2002). Effects of warming rate, temperature, and antifreeze proteins on the survival of mouse spermatozoa frozen at an optimal rate. Cryobiology, 45(1), 49–59. DOI 10.1016/S0011-2240(02)00105-0. [Google Scholar] [CrossRef]
21. Halmagyi, A., Surducan, E., Surducan, V. (2017). The effect of low- and high-power microwave irradiation on in vitro grown Sequoia plants and their recovery after cryostorage. Journal of Biological Physics, 43(3), 367–379. DOI 10.1007/s10867-017-9457-4. [Google Scholar] [CrossRef]
22. Kleinhans, F. W., Mazur, P. (2015). Physical parameters, modeling, and methodological details in using IR laser pulses to warm frozen or vitrified cells ultra-rapidly. Cryobiology, 70(2), 195–203. DOI 10.1016/j.cryobiol.2015.02.003. [Google Scholar] [CrossRef]
23. Etheridge, M. L., Bischof, J. C. (2013). Optimizing magnetic nanoparticle based thermal therapies within the physical limits of heating. Annals of Biomedical Engineering, 41(1), 78–88. DOI 10.1007/s10439-012-0633-1. [Google Scholar] [CrossRef]
24. Rahim, S., Iftikhar, F. J., Malik, M. I. (2020). Biomedical applications of magnetic nanoparticles. Metal Nanoparticles for Drug Delivery and Diagnostic Applications, 16, 301–328. DOI 10.1016/B978-0-12-816960-5.00016-1. [Google Scholar] [CrossRef]
25. Croissant, J. G., Fatieiev, Y., Almalik, A., Khashab, N. M. (2018). Mesoporous silica and organosilica nanoparticles: Physical chemistry, biosafety, delivery strategies, and biomedical applications. Advanced Healthcare Materials, 7(4), 1700831. DOI 10.1002/adhm.201700831. [Google Scholar] [CrossRef]
26. Etheridge, M. L., Xu, Y., Choi, J., Bischof, J. C. (2013). 003 Radiofrequency heating of magnetic nanoparticle cryoprotectant solutions for improved cryopreservation protocols. Cryobiology, 67(3), 398–399. DOI 10.1016/j.cryobiol.2013.09.009. [Google Scholar] [CrossRef]
27. Etheridge, M. L., Xu, Y., Rott, L., Choi, J., Bischof, J. C. (2014). RF heating of magnetic nanoparticles improves the thawing of cryopreserved biomaterials. Technology, 2(3), 229–242. DOI 10.1142/S2339547814500204. [Google Scholar] [CrossRef]
28. Liu, K., Xu, Y., Yu, H. M. (2019). Research on ice crystal growth inside the vitrified vs55 with magnetic nanoparticles during devitrification by cryomicroscopy. Chemical Research in Chinese Universities, 35(3), 542–548. DOI 10.1007/s40242-019-8230-6. [Google Scholar] [CrossRef]
29. Jalali, H., Abbassi, H. (2019). Analysis of the influence of viscosity and thermal conductivity on heat transfer by Al2O3-water nanofluid. Fluid Dynamics & Materials Processing, 15(3), 253–270. DOI 10.32604/fdmp.2019.03896. [Google Scholar] [CrossRef]
30. El, A., Bessaïh, R. (2015). Natural convection in a square cavity filled with nanofluids. Fluid Dynamics & Materials Processing, 11(3), 279–300. [Google Scholar]
31. Manuchehrabadi, N., Gao, Z., Zhang, J., Ring, H. L., Shao, Q. et al. (2017). Improved tissue cryopreservation using inductive heating of magnetic nanoparticles. Science Translational Medicine, 9(379). DOI 10.1126/scitranslmed.aah4586. [Google Scholar] [CrossRef]
32. Fung, Y. C. (1985). Biomechanics. Applied Mechanics Reviews, 38(10), 1251–1255. DOI 10.1115/1.3143684. [Google Scholar] [CrossRef]
33. Ni, G. X., Cheng, H. P., Wu, Z. Y. (1998). A study on stress relaxation and creep of patellar ligament on knee contraction. Chinese Journal of Rehabilitation Medicine, 13(5), 209–211. [Google Scholar]
34. Wang, G. Q., Wang, M. L., Ma, H. S., Zheng, G. X. (2007). The viscoelasticity test on animal common carotid artery and arteria meningea media. Shengwu Yixue Gongcheng Yanjiu, 26(2), 121–124. [Google Scholar]
35. Hua, Z., Xu, H., Zhou, G., Liu, J., Huang, H. et al. (2001). Analyses of thermal stress and fracture during cryopreservation of blood vessel. Science in China Series E: Technolgical Science, 44(2), 158–163. [Google Scholar]
36. Krasny, W., Morin, C., Magoariec, H., Avril, S. (2017). A comprehensive study of layer-specific morphological changes in the microstructure of carotid arteries under uniaxial load. Acta Biomaterialia, 57, 342–351. DOI 10.1016/j.actbio.2017.04.033. [Google Scholar] [CrossRef]
37. Grace, A. D., Colton, J., Ross Devin, W. L., Cortland, H., Johns, C. L. (2020). An investigation of the effect of freezing storage on the biaxial mechanical properties of excised porcine tricuspid valve anterior leaflets. Journal of the Mechanical Behavior of Biomedical Materials, 101, 103438. DOI 10.1016/j.jmbbm.2019.103438. [Google Scholar] [CrossRef]
38. Virues Delgadillo, J. O., Delorme, S., El-Ayoubi, R., DiRaddo, R., Hatzikiriakos, S. G. (2010). Effect of freezing on the passive mechanical properties of arterial samples. Journal of Biomedical Science and Engineering, 3(7), 645–652. DOI 10.4236/jbise.2010.37088. [Google Scholar] [CrossRef]
39. Fitzpatrick, J. C., Clark, P. M., Capaldi, F. M. (2010). Effect of decellularization protocol on the mechanical behavior of porcine descending aorta. International Journal of Biomaterials, 2010(4736), 1–11. DOI 10.1155/2010/620503. [Google Scholar] [CrossRef]
40. Tuan-Mu, H. Y., Yu, C. H., Hu, J. J. (2014). On the decellularization of fresh or frozen human umbilical arteries: Implications for small-diameter tissue engineered vascular grafts. Annals of Biomedical Engineering, 42(6), 1305–1318. DOI 10.1007/s10439-014-1000-1. [Google Scholar] [CrossRef]
41. Shivakumara, I. S., Sureshkumar, S., Devaraju, N. (2012). Effect of non-uniform temperature gradients on the onset of convection in a couple-stress fluid-saturated porous medium. Journal of Applied Fluid Mechanics, 5(1), 49–55. [Google Scholar]
42. Rios, J. L. J., Rabin, Y. (2006). Thermal expansion of blood vessels in low cryogenic temperatures, Part II: Vitrific ress in cryopreservation. Cryogenics, 64, 86–94. [Google Scholar]
43. Gao, D. Y., Lin, S., Watson, P. F., Critser, J. K. (1995). Fracture phenomena in an isotonic salt solution during freezing and their elimination using glycerol. Cryobiology, 32(3), 270–284. DOI 10.1006/cryo.1995.1026. [Google Scholar] [CrossRef]
44. Rubinsky, B., Cravalho, E. G., Mikic, B. (1980). Thermal stresses in frozen organs. Cryobiology, 17(1), 66–73. DOI 10.1016/0011-2240(80)90009-7. [Google Scholar] [CrossRef]
45. Zhang, A., Cheng, S., Lei, D., He, L., Gao, D. (2002). An experimental study of the mechanical behavior of frozen arteries at low temperatures. Cryo Letters, 23(6), 389–396. [Google Scholar]
46. Hunt, C. J., Song, Y. C., Bateson, E. A. J., Pegg, D. E. (1994). Fractures in cryopreserved arteries. Cryobiology, 31(5), 506–515. DOI 10.1006/cryo.1994.1061. [Google Scholar] [CrossRef]
47. Wassenaar, C., Wijsmuller, E. G., Herwerden, L. A. V., Aghai, Z., Bos, E. (1995). Cracks in cryopreserved aortic allografts and rapid thawing. Annals of Thoracic Surgery, 60(Suppl 2), S165–S167. DOI 10.1016/0003-4975(95)00264-L. [Google Scholar] [CrossRef]
48. Steif, P. S., Palastro, M. C., Rabin, Y. (2007). The effect of temperature gradients on stress development during cryopreservation via vitrification. Cell Preservation Technology, 5(2), 104–115. DOI 10.1089/cpt.2007.9994. [Google Scholar] [CrossRef]
49. Liu, K., Xu, Y., Yu, H. M. (2019). Research on ice crystal growth inside the vitrified vs55 with magnetic nanoparticles during devitrification by cryomicroscopy. Chemical Research in Chinese Universities, 35(3), 542–548. DOI 10.1007/s40242-019-8230-6. [Google Scholar] [CrossRef]
 | This work is licensed under a Creative Commons Attribution 4.0 International License, which permits unrestricted use, distribution, and reproduction in any medium, provided the original work is properly cited. |