DOI: 10.32604/fdmp.2021.011292
Article
Experimental Study on the Flow Characteristics of a Plate with a Mechanically Choked Orifice
1State Key Laboratory of Multiphase Flow in Power Engineering, Xi’an Jiaotong University, Xi’an, 710049, China
2Petroleum Engineering Technology Research Institute of Shengli Oilfield Company, SINOPEC, Dongying, 257000, China
3Shandong Key Laboratory of Heavy Oil Production Technology, Shengli Oilfield Company, SINOPEC, Dongying, 257000, China
4Petroleum Engineering College, Yangtze University, Wuhan, 430100, China
*Corresponding Author: Dong Wang. Email: wangdong@mail.xjtu.edu.cn
Received: 30 April 2020; Accepted: 10 November 2020
Abstract: The mechanically choked orifice plate (MCOP) is a new type of device for flow control by which choking conditions for incompressible fluids can be obtained with relatively small pressure losses. Given the lack of relevant results and data in the literature, in the present study, we concentrate on the experimental determination of the flow coefficient for the annular orifice, the pressure distribution in the MCOP, and the characteristics of the choked flow itself. As confirmed by the experimental results, the Reynolds number, the orifice plate thickness, the plug taper, and the eccentricity have an obvious influence on the aforementioned flow coefficient. The pressure drop in the MCOP is mainly generated near the orifice plate, and the pressure upstream of the orifice plate is slightly reduced in the flow direction, while the pressure downstream of the orifice plate displays a recovery trend. The choked flow rate of the MCOP can be adjusted by replacing the spring with a maximum flow control deviation of 4.91%.
Keywords: Mechanical choked orifice plate; flow control; flow coefficient; flow characteristics
In the fields of aerospace [1], petroleum engineering [2], cryogenic refrigeration [3], and nuclear energy utilization [4], choked flow is widely used for flow control. Under a certain inlet pressure, the mass flow rate through the throttle device will reach the maximum value when the downstream pressure decreases to a critical value. In such conditions, the mass flow rate were not increase even if the downstream pressure decrease further. The flow under these conditions is called choked flow [5]. Choked flow is often used in systems and processes that need to maintain a constant fluid flow but have pressure fluctuations to achieve rapid, stable, and precise flow control and regulation [6].
For compressible fluids, when the flow reaches the sonic speed at the throat of the nozzles, the flow will be choked because the propagation speed of the downstream pressure wave is also the sonic speed, which cannot affect the upstream pressure [7]. While for incompressible liquids, before the flow reaches its sonic speed, the pressure near the throat is reduced to the vaporization pressure, and the bubbles generated by the vaporization of the liquid block the propagation of the downstream pressure fluctuation to the upstream [8], resulting in the choked flow [9]. However, due to the increase of pressure in the diffusion section of the nozzle, the bubble generated bursts quickly and cause oscillation and noise and cavitation, which affects the safety or normal operation of the equipment [10]. Furthermore, because the vaporization pressure is usually low, reducing the pressure to the vaporization pressure in order to achieve a choked flow will generate an large pressure loss [11]. These problems limit the application of liquid choked flow devices based on vaporization. To solve this problem, the author proposed a new method to realize choked flow by mechanical choked devices, such as mechanical choked orifice plate (MCOP) [12] and mechanical choked venturi nozzle (MCVN) [13], which expands the application of choked flow.
The MCOP does not require the flow rate to reach the sound speed, nor does it need the liquid pressure to be reduced to the vaporization pressure, that is, it can achieve the choked flow under the “subcritical” flow condition, with low flow rate, low resistance loss, no noise and vibration. As a new type of choked flow control method for incompressible fluid, the MCOP has attracted increasingly attention [14,15]. In-depth study of the internal flow field characteristics and flow control characteristics of the MCOP has important value for its application in engineering. However, in the previous research work [12], the flow characteristics of the MCOP were mainly studied using numerical simulation methods. During the numerical simulation, many actual interference factors are ignored, such as the effect of the pipe wall roughness, the vibration caused by the pump vibration, and the influence of gravity, which may cause the simulation results to be somewhat different from the actual situation. Aim at this problem, in this paper, further research on the flow characteristics of the MCOP was conducted by experiments to provide more reliable theoretical guidance for its application in engineering.
2 Structure and Operating Principle of the MCOP
Fig. 1 shows the three-dimensional model and experimental MCOP photos. The MCOP mainly consists of orifice plate, float, spring, guide rod, and tripod brackets. The float can slide on the guide rod. A high-precision linear spring is connected to the downstream side of the float, whose other side is fixed to the downstream tripod brackets. Both sides of the guide rod are fixed on the upstream and downstream tripod brackets, which are keeping the same axis with the orifice plate, to ensure the symmetry of the annular channel during the float movement.
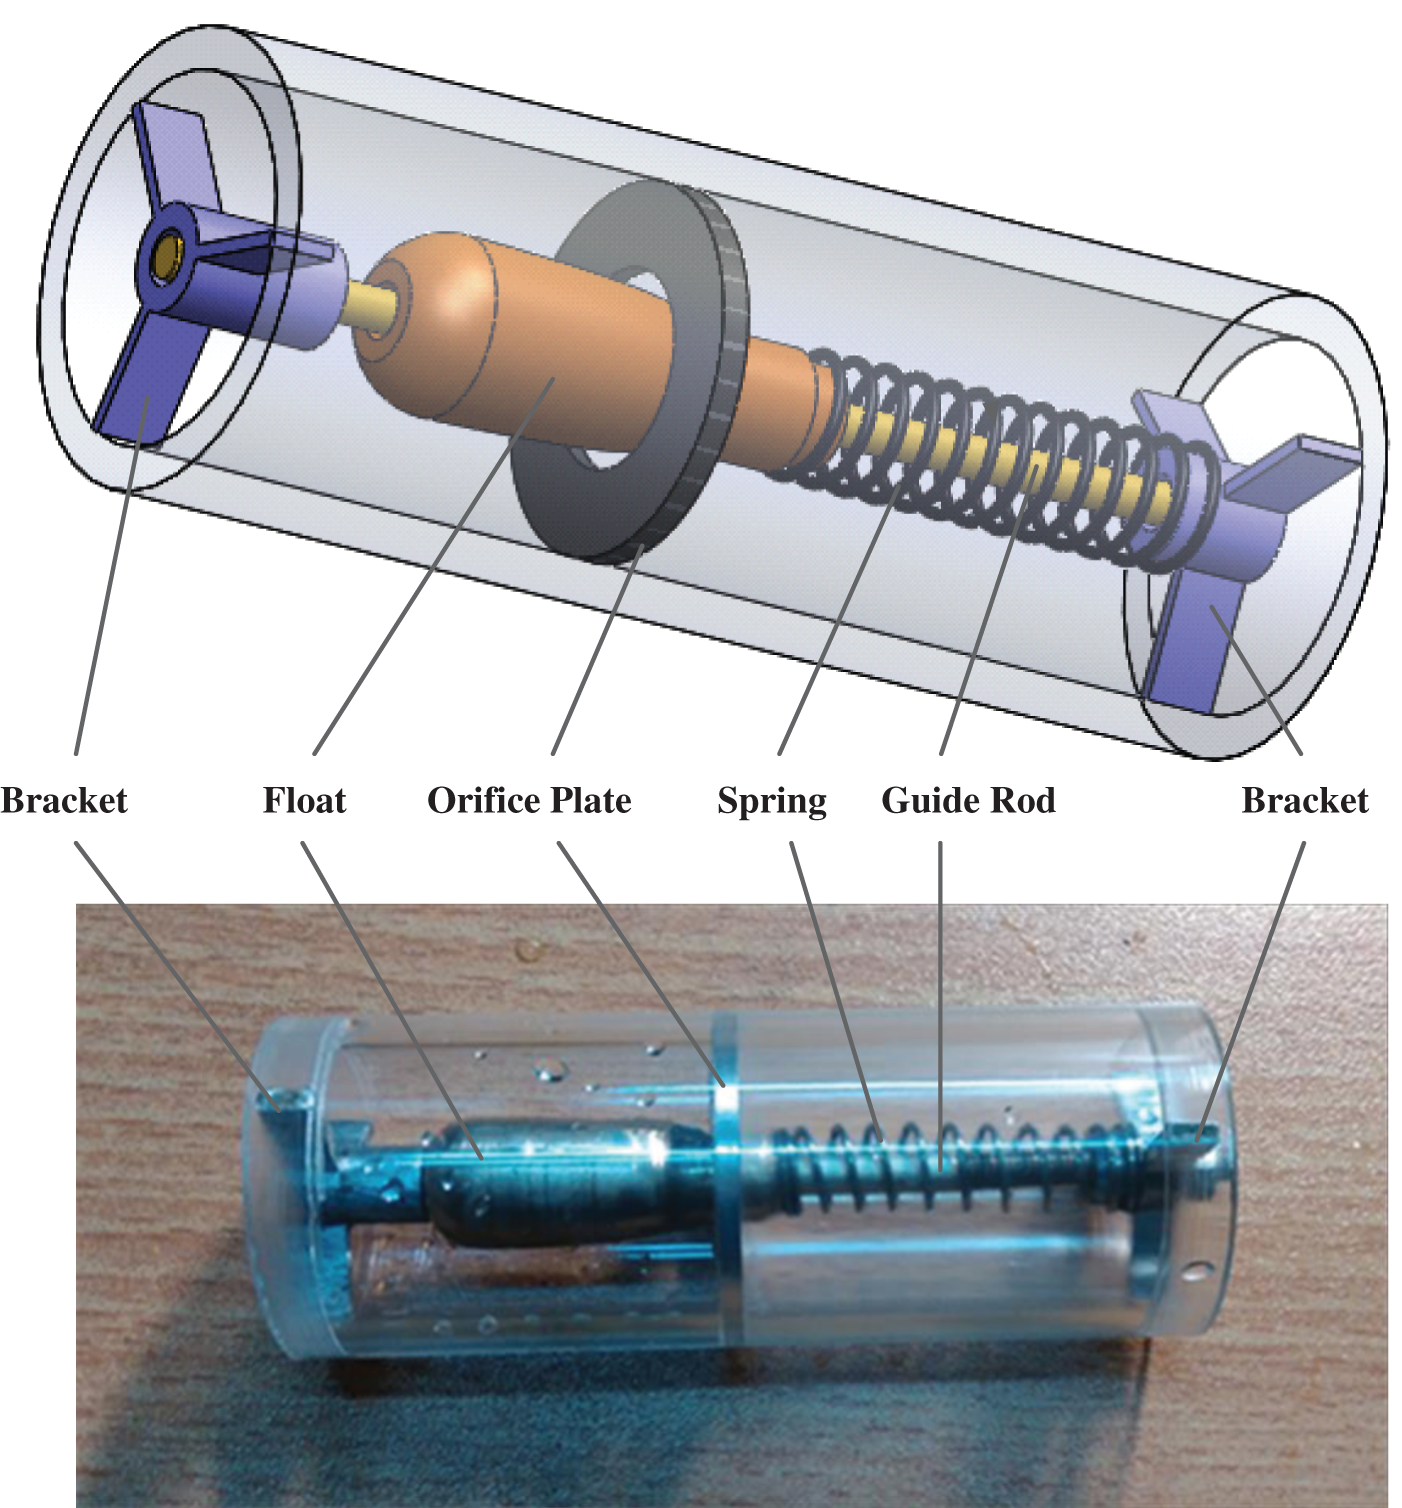
Figure 1: The structure of the MCOP
The shape of the float is designed according to the method recommended in reference [12]. When the downstream pressure decreases, the pressure difference between the two ends of the float increases, causing the float to move downstream. At this time, the spring is compressed, the area of the annular flow channel between the float and the orifice plate is reduced, preventing the flow from increasing and maintaining a constant flow. Conversely, when the downstream pressure increases, the pressure difference between the two ends of the float decreases, the float moves upstream, the spring is stretched, increasing the area of the annular channel and reducing the degree of throttling of the fluid to maintain the flow rate constant. In this way, a choked flow is achieved. For the convenience of comparison, the structure size of the MCOP processed and studied in this paper is the same as the structure in Zhang et al. [12], with the orifice plate inner diameter of 18 mm, the guide rod diameter of 2 mm and the pipe inner diameter of 25.4 mm. The distance between the movable orifice plate and the inlet boundary is 40 mm.
3 Flow Loop and Experimental Method
The schematic diagram of the experimental flow loop is shown in Fig. 2a. In the experiment, water was used as the experimental flow medium, and was pumped into a stabilized water tank with a height of 3 m from the water tank. The water from the stabilized water tank was divided into two parts. One part is used as a bypass to facilitate the replacement of the test section, and can also be used to adjust the fluid flow and upstream pressure of the test section when necessary; the other part is used as the working medium in the horizontal pipeline to the test section. The water pump was regulated by an ABB inverter. Regulating valves are provided upstream and downstream of the MCOP to regulate the flow rate and outlet pressure, respectively. The water flow rate was measured by a Micro Motion Coriolis mass flowmeter, which has a measurement range of 0–1 kg·s-1 with a full-scale accuracy of 0.5%. All the experiments were performed under atmospheric pressure and at room temperature. The differential pressure was measured by differential pressure sensors made by the Yokagawa Company with a maximum full-scale reading of 150 kPa and a full-scale accuracy of 0.1%. The measurement range of the differential pressure sensors is adjustable according to the order of the differential pressure magnitude to ensure the accuracy of the measurements. The signals of the differential pressure and flow rate were converted to 4–20 mA current signal, which is collected, processed and analyzed by a computer.
Fig. 2b is a photograph of the test section after connecting the MCOP to the experimental loop. To facilitate observation, the test section line was made from transparent Perspex with an inner diameter of 25.4 mm. There are straight sections of length 1.77 m and 1.6 m upstream and downstream of the MCOP to ensure the full development of the flow. Through experiments, the flow coefficient of the annular orifice, the pressure distribution in the MCOP, and the choked flow adjustment characteristics of the MCOP are studied.
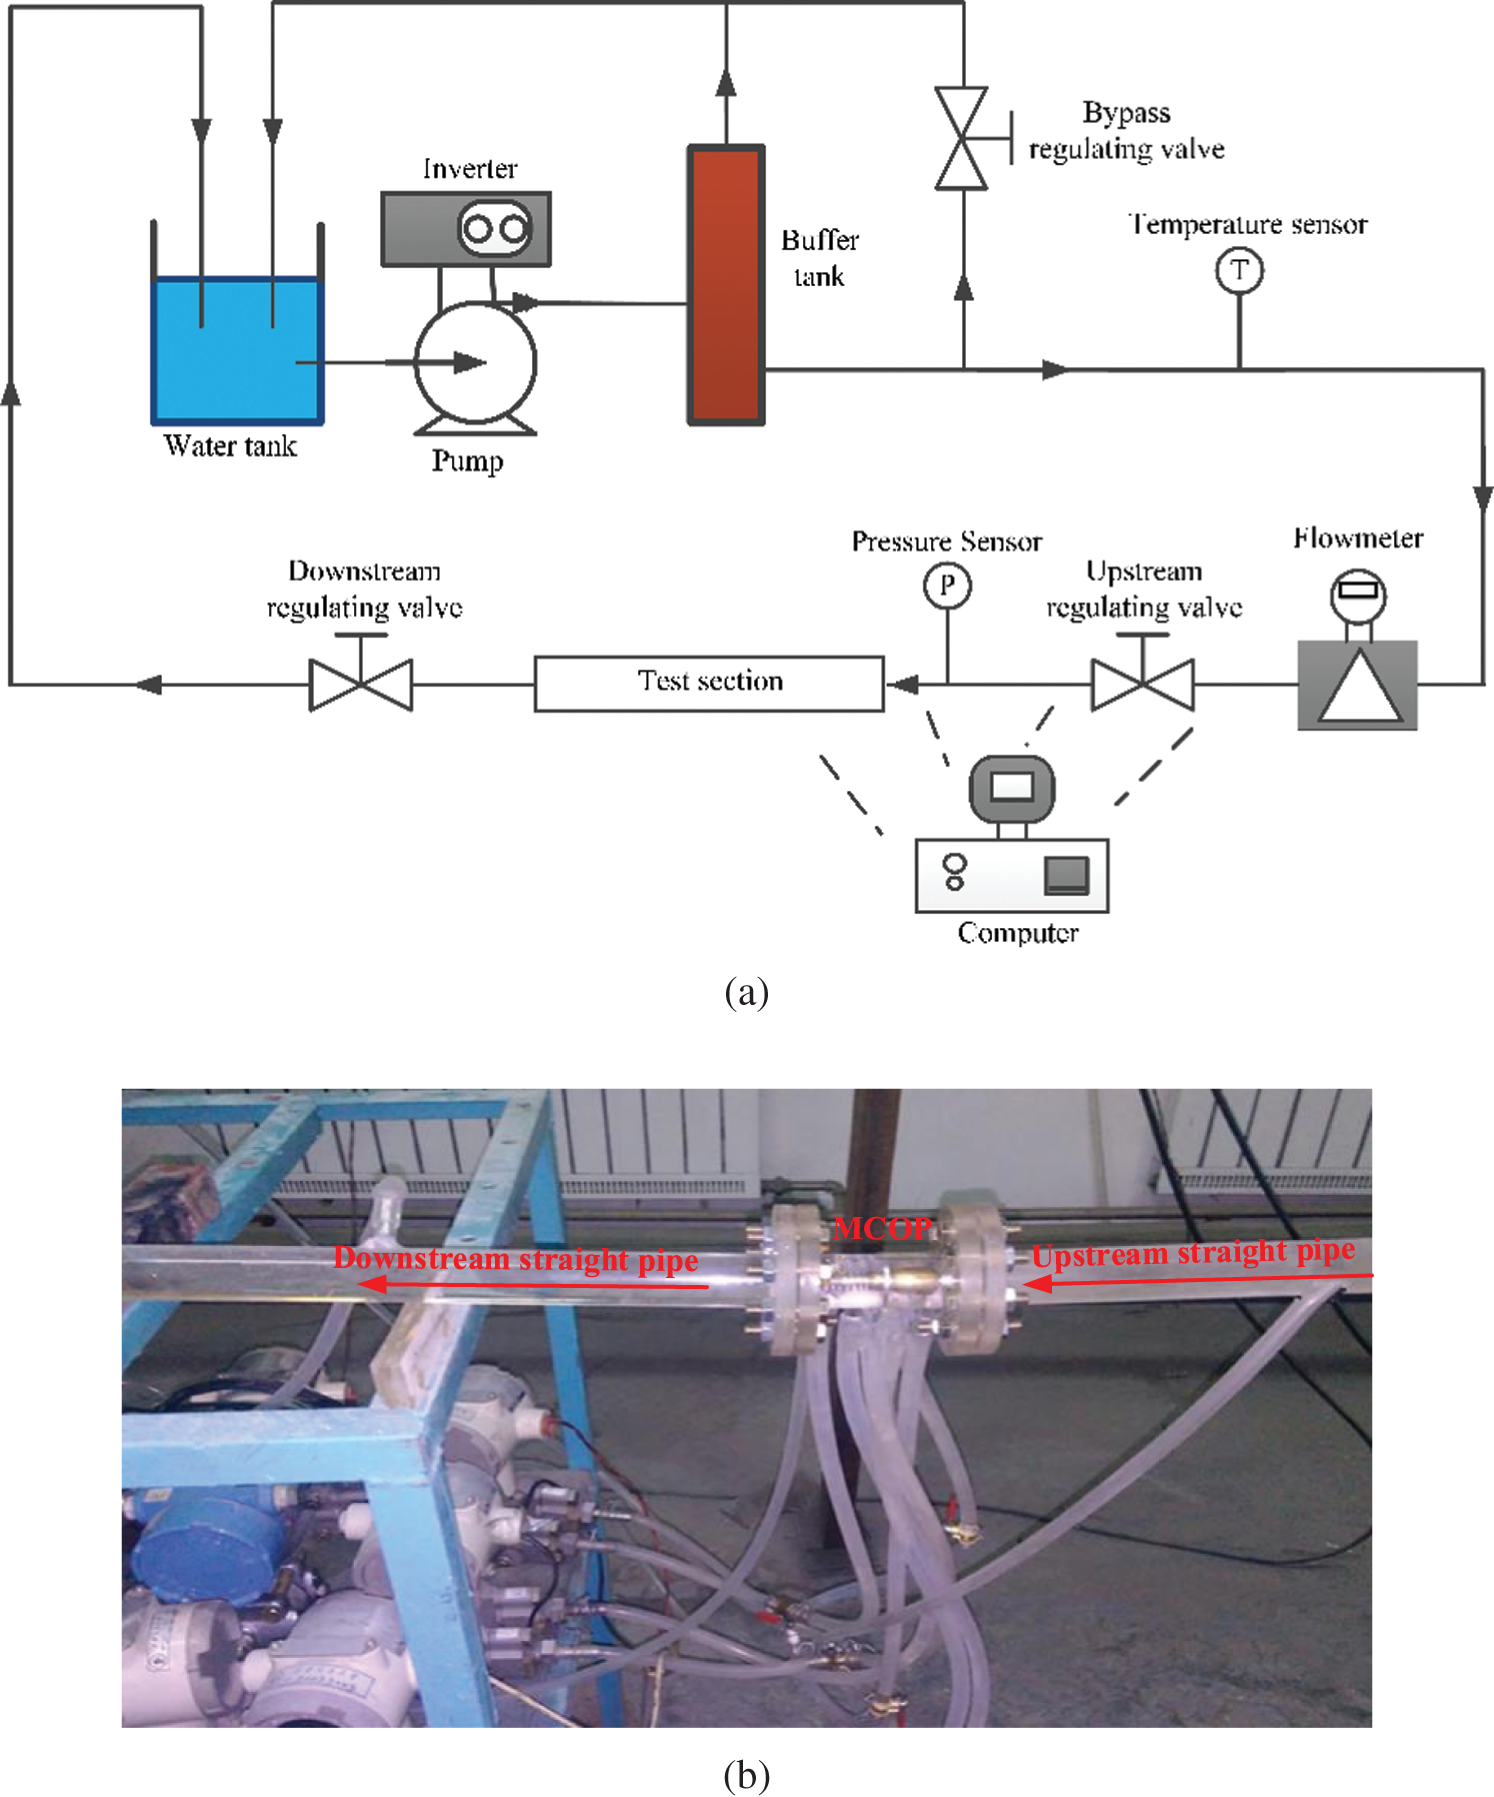
Figure 2: MCOP experimental system (a) Flow loop (b) The test section
3.1 Experiments on Flow Coefficient of Annular Orifice
The MCOP achieves flow control by adaptively changing the area of the annular flow channel between the orifice plate and the float. The annular flow channel converges the fluid in the pipe wall and the center of the pipe between them, which is different from the flow in the standard orifice plate flowmeter that suddenly shrinks the fluid to the center of the pipe [16], or the flow in the V-cone flowmeter that converges the fluid to the wall of the pipe [17]. Therefore, further research is needed on the flow coefficient of the annular orifice in the MCOP.
In order to accurately determine the influence of different factors on the flow coefficient of the annular orifice, a series of cylindrical rods with different diameters and cones with different cone angles were used to replace the float of the MCOP. The diameter of the cylindrical rods D2 range from 4.015 mm to 16.974 mm, and the cone angles ranges from 0° to 15°. The influence of rod diameter, concentricity, thickness of orifice plate, cone angle and flow rate on flow coefficient were studied.
3.2 Experiments on Pressure Distribution in the MCOP
To measure the pressure distribution in the MCOP, four pressure measurement points of ①③⑤⑦ were arranged at the pipe wall upstream of the orifice plate, and at the same time, another four pressure measurement points of ②④⑥⑧ were arranged the orifice plate. The arrangement of pressure measuring points is shown in Fig. 3. The abscissa used in the figure is established along the wall of the pipe with the direction from downstream to upstream.
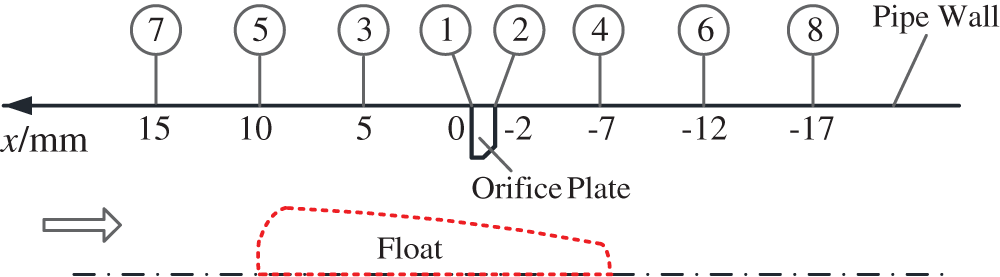
Figure 3: Pressure measurement points layout
4 Experimental Results and Analysis
4.1 Annular Orifice Flow Coefficient
Fig. 4 shows the variation of the flow coefficient with the pipe Reynolds number RD under different cylindrical rod diameters. The pipe Reynolds number ReD is defined as:

where, Q is the mass flow rate, kg·s-1; D0 is the pipe inner diameter, m; μ is the dynamic viscosity of water, kg·m-1·s-1.
The flow coefficient α is given by

where ΔP is the differential pressure between the inlet and the outlet, Pa;  is the density of water, kg·m-3 and A is the flow area between the orifice plate and the float, m2.
It can be seen from Fig. 4 that the flow coefficient gradually decreases with the increase of the Reynolds number at the beginning. This is because the larger the Reynolds number, the stronger the inertia of the fluid and the stronger the contraction of the stream downstream of the annular hole, resulting in the flow coefficient drops. When the Reynolds number increases to a certain value, the flow coefficient tends to be constant. This is because as the Reynolds number increases, the flow gradually reaches a stable turbulent state, the range of viscosity affected by the fluid is small, and the separation point of the boundary layer is fixed, so the flow coefficient is also stable. It can also be seen from the figure that the flow coefficient gradually increases as the diameter of the cylindrical rod increases. This is mainly because the larger the diameter of the cylinder, the greater the pressure drop at the same flow rate, and the lower the pressure after orifice plate throttling, which makes the stronger the drainage effect on the fluid. Moreover, the larger the diameter of the cylindrical rod, the faster the flow coefficient decreases with the Reynolds number increases, and the smaller the Reynolds number when the flow coefficient reaches a constant.
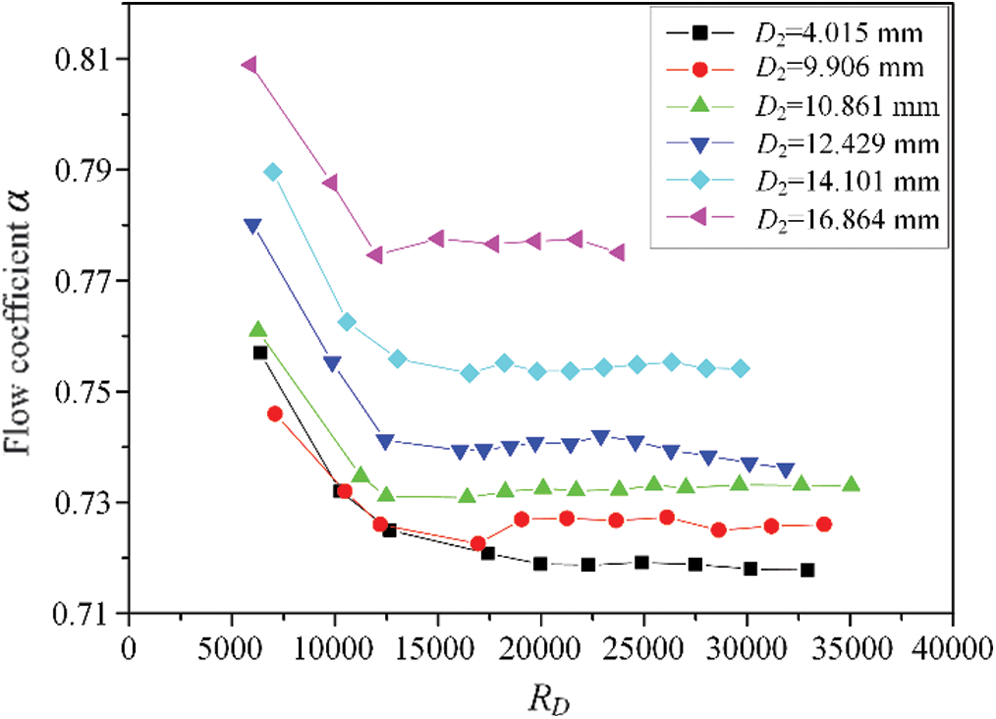
Figure 4: The variation of the flow coefficient with RD under different cylindrical rod diameters
To study the effect of the thickness of the orifice plate l on the flow coefficient of the annular orifice, a series of orifice plates with different thickness ranges from 2 to 7 mm were tested, with the diameter of the cylindrical rod D2 = 14.101 mm and the flow rate Q was fixed at 0.4 kg·s-1. The relationship between the flow coefficient and the thickness of the orifice plate is shown in Fig. 5. It can be seen from the figure that as the thickness of the orifice plate increases, the flow coefficient also increases. This is because, as the thickness of the orifice plate increases, the flow channel between the orifice plate and the cylindrical rod has a compulsory convergence and collection effect on the water flow, which is beneficial to the elimination of the vortex and makes the flow coefficient larger.
Figure 5: The influence of the thickness of the orifice plate on the flow coefficient of annular orifice
The radial distance between the axis of the cylindrical rod and the axis of the orifice plate is defined as the eccentricity δ. Through the design and control of the tripod brackets at both ends, three different eccentricities were achieved, namely, 0.5 mm, 1.5 mm, and 2.5 mm. Fig. 6 shows the change law of the flow coefficient α with the eccentricity δ, with the diameter of the cylindrical rod D2 = 14.101 mm and the orifice plate thickness l = 2 mm. It can be seen from the figure that the eccentricity has a greater influence on the flow coefficient of the annular orifice. As the eccentricity increases, the flow coefficient gradually decreases, which is caused by the destruction of the flow symmetry. Therefore, in order to obtain stable flow control results, the tripod bracket in the MCOP should accurately position the float at the center of the pipeline to ensure good axis symmetry.
Figure 6: Influence of eccentricity on flow coefficient of annular orifice
As shown in Fig. 7, the influence of taper on flow coefficient was studied by using a cone instead of float in MCOP. During the experiment, the position of the cone was fixed, so that the plane of the upstream end face of the orifice plate was exactly in the middle of the cone, and the diameter of the cone cross-section circle D3 = 14.000 mm. Fig. 8 shows the change law of the flow coefficient with the Reynolds number under different cone angles. It can be seen from the figure that the change of the flow coefficient with cone inserted also decreases first and then gradually becomes constant with the Reynolds number increases, and the discharge coefficient gradually decreases as the cone angles increases.
Figure 7: Schematic diagram of cone tested
Figure 8: The change law of the flow coefficient with the Reynolds number under different cone angles
Through the study of the flow coefficient of the annular orifice, it is proved that the flow coefficient of the MCOP is not a constant, but is affected by many factors, including the flow state and physical structure. Therefore, in determining the final structure of the float, the flow coefficient must be accurately determined.
4.2 Pressure Distribution in the MCOP
Fig. 9 shows the pressure distribution on the pipe wall when the float is in different positions. It can be seen from the figure that as the pressure difference between upstream and downstream increases, the float gradually moves downstream. The main pressure drop occurs near the orifice plate, but the pressure distribution is not uniform in the upstream and downstream areas of the orifice plate. The pressure upstream of the orifice plate slightly decreased in the direction of flow, while the pressure downstream of the orifice plate gradually recovered in the direction of flow. This shows that the effect of pressure distribution must be considered to determine the precise structure of the float. For example, in the design of the float profile in our previous work [11], we simplified the pressure of the fluid on the float to the differential pressure between the downstream of the orifice plate multiplied by the cross-sectional area of the float. However, considering that the pressure distribution is not uniform, in order to accurately determine the shape of the float, the pressure on the float should be calculated in the form of the integral pressure on the surface of the float or measured at multiple points and averaged.
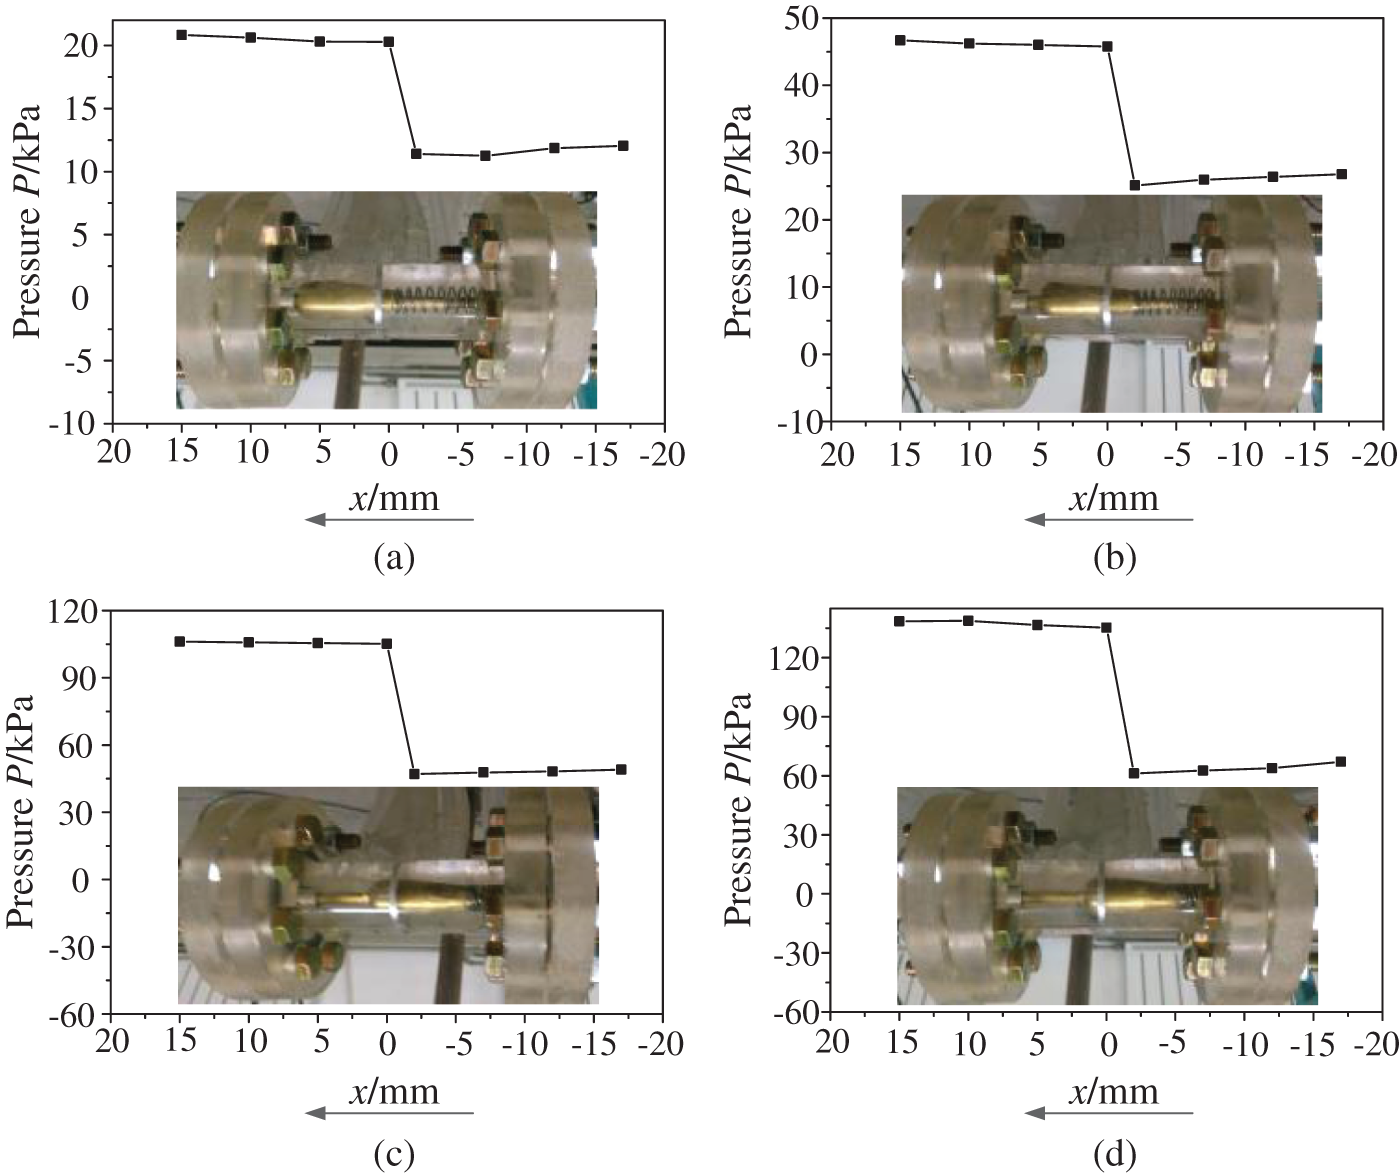
Figure 9: Pressure distribution in the MCOP
4.3 Choked Flow Characteristics of the MCOP
It can be seen from the above researches, a MCOP structure can only correspond to one choked flow rate. If it is necessary to change the choked flow rate, one method is to replace the float, another way is to replace springs with different strength. From the derivation process of the float line equation [11], when springs with different elastic coefficients are selected, the choked flow rate and the range of working differential pressure will change correspondingly. But theoretically, it should have little influence on the control accuracy of flow rate. In our study, the designed minimum working differential pressure ΔPmin = 6 kPa and the designed choked flow rate Q = 0.4 kg·s-1. For example, when the strength of spring from k to k' (assume that k' = tk), the minimum working differential pressure ΔPmin into ΔPmin':

Within the range of working differential pressure, the corresponding choked flow Q will be changed to Q' :

In order to verify the above theoretical analysis results, the linear spring applied in the previous experiment was replaced, and the spring strength changed from k = 604 N·m-1 to k' = 1635 N·m-1. At t = 2.7, according to Formulas (2) and (3), the minimum working differential pressure should be ΔPmin' = 16.2 kPa, and the corresponding choked flow rate should be Q' = 0.6573 kg·s-1.The choked flow characteristic curve after replacing the spring is shown in Fig. 10. As can be seen from the figure, when the differential pressure is between 16.2~106.8 kPa, the flow rate through the MCOP varies between 0.6463~0.6896 kg·s-1. The flow rate is not constant near the differential pressure of 16.2 kPa may be due to the poor linearity of the spring or the inconsistent flow coefficients before and after the spring replaced. Compared with the choked flow rate calculated according to Formula (3), the maximum deviation of the adjusting flow rate by changing the spring is 4.91%.
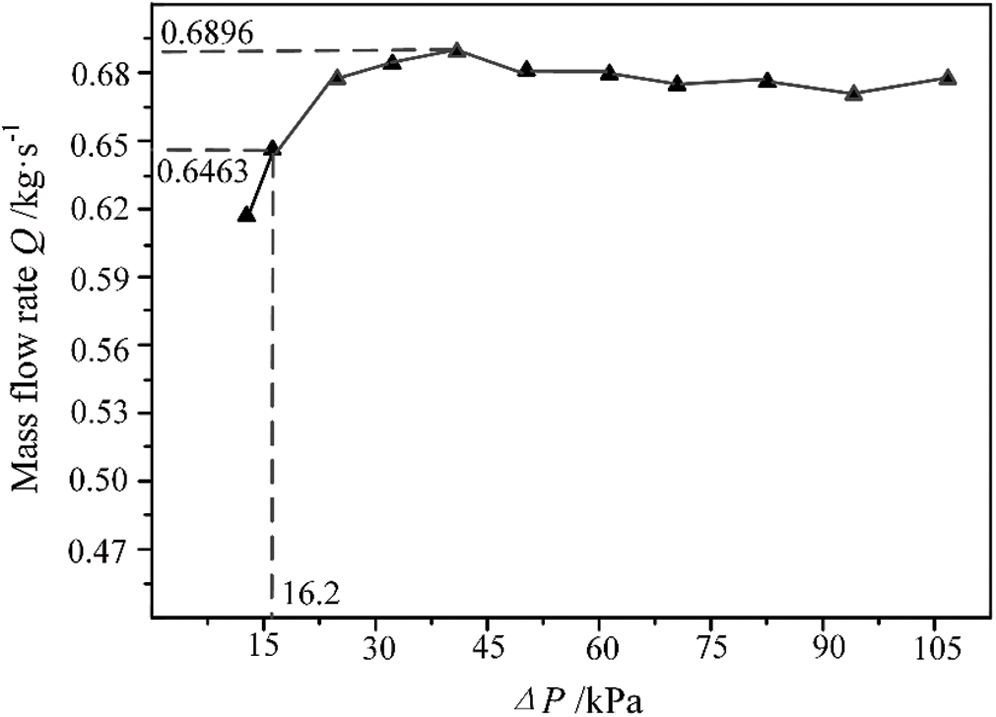
Figure 10: Choked flow characteristics of the MCOP after spring replacement
In this paper, the flow characteristics of the MCOP, including the annular orifice flow coefficient, the pressure distribution in the MCOP, and the adjustment characteristics are experimentally studied and analyzed. The main conclusions are as follows:
(1) The flow coefficient of the annular orifice is affected by many factors, including the flow rate, thickness of the orifice plate, float profile angle, float diameter and float eccentricity.
(2) The main pressure drop of MCOP occurs near the orifice plate, and both upstream and downstream of the orifice plate, the pressure changes in the flow direction.
(3) Choosing springs with different strengths can change the choked flow rate and the working pressure differential.
Acknowledgement: The authors gratefully expressed their thanks for the financial support for these researches from the Foundation of the Educational Commission of Hubei Province of China (No. Q20191310).
Funding Statement: This work was supported by the Foundation of the Educational Commission of Hubei Province of China [Grant No. Q20191310].
Conflicts of Interest: The authors declare that they have no conflicts of interest to report regarding the present study.
1. Im, S. K., Do, H. (2018). Unstart phenomena induced by flow choking in scramjet inlet-isolators. Progress in Aerospace Sciences, 97, 1–21. DOI 10.1016/j.paerosci.2017.12.001. [Google Scholar] [CrossRef]
2. Hong, K. C., Griston, S. (2013). Best practice for the distribution and metering of two-phase steam. SPE Production & Facilities, 12(3), 173–180. DOI 10.2118/35422-PA. [Google Scholar] [CrossRef]
3. Liu, J., Chen, J., Chen, Z. (2008). Investigation on the choking flow characteristics in electronic expansion valves. International Journal of Thermal Sciences, 47(5), 648–658. DOI 10.1016/j.ijthermalsci.2007.05.006. [Google Scholar] [CrossRef]
4. Mignot, G., Corradini, M. (2008). Critical flow experiment and analysis for supercritical fluid. Nuclear Engineering and Technology, 40(2), 133–138. DOI 10.5516/NET.2008.40.2.133. [Google Scholar] [CrossRef]
5. White, F. (2003). Fluid mechanics. 5th edition, Boston: MA: McGraw-Hill. [Google Scholar]
6. Ingle, M. A. (2014). Characterizing cryogenic propellant flow behavior through a cavitating venturi in comparison to alternative flow control mechanisms. The University of Texas at El Paso, Texas, USA. [Google Scholar]
7. ISO 9300. (2005). Measurement of gas flow by means of critical flow Venturi nozzles. [Google Scholar]
8. Wang, B., Zheng, J., Yu, Y., Lv, R., Xu, C. (2020). Shock-wave/rail-fasteners interaction for two rocket sleds in the supersonic flow regime. Fluid Dynamics & Materials Processing, 16(4), 675–684. DOI 10.32604/fdmp.2020.09681. [Google Scholar] [CrossRef]
9. Peng, G., Wakui, A., Oguma, Y., Shimizu, S., Hong, J. (2018). Periodic behavior of cavitation cloud shedding in submerged water jets issuing from a sheathed pipe nozzle. Journal of Flow, Control Measurement & Visualization, 06(01), 15–26. DOI 10.4236/jfcmv.2018.61002. [Google Scholar] [CrossRef]
10. Huang, B., Qiu, S. C., Li, X. B., Wu, Q., Wang, G. Y. (2019). A review of transient flow structure and unsteady mechanism of cavitating flow. Journal of Hydrodynamics, 31(3), 429–444. DOI 10.1007/s42241-019-0050-0. [Google Scholar] [CrossRef]
11. Wolf, B., Revankar, S. T., Riznic, J. R. (2017). Assessment of choked flow models for subcooled flashing flow through steam generator tube cracks. International Conference on Nuclear Engineering Book of Abstracts: Icone.The Japan Society of Mechanical Engineers, Tokyo, Japan. [Google Scholar]
12. Zhang, X. K., Wang, D. (2015). A flow control device for incompressible fluids. Flow Measurement and Instrumentation, 41, 165–173. DOI 10.1016/j.flowmeasinst.2014.12.008. [Google Scholar] [CrossRef]
13. Zhang, X. K., Wang, D., Liao, R., Zhao, H., Shi, B. (2019). Study of mechanical choked venturi nozzles used for liquid flow controlling. Flow Measurement and Instrumentation, 65, 158–165. DOI 10.1016/j.flowmeasinst.2018.12.001. [Google Scholar] [CrossRef]
14. Atashparvar, S., Bijankhan, M., Mahdavi Mazdeh, A. (2019). Application of constant flow rate control valve in pump discharge regulation. Journal of Irrigation and Drainage Engineering, 145(7), 06019005. DOI 10.1061/(ASCE)IR.1943-4774.0001393. [Google Scholar] [CrossRef]
15. Rezazadeh, P., Bijankhan, M., Mahdavi Mazdeh, A. (2019). An experimental study on a flow control device applicable in pressurized networks. Flow Measurement and Instrumentation, 68, 101533. DOI 10.1016/j.flowmeasinst.2019.01.017. [Google Scholar] [CrossRef]
16. Hao, C. Z., Song, X. M., Jia, Z. N. (2019). Influence of the hole chamfer on the characteristics of a multi-hole orifice flowmeter. Fluid Dynamics & Materials Processing, 15(4), 391–401. DOI 10.32604/fdmp.2019.07771. [Google Scholar] [CrossRef]
17. Xu, Y., Yu, Z. W., Zhang, T., Li, G. (2008). Influence of key factors on discharge coefficient in V-cone flowmeter. Journal of Mechanical Engineering, 44(12), 105–111 (in Chinese). [Google Scholar]
 | This work is licensed under a Creative Commons Attribution 4.0 International License, which permits unrestricted use, distribution, and reproduction in any medium, provided the original work is properly cited. |