DOI: 10.32604/fdmp.2021.010767
ARTICLE
A Water-Heat-Force Coupled Framework for the Preparation of Soils for Application in Frozen Soil Model Test
1College of Civil Engineering and Architecture, Xinxiang University, Xinxiang, 453000, China
2School of Journalism and Communication, Xinxiang University, Xinxiang, 453000, China
3College of Civil Engineering and Architecture, Tianjin Chengjian University, Tianjin, 300384, China
*Corresponding Author: Daoming Shen. Email: shen2019@xxu.edu.cn
Received: 27 March 2019; Accepted: 26 October 2020
Abstract: The freezing of soil containing a liquid is a complex transient heat conduction problem involving phase change and release or absorption of latent heat. Existing efforts have essentially focused on theoretical research and numerical simulations. In the present study, the problem is approached from an experimental point of view using the so-called “freezing model test” method. In particular, in order to establish a precise relationship between the model and the prototype, a temperature similarity criterion is derived using the condition of an equal number of Kosovitch. Similarity is also established with respect to other aspects. A similarity criterion for the water field is determined on the basis of relevant partial differential equations. Analogous criteria for the stress field and load are derived using an elastic model. The validity of this approach is experimentally verified. The research results provide a practical and reasonable method for calculating the parameters for preparing model soils. They also constitute a theoretical basis and a technical support for the design and implementation of a water-heat-force similarity coupled framework.
Keywords: Latent heat; frozen soil; temperature field; water-heat-force coupled framework
Nomenclature
| A~J: | parameter index in π theorem |
| A: | side thrust coefficient |
| C: | cohesive force |
| E: | modulus of elasticity |
| H: | depth |
| Q: | the latent heat released during the freezing process of soil element |
| Fo: | Fourier number of prototype |
| Fo’: | Fourier number of model |
| Ko: | Kosovitch number of prototype |
| Ko’: | Kosovitch number of model |
| Cc: | the ratio of specific heat of volume |
| CF: | the elastic modulus reduction ratio |
| Cp: | the pressure reduction ratio |
| CQ: | the ratio constant of latent heat |
| Cs: | specific heat capacity of soil |
| Ct: | the ratio of temperature |
| Cσ: | the stress reduction ratio |
| a: | coefficient of thermal conductivity |
| d: | freezing pipe diameter |
| u: | radial displacement |
| t: | temperature |
| r: | the radius of frozen soil column in polar coordinate form |
| an: | the thermal conductivity coefficient |
| t0: | initial temperature of soil |
| tb: | outer wall temperature of freezing pipe |
| tc: | cold source temperature of freezing pipe |
| td: | the soil freezing temperature |
| tn: | the temperature from the freezing pipe center r, n =1 for unfrozen soil, n =2 for frozen soil |
| ty: | freezing time |
| tθ: | the initial temperature of surrounding soil, which is assumed to be constant |
| λ: | thermal conductivity |
| τ: | the freezing time |
| ζ: | the boundary coordinate of frozen wall, i.e., the extension radius of frozen soil column |
| ψ: | latent heat |
| ζ: | thickness of frozen wall |
| γ: | soil bulk density |
| φ: | internal friction angle |
| π: | dimensionless number |
| μ: | Poisson’s ratio |
| ρ: | density of rock and soil mass |
| λ1, λ2: | the thermal conductivity of unfrozen soil and frozen soil respectively, and λ1 < λ2 |
| λn: | thermal conductivity of soil |
| εr, εt: | radial and tangential deformation |
The frozen soil temperature field mainly investigates the variation pattern of the temperature of frozen soil with time during freezing. As far as the phase change is concerned, it is a transient heat conduction problem [1,2]. When latent heat is absorbed or released at the interface between the solid phase (frozen area) and the liquid phase (unfrozen area), the interface usually moves, due to which, it belongs to “phase transition” or “moving boundary problem”. The problem of heat conduction with phase transition is nonlinear, and therefore, it is very difficult to find an appropriate analytical method to tackle it. Permafrost is sensitive to temperature, and is also the fundamental property that distinguishes it from other soil types [3–5]. A deep understanding of the variation pattern of the temperature field as well as its evolution is very important. Such an understanding is vital for many problems, including the freezing process and its development, the design and construction of frozen soil engineering, the prediction and prevention of the environmental disasters related to frozen soils, and the transformation and utilization of frozen soil environment. Therefore, the main emphasis of the research on artificial freezing engineering is the study of thermal or temperature field. It is an important task to study the evolution of temperature field and the influencing factors in the freezing process. The variation in heat exchange and temperature field is a complex Stefan problem with a moving boundary, internal heat source and phase transformation [6–9]. Due to these reasons, it is paramount to reveal the mechanism of soil freezing to study the changes and spatio-temporal distributions of heat (cold), temperature, stress, strain and water in the process of freezing. With the advantages of controllable load, quantity of heat (cold), initial conditions and boundary conditions, measurable temperature field, water field and stress-strain field, the freezing model test has gradually become an indispensable testing method for the study of the mechanics of frozen soils [10,11].
Studies focusing on the temperature field of permafrost span back to more than 200 years. In the 1960s and before that, the studies mainly focused on the empirical correlations and calculations of indoor and outdoor thermal parameters. Due to the geographical location and environmental impact, the former Soviet Union has always been a pioneer in the study of frozen soil. It is one of the pioneering countries to carry out the experimental tests and research in the fields of frozen soil mechanics, frozen soil thermophysics, frozen soil, water and heat improvement, and the infrastructure of the freeze-thaw cycle effect. The country has also become the pioneer in developing the theoretical research on frozen soils. Since the 1970s, the numerical simulation of phase change temperature field has entered a new stage. Studies focusing on complex geometry, material nonlinearity, complex engineering geology and hydrogeological conditions have been reported. Among them, Sumginmi et al. are the two representative experts in the field of frozen soil research [12]. Lee et al. studied the mass and heat transfer of ideal porous media materials, and proposed methods to calculate the mass transfer coefficient and heat using various tests [13]. A numerical study of heat transfer in a square cavity, which was filled with Al2O3-water nanofluid and heated from the left-hand side, was presented by Jalali et al. [14]. Slama et al. [15] investigated the problem of mixed convection of a nanofluid in a vertical porous channel with one wall heated, while the other cooled. Ding et al. [16] studied the nonlinear temperature field. According to the development process and the state characteristics of the frozen wall, the freezing process was divided into four stages, namely the active freezing before and after the intersection, the maintenance of freezing when the frozen wall is stable, and the natural recovery after cutting off the cold source. Based on the variational principle, Guo et al. [17] put into use the finite element analysis of the temperature field of the shaft frozen wall, established the finite element model of the temperature field of the shaft frozen wall, and summarized the equation used to calculate the temperature and thickness of the frozen wall. After considering the phase change characteristics of pore water, Zhang et al. [18] regarded the formation process of frozen wall and the evolution process of the temperature field as a two-dimensional heat conduction phenomenon, solved the finite element method and verified it with the measured data. The same authors proposed a simple and effective method for the treatment of phase change latent heat in the heat transfer process, and reported that the thermal conductivity and specific heat of soil changed with the change of temperature. Therefore, it is difficult to accurately reflect the nonlinear freezing process of soil based on the similarity criterion of temperature field, which is established by constant thermal parameters [19–23]. In cold region engineering and the development of artificial freezing method, the engineering accidents were usually caused by the errors in calculating the temperature field. It is not only of great theoretical significance, but also of great economic and social benefit to establish the similarity criterion of frozen soil model test on the basis of the change to thermal parameters with negative temperature.
From the above analysis, it could be observed that the studies on temperature field of frozen soil have mainly focused on theoretical research and numerical simulations, while the experimental analysis is still lacking in literature. In this paper, based on the determination of scale and similarity criteria of the model tank tests, the self-simulation of the frozen wall is guaranteed according to the equal number of Kosovitch criteria of the model and the prototype. According to the partial differential equation of the water field model, the water field similarity criterion is determined. In accordance with the elastic mathematical model of the artificial frozen wall, the stress field similarity criterion and the load similarity criterion are derived. The model test considering latent heat is verified using calculations, and provides a reliable method and testing steps for the implementation of model experiment. The similarity criterion of freezing temperature field model of subway connecting passage has clear physical meaning and higher practical value.
2 Model Tank Test Scale and Similarity Criteria
The basic assumptions of the model tank test include the following aspects: (1) The thermal conductivity is not affected by the formation pressure, due to which, the axisymmetric space problem can be transformed into axisymmetric plane problem for the calculation model. This assumption could be justified. (2) In the frozen area, the soil is assumed to be continuous, uniform and isotropic. (3) The temperature along the radial direction of the frozen pipe is approximately constant, and the initial temperature is uniform in the frozen area. (4) When the soil is frozen, the release of latent heat is all located at the freezing front. Furthermore, the release of latent heat is uniform and continuous. The model experiment is the scale reduction of prototype experiment, including the following aspects of synchronous scale reduction.
2.1 Determination of the Model Geometry and Parameters
A model tank is generally required for the model test of soil, which is filled with soil and equipped with test elements. The model tank of the test system is also provided with loading and freezing systems. In order to simulate the freezing process of the underground soil, the test system is fitted with a vertical loading system to simulate the upper soil load and other loads. According to the characteristics of the freezing construction process and the relevant model test experience [24], the geometric reduction ratio is determined to be 1:5 (Cξ = 5).
Generally, the horizontal channel of the connecting channel is a straight wall arch structure, and the steel support shotcrete is generally employed for the initial lining with a thickness of 250 mm during the freezing construction. Additionally, C30-S8 formwork is used to build waterproof reinforced concrete as the secondary lining with a thickness of 400 mm. The width of the prototype connecting channel is 3300 mm. In order to meet the convenience requirements of the test, the height of the model is determined to be 400 mm, while the width is 350 mm. Furthermore, the radius of curvature at the top of the arc is 220 mm, while the thickness is 15 mm. The plexiglass is adopted in the side wall of the model box. The proportion of the plexiglass is small and can be provided with high tensile strength, corrosion resistance, moisture resistance, and elasticity modulus close to the actual structure. Moreover, the plexiglass has excellent mechanical properties. More importantly, the lining part is not the main content of the study, because it is much stronger than the soil itself. Therefore, the influence of the lining part could be ignored.
According to the Fourier criterion, Eq. (1) is obtained.

where Ca is the ratio of heat transfer coefficient, Cτ is the ratio of time, and Cl is the ratio of geometry. In this test, the material is employed similar to the field geotechnical material, which means that the model soil is the same as the prototype soil (see Eq. (2)).

Therefore, one hour’s process in the model test is equivalent to 25 h engineering process of the prototype. In practical engineering, the active on-site freezing time is usually 45 days. According to the actual measurement results, the temperature of salt water decreased to less than –18°C after 7 days of active freezing, and to less than –24°C after 15 days of active freezing. On the basis of the engineering experience, the excavation can be started when the temperature difference between the brine at the outlet and the return circuit is no more than 2°C. The temperature of the brine during the excavation is cut down to –28°C.
According to the time scale, the active freezing time of the model test should be 45 h/5 = 9 h. In order to make the model test simulate and reflect the water field, stress field, displacement field as well as the temperature field similar to the prototype, the actual active freezing time can be based on the formation of freezing temperature field, the predicted design strength and the pre-determined thickness of the frozen wall. In fact, no matter how perfect the model test is, in the final analysis, it is still the model, which is difficult to fully reflect the real system. Therefore, in order to make the reduction ratio of model test time and prototype time as equal to the one derived from similarity criterion as possible, in addition to considering the prototype, it is necessary to modify, improve, arrange and control the freezing pipe layout and single hole flow rate of the model. By considering various factors, such as energy loss and groundwater flow, the time scale is modified by Cτ = 36, which means that the process of model test for one hour is equivalent to the process of prototype for 36 h, so as to effectively reduce the time required for the test.
2.3 Derivation of the Temperature Criterion
In order to ensure the automatic simulation of the frozen wall, the number of Kosovitch criterion of the model and the prototype should be equal (see Eq. (3)).

where CQ is the ratio constant of the latent heat, Cc is the ratio of the specific heat of the volume and Ct is the ratio of temperature. The temperature criterion is defined by Eq. (4).

Therefore, the soil temperature of the model should be equivalent to that of the prototype. The salt water temperature in the model is equal to that in the prototype, whereas the original soil temperature is the same as that of the soil in the model. The Kosovitch criterion of the frozen wall in the model should bear an equivalence with that of the prototype frozen wall, and so should the Fourier criterion. The temperature distribution and the thermal conductivity of the model are consistent with those of the prototype. At the corresponding time point, the thickness of the frozen wall of the model is similar to that of the prototype.
Generally, the initial conditions of the model and the prototype are easy to meet the similarity requirements. However, the similarity of the boundary conditions is difficult to fully meet due to the influence of environment, such as the temperature of the environment where the model box is located, and the water supply conditions. Because the properties of the soil used in the model test are similar to those of the rock and soil used in the prototype project, it is necessary to properly control the salt water flow, salt water temperature and the freezing time (ty) during the model test. These control parameters of the model resemble to those of the prototype, which can basically guarantee the automatic simulation of the prototype. The calculation model of the temperature field of single freezing machine is given by Eq. (5).

where τ > 0, and 0 < r < ∞. According to the thermodynamic theorem, the heat balance equation on the frozen front without considering latent heat is given by Eq. (6).

The initial condition of the model is given by: τ >0, t(r = 0) = ty, t(∞) = t0, t(r = ζ) = td, where tn is the temperature from the freezing pipe center r, n =1 for unfrozen soil, n =2 for frozen soil, τ is the freezing time, an is the thermal conductivity coefficient, r is the radius of the frozen soil column in polar coordinate form, and λ1, and λ2 represent the thermal conductivity of the unfrozen and frozen soils, respectively, and λ1 < λ2. Furthermore, ζ is the boundary coordinate of the frozen wall, which represents the extension radius of the frozen soil column, Q is the latent heat released during the freezing process of the soil element, tθ is the initial temperature of the surrounding soil, which is assumed to be constant, t0 is the salt water temperature in the freezing pipe, which represents the cold source temperature, and is assumed to be constant, and td is the soil freezing temperature.
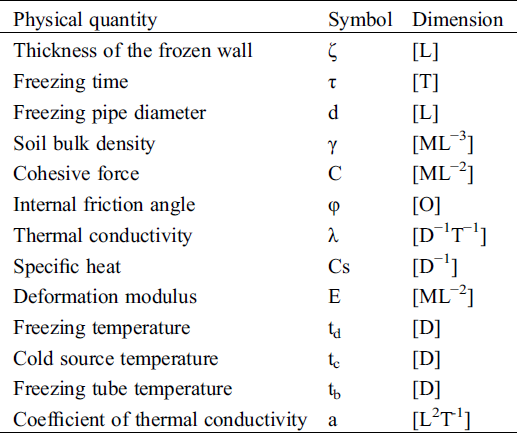
According to Eqs. (5) and (6), in order to simulate the temperature field in the freezing model test, the required physical, mechanical and thermodynamic parameters must include temperature t, time τ, specific heat capacity (Cs) of soil, thermal conductivity (λn) of soil, latent heat (ψ), cold source temperature (tc) of the freezing pipe, outer wall temperature tb of the freezing pipe and initial temperature t0 of the soil. The dimensions of the above parameters are presented in Tab. 1.
Table 1: Matrix table of the parameters
According to the similarity criterion, the correlation among the parameters can be written as Eq. (7).

The π term can be expressed as Eq. (8).

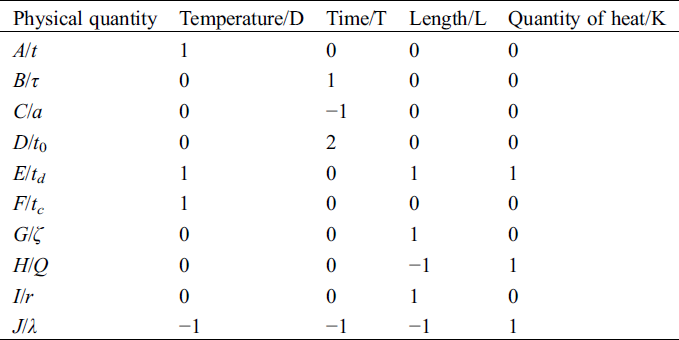
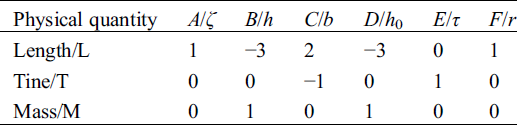
According to the similarity principle, the dimensional analysis is presented in Tab. 2.
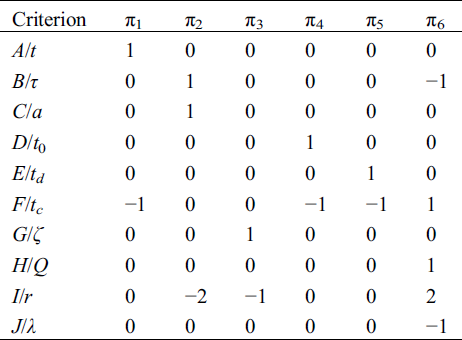
The algebraic equations of each item should be represented as Eq. (9).
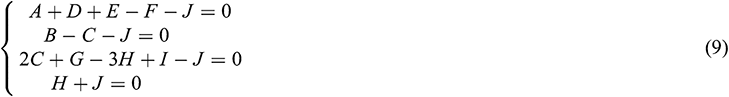
According to the above algebraic equations, the matrix is listed, and the linear algebra theory is applied to solve the parameters in the matrix. The results are presented in Tab. 3.
Therefore, the criteria to be solved in the model test can be verbalized as the temperature criterion I, Fourier criterion, geometric criterion, temperature criterion II, temperature criterion III and Kosovitch criterion. These criteria are represented by Eqs. (10) and (11).
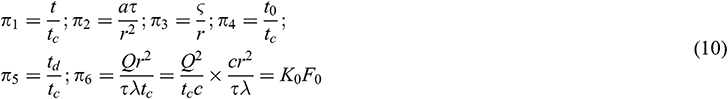
where

According to the above derivation, the simulation criterion equation can be deduced, which is given by Eq. (12).

When the rock and soil used in the model test are approximately the same as the prototype rock and soil and have the same water content, the latent heat released by the unit soil during freezing should also be the same (see Eq. (13)).

This expression indicates that the temperature of each point in the model test is the same as that of the corresponding point in the prototype project. In other words, the temperature does not need to be scaled.
2.4 Derivation of the Similarity Criterion of Water Field
Generally speaking, the mathematical model of the water field is given by Eq. (14).

The initial condition is given by the expressions: τ = 0, h = h0. The final boundary condition is given by the expressions: τ > 0, H(h = ∞) = h0, h(h= ζ) = 0. Here, h is the moisture content of the soil, and b is the moisture conductivity of the soil, which can be obtained through conventional soil mechanics test and permeability test. In the geotechnical medium, the water separation field, electric field and seepage field have similar physical and mathematical processes. The functional expression and π term representation of the similarity criterion are given by Eq. (15).

The matrix dimensions corresponding to the similar simulation are listed in Tab. 4.
Table 4: Analysis of the dimensions
According to the above analysis, Eq. (16) is obtained.
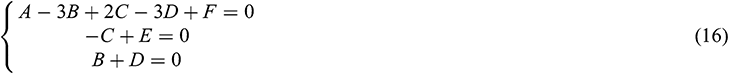
According to the matrix of Eq. (16), three similarity criteria can be obtained using the linear algebra method, as listed in Tab. 5.
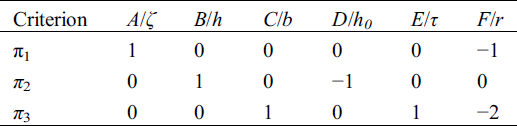
Therefore, the three similarity criteria to be worked out are the geometric criterion, the moisture content criterion and the Fourier criterion. These criteria are represented by Eq. (17).

From the above results, the corresponding criterion is written as Eq. (18).

2.5 Derivation of the Stress Field Similarity
Because of the frost heave, excavation, construction and other engineering activities, the stress process of artificial frozen wall is very complicated. Its elastic mathematical model is given by Eq. (19).
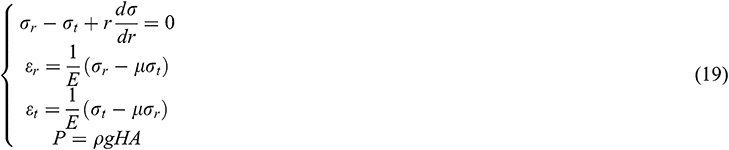
where E is the modulus of elasticity, εr and εt are the radial and tangential deformations, u is the radial displacement, μ is the Poisson’s ratio, ρ is the density of rock and soil mass, H is the depth, and A is the side thrust coefficient.
Owing to the adaptability of the temperature and the complexity of the test site, it is very difficult to accurately measure the stress of the frozen wall. Therefore, the simulation of frozen wall is divided into two stages, namely the external load simulation and the automatic simulation.
From the abovementioned model, the similarity criterion of force and the geometric similarity criterion could be obtained. Therefore, as long as the properties of the geotechnical materials used in the model are the same as those of the actual project, and the vertical pressure applied can bear a numerical equivalence to the vertical pressure in the actual project, the ground pressure generated by the model is equal to that of the prototype, and the corresponding stress is also similar [25,26].
The results show that the strength σ of the frozen soil is a function of the temperature, freezing time, stress time, load and certain other factors. However, the most important parameter is the temperature T of the frozen soil. If the number of Fourier criterion of the model frozen wall is the same as that of the actual engineering frozen wall, the temperature distribution of the two is uniform. When the initial and final boundary conditions of the model are similar to those of the actual engineering, the stress state of the frozen wall of the model becomes similar to that of the prototype. Since the geotechnical properties of the model and the prototype are identical, the test process can realize the similarity between the parameters of the model and the prototype by only controlling the salt water temperature ty, the formation temperature t0 and the freezing time τ, so as to realize the automatic simulation of the model and the prototype.
2.6 Derivation of the Coad Similarity Criteria
According to the mechanical criterion, Cσ = Cp = CF, where Cσ is the stress reduction ratio, Cp is the pressure reduction ratio and CF is the elastic modulus reduction ratio. Assuming that the material used in the model test is the same as that of the prototype (all of them are cohesive soils with the same properties and the preparation process is strictly identical), Eq. (20) can be written

That is to say, the area distribution load and the stress distribution of the model provide homology with that of the prototype.
For the frozen construction project, the pressure load is generally caused by the self-weight of the soil. Therefore, the area distribution force applied in the model test system should be equivalent to the self-weight stress (see Eq. (21)).

where ρ, g and H are the density or effective density (below the groundwater level), gravity acceleration and the thickness of the overlying soil layer, respectively.
For this model tank test system, the load includes the overburden pressure at the corresponding depth in the model and the loading system of the model test system. In the prototype, the thickness of the overburden of a frozen part is 15.736 m. According to the data provided by the geotechnical investigation, the specific weight of the soil is 18 kN/m3, so the self-weight stress of the overlying soil in the prototype is 283.2 kPa (recorded as 285 kPa for the convenience of calculations). In the model test, the thickness of the overburden is 0.6 m, and the weight of the model soil is 20 kN/m3. Therefore, the self-weight pressure of the overburden is 12 kPa, and the vertical pressure load required by the loading system is 273 kPa. The size of the model tank is 2 × 1 × 1.2 m3. Therefore, the concentrated load to be applied is 273 × 2 × 1 = 546 kN.
The construction process of the model test includes soil preparation, soil consolidation, sensor embedding and freezing process simulation. The purpose is to carry out the construction simulation of the freezing process based on the developed soil freezing model test system. In the test, the method of first filling and consolidating, and then installing the freezing pipe and embedding the sensor is adopted.
3.1 Preparation of the Earth Materials
The test soil was picked up from Xiaodian, Xinxiang city, China. First of all, the soil samples were analyzed in the laboratory. The density, dry density and water content of the undisturbed soil samples are listed in Tab. 6.
Table 6: Conventional geotechnical test parameters of the undisturbed soil samples
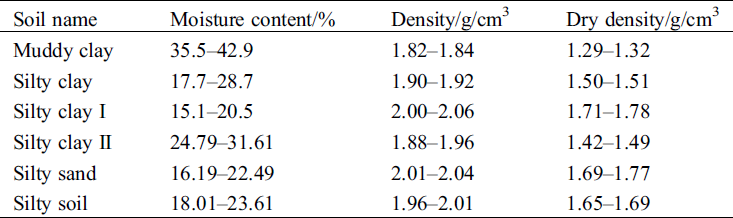
Considering silty clay I for the model test, the physical indices are the liquid limit of 41, plastic limit of 19, plastic index of 22, dry density of 1.75 g/cm3 and the moisture content of 18%. Because the soil employed in the test is almost the same as the prototype soil, and the moisture content and the density are similar, whereas the specific heat, thermal conductivity and thermal conductivity coefficient of the soil are basically identical to the prototype.
Before mixing, the moisture content of the soil was determined. According to the current moisture content, 18% of the set moisture content and 1.75 g/cm3 of density, the amount of water to be added per unit soil weight was calculated. On this basis, the total water consumption was calculated. Then, water was sprinkled using the watering can and the system was mixed using a shovel. Debris was removed from the stone during mixing. The water spraying was completed, and the mixing was continued to make the water content of each part as consistent as possible. At last, the soil was stirred evenly, covered with plastic cloth and clogged for 48 h. Later, it was filled in the model tank. Soil sample is shown in Fig. 1.
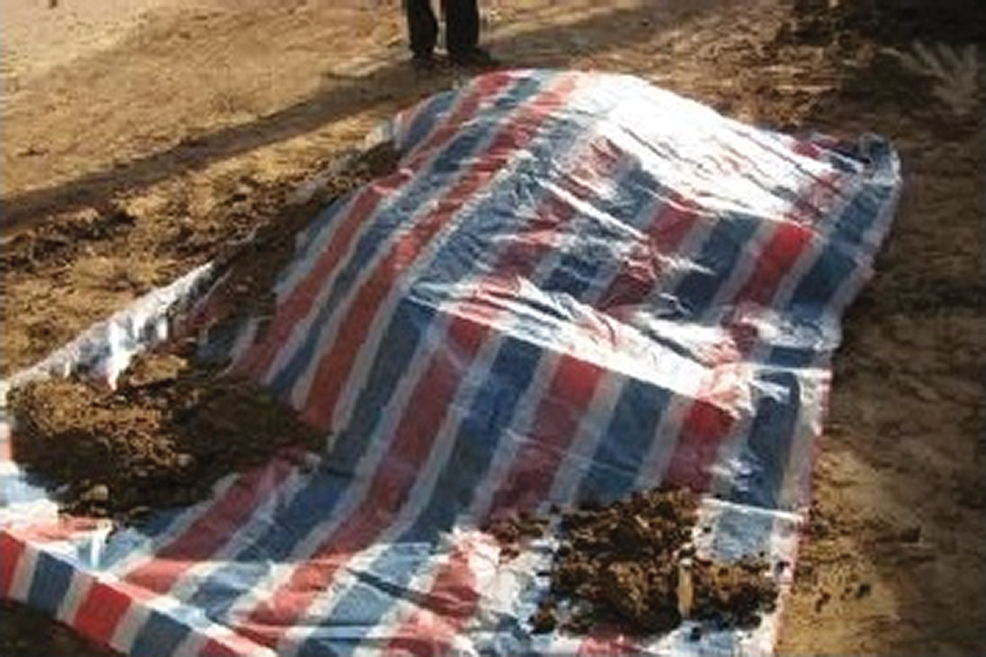
Figure 1: Soil preparation for tests
3.2 Filling and Consolidation of the Model Tank
The experiment simulates the freezing process of the saturated soil under open conditions, which requires the model tank to be airtight, with excellent adiabatic effect, ascertaining the water supplement function.
Firstly, the insulation board is laid around and at the bottom of the inner side wall of the model tank. The plastic cloth is laid on the insulation board to provide anti-seepage capability, so as to ensure that the water content of the internal soil does not change significantly during the test. In order to supplement the migration of water caused by capillary change in the freezing process, it is essential to set up a necessary water replenishing system. The method is to put up a water supply pipe at the four corners of the model tank, which is a section of 1 m length PVC plastic pipe with a hole on the side wall.
During the freezing test, the water level in the make-up pipe should be maintained at a definite level (at the height of 1 m). If the water level drops, make-up water would be needed. In the event of the increase in the water level, excess water will flow out through the overflow facilities. The next step is to fill the soil in the model trench. First, 20 cm thick sand should be laid at the bottom of the model tank, with the aim of continuously replenishing water to each part. The water in the water replenishing pipe can flow freely through the sand layer. The required soil material of silty clay was calculated according to the thickness of 30 cm for each layer. After the soil material is paved evenly, it was lightly patted and compacted to the thickness of 30 cm. Then, the next layer of soil was filled (the filling process is shown in Fig. 2).
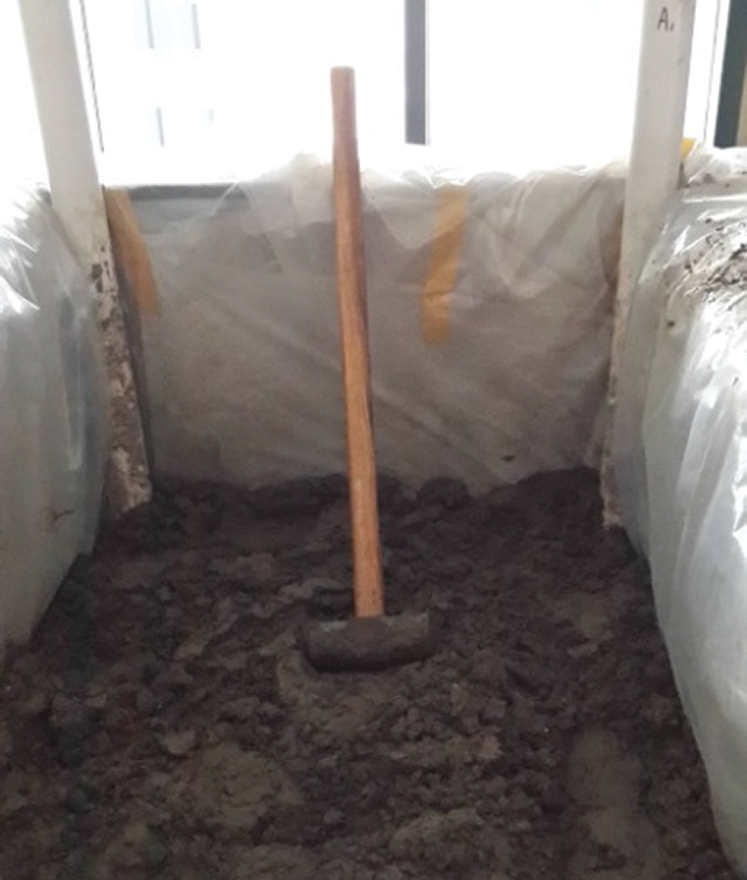
Figure 2: Filling earth material in the model tank
After the soil in the model trench is filled to a height of 1.2 m, the filling process is completed. The consolidation stage follows. Firstly, the reaction frame was installed on the top of the model tank, and a load plate of 1 cm thickness was placed on the top surface of the fill. The hydraulic jack was installed, and the hydraulic equipment was connected. Five dial indicators at the four corners and the middle position of the model tank were installed. Secondly, 10 kPa pressure was applied in the model talk to preload the soil. The applied pressure should be consolidated with the soil in the model box after the test components work normally. When applying each level of load, attention should be paid to the appropriate time interval, that is, the next level of load should be applied after the upper level load is stable and the consolidation is over. During the consolidation process, continuous water supply was ensured to the soil along the water supply pipeline. Finally, when the consolidation is completed, the soil sample in the trench was taken with a soil sampler, and its water content and density were measured in the laboratory. The final moisture content of the consolidated silty clay was 18%, whereas the final density was 1.75 g/cm3.
3.3 Embedding the Freezing Pipe and Various Sensors
During the construction of artificial freezing method, the method of embedding the freezing pipe into the soil follows the pipe drilling method. The freezing pipe is inserted into the pre-determined position. In this model experiment, the hole opener is employed to open the hole at the designated position of the side wall, and the size of the hole diameter is equal to the size of the frozen tube. Then, the self-made “Luoyang shovel” is adopted to cut inward along the opening position to the set depth, and the freezing pipe is rammed into the soil. Using the same cutting method, the frost heave three-dimensional stress and three-dimensional strain testing device are placed in the designated position and lowered to a pre-determined depth. The implantation of the freezing tube and the inbuilt sensors are shown in Fig. 3.
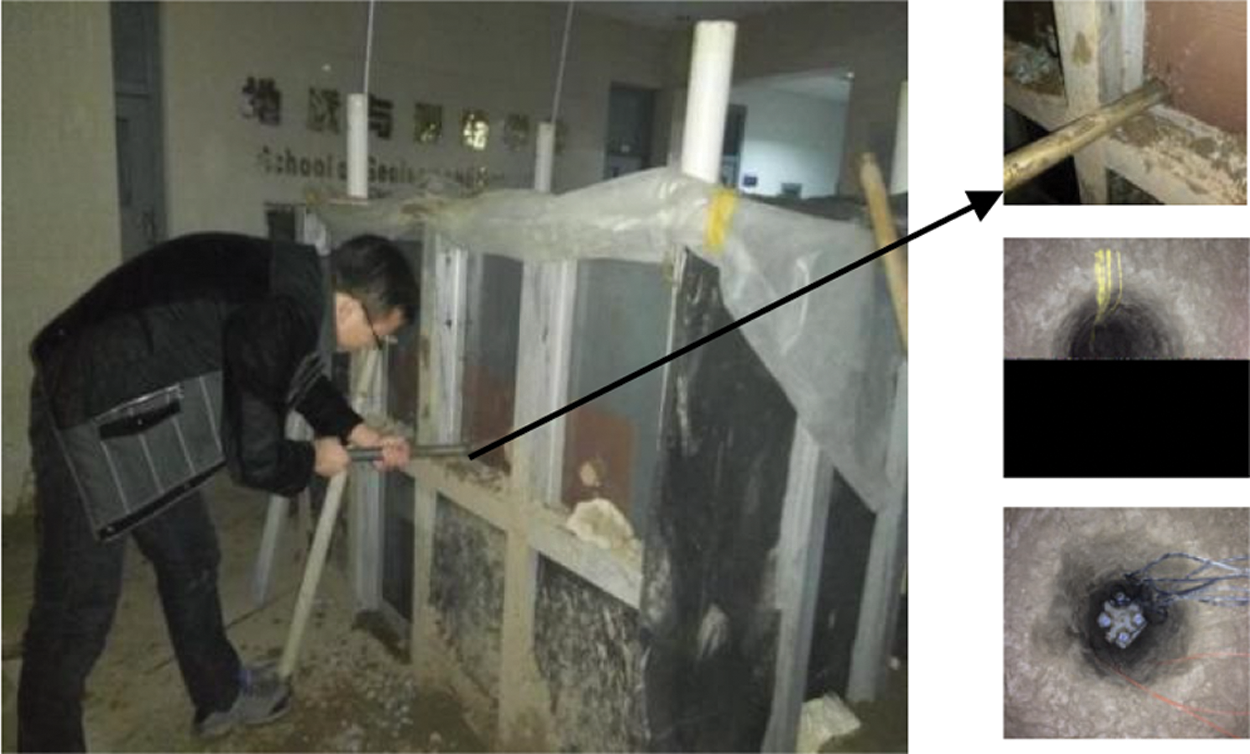
Figure 3: Implantation of the freezing tube and the inbuilt sensors
Freezing pipe, corrugated stainless steel hose, freezing station and the temperature ball valve are connected in series with the pipe fittings and other connecting parts to form a closed circulation system. Therefore, in order to check whether the system leaks liquid and whether the pipeline is unblocked, the circulation system is first filled with clear water to carry out the clean water circulation test. At the same time, the clean water has the function of cleaning the pipeline. After the inspection of the circulation system, polyurethane insulation material is used to insulate all the components of the circulation system. This is done to reduce the heat loss through the circulation system during the refrigeration process.
4 Layout of the Measuring Points and the Verification of Results
4.1 Layout of the Measuring Points
The arrangement of temperature measuring points is based on three characteristic interfaces, which include main interface, interface, and axial surface. The main surface is the vertical plane passing through the axis of the frozen pipe. The interface is the vertical plane, which is consistent with the axis of the freezing pipe and located between the two freezing pipes. The axis plane is the horizontal plane passing through the freezing pipe. The main purpose of selecting these planes for testing is to use as few measuring points as possible to reflect the temperature distribution and change in the whole soil. The distance between the thermocouple temperature sensors is 5 cm, and they are arranged along the three axes.
In order to make the test results comparable, the arrangement of the three directions is symmetrical. In addition, temperature measuring tubes G1 and G2 are set 15 cm above and below the axis. In the same position of the two temperature measuring tubes, a temperature sensor is arranged. Among them, G1 pipe is filled with the same cohesive soil, while G2 pipe is empty. In this paper, the influence of air convection on the temperature monitoring is analyzed. The specific arrangement of the temperature measuring points is shown in Fig. 4.
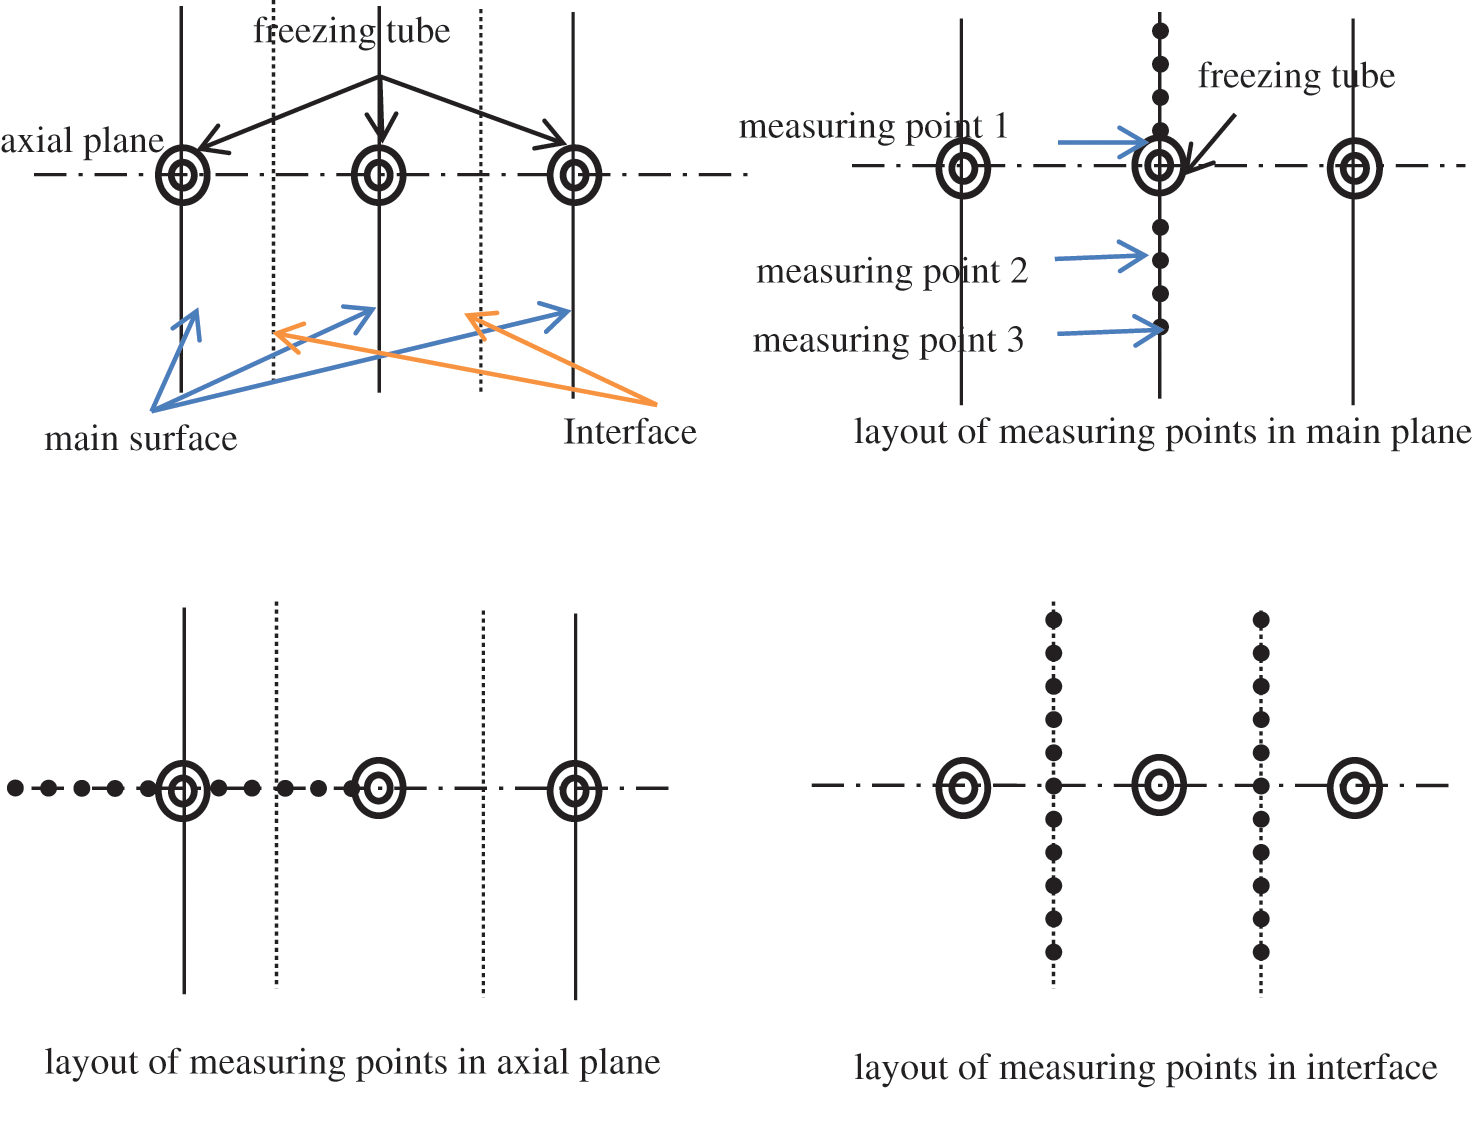
Figure 4: Schematic of the arrangement of thermocouples in the cross section of the model
4.2 Verification of the Results
The finite element software, ANSYS, is adopted to simulate the two-dimensional freezing temperature field. The size of Model 1 is a 2 m × 0.5 m rectangle. The lower boundary of the rectangular model is provided with a constant temperature cold source of −20°C. The other boundary is set as adiabatic. When the temperature drops to −5°C, the increase in the latent heat of the frozen soil sample is very small. In order to optimize the model operation and ensure the calculation accuracy, the method adopted in reference [27] is used, in which, the release of the latent heat of frozen soil is within the range of 0–2°C. Moreover, the latent heat value of the phase change is 139430 kJ/m3. The size and material of Model 2 and Model 1 are the same. However, when setting the soil thermal parameters, the change of specific heat and thermal conductivity with temperature is not considered. The average value is used as its thermal conductivity and specific heat, which means that the thermal conductivity of Model 2 is 1.82 W/(m·°C), whereas the specific heat is 1.58 kJ/(kg·°C).
The calculation results of measuring points 1, 2 and 3 of Model 1 and Model 2 are sorted out, as shown in Fig. 5.
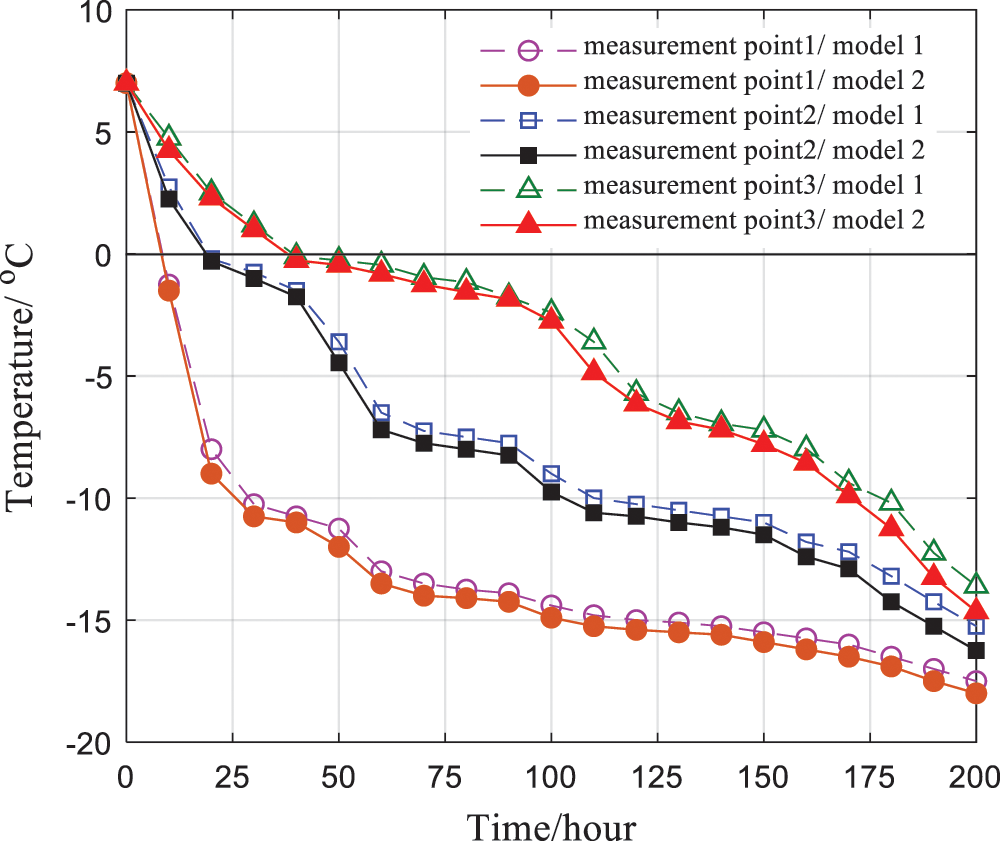
Figure 5: Comparison of the temperature among the temperature measurement points 1, 2 and 3 in the two models
It can be seen from Fig. 5 that there are some errors in the temperature curves of Model 1 and Model 2. Considering the change of thermal parameters with temperature, the prediction accuracy of frozen soil temperature field is higher, which means that the temperature field considering the latent heat of phase change has higher prediction accuracy. This shows that, when the similarity criterion obtained from the theory and the similarity relationship between the prototype and the model are satisfied, the original soil adopted for model test is validated that the test model is effective to measure the temperature field of frozen soil.
Considering the latent heat effect, the similarity criterion of freezing model test and the calculation method of model soil thermal parameters are obtained. The research results provide a direction for the preparation of frozen model soil, and are expected to provide theoretical basis and technical support for the design and implementation of frozen model test. Based upon the results, following conclusions are drawn.
(1) In order to make the reduction ratio of the model test time and prototype time as equal to that derived from the similarity criterion as possible, in addition to considering the prototype, it is also necessary to modify, improve, arrange and control the freezing pipe layout and single hole flow of the model. After considering various factors, such as energy loss and groundwater flow, the time scale is modified by Cτ = 36, so as to effectively reduce the time required for the test.
(2) The strength σ of frozen soil is a function of temperature, freezing time, stress time, load and certain other factors. However, the most important parameter is the temperature t of the frozen soil. If the number of Fourier criterion of the model frozen wall is equal to that of the actual engineering frozen wall, the temperature distribution of the two is the same.
(3) Because the geotechnical properties of the model and the prototype are identical, it can be concluded that, by only controlling the salt water temperature ty, formation temperature t0 and freezing time τ in the process of model test, the similarity between these parameters of the model and the prototype can be realized, so as to realize the automatic simulation of the model and the prototype.
(4) According to the data provided by the geotechnical investigation, the average weight of the soil is 18 kN/m3. Therefore, the self-weight stress of the overlying soil in the prototype is 285 kPa, while the weight of the model soil is 20 kN/m3. The vertical pressure load required by the loading system is 273 kPa. Therefore, the concentrated load to be applied is 546 kN.
(5) It was found by verification that, when the similarity criterion obtained from the theory and the similarity relationship between the prototype and the model are satisfied, the original soil adopted for the model test is valid.
Funding Statement: This work was supported by the National Natural Science Foundation of China (Grant No. 41877251) and Research and Practice Project of Higher Education Teaching Reform in Henan Province, China (Grant No. 2019SJGLX463).
Conflicts of Interest: The authors declare that they have no conflict of interest regarding the present study.
1. Ju, Y., Xu, G. Q., Mao, L. T., Duan, Q. Q., Zhao, T. S. (2005). 3D numerical simulation of stress and strain properties of concrete shield tunnel lining and modeling experiments. Engineering Mechanics, 22(3), 157–165. [Google Scholar]
2. Liao, M., Lai, Y., Wang, C. (2016). A strength criterion for frozen sodium sulfate saline soil. Canadian Geotechnical Journal, 53(7), 1176–1185. DOI 10.1139/cgj-2015-0569. [Google Scholar] [CrossRef]
3. Kojima, Y., Heitman, J. L., Flerchinger, G. N., Ren, T. S., Horton, R. (2016). Sensible heat balance estimates of transient soil ice contents. Vadose Zone Journal, 15(5), 45–57. DOI 10.2136/vzj2015.10.0134. [Google Scholar] [CrossRef]
4. Zhu, Z., Ning, J., Ma, W. (2007). Constitutive model and numerical analysis for the coupled problem of water, temperature and stress fields in the process of soil freeze-thaw. Engineering Mechanics, 24(5), 138–144. [Google Scholar]
5. Zhu, L., Li, D., Guo, X. (1993). Simulitude analysis of modeling test for chargeless pressure in the freezing-thawing process of soil. Journal of Glaciology and Geocryology, 15(1), 166–169. [Google Scholar]
6. Coperey, A., Revil, A., Stutz, B. (2019). Electrical conductivity versus temperature in freezing conditions: A field experiment using a basket geothermal heat exchanger. Geophysical Research Letters, 46(24), 14531–14538. DOI 10.1029/2019GL084962. [Google Scholar] [CrossRef]
7. Tounsi, H., Rouabhi, A., Tijani, M., Guerin, F. (2019). Thermo-hydro-mechanical modeling of artificial ground freezing: Application in mining engineering. Rock Mechanics and Rock Engineering, 52(10), 3889–3907. DOI 10.1007/s00603-019-01786-9. [Google Scholar] [CrossRef]
8. Alzoubi, M. A., Madiseh, A., Hassani, F. P., Sasmito, A. P. (2019). Heat transfer analysis in artificial ground freezing under high seepage: Validation and heatlines visualization. International Journal of Thermal Sciences, 139, 232–245. DOI 10.1016/j.ijthermalsci.2019.02.005. [Google Scholar] [CrossRef]
9. Holten, R., Boe, F. N., Almvik, M. (2018). The effect of freezing and thawing on water flow and MCPA leaching in partially frozen soil. Journal of Contaminant Hydrology, 219, 72–85. DOI 10.1016/j.jconhyd.2018.11.003. [Google Scholar] [CrossRef]
10. Geng, P., Yan, Q. X., He, C., Wang, B. (2010). Numerical simulation of underground construction by horizontal ground freezing method. Engineering Mechanics, 27(5), 122–127. [Google Scholar]
11. Yoshikawa, K., Overduin, P. P. (2005). Comparing unfrozen water content measurements of frozen soil using recently developed commercial sensors. Cold Regions Science and Technology, 42(3), 250–256. DOI 10.1016/j.coldregions.2005.03.001. [Google Scholar] [CrossRef]
12. An, W. (1990). Temperature, moisture, stress and interaction of frozen soil. Lanzhou: Lanzhou University Press. [Google Scholar]
13. Lee, K. B., Howell, J. R. (1991). Theoretical and experimental heat and mass transfer in highly porous media. International Journal Heat Mass Transfer, 34(8), 2123–2132. DOI 10.1016/0017-9310(91)90222-Z. [Google Scholar] [CrossRef]
14. Jalali, H., Abbassi, H. (2019). Analysis of the influence of viscosity and thermal conductivity on heat transfer by Al2O3-water nanofluid. Fluid Dynamics & Materials Processing, 15(3), 253–270. DOI 10.32604/fdmp.2019.03896. [Google Scholar] [CrossRef]
15. Slama, S., Kahalerras, H., Fersadou, B. (2017). Mixed convection of a nanofluid in a vertical anisotropic porous channel with heated/cooled walls. Fluid Dynamics & Materials Processing, 13(3), 155–172. [Google Scholar]
16. Ding, D., Fu, L., Pang, R. (1982). Mathematical model and calculation of frozen soil wall change. Science Bulletin, 14, 875–879. [Google Scholar]
17. Guo, L., Pang, R., Shi, W. (1981). Finite element analysis of shaft freezing temperature field. Journal of China Institute of Mining, 3, 42–46. [Google Scholar]
18. Zhang, Y. (1979). Finite element method for predicting formation and temperature distribution of frozen wall. Journal of Coal Industry, 2, 29–38. [Google Scholar]
19. Shen, D. M., Si, H., Xia, J. H., Li, S. Q. (2019). A new model for the characterization of frozen soil and related latent heat effects for the improvement of ground freezing techniques and its experimental verification. Fluid Dynamics & Materials Processing, 15(1), 63–76. DOI 10.32604/fdmp.2019.04799. [Google Scholar] [CrossRef]
20. Shen, D. M., He, W., Xia, J. H., Li, S. Q. (2019). Experimental verification and double particle diameter calculation model of thermal conductivity of frozen soil considering latent heat. UPB Scientific Bulletin, Series D: Mechanical Engineering, 81(4), 71–86. [Google Scholar]
21. Shen, D., Gui, C., Xia, J., Xue, S. (2020). Experimental analysis of the performances of unit refrigeration systems based on parallel compressors with consideration of the volumetric and isentropic efficiency. Fluid Dynamics & Materials Processing, 16(3), 489–500. DOI 10.32604/fdmp.2020.08969. [Google Scholar] [CrossRef]
22. Li, S. Q., Zhang, X. C., Chen, Z. X., Zhao, L., Xia, J. H. (2019). Model tests and similarity criteria for nonlinear freezing of rock and soil. Engineering Mechanics, 36(1), 192–198. [Google Scholar]
23. Holten, R., Boe, F. N., Almvik, M., Katuwal, S., Stenrod, M. et al. (2018). The effect of freezing and thawing on water flow and MCPA leaching in partially frozen soil. Journal of Contaminant Hydrology, 219, 72–85. DOI 10.1016/j.jconhyd.2018.11.003. [Google Scholar] [CrossRef]
24. Yi, W., Zhang, W. (2015). Architectural structure test. Beijing: China Construction Industry Press. [Google Scholar]
25. Alzoubi, M. A., Madiseh, A., Hassani, F. P., Sasmito, A. P. (2019). Heat transfer analysis in artificial ground freezing under high seepage: Validation and heatlines visualization. International Journal of Thermal Science, 139, 232–245. DOI 10.1016/j.ijthermalsci.2019.02.005. [Google Scholar] [CrossRef]
26. De Guzman, E. M. B., Stafford, D., Alfaro, M. C., Dore, G., Arenson, L. U. (2018). Large-scale direct shear testing of compacted frozen soil under freezing & thawing conditions. Cold Regions Science and Technology, 151, 138–147. DOI 10.1016/j.coldregions.2018.03.011. [Google Scholar] [CrossRef]
27. Chen, Z. X., Li, S. Q., Wang, X. X., Xia, J. H. (2017). Analysis on impact and sensitivity of thermal parameters on frozen soil temperature field. Water Resources and Hydropower Engineering, 48(5), 136–141. [Google Scholar]
 | This work is licensed under a Creative Commons Attribution 4.0 International License, which permits unrestricted use, distribution, and reproduction in any medium, provided the original work is properly cited. |