
 Submit a Paper
 Propose a Special lssue
 Open Access
ARTICLE

Photovoltaic Power Prediction Cosidering Mode Switching and Parallel Weight Adjustment
1 School of Electrical Engineering and Automation, Henan Polytechnic University, Jiaozuo, 454003, China
2 Key Laboratory of Smart Grid of Ministry of Education, Tianjin University, Tianjin, 300072, China
3 Dispatching Center, Dongguan Power Supply Bureau of Guangdong Power Grid Co., Ltd., Dongguan, 523000, China
* Corresponding Author: Penghui Liu. Email:
(This article belongs to the Special Issue: Modelling, Optimisation and Forecasting of Photovoltaic and Photovoltaic thermal System Energy Production)
Energy Engineering 2025, 122(4), 1387-1402. https://doi.org/10.32604/ee.2025.062627
Received 23 December 2024; Accepted 10 February 2025; Issue published 31 March 2025
 View Full Text
 Download PDF
Abstract
The photovoltaic (PV) output process is inherently complex, often disrupted by a multitude of meteorological factors, while conventional detection methods at PV power stations prove inadequate, compromising prediction accuracy. To address this challenge, this paper introduces a power prediction method that leverages modal switching (MS), weight factor adjustment (WFA), and parallel long short-term memory (PALSTM). Initially, historical PV power station data is categorized into distinct modes based on global horizontal irradiance and converted solar angles. Correlation analysis is then employed to evaluate the impact of various meteorological factors on PV power, selecting those with strong correlations for each specific mode. Subsequently, the weights of meteorological parameters are optimized and adjusted, and a PALSTM neural network is constructed, with its parallel modal parameters refined through training. Depending on the prediction time and input data mode characteristics, the appropriate mode channel is selected to forecast PV power station generation. Ultimately, the feasibility of this method is validated through an illustrative analysis of measured data from an Australian PV power station. Comparative test results underscore the method’s advantages, particularly in scenarios where existing detection methods are lacking and meteorological factors frequently fluctuate, demonstrating its superior prediction accuracy and stability.Keywords
In recent years, the world has paid more attention to the development and utilization of solar energy, and photovoltaic power generation has been developing rapidly [1]. Many countries have introduced measures such as subsidies, tax incentives and green credits to support the development of renewable energy. However, due to the high randomness and instability of photovoltaic power generation under the comprehensive action of multiple physical processes, the photovoltaic output fluctuates significantly, which poses a major challenge to the optimal operation and dispatch of microgrids and regional power grids [2]. Therefore, it is urgent to make high-precision short-term or ultra-short-term prediction of the power generation of photovoltaic power stations. This can not only ensure the stability of energy supply but also improve the efficiency of power dispatching and optimize the allocation of power resources [3,4].
In view of this subject, domestic and foreign experts have carried out a lot of research. Many of them explored the influence of different meteorological factors through the analysis of various special circumstances. Literature [5,6] focused on photovoltaic prediction under different extreme weather conditions and discusses in depth the potential threats of various weather factors such as sandstorms, thunderstorms, hail and snowstorms to the performance of photovoltaic systems. By analyzing the relationship between historical meteorological data and photovoltaic power generation, a model was established to predict the power generation capacity of photovoltaic power plants under extreme weather conditions. However, these analyses mainly focused on assessing the impact of severe weather on the power generation of photovoltaic plants. Literature [7,8] systematically analyzed the influence of cloud clusters, focusing on the specific impact of different cloud layers, cloud movement and cloud occlusion on the power generation performance of photovoltaic power stations. The study reveals how changes in light conditions from clouds directly affect the energy output of photovoltaic modules. Literature [9–11] deeply analyzed the relationship between image and photovoltaic power and proposed a dynamic modeling method of “image-photovoltaic power generation” mapping relationship. This innovative research aims to directly use satellite cloud image data to predict photovoltaic power generation, thereby simplifying the conversion process of traditional meteorological data, reducing errors and improving the accuracy of prediction. Literature [12] studied the effect of atmospheric particulate concentration on solar radiation attenuation. Based on the prediction of atmospheric solar optical thickness, a solar radiation transmission model was established to achieve effective prediction of photovoltaic power. However, most of the above studies only analyzed the impact of a single meteorological factor on photovoltaic power generation, and it is often necessary to consider the impact of a variety of meteorological factors on photovoltaic power generation in the actual forecast.
Some researchers classified the data according to meteorological types to reduce the impact of coupling between different meteorological factors on photovoltaic power prediction. Literature [13] divides photovoltaic data into broad weather types according to historical photovoltaic power characteristics. Construct different models for different weather conditions to reduce the overall forecast error. Literature [14–16] classifies historical data into different weather types by introducing concepts such as clustering and similar days and considers the influence of various meteorological factors on photovoltaic power generation while reducing the influence of different weather on forecasting. The shortcoming of this method is that the adaptability of a single forecasting method is insufficient. To overcome this problem, literature [17,18] propose that combined models can leverage the advantages of different prediction models, improve the generalization ability of prediction models, and thus increase the overall prediction accuracy.
The above studies need to use meteorological data, numerical weather forecast data or satellite cloud image data, auxiliary power data to achieve photovoltaic power prediction. However, the conventional photovoltaic power station through the station sensor photovoltaic power station environmental meteorological monitoring and solar radiation monitoring, often not directly obtain numerical weather forecast data or satellite cloud image data, so that most of the photovoltaic power public data sets do not include these two data. Therefore, conventional detection methods for photovoltaic power stations are often inadequate [19].
To sum up, in view of the unfavorable conditions such as limited monitoring means and frequent meteorological disturbances for photovoltaic power stations, a parallel long short-term memory neural network method for power generation prediction of photovoltaic power stations considering mode switching and weight adjustment is proposed in this paper. Specifically, the daily historical data are divided into three modes according to the global horizontal irradiance, solar angle and photovoltaic panel tilt angle. On this basis, the high impact meteorological factors of different modes are selected and weighted by correlation analysis. Then, the PALSTM model is constructed and trained. Secondly, the constructed considering modal switching-weight factor adjustment-parallel long short-term memory (MS-WFA-PALSTM) neural network is used for prediction. Finally, a practical example is given to verify the effectiveness of the above method and provide a theoretical basis for the accurate prediction of photovoltaic power generation.
The key factor affecting the short-term or ultra-short-term power generation of photovoltaic power stations is the irradiation intensity of sunlight on photovoltaic panels (that is, the received irradiance). Photovoltaic power generation is affected by a variety of meteorological factors, such as regular solar and earth motion, large-scale weather processes and local cloud transient disturbances, but ultimately will affect the amount of radiation received reaching the surface of the photovoltaic panel. This method analyzes the influence of different irradiation in different time periods, performs a weighted evaluation, and uses received irradiance to predict photovoltaic power generation. However, since the received irradiance at most times is not as smooth as the horizontal irradiance and inclined irradiance under the ideal clear sky state, it is often accompanied by multiple types of frequent random fluctuations. Therefore, when using irradiance to predict power generation, it is necessary to analyze the radiation conversion point and the receiving radiation fluctuation first.
2.1 Irradiation Conversion Point
Solar irradiance is the main factor affecting the output of photovoltaic power generation. Under normal circumstances, the higher the irradiance, the greater the power generation of photovoltaic modules [20]. Under ideal conditions, the level irradiance of clear sky and the slope irradiance gradually increase or decrease with the change of time, and with the determination of the interval of sampling points, the irradiance fluctuation values of adjacent sampling points should be similar. However, in practical applications, to obtain as much solar radiation energy as possible, photovoltaic panels are generally installed and fixed at a tilt toward the equator, and the tilt angle varies in different latitudes [21,22]. Therefore, with the tilt angle of the photovoltaic panel, there are two situations in which direct solar radiation and photovoltaic panel are vertical and direct solar radiation and photovoltaic panel are parallel in one day. The irradiation that plays a major role in the sampling points in both cases occurs at the transition point. When there is a irradiation conversion point, the received irradiance fluctuates, which affects the power generation of photovoltaic power stations.
2.2 Receiving Irradiance Fluctuates
Sunlight enters the atmosphere as parallel radiation. During the process of passing through the atmosphere, part of the radiation is scattered by gas molecules and suspended solid and liquid particles, and is shot in all directions, thus affecting the received irradiance [23]. As shown in Fig. 1, because the time and place of the appearance of these particles are not fixed, the irradiance value has a large change at some moments (that is, the moment of fluctuation). These fluctuating moments are not only difficult to predict but also affect the prediction of flat moments of irradiance value.
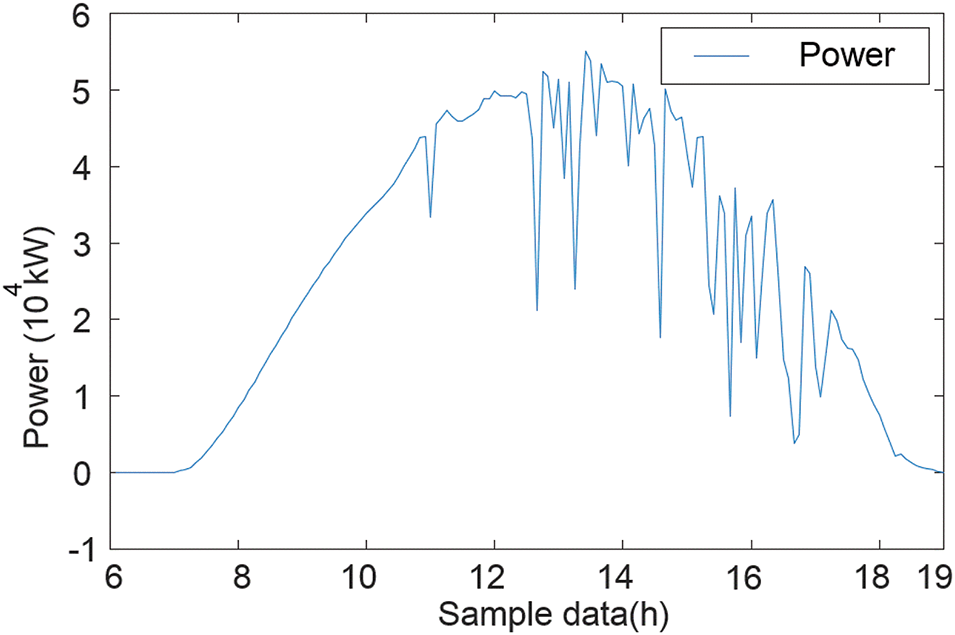
Figure 1: Schematic diagram of daytime photovoltaic power station power on 03 March 2019
3 Data Processing and Modal Partitioning
During data collection, there are abnormal changes in data due to detection devices or recording problems. Before power prediction, the data set needs to be preprocessed.
Using the 3-sigma [24], Eq. (1) is used as the detection method of photovoltaic abnormal data:
where Xi is the characteristic value matrix of photovoltaic data;
To avoid the influence of different dimensions [25], the processed data matrix is normalized by Eq. (2):
where vn is the data after data normalization; vi is the original data; vmin is the minimum value of data. vmax indicates the maximum value of the data.
3.2.1 Division Based on Irradiance
PV output is essentially affected by a variety of factors, which makes the PV output time series not only short-term randomness but also obvious daily, seasonal and annual periodicity. The general photovoltaic forecasting method analyzes the historical photovoltaic power data to find its power trend. For photovoltaic prediction, the more stable the historical photovoltaic power, the higher the prediction accuracy, and random fluctuations are the main factors causing errors in photovoltaic prediction. To improve the accuracy of PV power prediction, the power fluctuation stage and the power stability stage are divided to reduce the influence of the fluctuation stage on the stability stage. In practical applications, the irradiance is like the fluctuation of photovoltaic power generation curve, so this method divides the fluctuation of photovoltaic power based on the fluctuation value of global horizontal irradiation.
The global horizontal irradiance fluctuation is defined according to Eq. (3):
where Ft represents the global horizontal irradiance at time t; Ft-1 represents the global horizontal irradiance at the time before t; αt represents the fluctuation value of global horizontal irradiance at time t.
According to αt, the historical PV data were divided into high volatility period data and low volatility period data, and long short-term memory (LSTM) neural network prediction was performed. The root-mean-square error and the mean absolute error were calculated for the predicted data, and then the root-mean-square error and the mean absolute error were summed, and the weighted sum of the summed errors was obtained, as shown in Fig. 2.
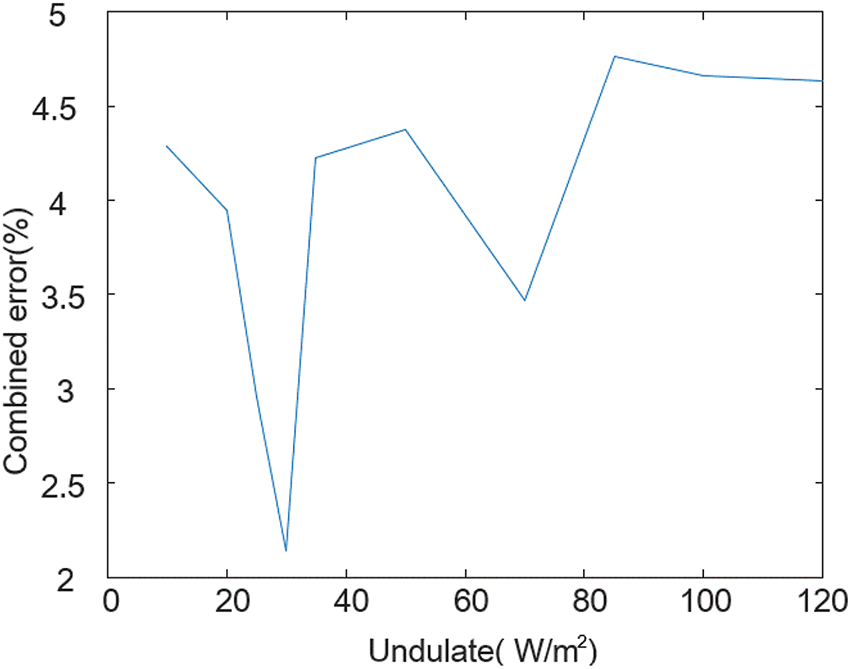
Figure 2: Fluctuation analysis
After many data experiments, different αt experiments are compared according to the comprehensive error. The smaller the comprehensive error is, the fluctuation period data divided by the fluctuation judgment value has the least interference to the stable period data. It is found that the comprehensive error is minimum when αt is 30.
3.2.2 Division Based on Angle of the Sun
For the data of low fluctuation period, its power curve trend is obvious, and no excessive analysis is needed in forecasting, while for the data of high fluctuation period without obvious trend, further analysis is needed. In the analysis of the above problems, it is found that there are two irradiation conversion points in one day, and the data of high fluctuation periods can be further divided by using the conversion points. However, the study of the transition point found that although the irradiation transition points always appeared at a fixed sampling point time in a short time, the transition point occurrence time would shift when the time span was quarter or year. In the ultra-short-term forecast, although it is to predict the photovoltaic power generation after a few minutes, it is necessary to analyze the data of one year or several years. Different predicted locations may also lead to different transition points appearing at different times. Therefore, it is not simple to set the transfer point at a specific moment, and it is necessary to determine and analyze the transfer point. As shown in Fig. 3, the trajectory of the sun can be clearly described. Combined with the principle of the emergence of the transition point, the sun orientation is used to replace the time of the specific transition point [26].
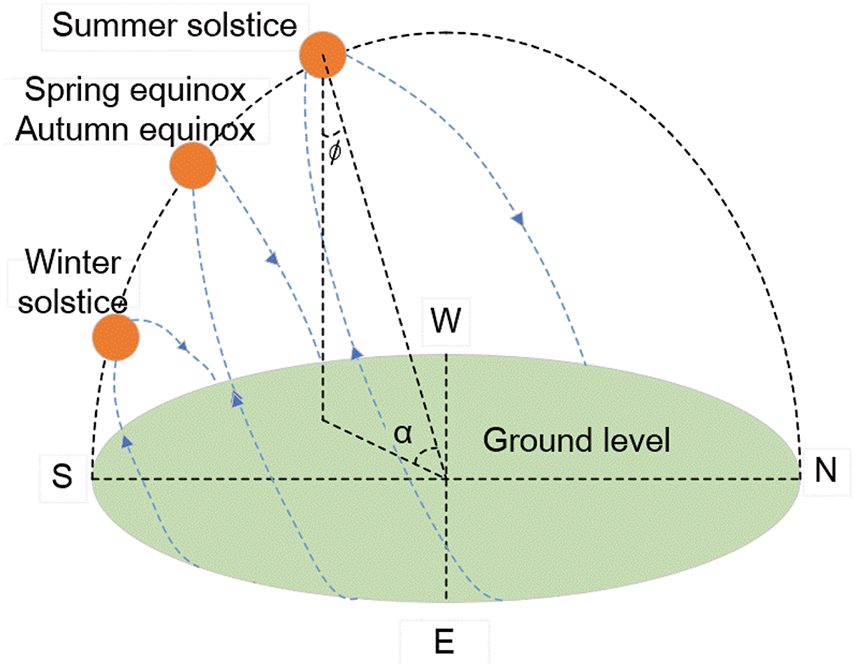
Figure 3: The trajectory of the sun’s motion
For example, Eq. (4) describes the trajectory of the sun and calculates the position of the sun:
where ϕ represents the zenith angle of the sun; λ represents the altitude angle of the sun; φ represents the latitude of the observation point; γ represents the declination angle of the sun; η represents the hour angle of the current time.
According to the cause of the conversion point, measure the angle θ between the photovoltaic panel and the ground, and judge the conversion point time according to the angle θ, solar zenith angle ϕ, and solar altitude angle λ. According to Eqs. (5) and (6), the data with high fluctuation are divided:
When Eqs. (5) or (6) are satisfied, it is the high-volatility data in a specific period otherwise, it is the data in a random high-volatility period.
In summary, the method records the high fluctuation data in a specific period as Mode 1; The data of the random period of high fluctuation are denoted as Mode 2; The low volatility period data is recorded as Mode 3.
4 MS-WFA-PALSTM Neural Network and Power Prediction Method
For the historical data obtained, not all meteorological parameters have an impact on photovoltaic power generation. With the division of the modes, the main meteorological parameters that affect the photovoltaic power will also change. Therefore, the selection of meteorological factors according to different modes has a positive effect on improving the prediction accuracy. In this paper, the Pearson correlation coefficient [27] is used to determine the relationship between different meteorological factors. The calculation method is as follows:
where Ai represents the data of influencing factors;
This method takes the data of the measured distributed solar photovoltaic power station in Uluru region of Central Australia from 2019 to 2021 as the experimental sample, and the previous 80% data is the training set. The training set was divided by the above mode partitioning method. The correlation coefficients between meteorological factors and photovoltaic power calculated by Pearson correlation coefficient are shown in Table 1, and the relevant meteorological factors were selected.
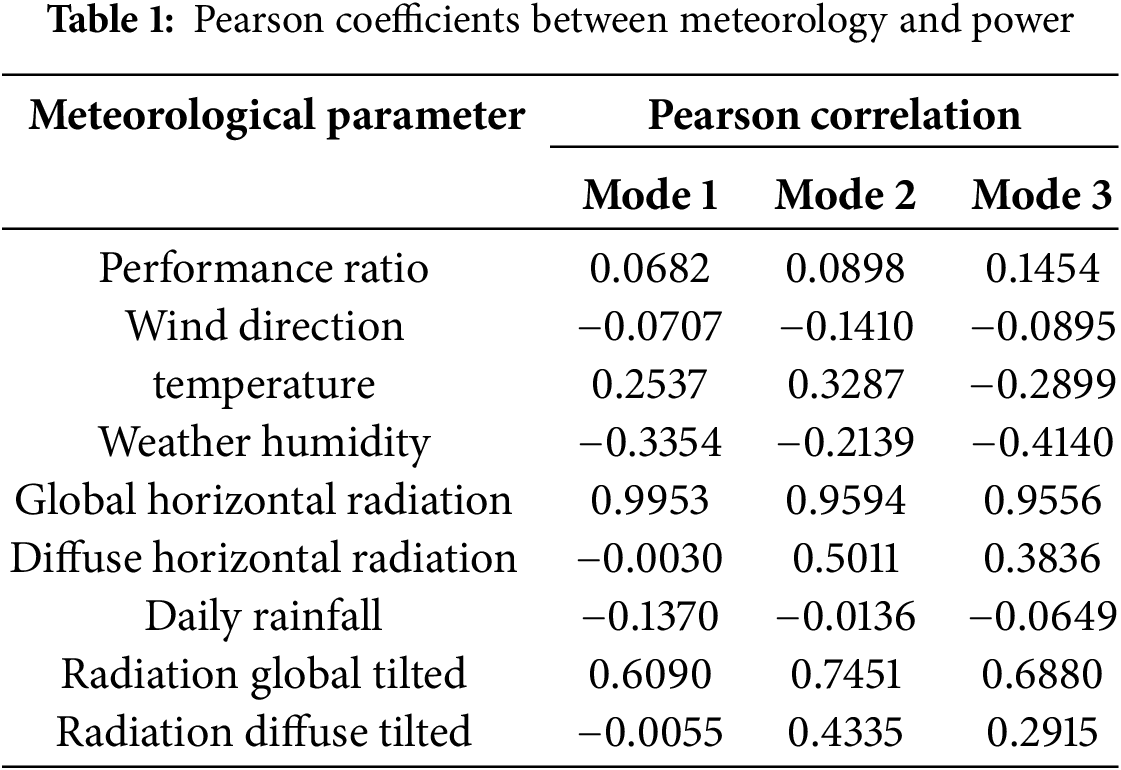
According to the calculation results of the coefficients in Table 1, the absolute value of the correlation coefficient belongs to a strong degree of correlation within the range [0.4, 1] according to the division of Pearson correlation coefficient [28]. Therefore, the relevant meteorological factors to determine Mode 1 include global horizontal radiation and global inclined radiation. The meteorological factors related to Mode 2 include global horizontal radiation, diffuse horizontal radiation, global oblique radiation and diffuse oblique radiation. The meteorological factors related to Mode 3 include global horizontal radiation and global oblique radiation.
There is a complex correlation between the local characteristics in each mode and the photovoltaic power, and the hidden vector at each moment has different effects on the output power with the change of time and weather. It is necessary to optimize and adjust the weight of relevant time intervals and concentrate the limited computing power into the key information of meteorological data, to save computing resources and obtain the most effective information quickly. This method obtains the weight of each element in the selected meteorological factors through weighted summation, and the weight represents the importance of the input information. To determine the weight of an element, it is first necessary to identify the time corresponding to the element and related meteorological factors and then obtain the photovoltaic power generation power at that time. Next, plug these two elements into the dot product formula to calculate the correlation between them. Then, the weight of the element can be obtained by proportional calculation between the exponential function of the correlation of the meteorological factor and the sum of the exponential function of the correlation of all meteorological factors at that moment. Finally, by multiplying the calculated weights with the original elements, the resulting new elements are used as predictive data.
Eq. (8) is used to calculate and normalize the similarity between different meteorological factors and photovoltaic power at the same time:
where
The meteorological data at the same time are weighed and summed by Eq. (9):
where Qt represents the new element after the weighted sum of time t.
4.3 Construct PALSTM Neural Network
LSTM neural network is a deep learning algorithm based on recurrent neural network and its core lies in three kinds of gate structures: forgetting gate, input gate and output gate. These three gates can be used to achieve effective control of historical information, collection of external data and screening of internal data [29,30].
The forgetting gate (10) is used to control the data transmission state to determine the degree to which the state of the previous unit is forgotten:
where σ represents the activation function; Gt represents the state matrix at time t; ht-1 represents the state matrix of the state unit at the previous time; Wf represents the weight matrix; bf represents the parameter matrix; t is the moment in time dimension; xt represents the input value at time t.
where it represents the new information state matrix entered at time t;
The output gate Eq. (12) is used to control the filtering degree of the current unit and generate the output result:
where Ot represents the state matrix output at time t; Wo represents the weight matrix; bo represents the parameter matrix.
Photovoltaic power data is always trained from front to back in time series in the prediction of conventional one-way neural networks. This training method has a low utilization rate of data, and it is impossible to conduct feature analysis of multiple data at the same time. The parallel neural network trains and analyzes different modes at the same time to further improve the prediction accuracy of the model. The overall framework of the MS-WFA-PALSTM neural network model constructed in this paper is shown in Fig. 4.
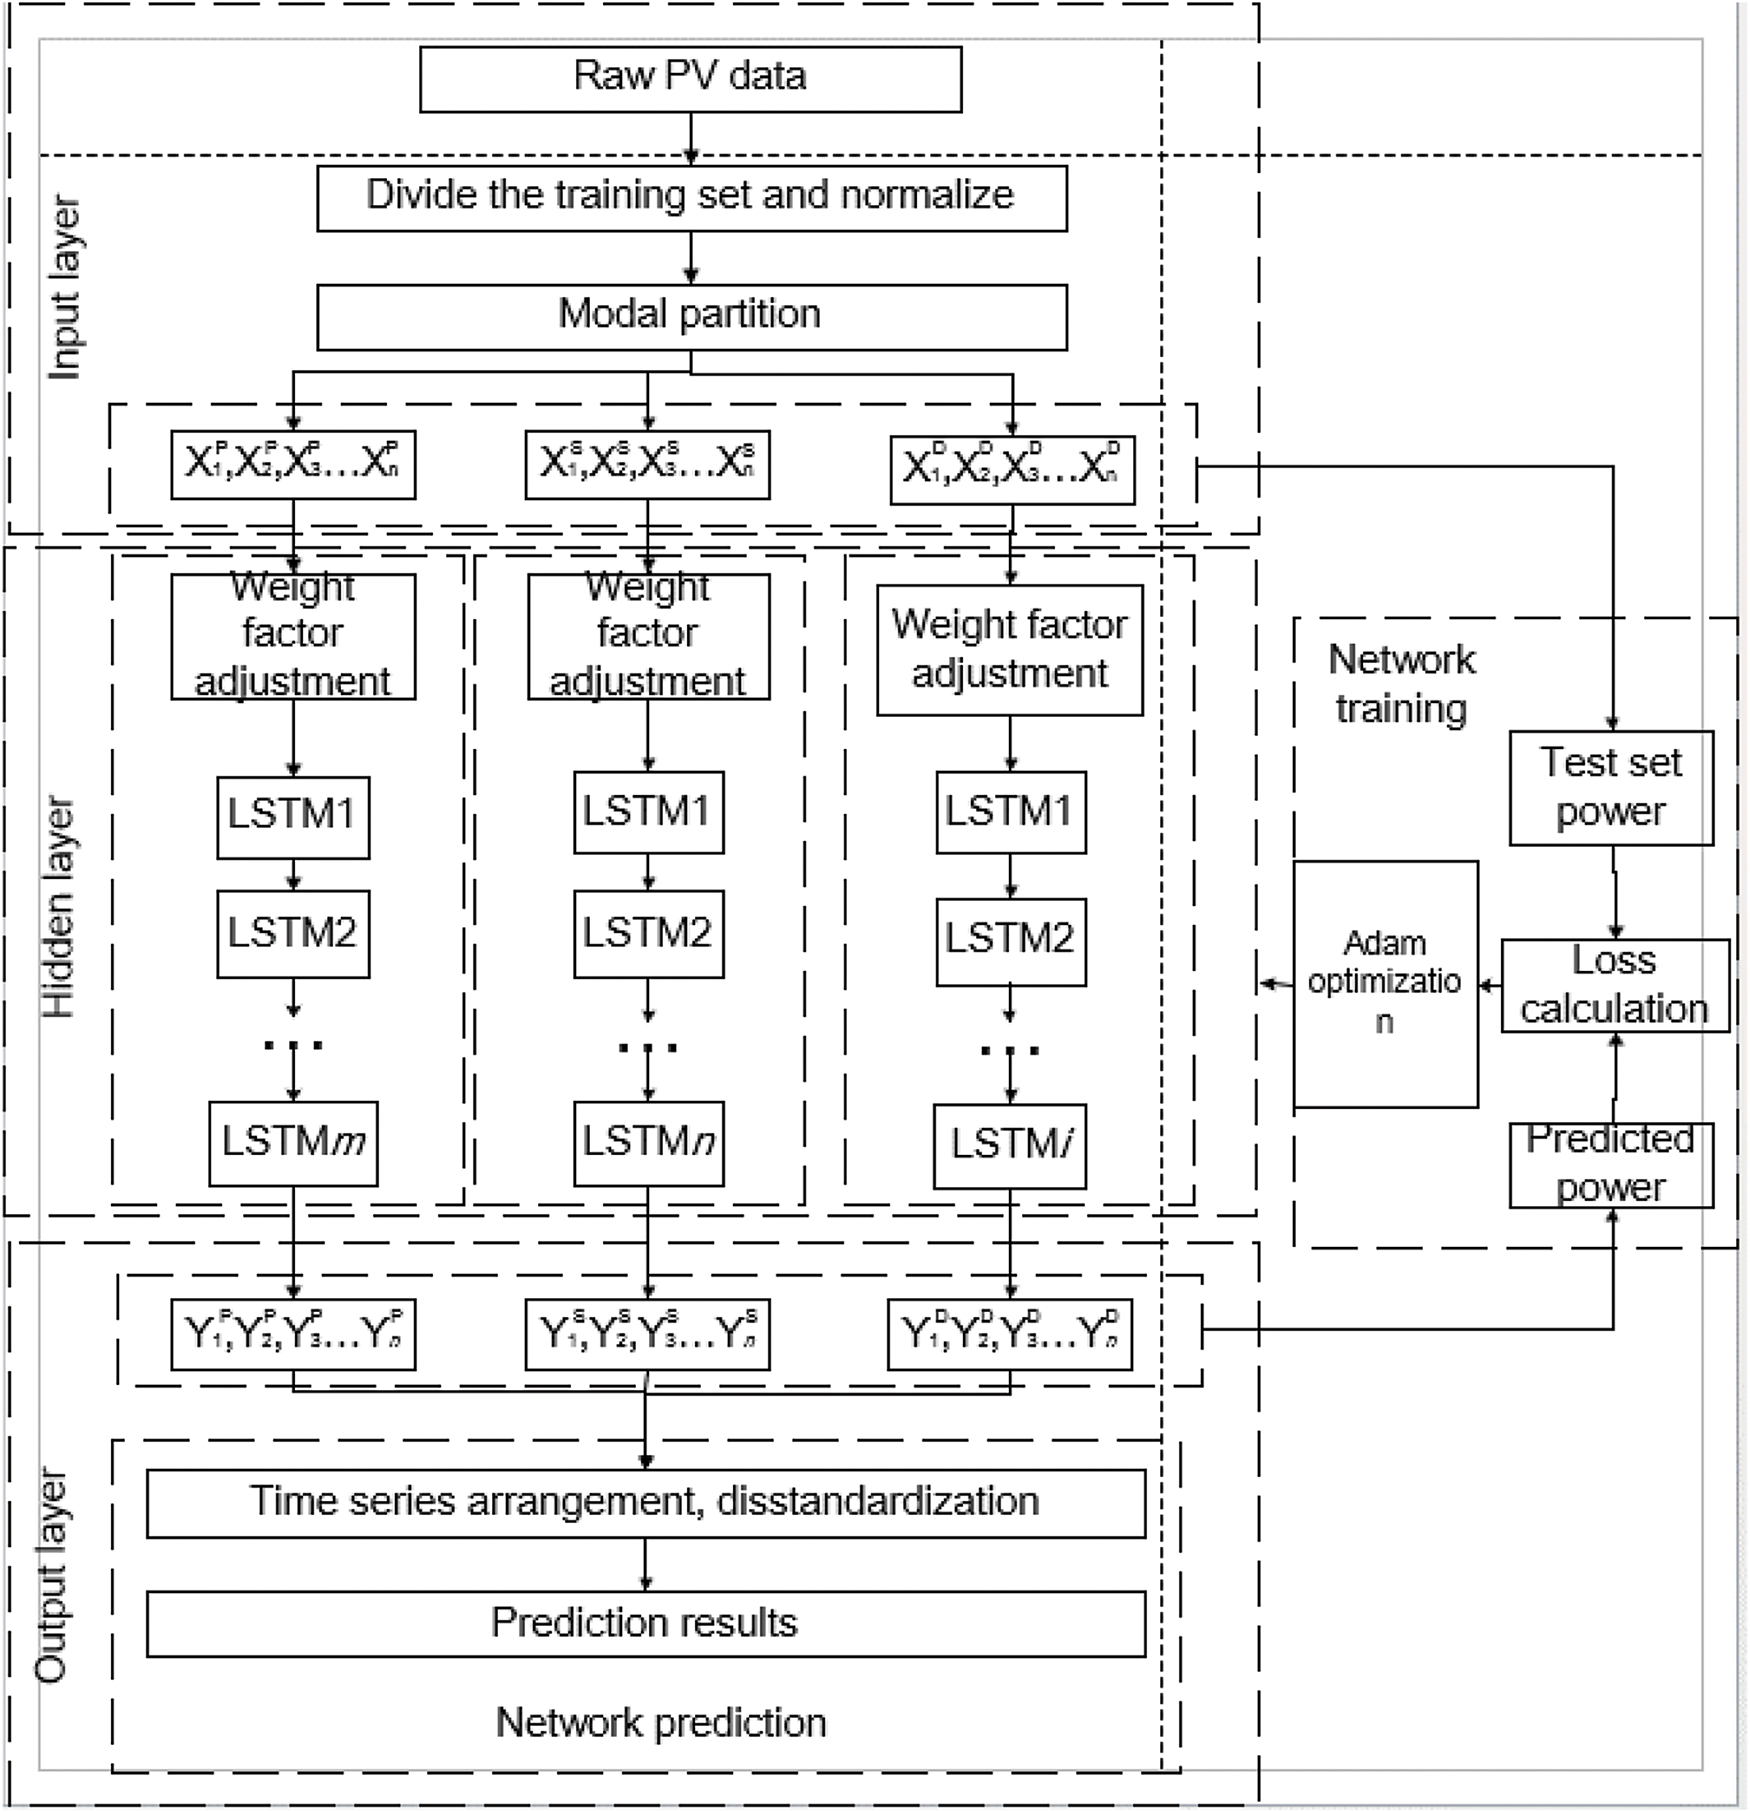
Figure 4: The prediction model framework of MS-WFA-PALSTM
The MS-WFA-PALSTM neural network model consists of five functional modules: input layer, hidden layer, output layer, network training and network prediction. The input layer is responsible for preprocessing and modal division of the original PV data. The hidden layer adopts parallel neural network. Compared with traditional LSTM network, PALSTM neural network combines multiple multi-layer LSTM neural networks and separates different modes through different LSTM neural networks, which can reduce the mutual influence between modes. The output layer provides the prediction results; Network training compared the theoretical output and model output, repeated iteration and continuous optimization, to determine the most accurate prediction value; the network prediction adopts the iterative method to predict point by point.
After the raw PV data is preprocessed in the input layer, the αt of global horizontal radiation is obtained from Eq. (3). According to the experimental comparison results of αt in Section 3.2.1, data conforming to αt enter Mode 3, while data not conforming to αt can be calculated from Eq. (4) according to the time and place where the data are obtained, the sun zenith angle ϕ and the sun altitude angle λ at this time and place are calculated. Determine whether the angle θ, ϕ and λ between the measured photovoltaic panel and the ground meet the Eqs. (5) and (6), if yes, enter Mode 1, if not, enter Mode 2. Then, in Section 3.1, the corresponding strongly correlated meteorological factors are selected for training based on different modes. By calculating the Loss between the predicted results obtained from training and the power of the test set, the Validation Loss value is judged to be lower than the set threshold. If the Validation Loss value is higher than the threshold, the training will continue. If it is below this value, the current parameter setting is determined, which is then used in the actual forecast. Finally, the prediction results of different modes are sorted according to time series, and the final prediction results are obtained by anti-normalization processing.
5.1 Data Selection and Parameter Setting
In this paper, the Yulara Solar System distributed solar photovoltaic power station in Uluru region of Central Australia from 01 March 2019, to 01 March 2021, is selected as the data set. The data set includes two years of photovoltaic power data and photovoltaic panel performance ratio, wind direction, temperature, relative humidity, daily rainfall, global horizontal radiation, diffuse horizontal radiation, global tilt radiation and diffuse tilt radiation 9 factors. Sampling was performed every 5 min, and a total of 110,735 periods were obtained after removing the data of the night period. The experimental platform is Intel (R) Core (TM) i5-9300H CPU @ 2.40 GHz machine with 8 GB RAM Windows11-installed Jupyter Notebook and two programming environments based on the Python language TensorFlow library.
When constructing PALSTM model, different network layers have different effects on model performance. Increasing the number of layers improves the expressiveness of the model, allowing it to learn more complex features and patterns. However, as the number of layers increases, so does the complexity of the model, which can lead to problems with disappearing or exploding gradients during training, making training more difficult and increasing the amount of computation. Conversely, reducing the number of layers can make the model unable to capture complex relationships, limiting its performance.
The number of neurons in each layer also has an important effect on the model performance. Too many neurons can cause the model to learn noise in the data instead of effective features, resulting in overfitting, especially if the training sample is limited. If the number of neurons is too small, the model may not be able to effectively learn important features in the data, resulting in underfitting. Therefore, reasonable selection of the number of neurons is the key to obtaining the best model performance.
In addition, the choice of activation function is also crucial. Different activation functions will affect the nonlinear feature learning, gradient propagation, convergence rate and output range of the model, so it is necessary to carefully consider the selection of activation functions in the model design.
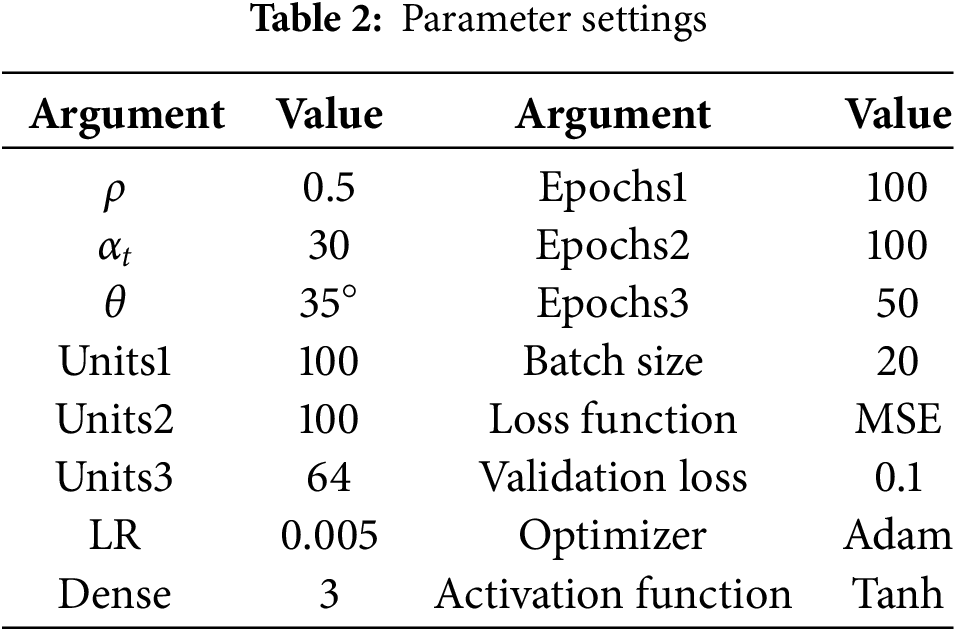
The parameter settings for this method include the following: Resolution coefficient ρ, fluctuation threshold αt, angle θ between photovoltaic panel and ground, learning rate LR, fully connected layer Dense, the number of hidden layer neurons of Modes 1, 2 and 3, Units1, Units2, Units3, Epochs1, Epochs2, Epochs3, Batch size, Loss function, Activation function, Validation Loss, and Optimizer for Modes 1, 2, and 3. The above parameters are shown in Table 2.
5.2 Test Results and Comparative Analysis
According to the calculation results of correlation coefficients in Table 1, it is determined that the relevant meteorological influencing factors of Mode 1 are global horizontal radiation and global inclined radiation. The related meteorological factors of Mode 2 are global horizontal radiation, diffuse horizontal radiation, global inclined radiation and diffuse horizontal radiation. The related meteorological factors of mode 3 are global horizontal radiation and global oblique radiation. In this paper, the sequence lengths of input and output are set to 20 and 1, respectively, and the prediction results are obtained by rolling iteration. The input data is time series data and influencing factor data, and the time step is 5 min. Data from the dataset from 01 March 2019, to 26 September 2020, were used as training data and from 27 September 2020, to 01 March 2021, as test data.
To demonstrate the superiority of the proposed method, The results of this method are predicted by convolutional neural networks with long short-term memory models(CNN-LSTM), no weight adjustment long short-term memory (NW-LSTM), Bi-directional Long Short-Term Memory (BILSTM), Multilayer Perceptron (MLP) and Recurrent Neural Network (RNN). To avoid the influence of other factors, the same input data is used for different models. The prediction results of the six models are shown in Figs. 5 and 6.
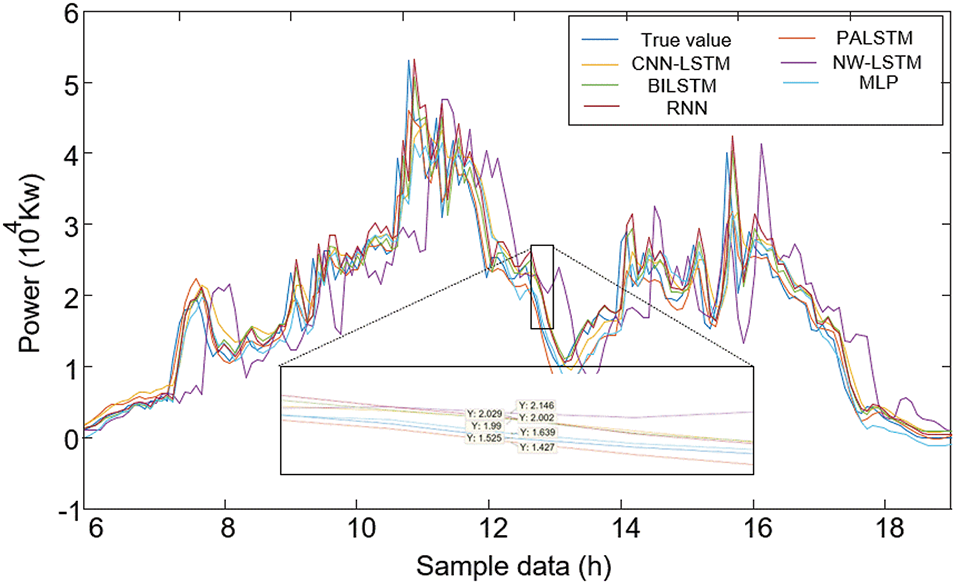
Figure 5: Comparison of cloudy weather forecast results
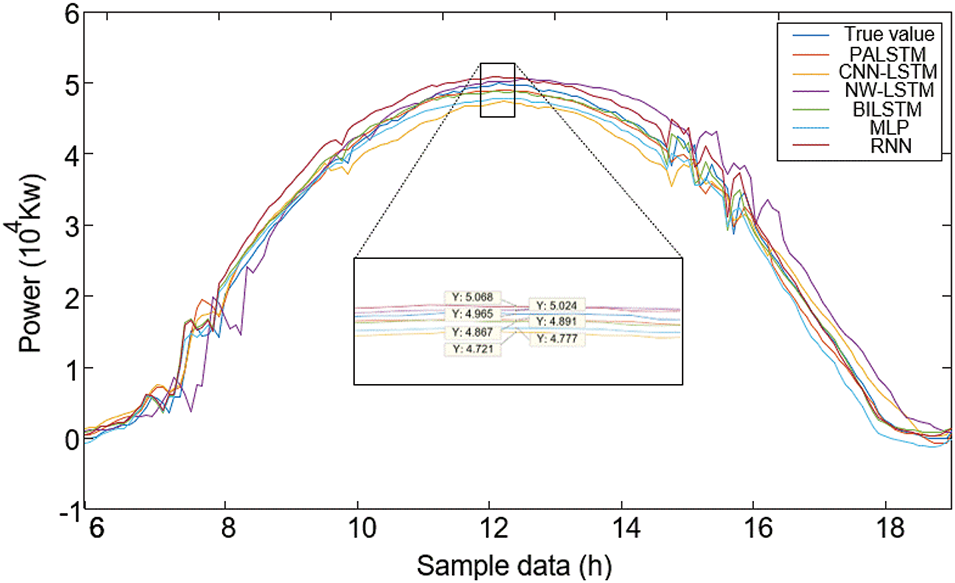
Figure 6: Comparison of sunny weather forecast results
The commonly used error evaluation indexes for PV power prediction error include mean absolute error (MAE) and root mean square error (RMSE), as shown in Eqs. (13) and (14). The absolute value comparison of error of prediction results of different methods is shown in Figs. 7 and 8 [31].
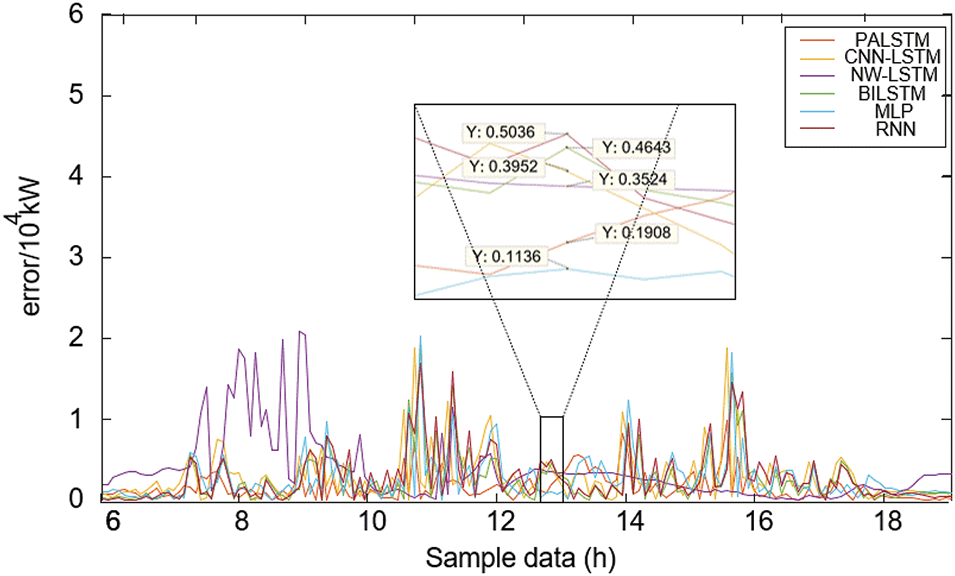
Figure 7: Comparison of errors in cloudy weather
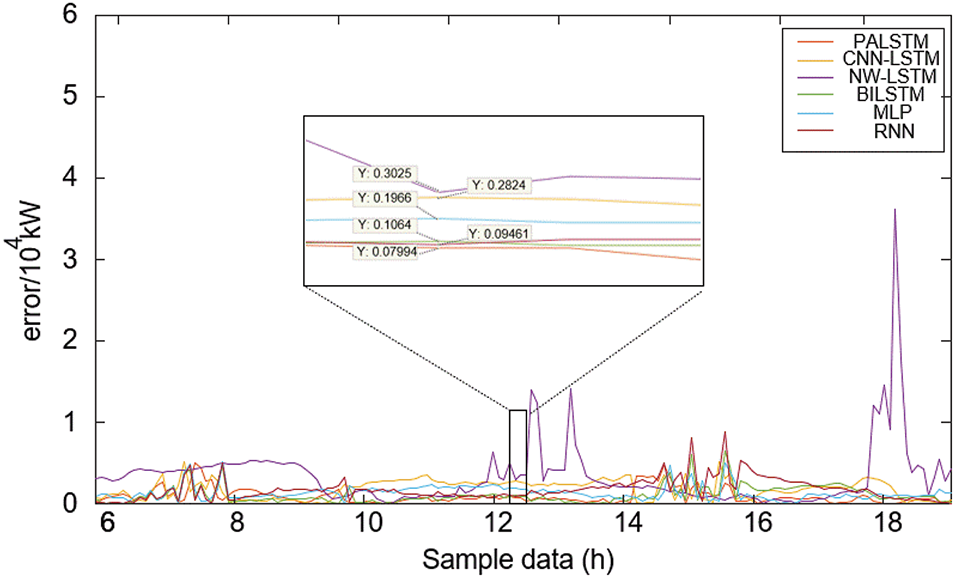
Figure 8: Comparison of sunny weather errors
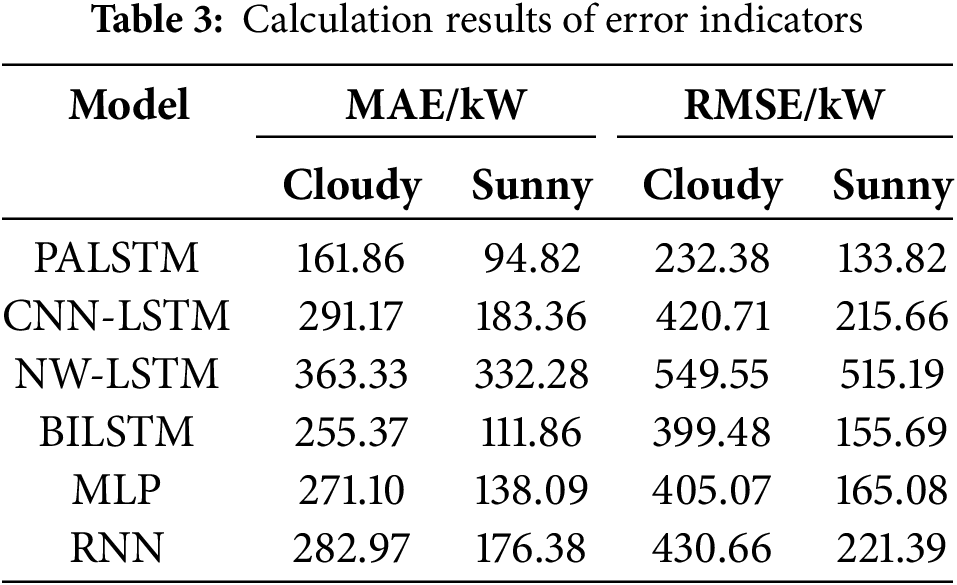
According to Eqs. (13) and (14), the calculation results of prediction error indexes of each method are shown in Table 3.
It can be observed from the four charts that whether it is sunny or cloudy weather, the areas with large prediction errors are mainly concentrated in the parts with significant fluctuations in photovoltaic power. This shows that in these specific fluctuation regions, there is a clear difference between the actual PV output and the predicted values, and weather conditions can change rapidly during periods of large fluctuations in PV power. Additionally, the time difference between real-time monitoring data and historical meteorological data, in rapidly changing weather, can cause forecast lag. Excessive forecasting errors may lead to power grid load imbalance, increase the risk of system operation, and force power grid operators to adjust the demand response strategies, which will lead to power market price fluctuations and affect the economic benefits of power trading.
From the prediction results of different typical days (156 sampling points) shown in Figs. 5 and 6, it can be observed that the method is able to predict the power trend in the parts where the power change trend is relatively slow. However, there is a large deviation between the predicted value and the actual value in the part with severe power change. Although the overall curve trend is consistent with the actual value, the prediction method in this paper is still the best. From the comparison of sunny weather and cloudy weather, it is found that the PV power forecast in sunny weather is more stable and shows a parabolic trend, and the forecast is more accurate than that in cloudy weather.
Due to the inclusion of variables that are less correlated with the factors influencing PV power, additional noise and interference are introduced, which negatively affects PV power forecasts. According to the definition in this paper, the closer the error curve is to the X-axis, the more accurate the prediction result is, and the smoother the curve is, the stronger the robustness of the prediction method is. From the error shown in Figs. 7 and 8, the prediction accuracy of this method is better than that of BILSTM, CNN-LSTM, NW-LSTM, and other traditional LSTM. The error curve of this method is less burr, the prediction method is more stable, and the anti-interference ability is stronger.
From the calculated values of error indicators in Table 3, the prediction method proposed in this paper outperforms the other five models in both sunny and cloudy weather. Compared with CNN-LSTM, NW-LSTM, BILSTM, MLP and RNN, RMSE of this method decreased by 44.76%, 57.71%, 41.83%, 42.63% and 45.89%, respectively, in cloudy weather. On sunny days, the rates decreased by 61.15%, 74.02%, 13.25%, 19.31% and 39.55%, respectively.
The model constructed in this paper is not specifically for the photovoltaic data of Uluru region in central Australia. When we make modal division, we choose the fluctuation of meteorological factors of photovoltaic data and the time and place of the data. Therefore, for other photovoltaic data with meteorological factors fluctuations and clear time and place of data, this model can be used after re-determining the parameters. However, in terms of training time, the training time of this model is longer than that of other models. This is mainly due to the need to modal divide the raw data, and each mode needs to be retrained separately, thus extending the training time. Although the training time of the model in this paper exceeds that of other models, the amount of data used does not change, and the training time is less than 26 min, while the training time of other models is about 22 min, which is still within the acceptable range.
In summary, the model in this paper not only guarantees the prediction accuracy, but also achieves high prediction stability, which further proves the validity of the prediction model.
Addressing the challenges posed by limited monitoring capabilities and frequent meteorological disturbances at photovoltaic power stations, a power prediction method based on mode switching and parallel weight adjustment is introduced. The primary findings are summarized as follows:
(1) The proposed method employs modal partitioning to mitigate the interference of diverse feature data during predictive model construction and training. By delineating the solar trajectory, it distinguishes between periodic and random fluctuations, thereby enhancing prediction accuracy during fluctuating periods. By selecting meteorological factors specific to each mode and adjusting their weights, a parallel neural network is constructed to minimize prediction errors arising from shifts in the importance of meteorological factors due to changes in characteristic data.
(2) Test results indicate that, when compared to several existing methods, the proposed approach not only maintains high prediction accuracy but also achieves exceptional prediction stability, further underscoring its superiority.
(3) For future research, it is recommended to consider adopting a multi-model fusion method for predictions, where different models cater to distinct modes to enhance the professional analysis capabilities of modal data. Additionally, in the mode division process, photovoltaic data can be more meticulously categorized to reduce interference and impact among disparate data sets.
Acknowledgement: Thanks to the New Energy Power Generation and Intelligent Microgrid Laboratory for their support of the experimental instruments and equipment provided in this paper.
Funding Statement: This work was supported in part by the Natural Science Foundation of Henan Province, and the specific grant number is 232300420301, the initial of author is P.L., the URL to the sponsors’ websites is https://kjt.henan.gov.cn/ (accessed on 09 February 2025). And this work was also supported in part by the Fundamental Research Funds for the Universities of Henan Province, and the specific grant number is NSFRF220425, the initial of author is P.L., the URL to sponsors websites is http://app.hnkjt.gov.cn/web/index.do (accessed on 09 February 2025).
Author Contributions: The authors confirm contribution to the paper as follows: study conception and design: Penghui Liu, Peng Zhang, Tianyu Yang, Peiyuan Zou; data collection: Tianyu Yang, Peng Zhang, Peiyuan Zou; analysis and interpretation of results: Penghui Liu, Tianyu Yang; draft manuscript preparation: Penghui Liu, Tianyu Yang. All authors reviewed the results and approved the final version of the manuscript.
Availability of Data and Materials: Data available on request from the authors. The data that support the findings of this study are available from the author, Tianyu Yang, upon reasonable request.
Ethics Approval: Not applicable.
Conflicts of Interest: The authors declare no conflicts of interest to report regarding the present study.
Nomenclature
| PV | Photovoltaic |
| MS | Modal Switching |
| WFA | Weight Factor Adjustment |
| PALSTM | Parallel Long Short-Term Memory |
| LSTM | Long Short-Term Memory |
| CNN | Convolutional Neural Networks |
| BiLSTM | Bi-Directional Long Short-Term Memory |
| MLP | Multilayer Perceptron |
| RNN | Recurrent Neural Network |
| MAE | Mean Absolute Error |
| RMSE | Root Mean Square Error |
| NW-LSTM | No Weight Adjustment Long Short-Term Memory |
References
1. Zhong S, Wang X, Xu B, Wu H, Ding M. Hybrid network model based on data enhancement for short-term power prediction of new PV plants. J Mod Power Syst Clean Energy. 2024;12(1):77–88. doi:10.35833/MPCE.2022.000759. [Google Scholar] [CrossRef]
2. Xu HY, Zhang Q. Photovoltaic Power generation prediction technology based on digital twin and improved LSTM. J Eng Therm Energy Power. 2023;38(2):84–91. [Google Scholar]
3. Vasilica SO, Adela B. On-grid and off-grid photovoltaic systems forecasting using a hybrid meta-learning method. Knowl Inf Syst. 2024;66(4):2575–606. doi:10.1007/s10115-023-02037-8. [Google Scholar] [CrossRef]
4. Wang YQ, Xu F, Liu ZJ. Ultra-short-term power forecasting of distributed photovoltaic based ondynamic correlation characterization and graph network modeling. Autom Electr Power Syst. 2023;47(20):72–82. [Google Scholar]
5. Li ZY, Shao J, Zhong Z, Yan XW, Zheng RN, Wang KY. Residential photovoltaic power forecasting considering division of weather type index interval. In: 6th Asia Conference on Power and Electrical Engineering (ACPEE); 2021; Chongqing, China. p. 487–92. doi:10.1109/acpee51499.2021.9437033. [Google Scholar] [CrossRef]
6. Zhao YX, Wang B, Wang S, Xu WJ, Ma G. Photovoltaic power generation power prediction under major extreme weather based on VMD-KELM. Energy Eng. 2024;121(22):3711–33. doi:10.32604/ee.2024.054032. [Google Scholar] [CrossRef]
7. Zhen Z, Pang SJ, Wang F, Li KP, Li ZG, Ren H. Pattern classification and PSO optimal weights based sky images cloud motion speed calculation method for solar PV power forecasting. IEEE Trans Indust Appl. 2019;55(4):3331–42. doi:10.1109/TIA.2019.2904927. [Google Scholar] [CrossRef]
8. Li PD, Luo Y, Xia X, Gao XQ, Chang R, Li ZC, et al. Factors and quantitative impact on electrical yield in fishery complementary photovoltaic power plant under different cloud cover conditions. Energy. 2024;309:133079. doi:10.1016/j.energy.2024.133079. [Google Scholar] [CrossRef]
9. Zhou H, Wu J, Hu S, Fan R. Study on ultra-short term distributed photovoltaic power forecasting in the haze day based on all-sky images combined with support vector regression. In: 2023 IEEE/IAS 59th Industrial and Commercial Power Systems Technical Conference (I&CPS); 2023; Las Vegas, NV, USA. p. 1–7. doi:10.1109/icps57144.2023.10142099. [Google Scholar] [CrossRef]
10. Shi CJ, Su Zi B, Zhang K, Xie XB, Zhang XY. CloudSwinNet: a hybrid CNN-transformer framework for ground-based cloud images fine-grained segmentation. Energy. 2024;309(3):133128. doi:10.1016/j.energy.2024.133128. [Google Scholar] [CrossRef]
11. Wang Y, Wang XZF, Hao DY, Sang YY, Xue H, Mi Y. Combined ultra-short-term prediction method of PV power considering ground-based cloud images and chaotic characteristics. Sol Energy. 2024;274:112597. doi:10.1016/j.solener.2024.112597. [Google Scholar] [CrossRef]
12. Fu DS, Liu MQ, Yang DZ, Che HZ, Xia XG. Influences of atmospheric reanalysis on the accuracy of clear-sky irradiance estimates: comparing MERRA-2 and CAMS. Atmos Environ. 2022;277:119080. doi:10.1016/j.atmosenv.2022.119080. [Google Scholar] [CrossRef]
13. Pan C, Tan J. Day-ahead hourly forecasting of solar generation based on cluster analysis and ensemble model. IEEE Access. 2019;7:112921–30. doi:10.1109/access.2019.2935273. [Google Scholar] [CrossRef]
14. Hu W, Zhang X, Zhu L, Li Z. Short-term photovoltaic power prediction based on similar days and improved SOA-DBN model. IEEE Access. 2021;9:1958–71. doi:10.1109/access.2020.3046754. [Google Scholar] [CrossRef]
15. Li YK, Huang W, Lou KY, Zhang XZ, Wan Q. Short-term PV power prediction based on meteorological similarity days and SSA-BiLSTM. Syst Soft Comput. 2024;6(3):200084. doi:10.1016/j.sasc.2024.200084. [Google Scholar] [CrossRef]
16. Wu T, Hu RF, Zhu HY, Jiang MH, Lv KY, Dong YX. Combined IXGBoost-KELM short-term photovoltaic power prediction model based on multidimensional similar day clustering and dual decomposition. Energy. 2023;288(3):129770. doi:10.1016/j.energy.2023.129770. [Google Scholar] [CrossRef]
17. Zhou N, Shang BW, Xu MM, Peng L, Feng G. Enhancing photovoltaic power prediction using a CNN-LSTM-attention hybrid model with Bayesian hyperparameter optimization. Glob Energy Interconnect. 2024;7(5):667–81. doi:10.1016/j.gloei.2024.10.005. [Google Scholar] [CrossRef]
18. Zhang JL, Liu ZY, Chen T. Interval prediction of ultra-short-term photovoltaic power based on a hybrid model. Elect Power Syst Res. 2023;216:109035. doi:10.1016/j.epsr.2022.109035. [Google Scholar] [CrossRef]
19. Burcin CE, Feng C, Doubleday K, Florita A, Hodge BM. A review of behind-the-meter solar forecasting. Renew Sustain Energ Rev. 2022;160:112224. doi:10.1016/j.rser.2022.112224. [Google Scholar] [CrossRef]
20. Abe CF, Dias JB, Notton G, Poggi P. Computing solar irradiance and average temperature of photovoltaic modules from the maximum power point coordinates. J Photovolt. 2020;10(2):655–63. doi:10.1109/JPHOTOV.2020.2966362. [Google Scholar] [CrossRef]
21. Choi H, Choi JH, Ahn SH, Hyun JH, Cha HL, Lim BY. Optimal inclination and azimuth angles of a photovoltaic module with load patterns for improved power system stability. J Photovolt. 2024;14:525–37. doi:10.1109/JPHOTOV.2024.3380459. [Google Scholar] [CrossRef]
22. Tian XY, Wang J, Ji J, Xia T. Comparative performance analysis of the flexible flat/curved PV modules with changing inclination angles. Energy Convers Manag. 2022;274:116472. doi:10.1016/j.enconman.2022.116472. [Google Scholar] [CrossRef]
23. Modest MF, Mazumder S. Radiative heat transfer (Fourth Edition). Cambridge, MA, USA: Academic Press; 2022. p. 401–52. doi:10.1016/B978-0-12-818143-0.00019-5. [Google Scholar] [CrossRef]
24. Ma M, Tang XR, Lv QQ, Shen J, Zhu BX, Wang JQ. Multi-features fusion for short-term photovoltaic power prediction. Intell Converg Netw. 2022;3(4):311–24. doi:10.23919/ICN.2022.0025. [Google Scholar] [CrossRef]
25. Wang SC, Huang Y. Spatio-temporal photovoltaic prediction via a convolutional based hybrid network. Comput Electr Eng. 2025;123(1):110021. doi:10.1016/j.compeleceng.2024.110021. [Google Scholar] [CrossRef]
26. Wang DF, Liu J, Huang Y, Shi BT, Jin MY. Research on photovoltaic power prediction method combining solar radiation calculation and CNN-LSTM. J Sol Energy. 2019;45(2):443–50. (In Chinese). doi:10.19912/j.0254-0096.tynxb.2022-1542. [Google Scholar] [CrossRef]
27. Han SJ, Li DQ, Li KY, Wu HY, Gao YM, Zhang Y. Analysis and study of transmission line icing based on grey correlation pearson combinatorial optimization support vector machine. Measurement. 2021;236(2):115086. doi:10.1016/j.measurement.2024.115086. [Google Scholar] [CrossRef]
28. Zhang DH, Sun K, Jing H. Short-term Load forecasting based on fusion of similar days and multiple models. Power Grid Technol. 2023;47(5):1961–70. (In Chinese). doi:10.13335/j.1000-3673. [Google Scholar] [CrossRef]
29. Hu ZH, Gao Y, Ji SY, Mae MK, Imaizumi TJ. Improved multistep ahead photovoltaic power prediction model based on LSTM and self-attention with weather forecast data. Appl Energy. 2024;359(2):122709. doi:10.1016/j.apenergy.2024.122709. [Google Scholar] [CrossRef]
30. Chen HL, Chang XF. Photovoltaic power prediction of LSTM model based on Pearson feature selection. Energy Rep. 2021;7(6):1047–54. doi:10.1016/j.egyr.2021.09.167. [Google Scholar] [CrossRef]
31. Liu YJ, Zhang ZK, Ma L, Jia Y, Yin WH, Liu ZF. Short-term prediction of photovoltaic power based on DBSCAN-SVM data cleaning and PSO-LSTM model. Energy Eng. 2024;121(10):3019–35. doi:10.32604/ee.2024.052594. [Google Scholar] [CrossRef]
Cite This Article
 Copyright © 2025 The Author(s). Published by Tech Science Press.
This work is licensed under a Creative Commons Attribution 4.0 International License , which permits unrestricted use, distribution, and reproduction in any medium, provided the original work is properly cited.
 Downloads
 Citation Tools