
 Submit a Paper
 Propose a Special lssue
 Open Access
ARTICLE

Numerical Evaluation of the Performance Enhancement of S-Shaped Diffuser at the Intake of Gas Turbine by Energy Promoters
1 Technical Engineering College, University of Hilla, Al-Hillah, Babylon, 51001, Iraq
2 Electromechanical Engineering Department, University of Technology-Iraq, Baghdad, 53050, Iraq
3 Nanotechnology and Advanced Materials Research Centre, University of Technology-Iraq, Baghdad, 53050, Iraq
4 Department of Petroleum Engineering, University of Kerbala, Karbala, 56001, Iraq
5 Air Conditioning and Refrigeration Techniques Engineering Department, University of Warith Al-Anbiyaa, Karbala, 56001, Iraq
* Corresponding Author: Hussain H. Al-Kayiem. Email:
(This article belongs to the Special Issue: Advancements in Energy Resources, Processes, Systems, and Materials-(ICSSD2024))
Energy Engineering 2025, 122(4), 1311-1335. https://doi.org/10.32604/ee.2025.061709
Received 01 December 2024; Accepted 27 January 2025; Issue published 31 March 2025
 View Full Text
 Download PDF
Abstract
Size reduction of the gas turbines (GT) by reducing the inlet S-shaped diffuser length increases the power-to-weight ratio. It improves the techno-economic features of the GT by lesser fuel consumption. However, this Length reduction of a bare S-shaped diffuser to an aggressive S-shaped diffuser would risk flow separation and performance reduction of the diffuser and the air intake of the GT. The objective of this research is to propose and assess fitted energy promoters (EPs) to enhance the S-shaped diffuser performance by controlling and modifying the flow in the high bending zone of the diffuser. After experimental assessment, the work has been extended to cover more cases by numerical investigations on bare, bare aggressive, and aggressive with energy promoters S-shaped diffusers. Three types of EPs, namely co-rotating low-profile, co-rotating streamline sheet, and trapezoidal submerged EPs were tested with various combinations over a range of Reynolds numbers from 40,000 to 75,000. The respective S-shaped diffusers were simulated by computational fluid dynamics (CFD) using ANSYS software adopting a steady, 3D, standard k-ε turbulence model to acquire the details of the flow structure, which cannot be visualized in the experiment. The diffuser performance has been evaluated by the performance indicators of static pressure recovery coefficient, total pressure loss coefficient, and distortion coefficient (DC(45°)). The enhancements in the static pressure recovery of the S-shaped aggressive diffuser with energy promoters are 19.5%, 22.2%, and 24.5% with EPs at planes 3, 4 and 5, respectively, compared to the aggressive bare diffuser. In addition, the installation of the EPs resulted in a DC(45°) reduction at the outlet plane of the diffuser of about 43% at Re = 40,000. The enhancements in the performance parameters confirm that aggravating the internal flow eliminates the flow separation and enhances the GT intake efficiency.Keywords
Gas turbines (GT) may be used for power generation in gas power, combined power plants or in the aero engines. In the context of cleaner, efficient, and sustainable energy production, gas turbines have emerged as crucial components that provide reliability, flexibility, and efficiency that complement renewable energy generation. With continuously improving technologies and industrial applications, gas turbines will continue to be a critical tool for reducing energy costs, minimizing environmental impacts, and ensuring a sustainable future. The future role of gas turbines will be shaped by continuously evolving technologies and industrial needs. The high power-to-weight ratio of the GT makes it the most efficient energy converter system. One approach to reducing the GT weight is the reduction in the intake size by reducing the length of the S-shaped diffuser.
The S-shaped diffuser study is one of the prevailing research subjects because of its influential applications in aero engines. The general configuration of any S-shaped diffuser has a centerline curvature and cross-sectional area increase along its length. The centerline curvature or the changes in the duct’s cross-sectional shape causes higher streamline curvature, leading to cross-stream pressure gradients that could produce significant secondary flows and create crossflow velocities resulting in a non-uniform pressure profile at the engine face, called an Aerodynamic Inlet Plane (AIP). Furthermore, the adverse streamwise pressure gradient caused by an increasing cross-sectional area may also lead to reversal flow and flow separation. An S-shaped diffuser must sustain minimal total pressure losses and deliver a nearly uniform flow with small crossflow velocity components at the AIP for convenient performance. Therefore, an aircraft designer often faces a complicated dilemma in reducing length, size, and pressure recovery consequences. Size and weight constraints encourage using a short S-shaped diffuser, named “Aggressive S-shaped diffuser”. However, this reduction would result in greater streamlined curvature, larger adverse pressure gradients, and an undesirable duct performance risk.
Passive flow control techniques by Vortex Generators (VGs) or Energy Promotors (EPs) were investigated by many researchers as a means to control and eliminate the reversal flow. The EPs could be designed to direct high-energy flow into the low-momentum region to re-energize flow near the wall. Anderson et al. [1] divided the VGs into two main configurations, counter-rotating, and co-rotating. Al-Kayiem et al. [2] have presented simulation results on the effect of EP in intermediate GT aggressive S-shaped diffusers. A typical S-shaped diffuser was modelled and simulated in FLUENT 6.3.26, assuming 2-D and incompressible flow. The effect of energy promoters was investigated with various configurations to assess the best height and position. The simulation was carried out with five different heights of 0.5, 1.0, 1.5, 2.0, and 2.5 mm and five different installation locations upstream of the bending section. The results show that the energy promoters work as anticipated but are still far from reaching the benchmark efficiency of a normal/ideal diffuser. The promoters with 2.0 mm height display the highest exit pressure recovery. Jessam et al. [3] investigated the ability of different configurations of passive flow control on the performance enhancement of S-shaped diffusers. They investigated different configurations of passive flow control, different numbers, geometries, installation planes, and many ranges of Re numbers on the performance of S-shaped and aggressive S-shaped diffusers.
However, Liu et al. [4] analyzed the flow field in an aggressive duct to declare the source of separation primarily. Then, they used a wide-chord blade as an energy promoter by a verified numerical simulation. With the adopted flow-control strategy, separation has been improved, even diminished. However, the flow structures within the blade passage are altered correspondingly. The pressure loss could be decreased successfully by designing the wide-chord blade specially.
Hickling et al. [5] numerically analyzed tubercles, a novel bio-inspired passive flow control method in S-duct with the transonic flow, and the numerical results were compared to experimental data. The realizable k–ε model poorly predicts the losses and distortion characteristics due to the model’s inability to resolve the effects of unsteadiness in separated regions. However, this model significantly improves the prediction of static pressure distributions.
The flow physics modeling and validation of the Royal Aircraft Establishment subsonic intake Model M2129 are performed and presented by Aref et al. [6]. This intake has an 18 inches long S-shaped diffuser. The intake has been modeled with HPCMP CREATE TM-AV Kestrel simulation tools. The simulation results were validated, and they were in good agreement with less than 6% errors. Secondary flow at the first bend and a region of flow separation are predicted at the starboard wall with an averaged DC60 coefficient of 0.2945 at the engine face. Then, a passive and active flow control method is computationally investigated. The passive one uses vane-type vortex generators, and the active one has synthetic jet actuators. The results show that considered passive and active flow control methods reduce the distortion coefficient at the engine face and the worst 60o sector to 0.1361 and 0.0881, respectively.
Liu et al. [7] used CFX to simulate and analyze the steady flow field of S-shaped diffusers under uniform inlet conditions and distortion inlet conditions. They analyzed the flow field and the total pressure by changing the intake distortion conditions. They concluded that when the S-shaped inlet works under certain flight conditions, the level of total pressure distortion will be smaller than the uniform inlet condition, which might improve the air intake performance. In addition, with the use of the S-shaped diffuser in the aeroengine intake, the deterioration of distortion might be prevented under certain specific intake conditions. Under a certain angle of attack and flying conditions, although the intake conditions are uneven, the airflow separation phenomenon of the S-shaped intake port is weakened, and the total pressure distortion is reduced, indicating that for some post-stall maneuvers, the performance of the S-shaped intake port may be better than commonly used inlet configurations. For this reason, in the development of the stealth fighter, the S-shaped inlet has been adopted because it has better stealth than the bump and straight inlet.
Wang et al. 2023 [8] investigated pulsed jet actuators in the S-shaped duct at a Mach number of 0.4 as an advanced flow control strategy to improve the flow condition. After experimental investigations, the S-shaped duct was further investigated by utilizing the unsteady Reynolds-averaged Navier–Stokes equations (URANS). The jet angles as a research parameter were set to 15°, 30°, 45°, 60° and 75°, respectively. Moreover, steady jet schemes were adopted to reveal the unsteady flow control mechanism of the pulsed jet. The results showed that the overall performance of the S-shaped diffuser with the pulsed jet was improved, mainly attributed to the additional kinetic energy and dispersion. The total pressure loss coefficient and distortion index at the AIP decreased by 7.0% and 2.9%, respectively, when the pulsed jet angle was 30°.
Previous studies have found that the area ratio (AR) and the length-to-offset ratio (LOR) of the S-shaped diffuser are key design parameters that affect the flow separation in the S-shaped diffusers. Li et al. [9] hypothesized that in an S-shaped diffuser with 100% boundary layer ingestion (BLI), the parameter height-to-radius ratio (HRR) may also have a significant effect on the flow separation. They performed numerical simulations to validate their hypothesis under uniform inlet conditions. In addition, the effect of HRR on the flow separation features is investigated under different relative heights of inlet BLI. It is found that the flow separation features in the S-shaped diffuser are very sensitive to the change in HRR but not to the change in relative height of inlet BLI. Also, for the fixed boundary layer height generated from the airframe, the S-shaped diffuser with a smaller HRR could significantly control the flow separation and thus achieve a higher total pressure recovery and a lower distortion coefficient.
In new attempt, Rezek et al. [10] reported the use of energy promotors in an assembly of bounded hydroturbine using computational fluid dynamics (CFD) analysis. They reported that the turbine modeled by the reported numerical method delivered a peak power coefficient of 0.415. Burrows et al. [11] reported the collaboration between Georgia Tech and the Boeing Company for investigating the application of novel flow-control technologies to a highly offset diffuser experimentally and numerically. The investigation results showed a 68% reduction in circumferential distortion at the AIP, using an actuation mass flow rate that is only 0.25% of the diffuser mass flow rate. The used vortex traps to energize the separated shear layer that was found effective to reduce the size of the reversal flow and effecting an earlier reattachment of the boundary layer, which favorably effects the flow field downstream of reattachment.
Due to their short length, the high curvature of aggressive S-shaped diffusers results in the migration of the fluid boundary layer in the direction of the pressure gradient, thereby strengthening the secondary flows. This phenomenon imparts crossflow velocities that create non-uniform pressure profiles within the boundary layer. A streamwise pressure gradient also occurs with the increased cross-sectional area. These effects lead to a decrease in pressure recovery and an increase in total pressure loss and nonuniformity (distortion) at the exit of the diffuser. Literature suggested further investigation on the flow separation control in the S-shaped diffusers by passive approaches using CFD methods. Hence, the present study aims to assess the performance enhancement of aggressive S-shape diffusers with different configurations of EPs as passive control methods. The assessment was performed by 3D, steady-state, and Reynolds Average Navier Stokes (RANS) equations solved numerically by ANSYS software. Static Pressure Recovery Coefficient, CPR, Total Pressure Loss Coefficient, CTL, and the distortion coefficient, DC(45°), were used to evaluate the S-shaped diffuser performance enhancement.
The results of the current study added significant quantitative and qualitative findings to the field of modification of flow structure using passive techniques. The results provided comparative analysis of the performance of the S-shaped diffusers to that could contribute to the reduction of the gas turbine size without reduction in the aeroengine performance.
2 Problem Description and Physical Formulations
The GT aeroengine contains an intake which performs to reduce the airspeed and increases the flow pressure in front of the inlet plane of the compressor. This could be achieved by a diffusion of the flow using the diffuser unit. However, the designer’s ambition is to reduce the GT weight by reducing the size of the intake, i.e., reducing the length of the diffuser. Diffuser shortening leads to a high curvature of aggressive S-shaped diffusers, resulting in boundary layer separation. These effects lead to a decrease in pressure recovery and an increase in total pressure loss and nonuniformity (distortion) at the exit of the diffuser. Mitigation of the problem is by installation of EPs. The present work simulates the flow structure and predicts the performance parameters by installation of EPs at various planes and various shapes.
The computational procedure used in the present research is an extension to experimental investigations to allow flow visualization and extended investigations. Three models of bare diffuser (Bare D), bare aggressive diffuser (Bare AD), and Aggressive diffuser fitted with energy promotors (AD/EP) were experimented with and then adopted in computational investigations. Details and geometries of each model are shown in Table 1, while the geometrical identifications of the S-shaped diffuser are provided in Fig. 1. The measurements were done over a range of Re from 40,000 to 75,000.
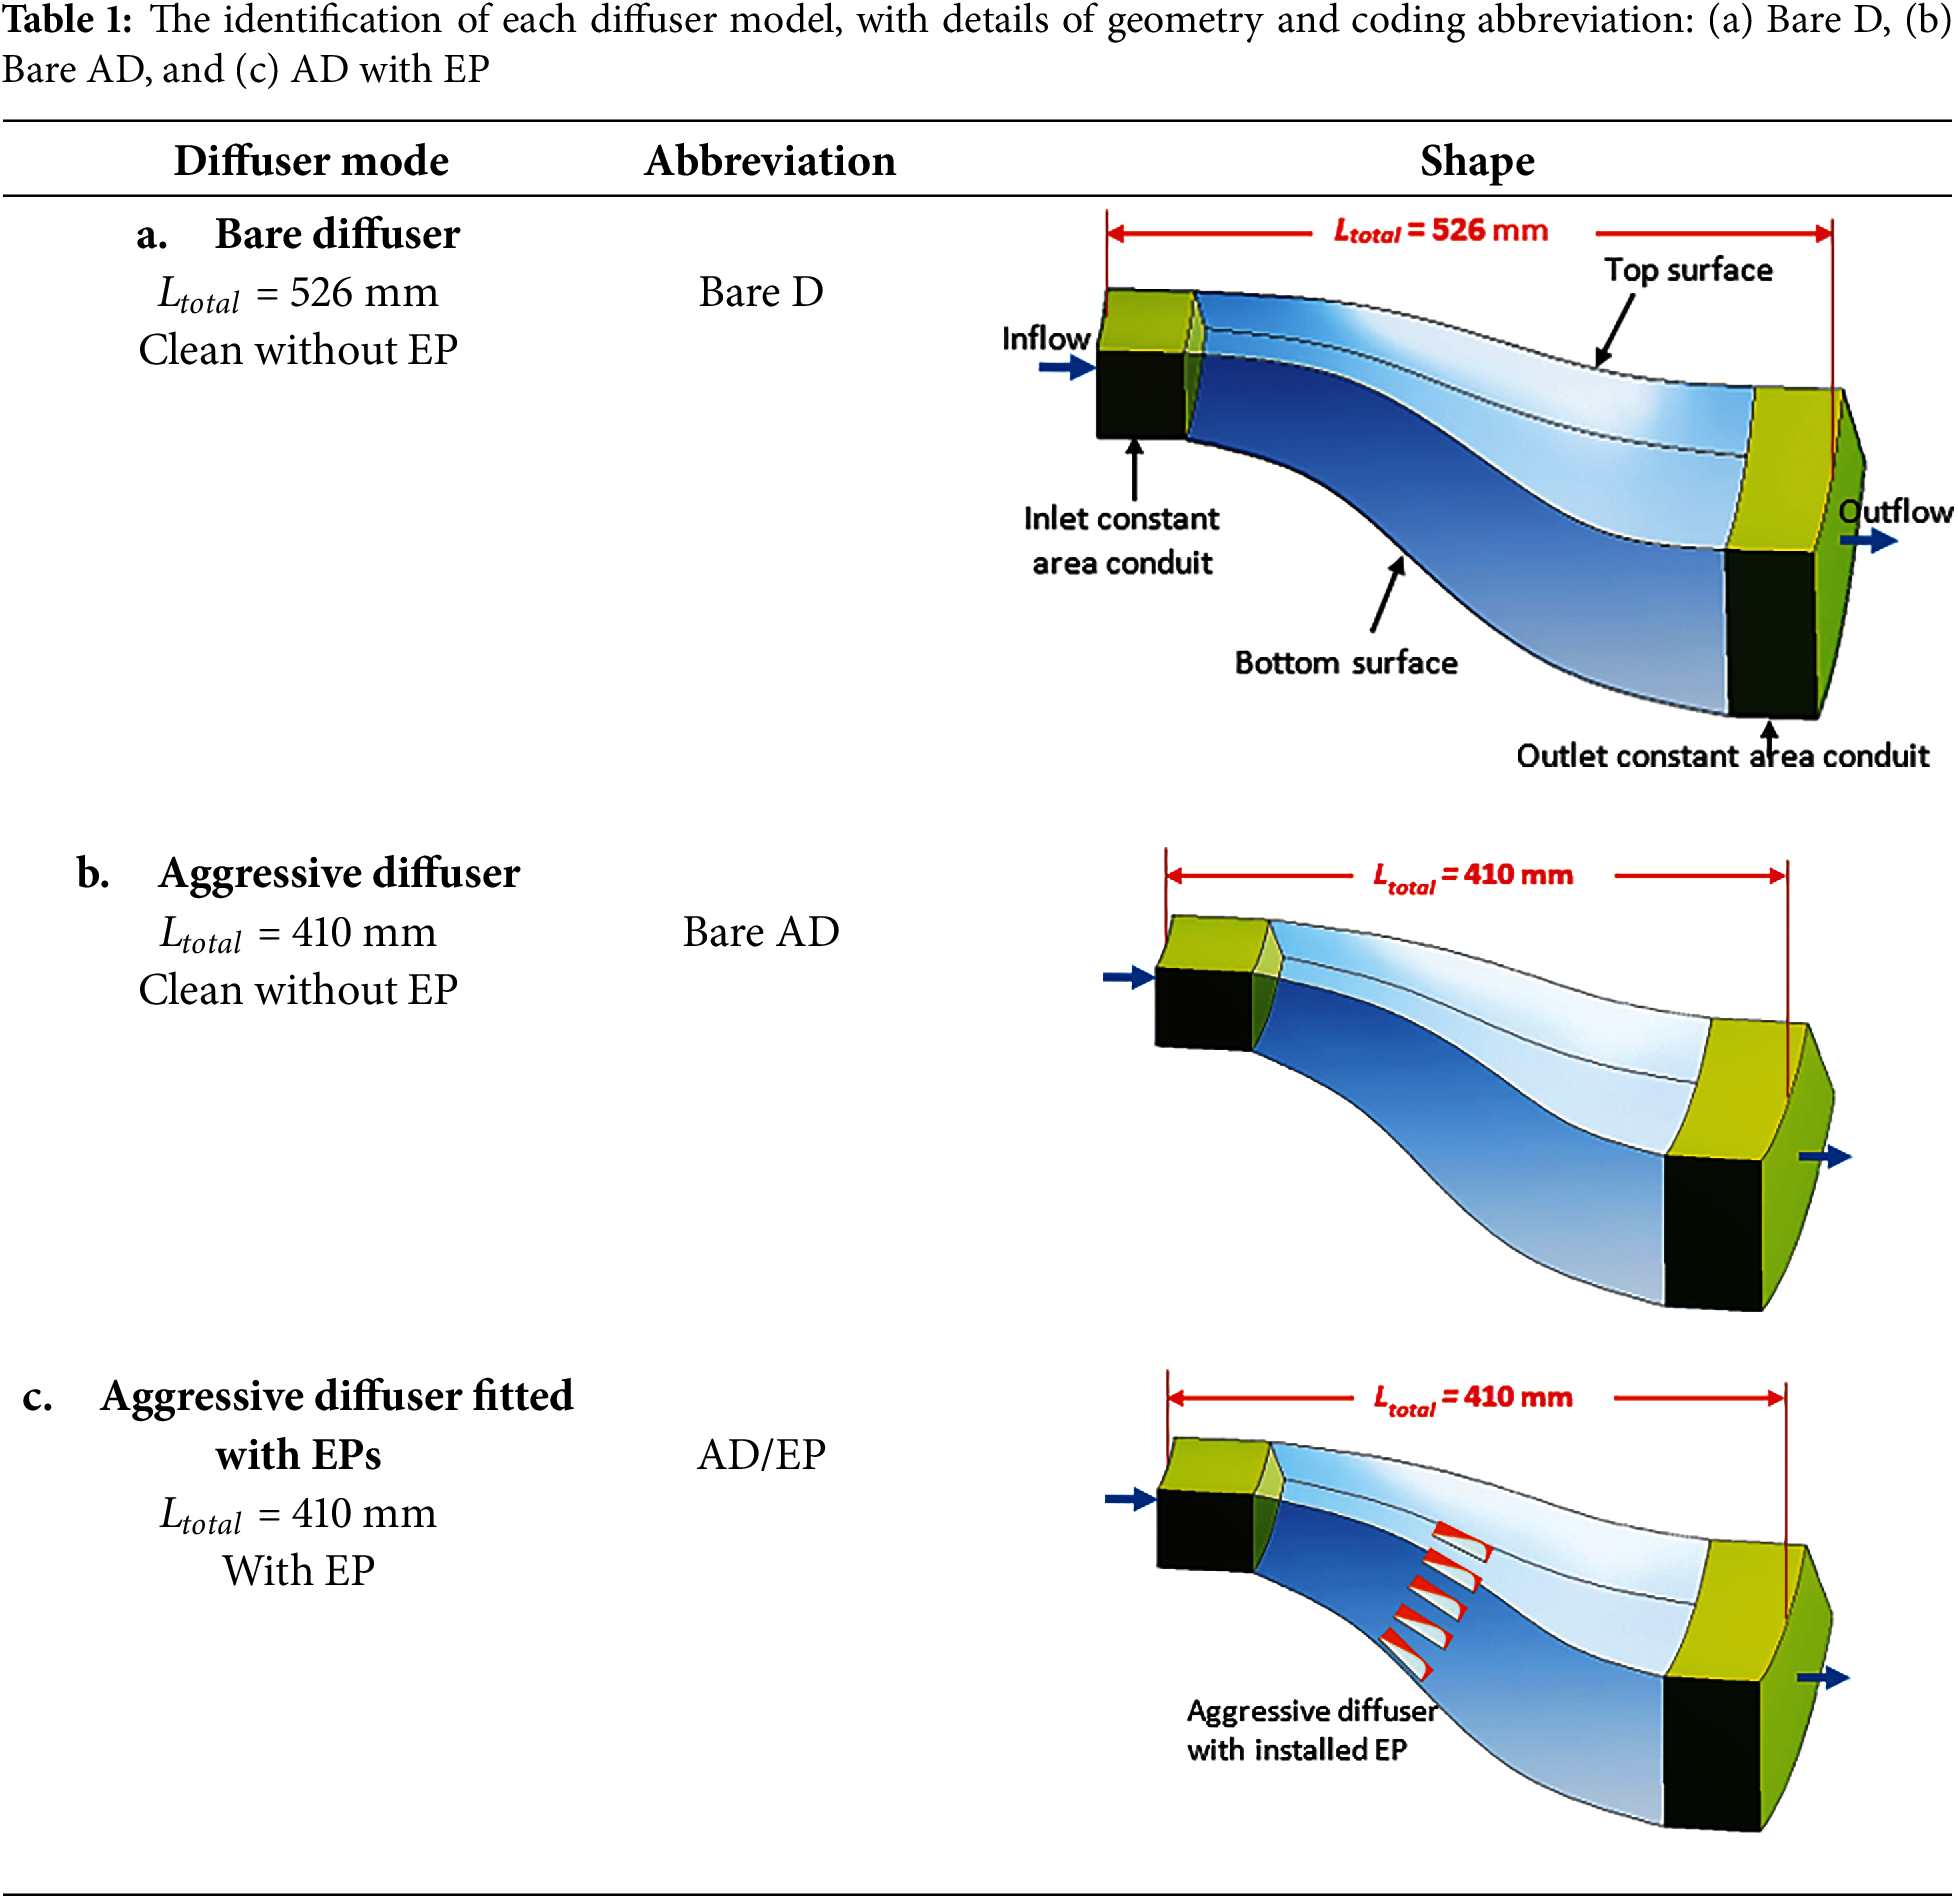
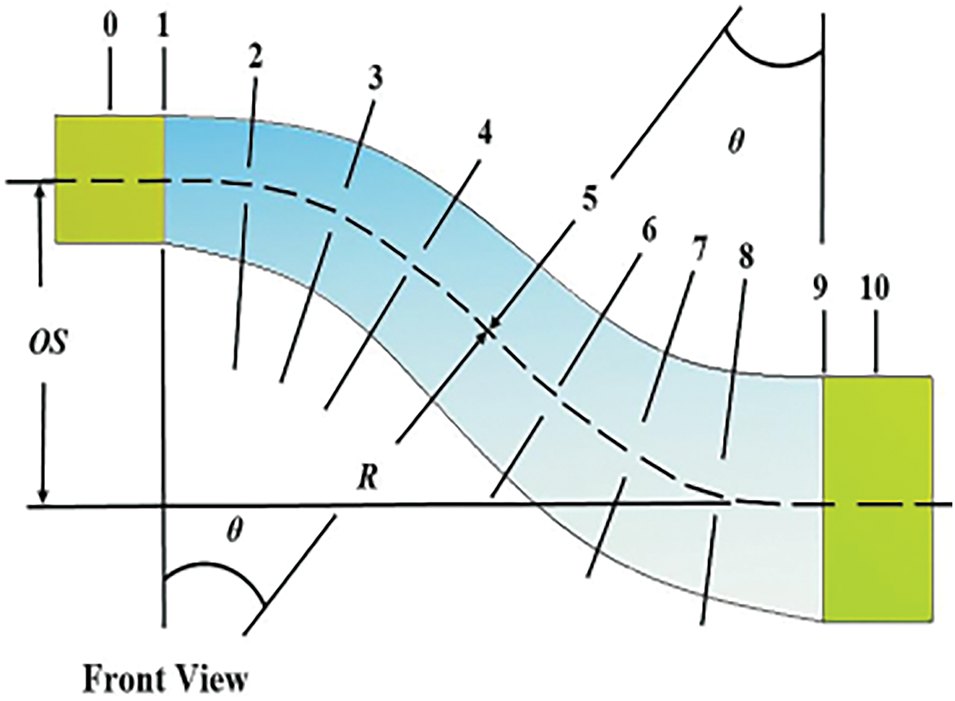
Figure 1: Geometrical identifications of the proposed S-shaped diffuser
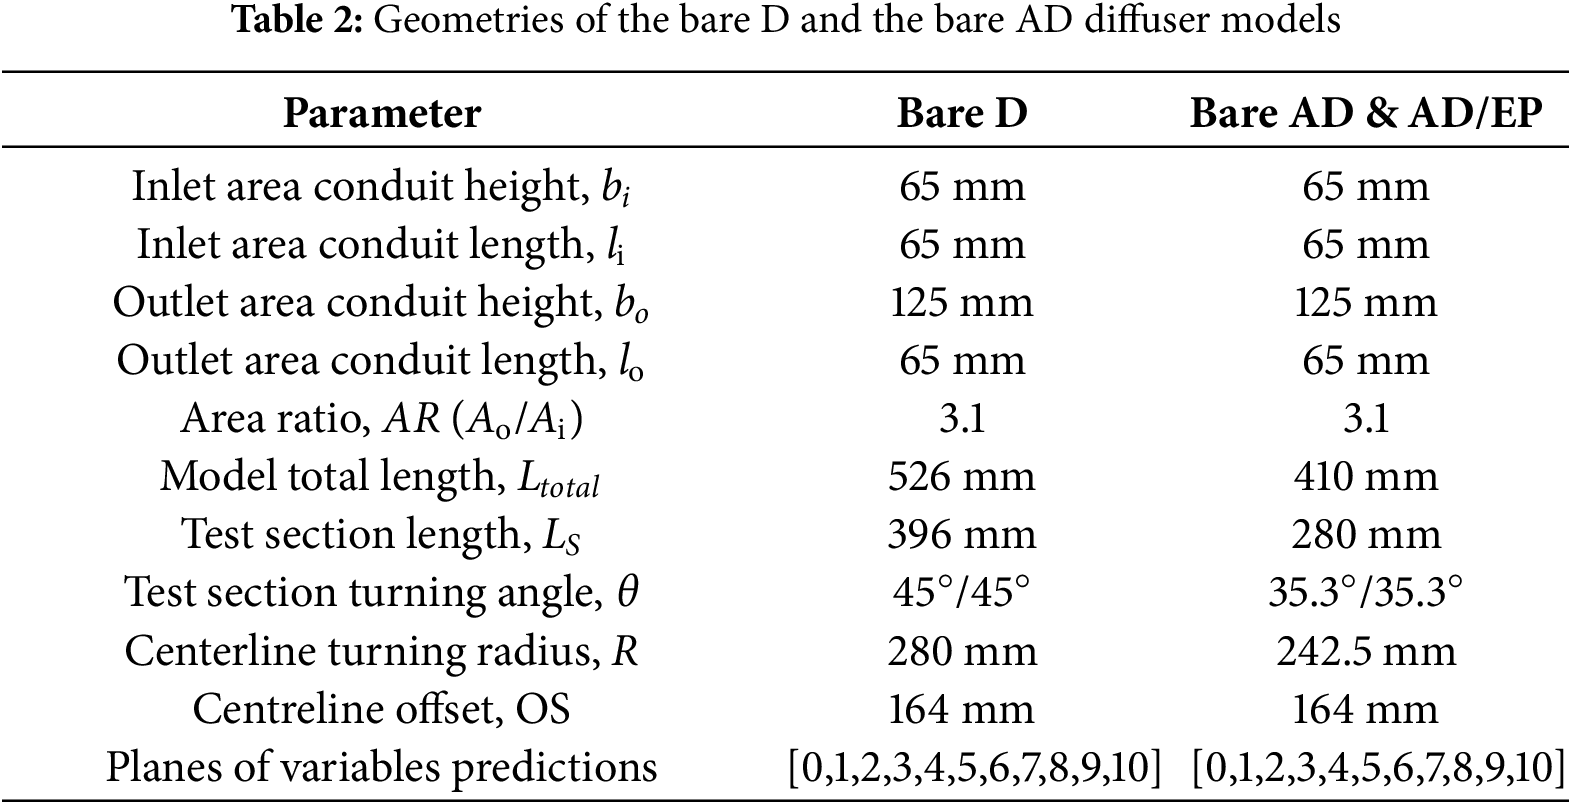
The experimental results of the Bare S-shaped diffuser indicated that the flow separation starts at plane 4. Hence, the locations of the planes have been selected before, at and after the separation plane. The simulation results of the Bare S-shaped diffuser show that the flow separation started at plane 4, similar to the experimental measurements. The geometry specifications of the bare D, bare AD, and AD/EP model are summarized in Table 2, following the symbols in Table 1 and Fig. 1.
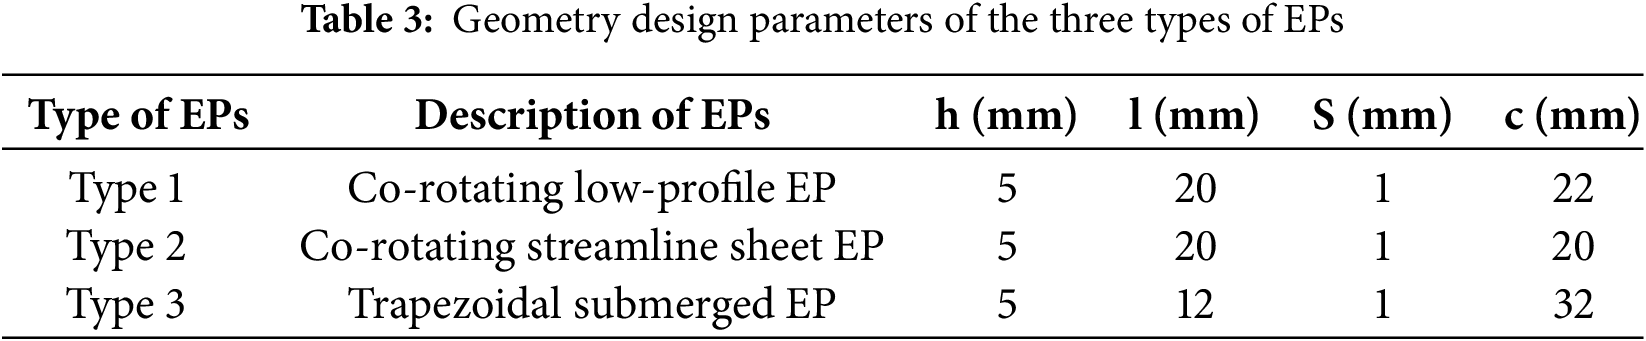
Due to the large energy losses often associated with boundary-layer separation flow, passive flow control remains very important for many technological applications of fluid mechanics [11,12]. The EPs can be defined as devices with a height between 10% to 50% of the boundary layer thickness [13]. The boundary layer thickness has been measured experimentally and found to be about δ ≈ 13 mm at the inflexion plane, plane 5. Three types of EPs were adopted to investigate the effectiveness of their geometries on the performance enhancement of bare AD. All three types have been made from High Impact Polystyrene sheets with a thickness of 1 mm by computer numerical control, CNC machine. The geometry specifications and shapes of the investigated three types of EPs are shown in Fig. 2, and the geometries are listed in Table 3.
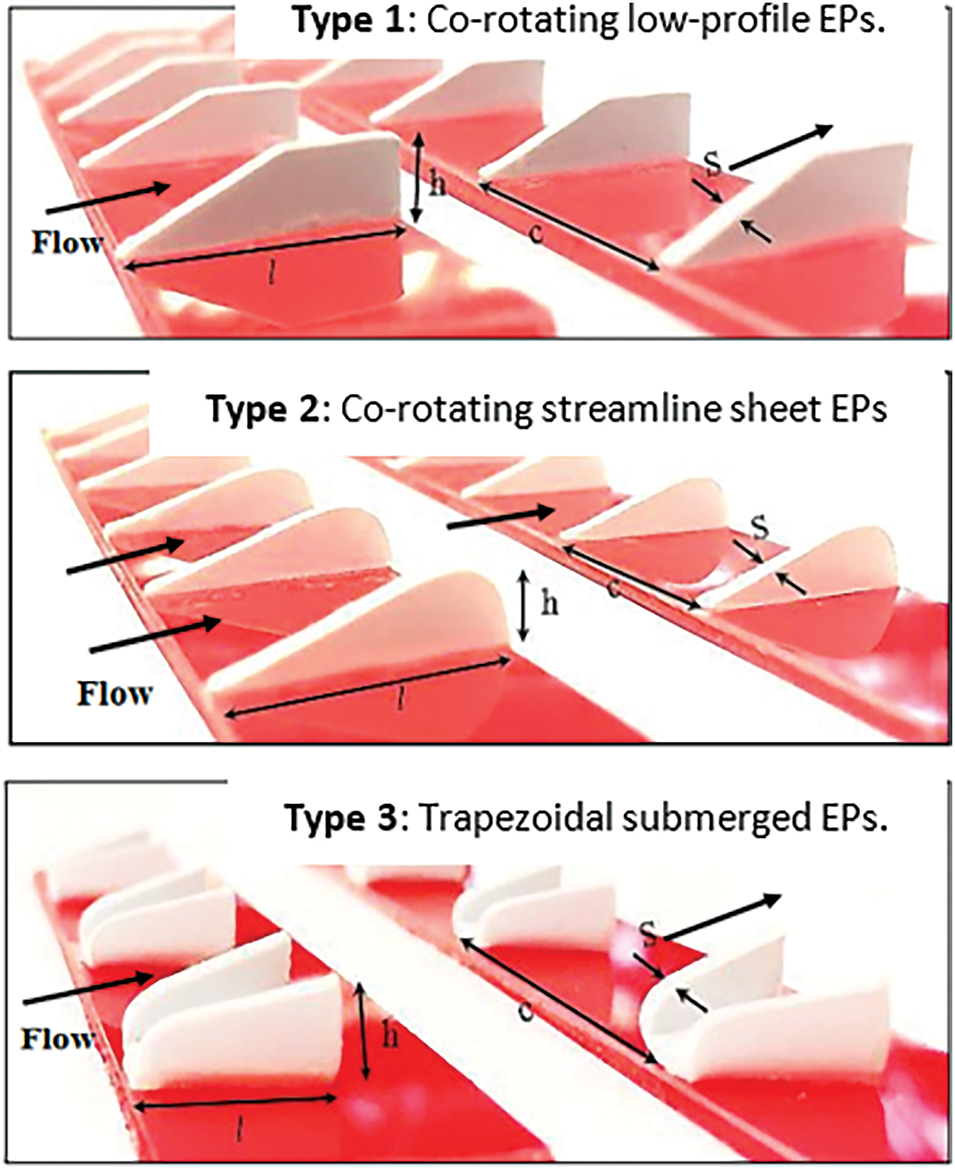
Figure 2: Outlines of the three energy promoters used in the aggressive diffuser to modify the flow in the high bending zone: Type 1. Co-rotating low-profile, Type 2. Co-rotating streamline sheet, and Type 3. Trapezoidal submerged
The number of EPs installed on the top and bottom surfaces is listed in Table 4. The locations of the installation planes are pointed out in Figs. 1–3. Three types of EPs have been installed on the top and bottom surfaces of the three diffuser configurations, as shown in Fig. 3.
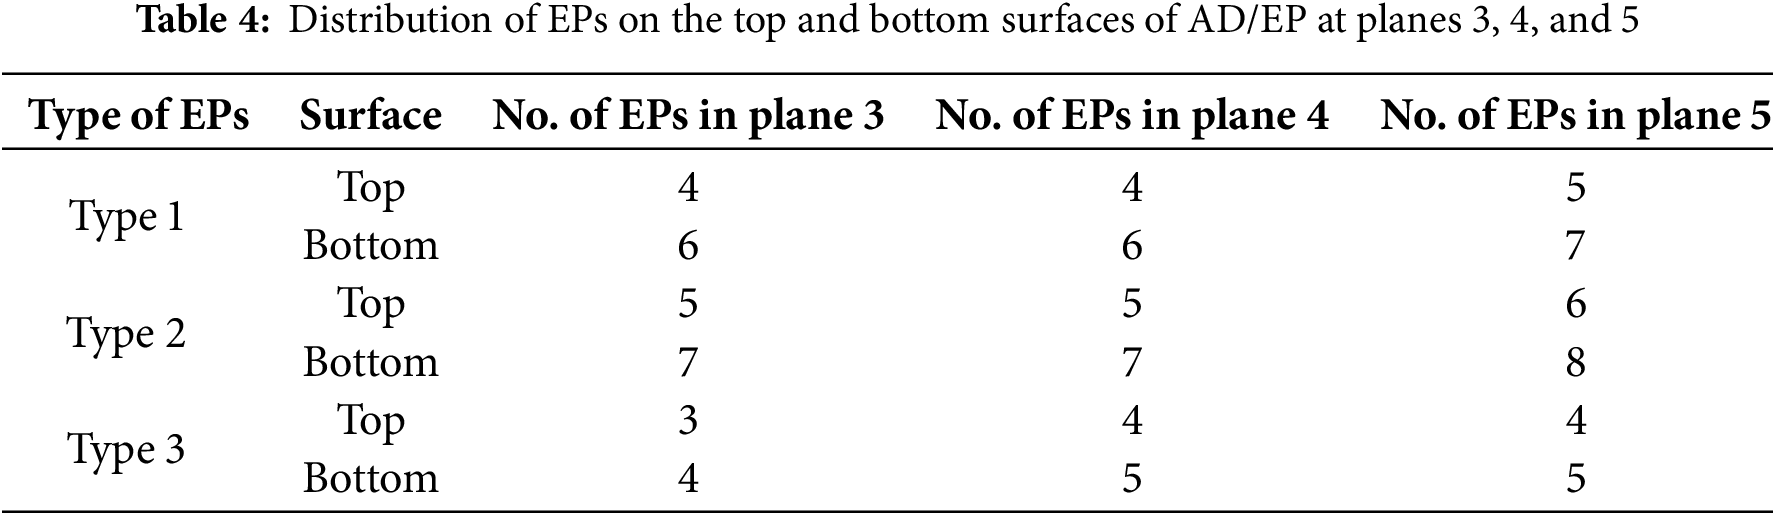
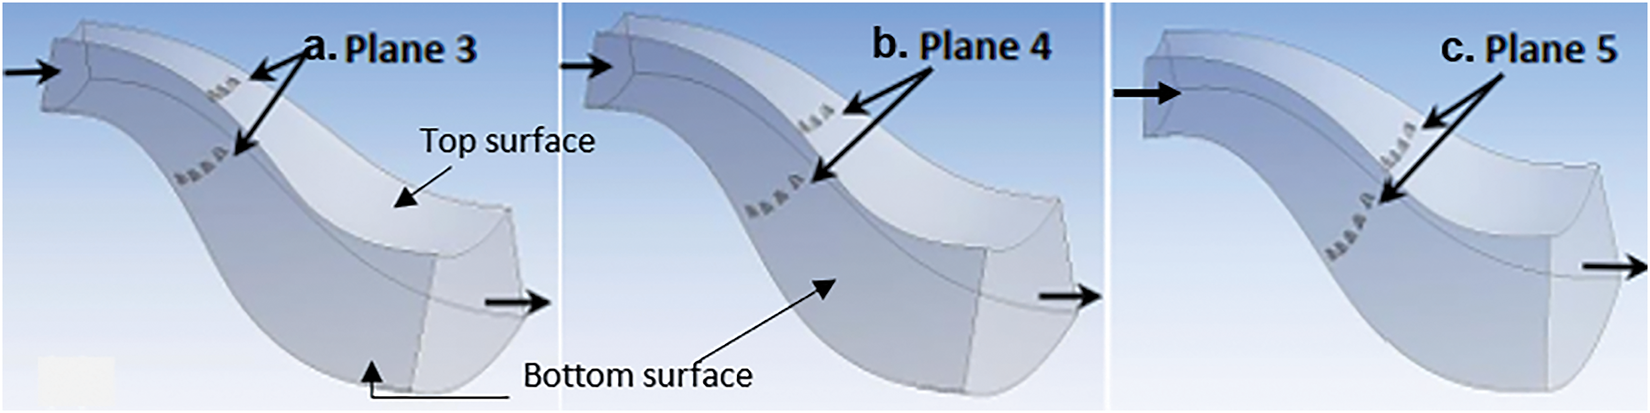
Figure 3: Distribution of EPs on the top and bottom surfaces of AD/EP at: a. plane 3, b. plane 4, and c. plane 5
Verification of Turbulence Intensity
Turbulence is a phenomenon where random fluctuations occur in the flow. Reynolds number is a common identifier of the turbulence in a flow represented by a ratio of inertial to viscous forces. For internal flow, Re is obtained by Eq. (1) [14,15]:
where:
Do is the outer diameter of the inlet cross-sectional area (m).
Di is the inner diameter of the inlet cross-sectional area (m).
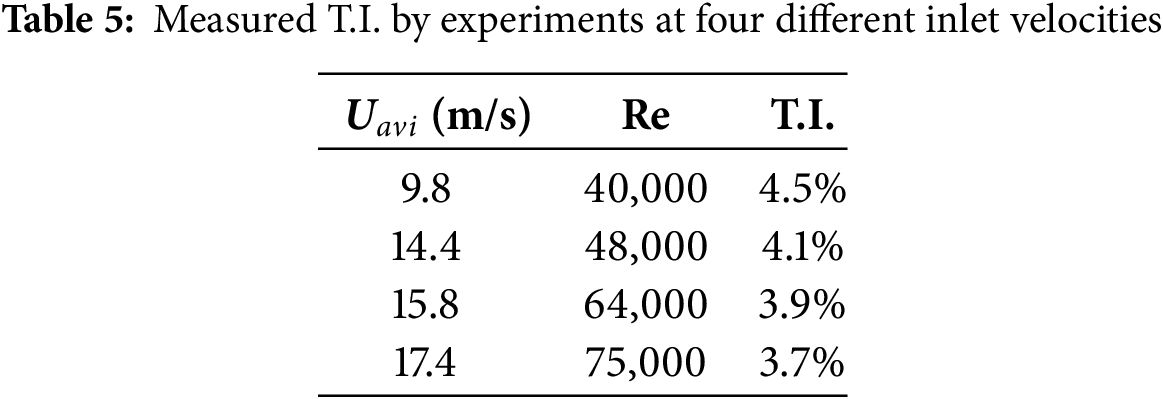
The turbulence intensity (T.I.), which used as inlet B.C. in the simulation, is defined as a measure of turbulent velocity fluctuations dependent on upstream flow history. The turbulence intensity can be calculated experimentally by using Eq. (3), and the associated predicted results of the T.I. at the inlet are displayed in Table 5.
The computational procedure used in the present research is an extension to experimental investigations to allow flow visualization and extended investigations. The simulation was achieved by solving the steady, 3D, incompressible flow Navier-Stokes equations in ANSYS 15 commercial software. The computational particulars and boundary conditions have all been adopted from the experimental implementation. Hence, the validation has been achieved by comparison with the experimental measurement results. The simulations were performed on the cases of bare D, bare AD, and AD/EP.
The Three types of EPs have been produced and illustrated on the top and bottom surfaces of the AD/EP. Fig. 3 shows AD/EP with three types of EPs distributed at planes 3, 4, and 5. The flow in an S-shaped diffuser needs 3D modeling because it is 3 dimensional with varying velocities and pressure along with the axial and transverse directions. The three models were imported into the CFD ANSYS software as volumes.
Mesh generation or discretization means subdividing the physical domain into separate subdomains, computational cells, or control volumes. Mesh generation, mesh refinement, defining the boundary conditions, and the simulation have been done by CFD ANSYS 15 software. The mesh may contain elements of different shapes and sizes. Also, the cell shape in 3D could be generated in different shapes. In this study, the generated mesh was unstructured for bare D, AD, and AD/EP, as illustrated in Fig. 4.
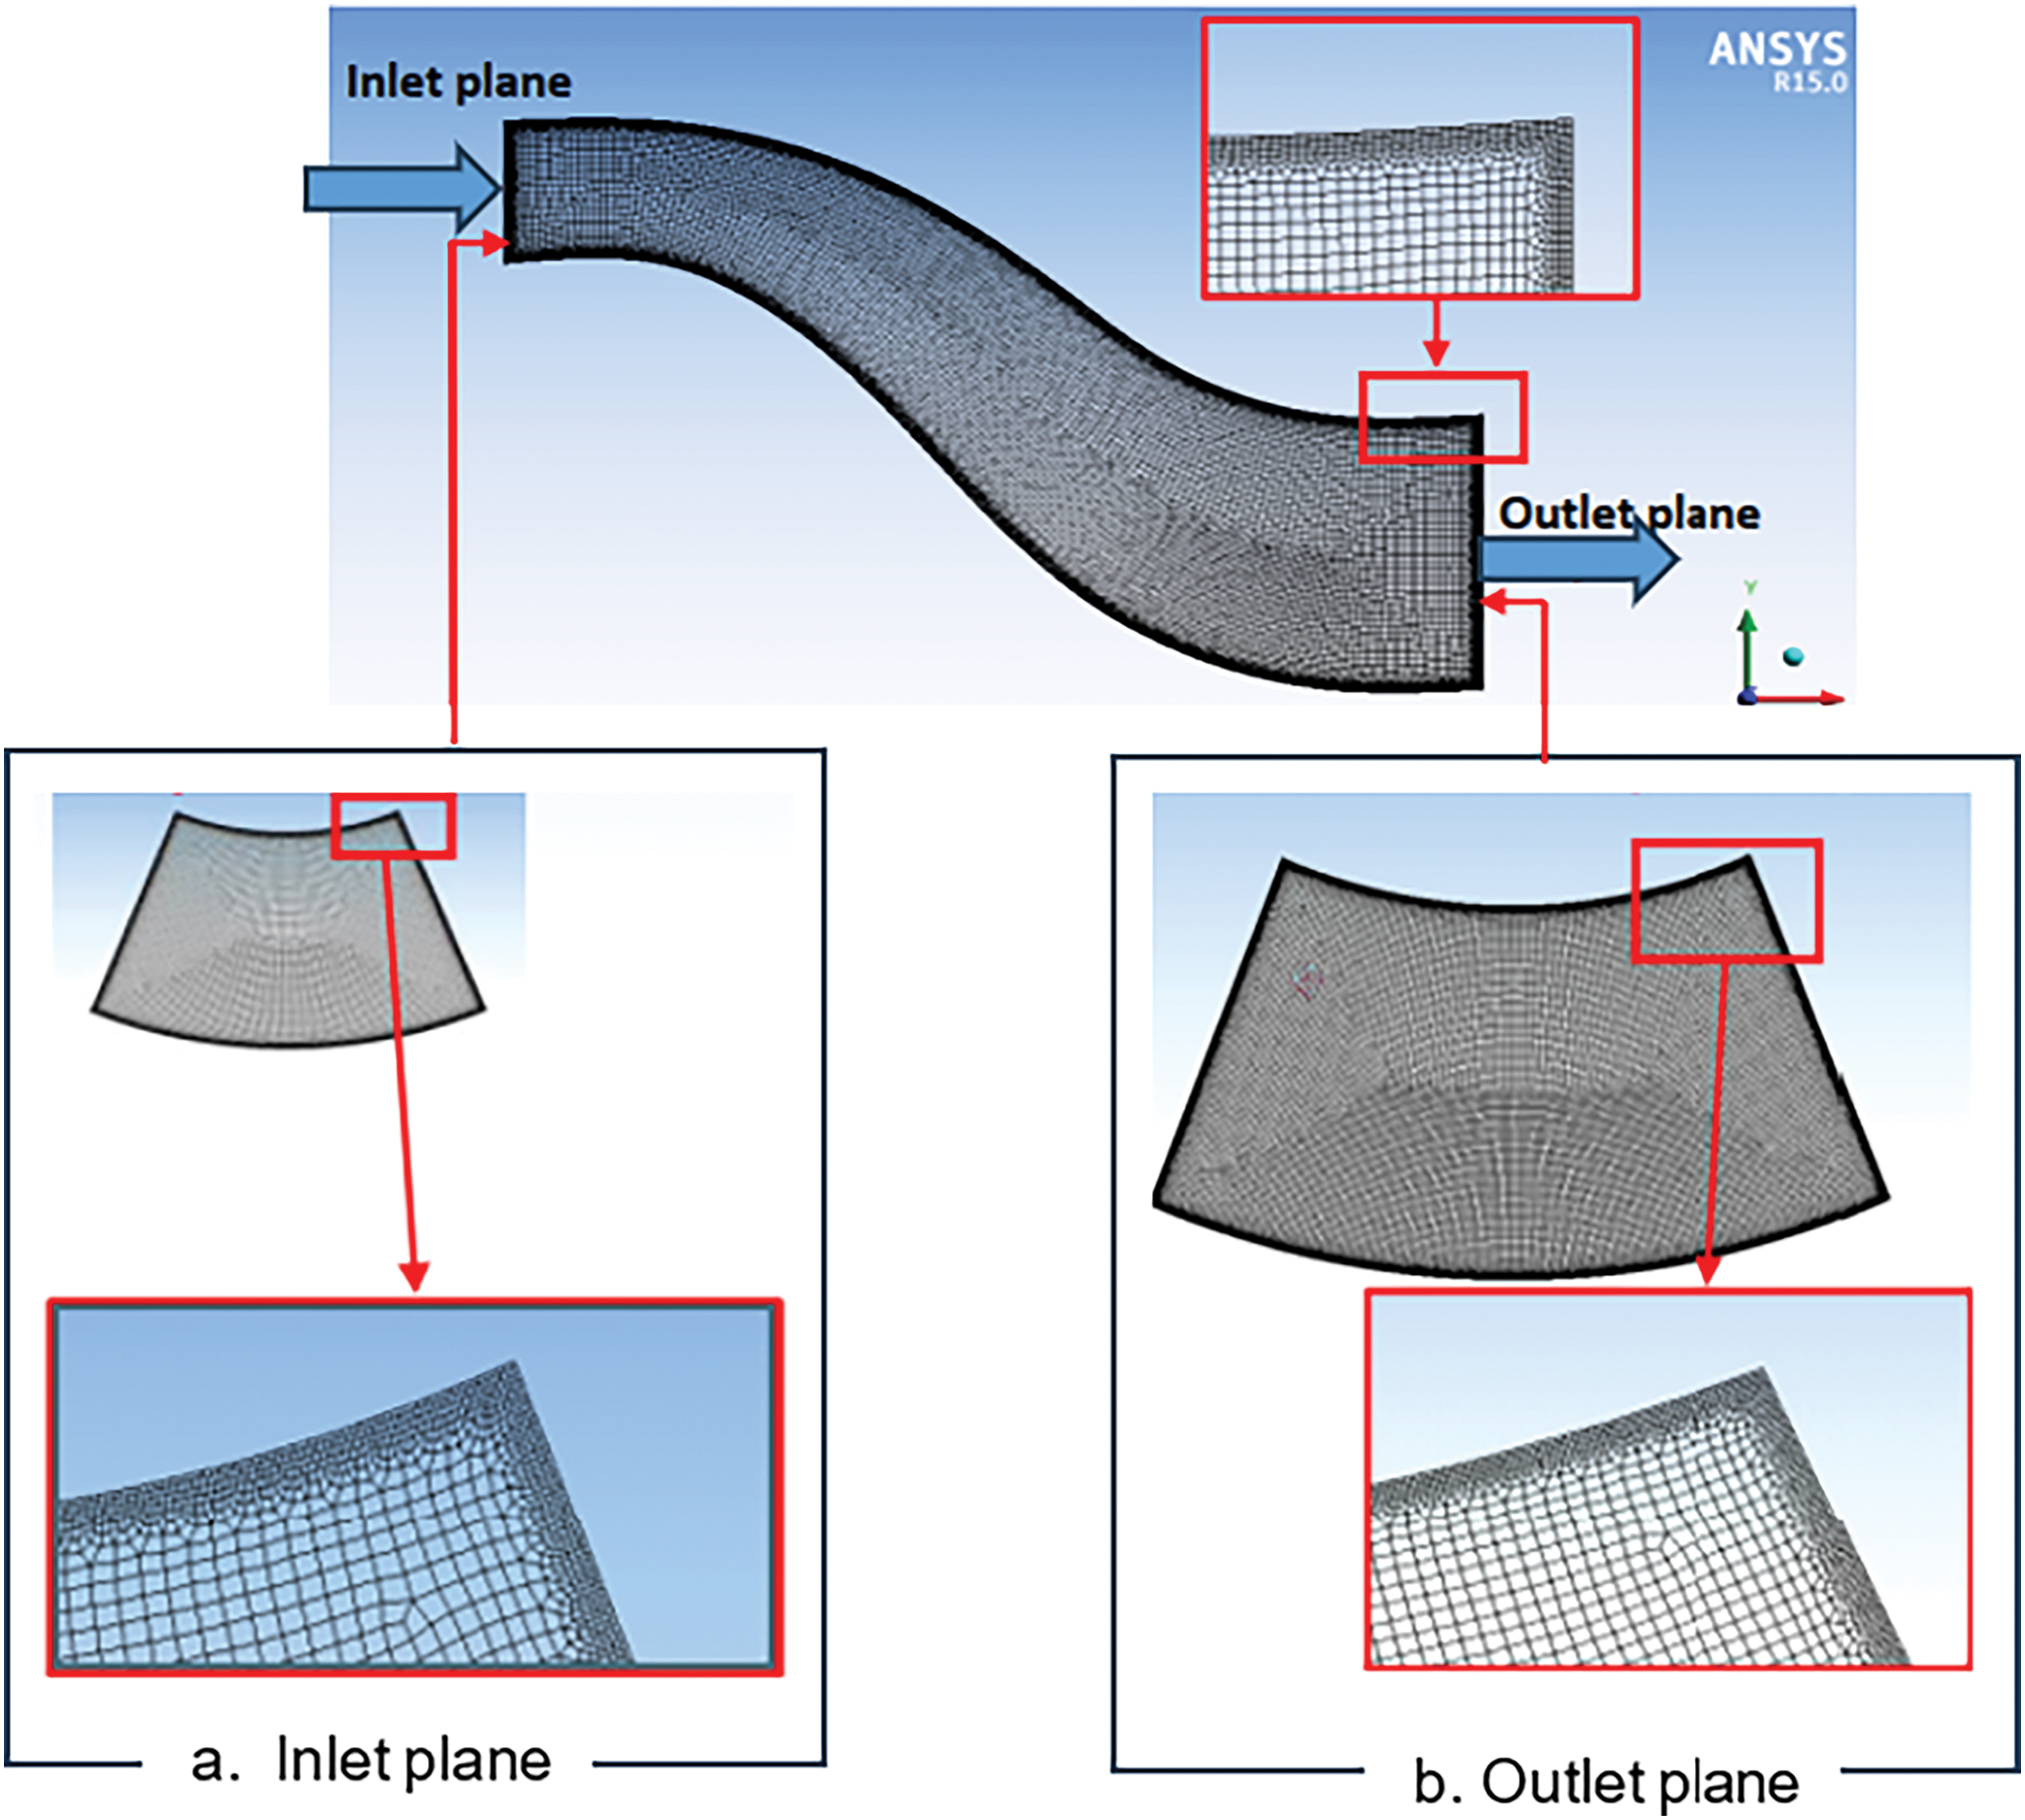
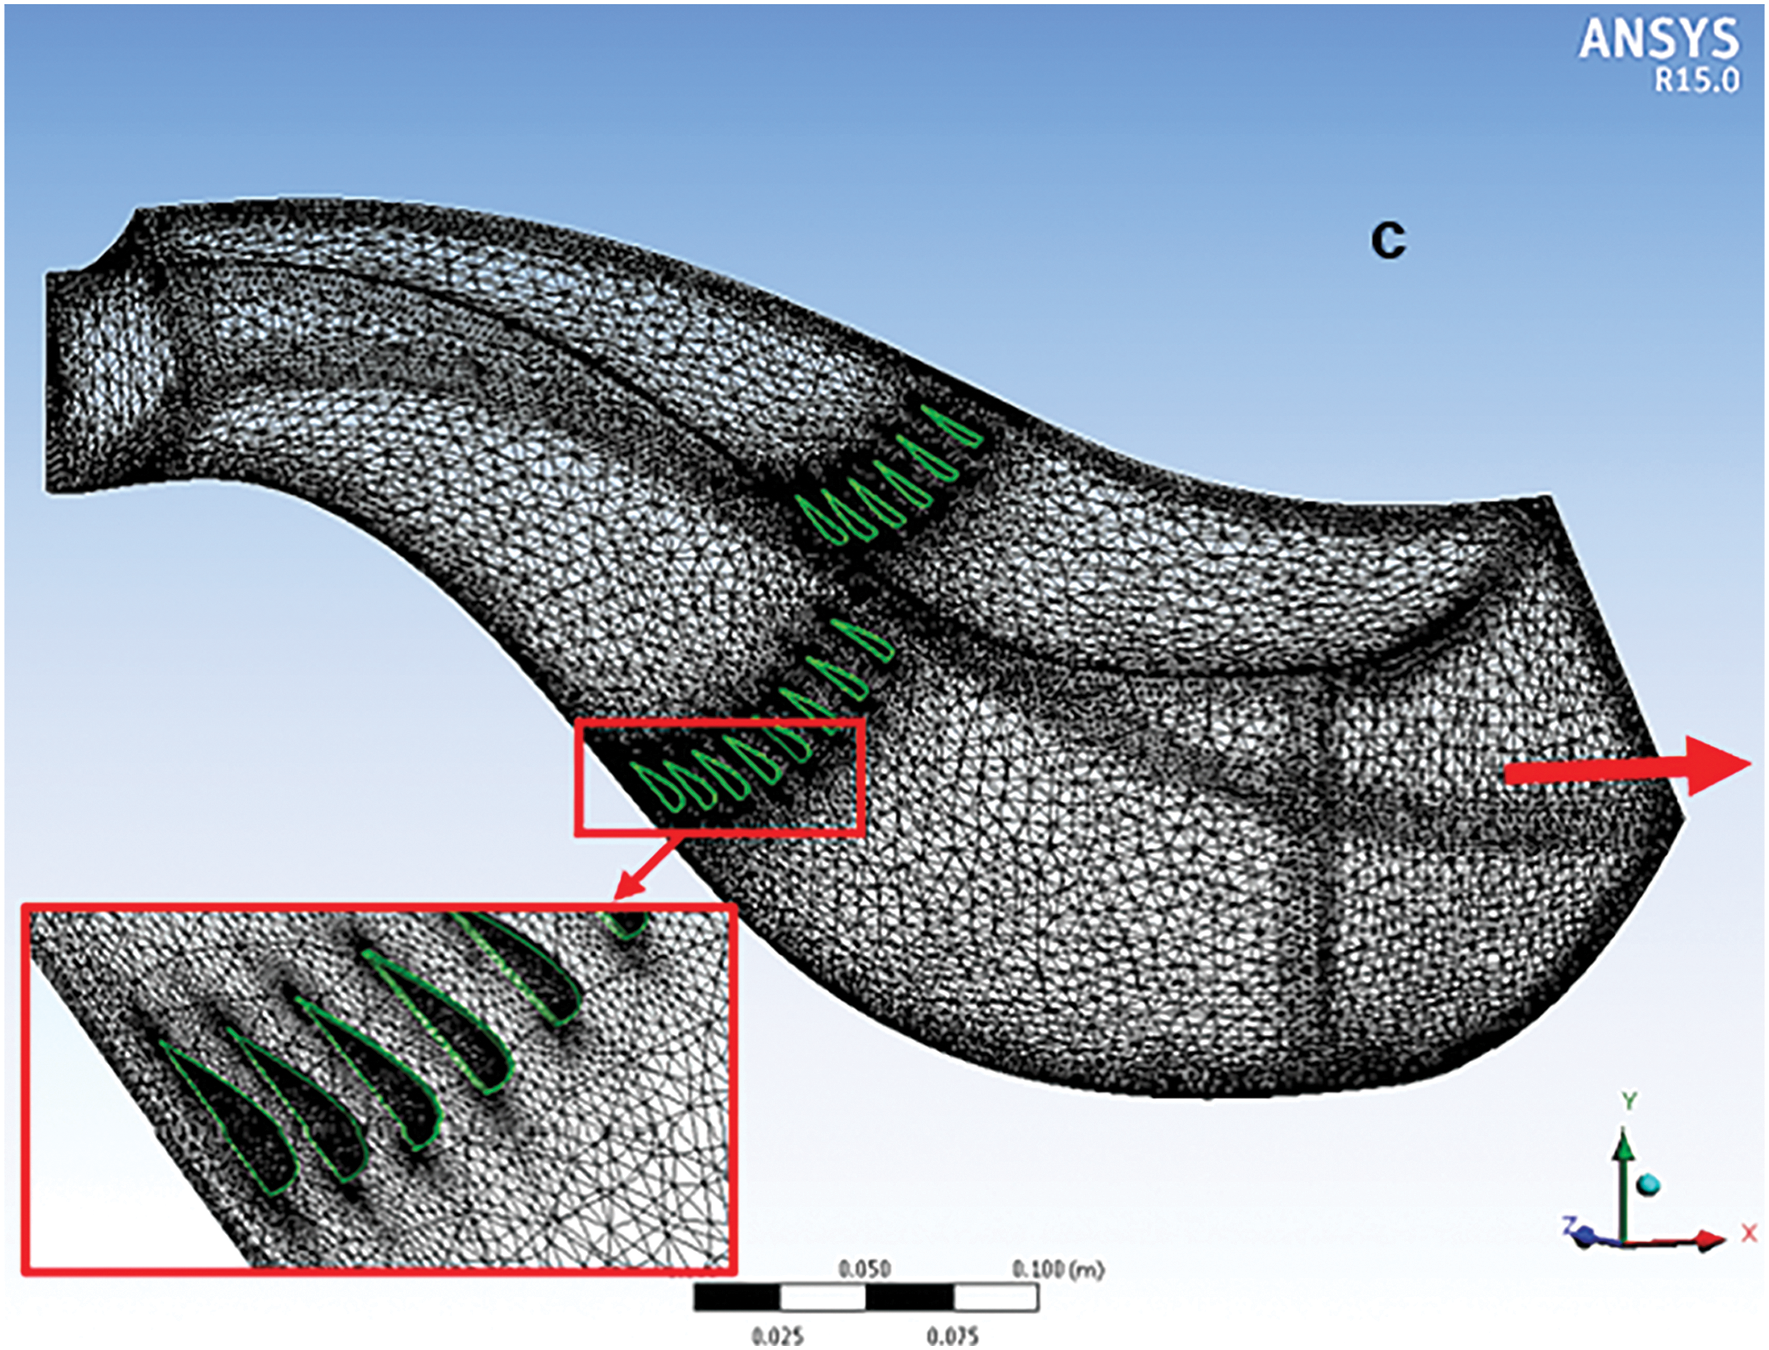
Figure 4: Unstructured mesh of: a. Inlet of diffuser, b. outlet of diffuser, and c. AD with energy promotors
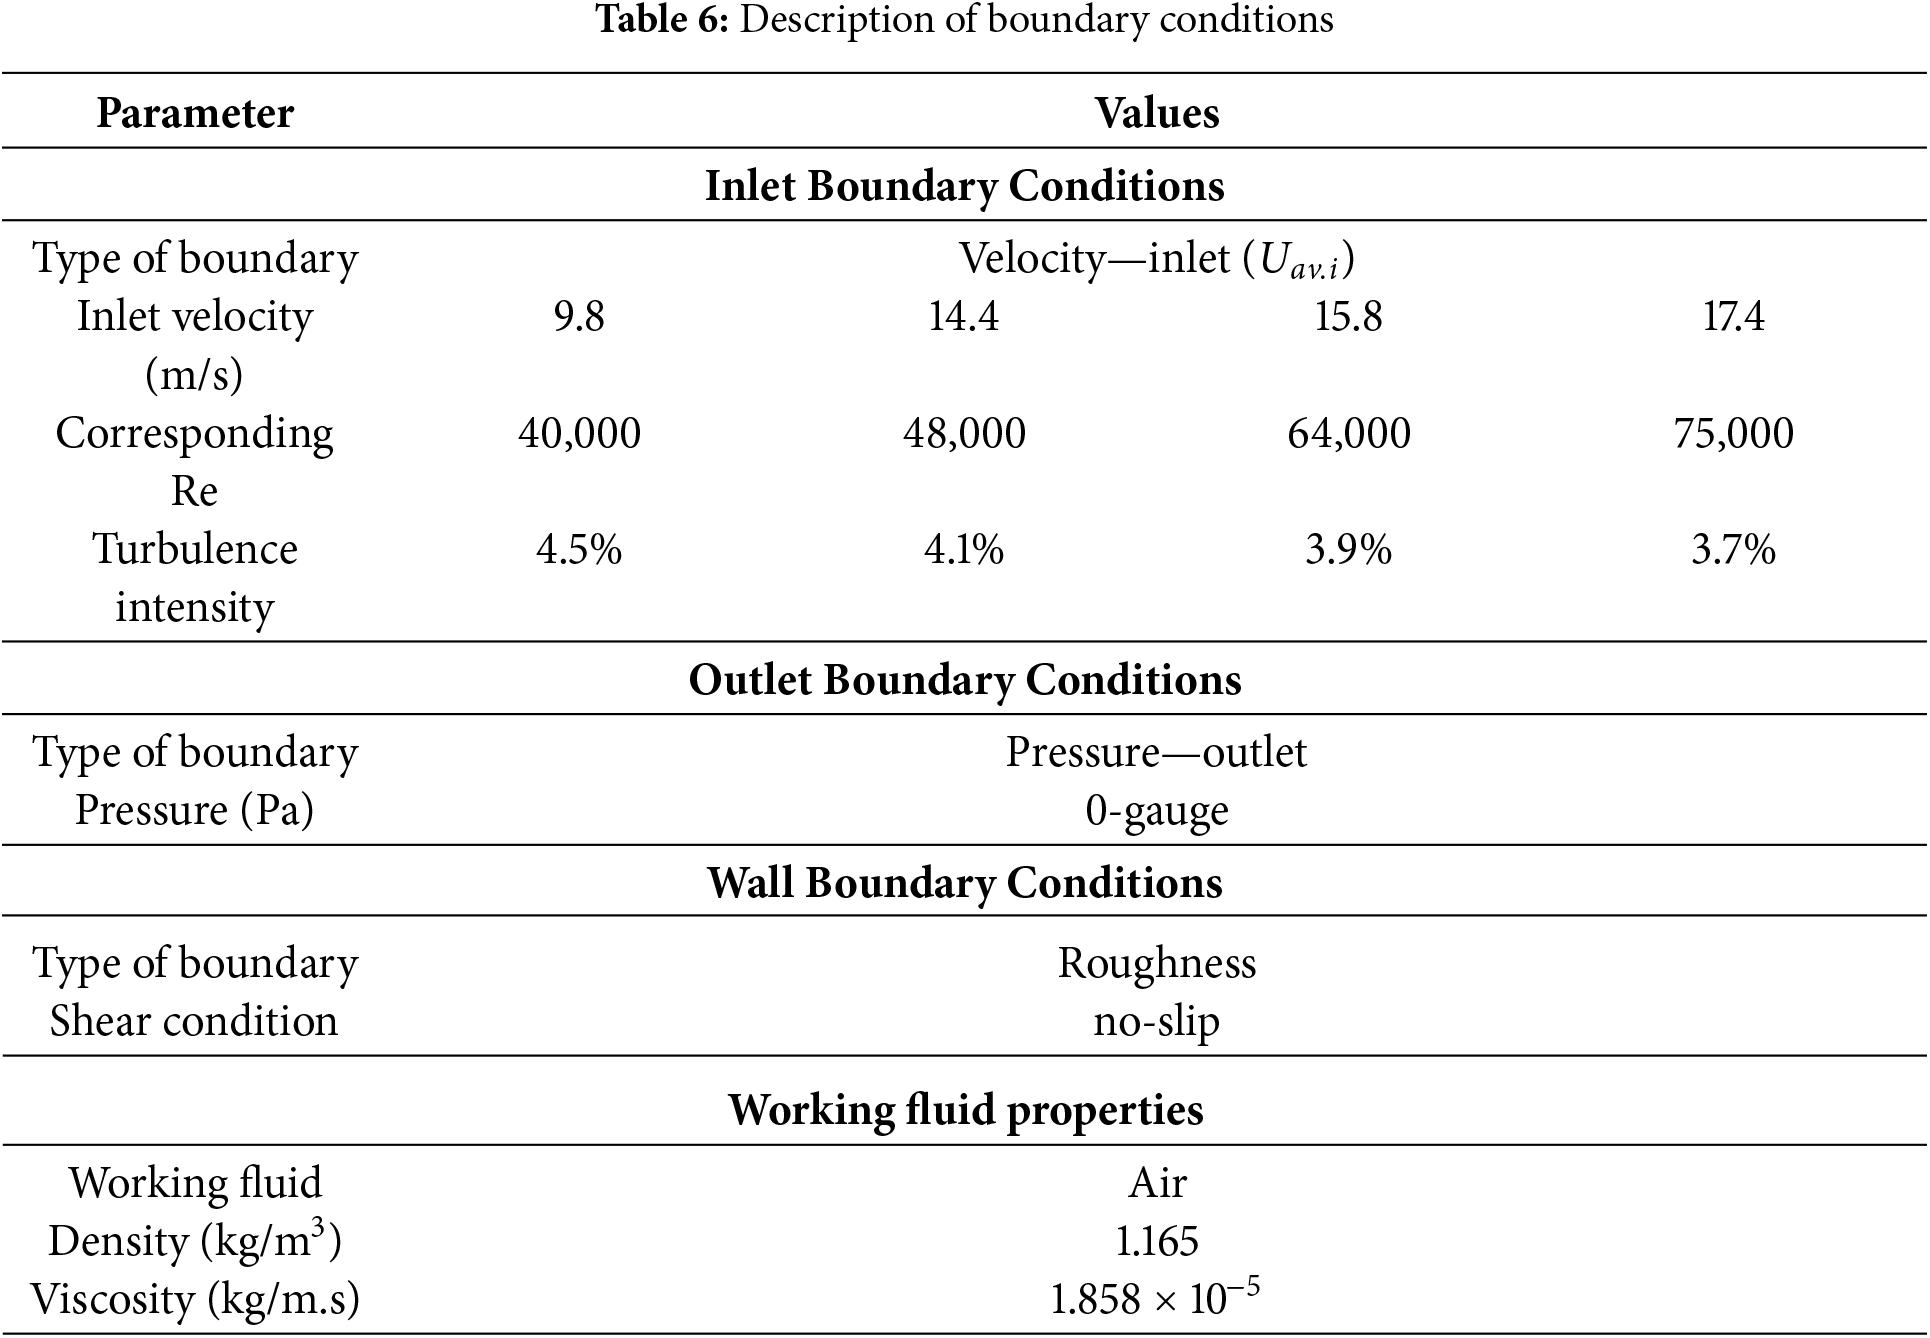
The CFD simulations of diffuser models have Uav.i, p and TI values as measured experimentally and used as input boundary conditions. For all simulation cases, zero-gauge pressure was specified as an exit boundary condition. No slip boundary condition was specified at the walls of the diffuser. Near the wall, modeling is performed with an enhanced wall treatment method to address the boundary layer formed during grid generation. All simulation cases were performed with standard air properties, as in Table 6.
3.4 Governing Equations of Fluid Flow
The 3D, steady-state, RANS governing equations for continuity and momentum in x, y, and z coordinates were numerically solved for turbulent incompressible flows of air. The flow field was predicted by solving the continuity and momentum equations set. The 3D Standard k–ε turbulence model has been adopted for simulating the turbulence quantities in the flow field. Assumptions used to simplify the fundamental equations to approximate airflow characteristics of the domain are:
• Turbulent airflow.
• Incompressible airflow with constant density and viscosity at 30°C, similar to the experiment conditions.
• 3D, Steady-state flow.
• No slip conditions exist on the walls.
Among the simulation of the aggressive diffusers, Fiola et al. [16] tested the diffusing S-duct numerically by CFD-ANSYS software. CFD software has been employed on a computational structured mesh to solve the RANS equations in conjunction with four different turbulence models: the Spalart–Allmaras (SA) one equation model, two-equation k-ε and k-ω Shear Stress Transport (SST) models, and the four-equation transition SST model. The numerical results have been compared with the available experimental data. Among the four turbulence models, transition SST model predicted the best results compared to NASA Glenn Research Center’s experimental data for the static pressure coefficient.
Standard k-ε with improved turbulence model, namely Renormalized Group k-ε (RNG k-ε) and Realizable k-ε turbulence model, were tested. The validation of experimental results against the numerical results of these turbulence models is required to optimize the turbulence model. The validation of experimental results against the numerical results of these turbulence models is required for the optimization of the turbulence model. Also, high-order discretization schemes have been applied. In the present study, the first grid point of y+ ≈ 2 within the inner layer of the wall is most suitable for the wall functions approach of near-wall treatment. A decision was made not to present the governing equations as they are known standard equations and are mostly available in the ANSYS guide and much literature.
Static Pressure Recovery, CPR indicator was adopted for grid independence check. The simulation results showed a difference of 21% with the experimental measurement of CPR. The model was developed initially with 183,402 elements (coarse mesh), obtained by default. The mesh has increased until it reaches the optimum number of elements with 708,603 elements because the difference between finer mesh and finest mesh in CPR is well at 1.7%.
3.6 Validation of the Computational Procedure
The preliminary investigations are done using various turbulence models for validating the numerical results against the experimental data obtained for the bare S-shaped and aggressive S-shaped diffuser with EPs. The flow field is predicted with three different turbulence models: standard k-ε, RNG k-ε, and realizable k-ε with the experimental results of CPR. The three turbulence models have been employed to investigate the CPR of bare S-shaped aggressive diffuser and aggressive S-shaped diffuser with EPs type 2 at plane 5, with inlet Re = 40,000. Difficulties were realized in obtaining a converged solution using RNG k-ε and enhanced wall treatment. In contrast, the solution using standard k-ε and realizable k-ε turbulence models has converged at about the 6000th iteration with residual 1.0 × 10⁻⁴.
Figs. 5 and 6 show the experimental and CFD values of CPR for bare D and bare AD, respectively, with Re ranging from 40,000 to 75,000. Quantitatively, the CPR results match very closely, with CFD CPR values slightly higher than those obtained in the experimental investigation, for both cases of bare and agressiveare diffusers. The drop of CPR with bare AD results from different causes, as explained previously. Also, slight CPR improvement is observed with an increase in the inlet Re, which is consistent with observations by [17,18].
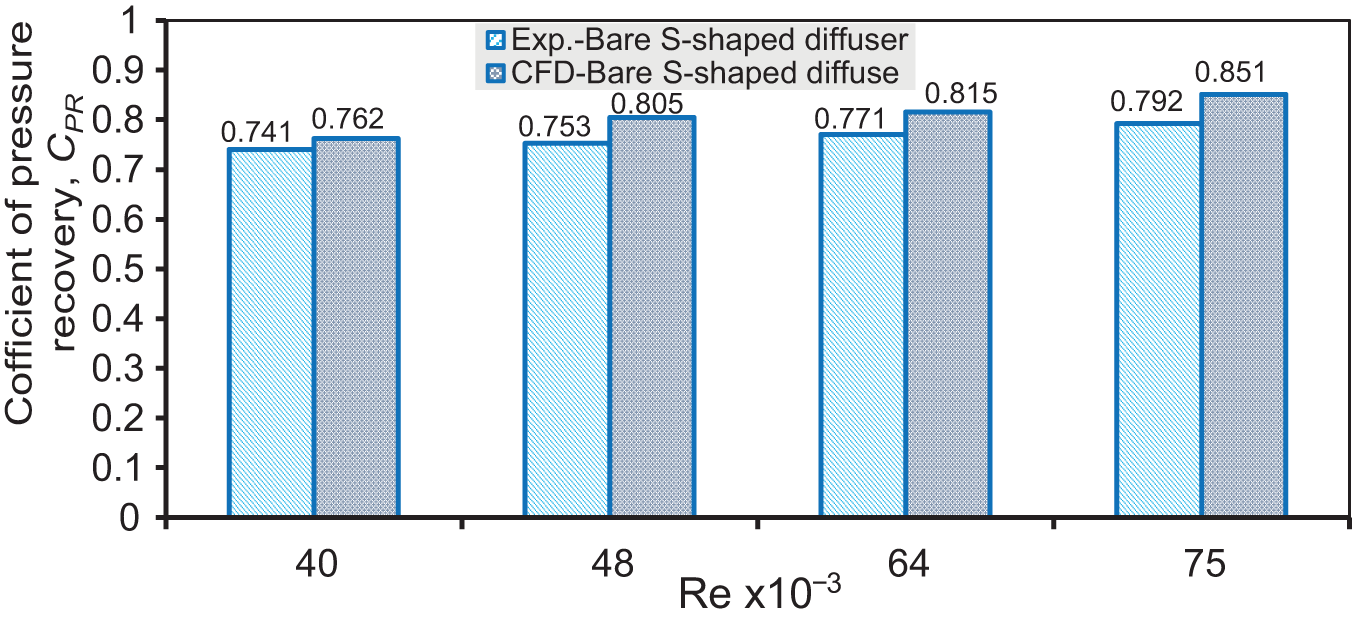
Figure 5: Comparison between the experimental and numerical results of CPR of bare diffuser over a range of Re from 40 × 103 to 75 × 103
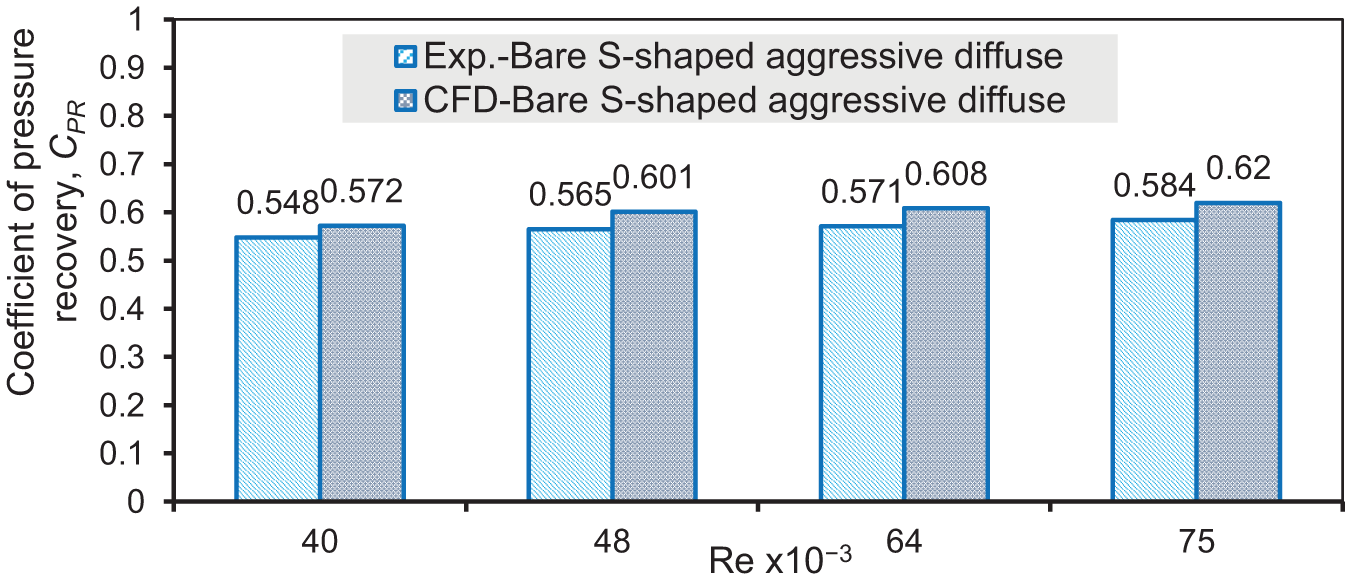
Figure 6: Comparison between the experimental and numerical results of CPR of bare aggressive diffuser over a range of Re from 40 × 103 to 75 × 103
However, the average deviation between the experimental results and CFD results for bare D is 5.7% over the investigated range of Re. At the same time, the average deviation between experimental results and CFD results for bare AD is 5.9%.
The computational simulation of bare D, bare AD, and AD/EP enabled the prediction of the performance parameters at 40,000, 48,000, 64,000, and 75,000 Re numbers. In addition, the simulation provided a clear airflow structure and allowed further insight into the flow field in each case of the tested S-shaped diffusers.
4.1 Analysis of Bare D and Bare AD
4.1.1 Static Pressure Recovery Coefficient
The static pressure recovery coefficient, CPR of bare D, and bare AD are presented in Fig. 7 at different flow Re, ranging from 40,000 to 75,000. The trend of CPR over the range of Re for both diffusers is similar and showed a continuous increase with an increase in Re values. At 40,000 operational Re, the bare AD shows a reduction in the CPR of around 35%, increasing to 39.3% at Re = 75,000. Higher Re causes a larger reduction in the CPR in the bare AD compared to the bare D. Similar trend has been observed in experimental and numerical investigations of Kumar Gopaliya et al. [19], Jirásek [20], and Lee et al. [21].
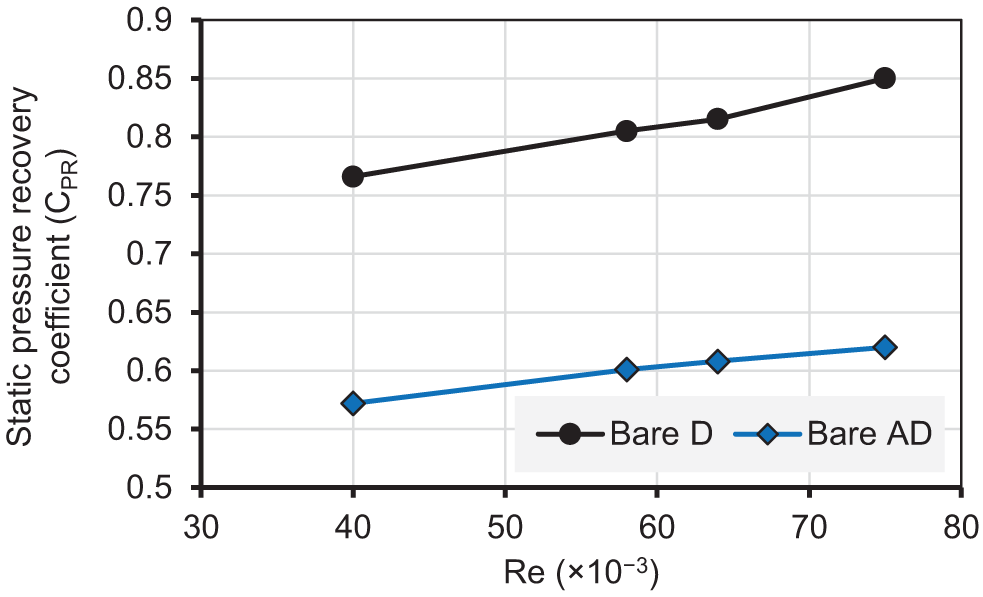
Figure 7: Variation of CPR of bare D and bare AD at various Re
Figs. 8 and 9 show the contours of CPR distribution at Re = 40,000 on longitudinal planes in the middle of bare D and bare AD, respectively. The reduction in CPR is clear with the bare AD compared to bare D, which accelerates flow and increases the flow separation with high curvature surfaces. This contributes to shifting upstream the onset of separation on the bottom surface and increasing the extent of flow separation. The CPR was dropped at the outlet plane from 0.76 of bare D to 0.57 with the bare AD. The CPR contours of both models show that the maximum drop is indicated on the bottom surface at the inlet plane to the onset of the first bend (bounded area) when the flow accelerates to the maximum velocity.
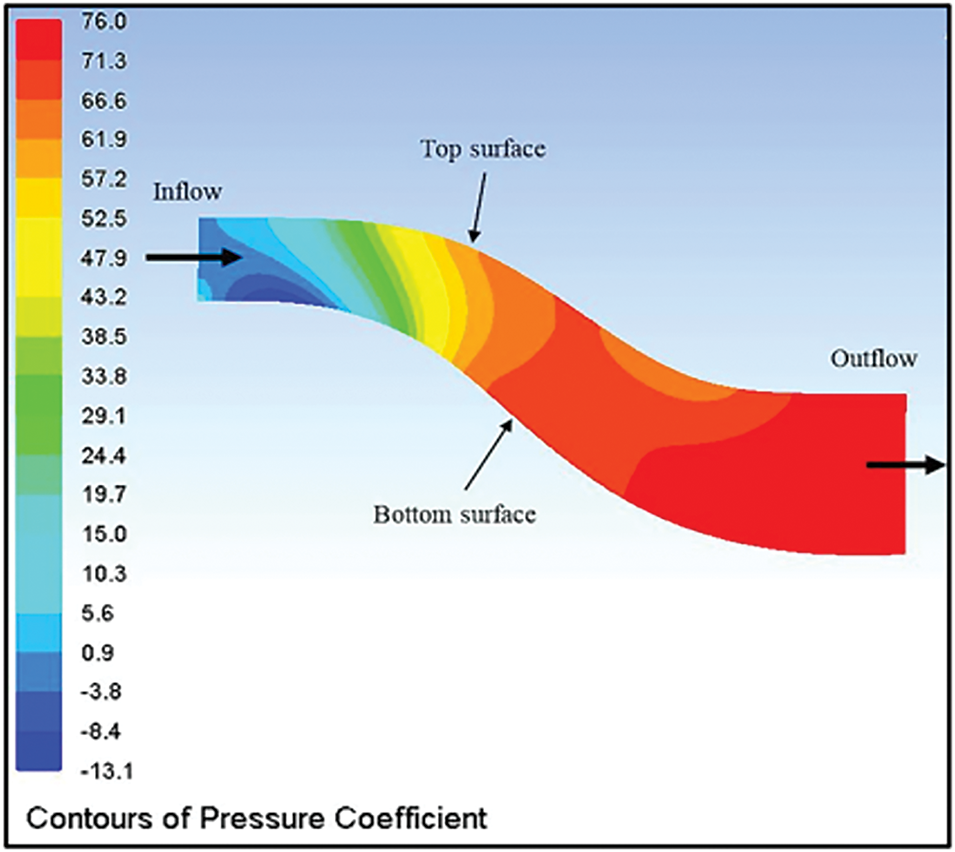
Figure 8: CPR contours of bare D with the longitudinal plane at Re = 40,000
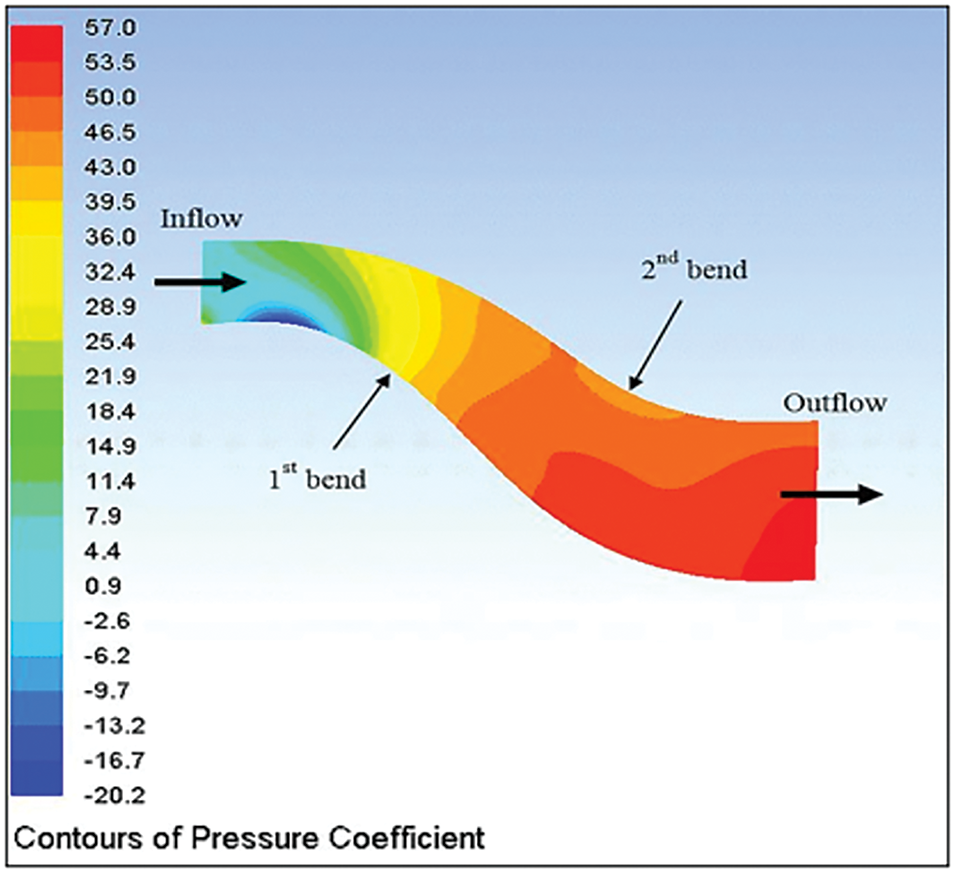
Figure 9: CPR contours of bare AD with thelongitudinal plane at Re = 40,000
The CPR was enhanced by 9.5% and 8% with bare D and bare AD, respectively, when the Re increased from 40,000 to 75,000. In contrast, the CPR dropped by about 33% with bare AD compared with bare D. Also, the CPR drop can be obvious at the second bend of the top surface (bounded area) for the same reason.
The CPR was enhanced by 9.5% and 8% with bare D and bare AD, respectively, when the Re increased from 40,000 to 75,000. In contrast, the CPR dropped by about 33% with bare AD compared with bare D. Also, the CPR drop can be obvious at the second bend of the top surface (bounded area) for the same reason.
4.1.2 Analysis of Total Pressure Loss Coefficient
Fig. 10 presents CTL variation with Re ranging from 40,000 to 75,000 for bare D and bare AD. The results show a reduction in CTL with increasing the Re. This reduction results from increasing the mixing level of high momentum flow with the low momentum flow close to the bottom surface. This process reduces the flow separation zone and then reduces the pressure loss. The CTL values of the bare AD were higher than the CTL values of bare D along with the range of Re. The percentage reduction in CTL was 8.6% and 7.2% for bare D and bare AD, respectively. Also, the CTL increased by 10.5% with bare AD compared to bare D.
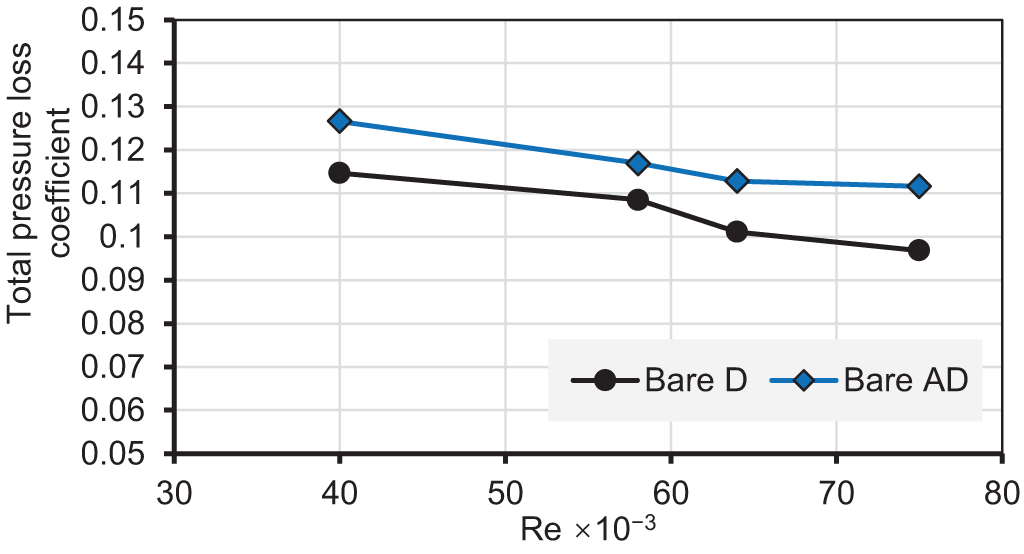
Figure 10: Variation of CTL of bare D and bare AD with a range of Re
4.1.3 Distortion Coefficient, DC(45°)
Fig. 11 presents the outlet plane total pressure contours to serve as a visual aid in showing the effects of increasing the inlet Re number from 40,000 to 75,000 on the flow distortion. The contours show that there is a more uniform distribution of total pressure at the outlet plane for bare D compared with bare AD. The difference between bare D’s maximum and minimum values is less compared to the bare AD at the investigated Re, as shown in Fig. 11 (i and ii). The DC(45°) was reduced from 0.170 to 0.158 and from 0.183 to 0.180 with an increase Re from 40,000 to 75,000 for bare D and bare AD, respectively. Also, the total pressure values of bare D, Fig. 11A and C, are less than the total pressure values of the bare AD, Fig. 11B and D due to the accelerating flow resulting from the high bending of bare AD.
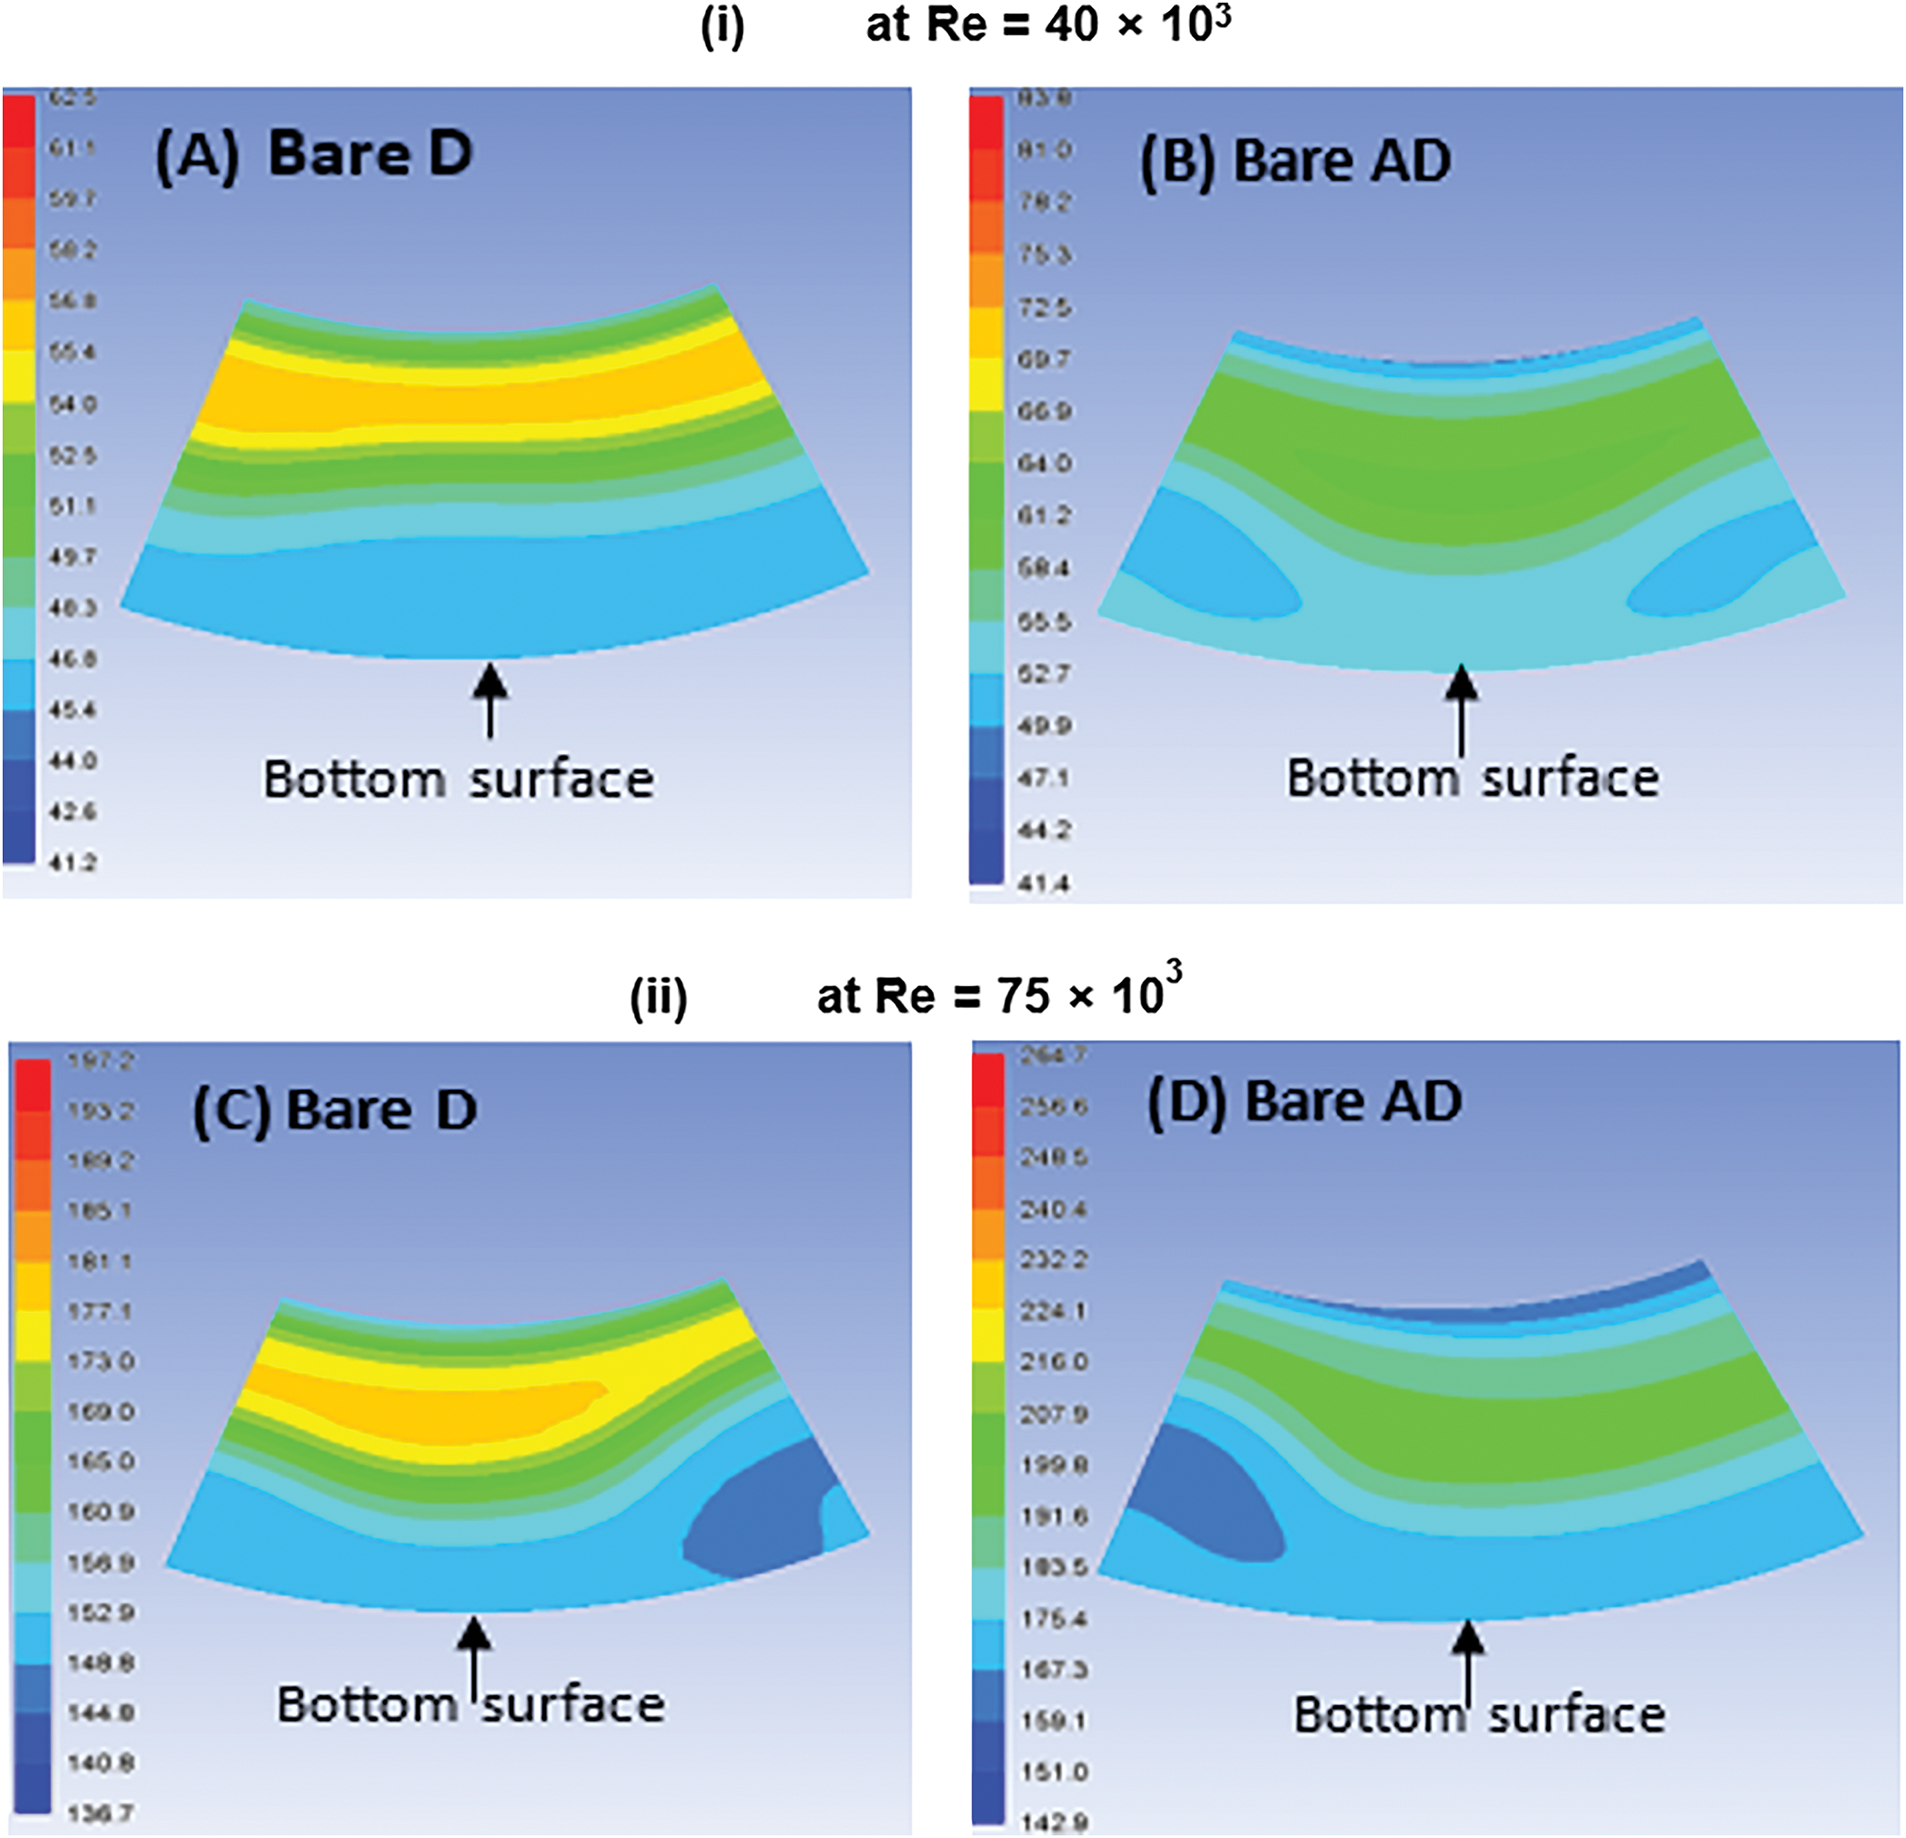
Figure 11: Total pressure contours at bare D and bare AD outlet planes with (i) Re = 40,000 and (ii) Re = 75,000
4.2 Analysis of S-Shaped Aggressive Diffuser with EPs
4.2.1 Pressure Recovery Analysis of Aggressive Diffuser with EPs
Fig. 12 shows the values and distribution of CPR contours in AD/EP at Re = 40,000 with EPs at installation planes 3, 4, and 5. Implementing EPs improved the CPR magnitude and increased the area occupied by high CPR values along with the diffuser. The CPR enhancement with EPs and increasing the inlet Re were indicated by Jirásek [19]. With EPs type 1, at plane 5, the maximum enhancement was 24.5% with Re = 40,000 compared with bare AD. However, the enhancements are 19.5%, 22.2%, and 24.5% with EPs at planes 3, 4 and 5, respectively.
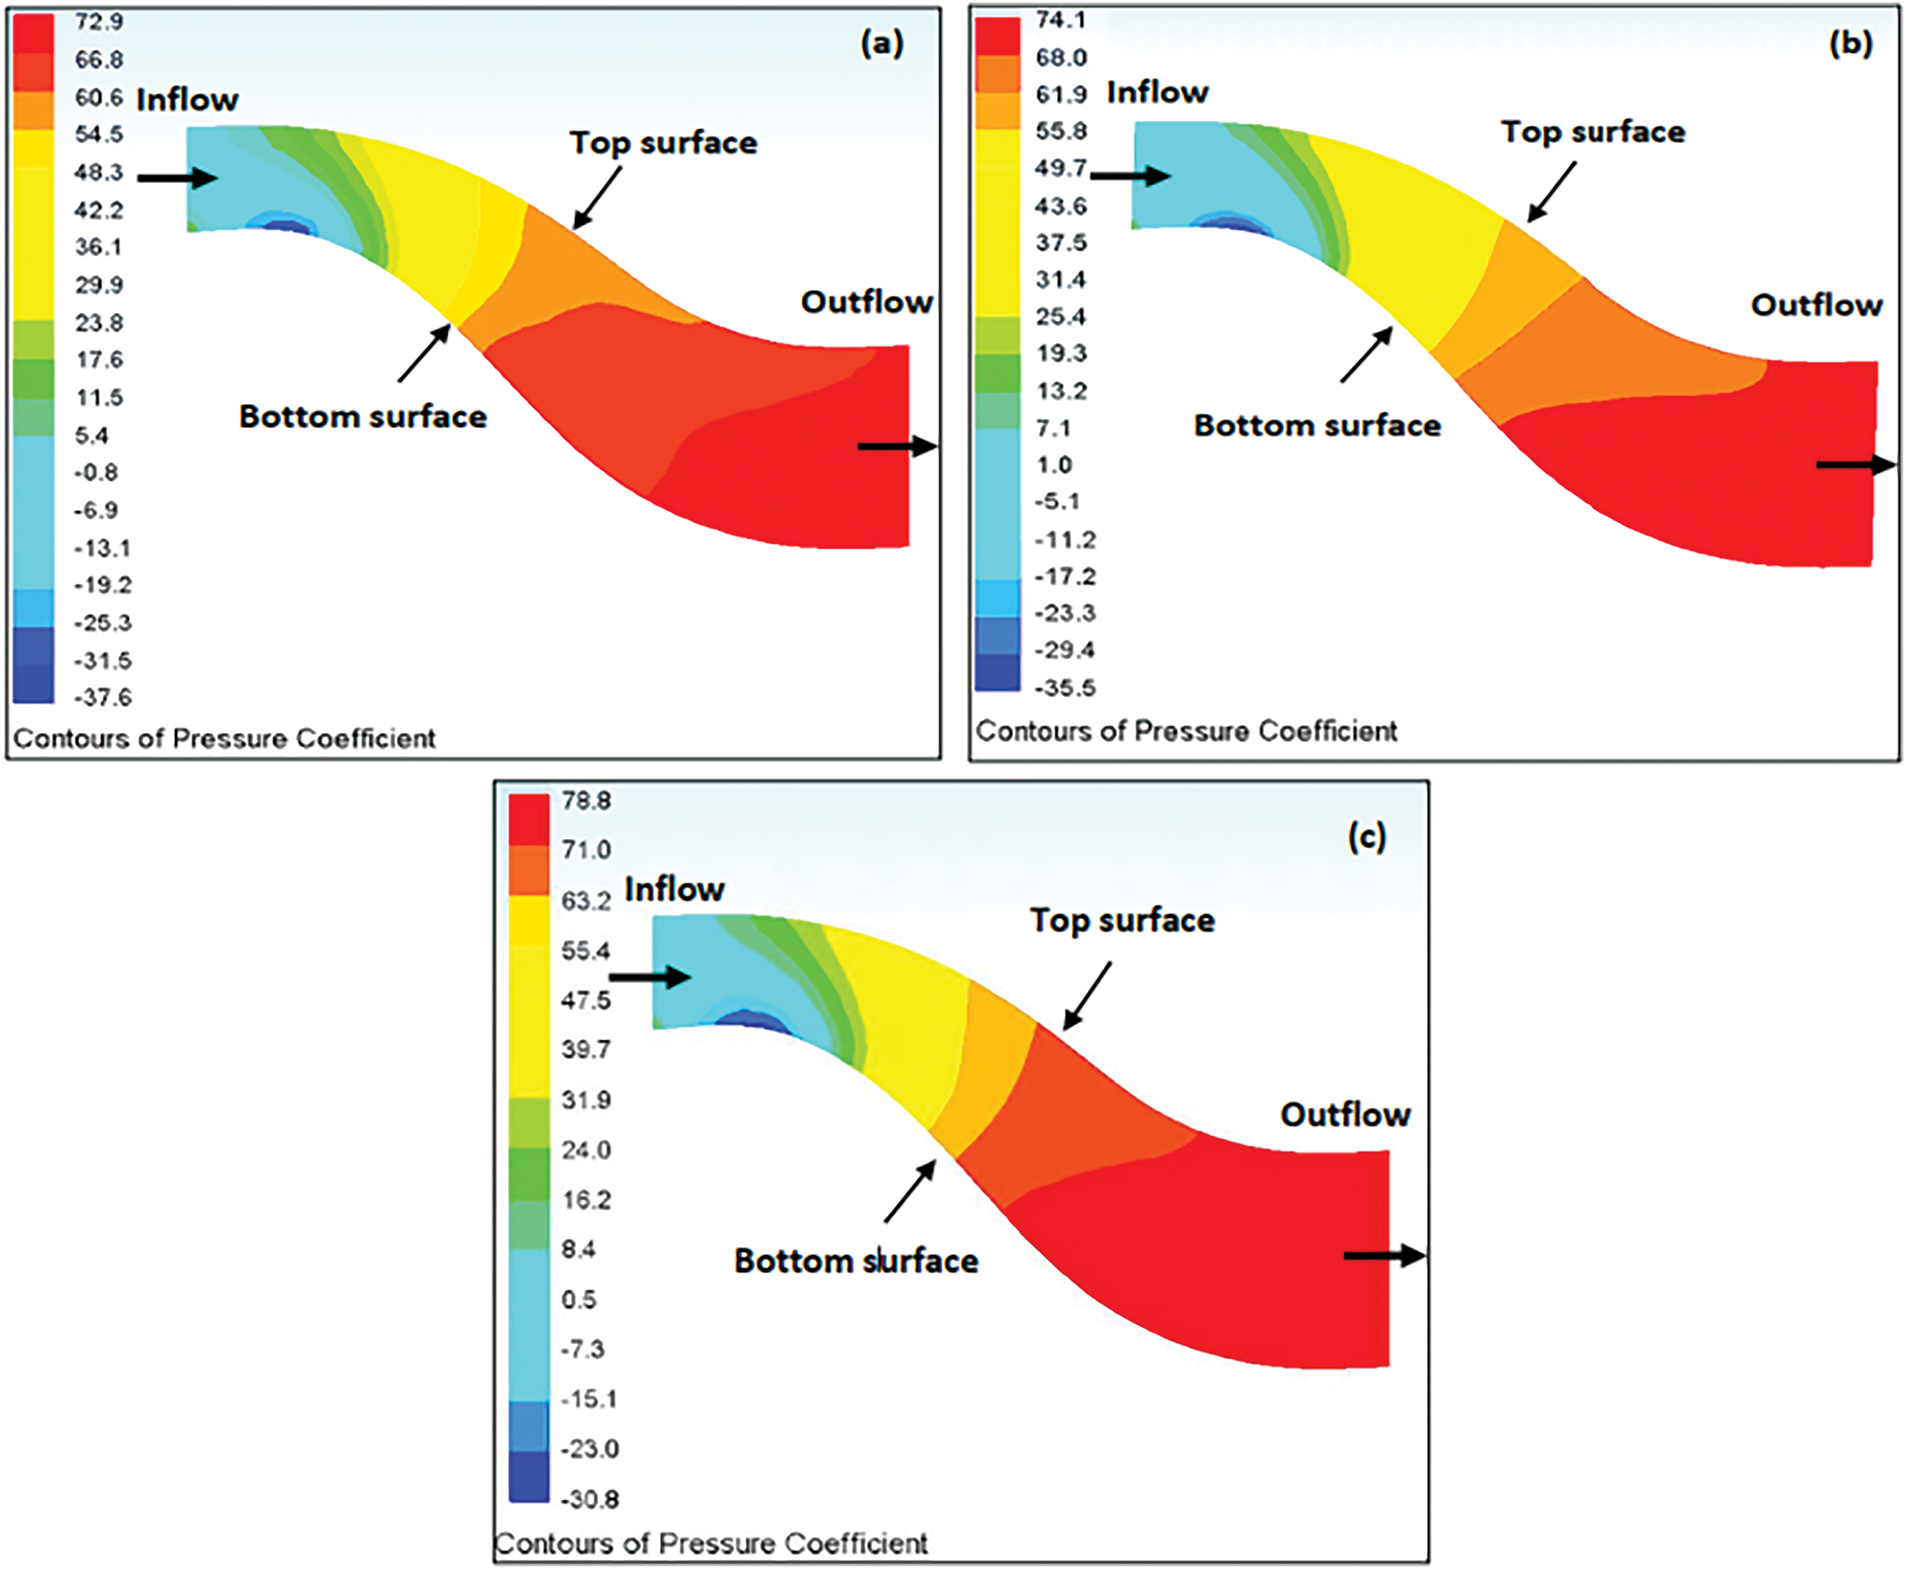
Figure 12: The contours of static pressure recovery coefficient in AD/EP diffuser at inlet Re = 40,000 with EPs type 1 at installation planes: (a) plane 3, (b) plane 4, and (c) plane 5
For EPs type 2, the trend of CPR graphs is similar but with different quantitative values. As with the previous EPs type 1, increasing Re from 40,000 to 75,000 increases the CPR from 0.771 to 0.815 with EPs at plane 3, as shown in Fig. 13. Also, the increase in the Re increases the CPR for the two other cases. Implementing EPs on the top and bottom surfaces at plane 5 significantly enhances CPR by 31.2% compared with the bare AD at Re = 40,000. In contrast, the other two cases improved CPR by 25% and 28%, with EPs at planes 3 and 4.
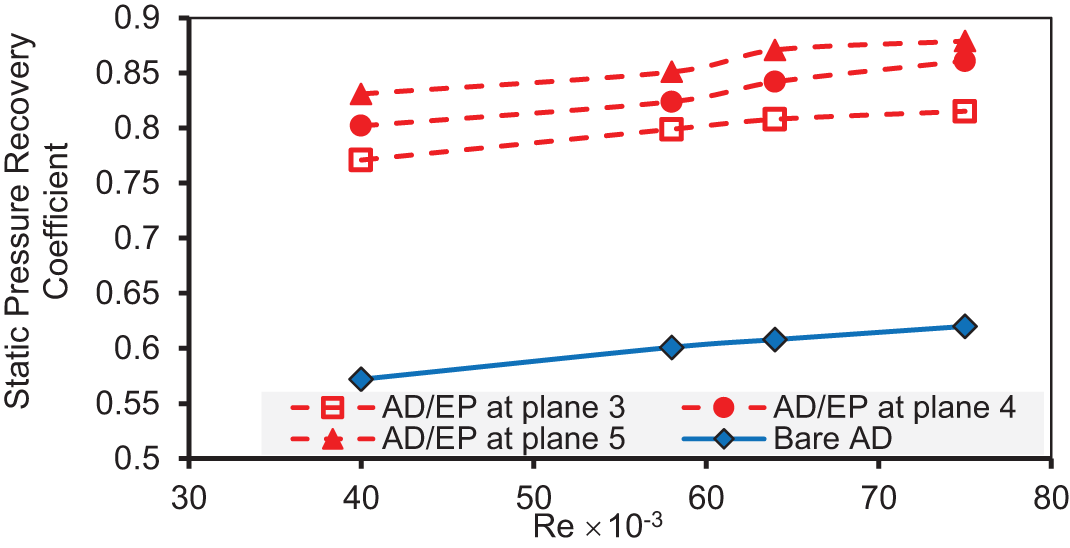
Figure 13: Variation of CPR of AD/EP with EPs type 2 over the range of Re
The cases investigated with EPs type 3 give lower CPR percentage enhancement than the other cases of EPs type 1 and 2, as shown in Fig. 14. This lower percentage is due to the lesser ability of this type of EP to reduce the kinetic energy of the main flow, especially at the diffuser core, thereby increasing the flow distortion at the outlet plane.
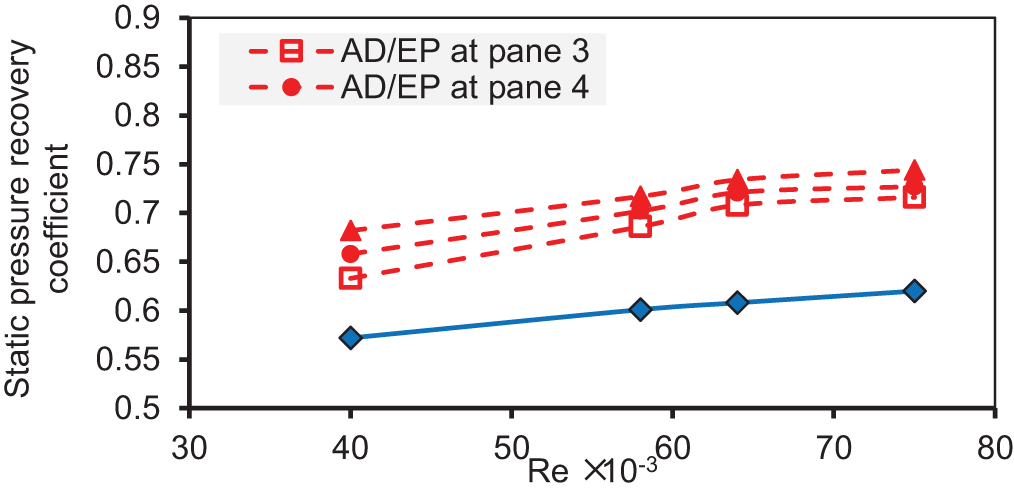
Figure 14: Variation of CPR of AD/EP with EPs type 3 over the range of Re
The maximum CPR enhancement has been achieved by employing the three types of EPs at installation planes 5 compared to installation planes 3 and 4. The significant value of CPR enhancement resulted from employing EPs type 2 at plane 5 as compared with all the other investigated cases.
4.2.2 Total Pressure Loss Coefficient
Fig. 15a, b, and c explains the influence of EPs type 1, 2, and 3 on the CTL. The increase in Re resulted in a CTL reduction at the three installation planes with different reduction values. The maximum CTL reduction of 27% was with EPs type 1 at plane 5 compared to the CTL of the bare AD. The CTL reduction was 36%, 42%, and 47% at Re = 40,000 with applying the EPs type 2 at planes 3, 4, and 5, respectively. As in the previously investigated cases, using EPs type 3 reduces the CTL, as shown in Fig. 14. However, the reduction is less than that of the two other types of EPs investigated. It can be noticed that the use of any of the three types of EPs on the top and bottom surfaces of AD/EP enhanced the performance of the diffuser by CTL reduction. The effect of the second type of EP was the best among the other types.
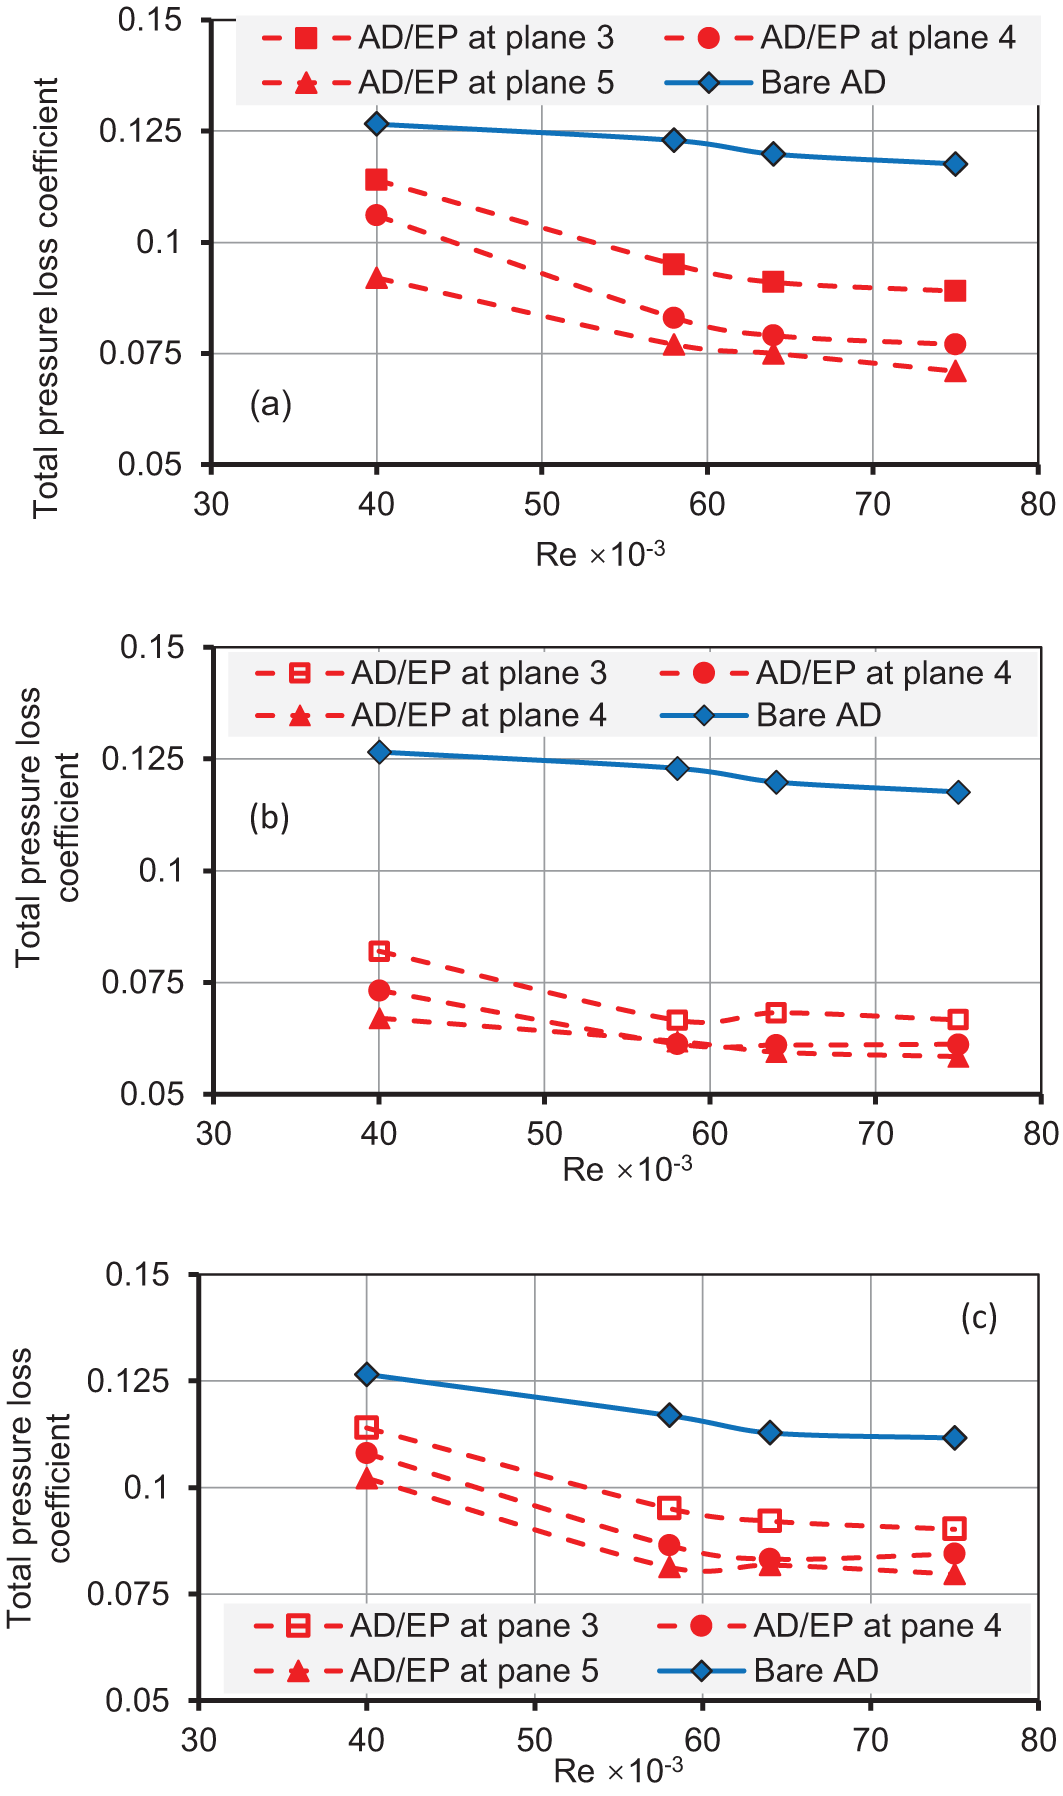
Figure 15: Variation of CTL of AD/EP, (a) with EPs type 1, (b) with EPs type 2, (c) with EPs type 3 over the tested range of Re
Generally, the EPs draw the high-momentum of airflow from the free stream and mix with the low momentum airflow near the bottom surface, thereby suppressing flow separation and decreasing the kinetic energy in the main flow. Therefore, the CTL reduction resulting from using EPs is higher than the CTL reduction resulting from increases in Re number for all cases.
4.2.3 Distortion Coefficient, DC(45°)
Fig. 16A, 16C and E shows the contours of total pressure at the outlet plane of AD/EP with EPs type 1, 2 and 3, respectively, at planes 3, 4 and 5 at Re = 40,000. While the Fig. 16B,D and F show the contours of total pressure at the outlet plane of AD/EP with EPs type 1, at planes 3, 4 and 5, respectively with inlet flow of Re = 75,000. Fig. 16 demonstrates that significant enhancement was achieved over and above these results when instuling the EPs at plane 5 for both investigated Re. The flow with EPs at plane 5 is more uniform and has a large area of average total pressure and less variation between the maximum and minimum values. This process resulted in a DC(45°) reduction at the outlet plane of the diffuser of about 43% with EPs at plane 5 at Re = 40,000.
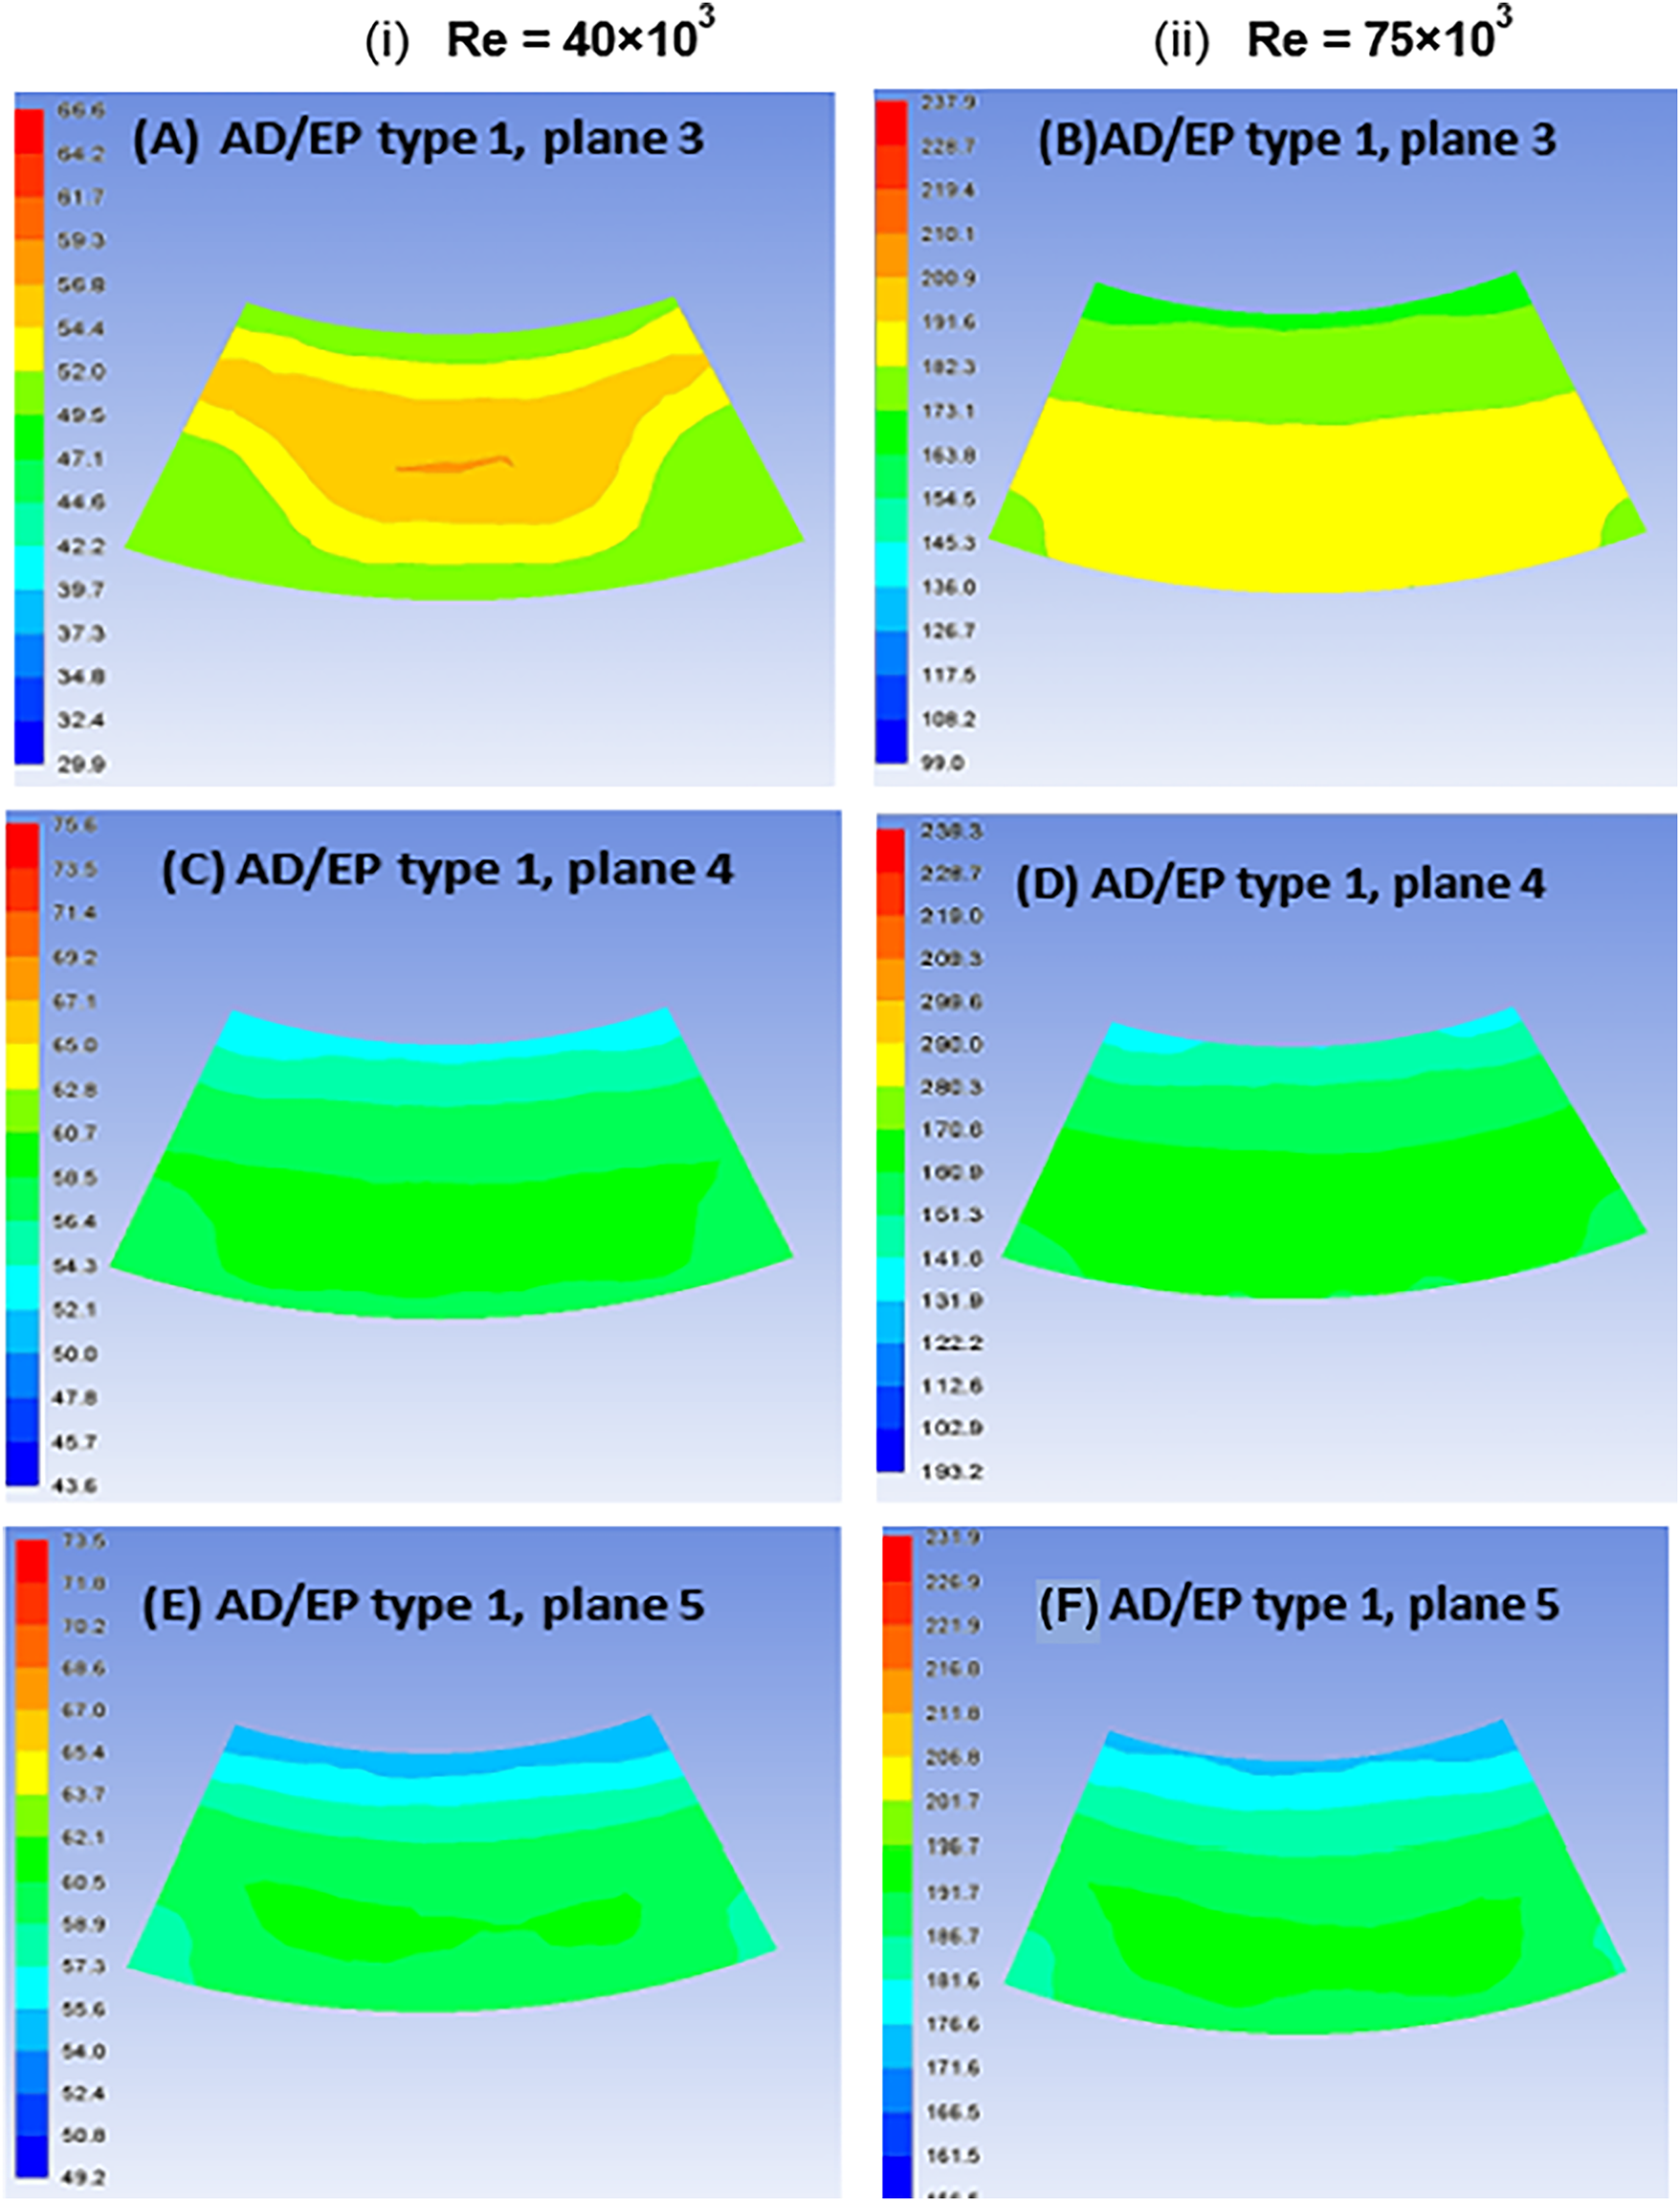
Figure 16: Total pressure contours (Pascal) at the outlet plane of AD/EP at (i) Re = 40,000 and (ii) Re = 75,000 with EPs type 1 at planes 3, 4, and 5
The contours in Fig. 17A,C, and E show that the total pressure ranged from 49 to 60 Pa and 51 to 60 Pa with EPs at planes 3 and 4, while it was 54 to 59 Pa when the EPs were installed at plane 5. Also, similar behavior was observed with Re = 75,000, as could be visualized in Fig. 17B,Dand F. All investigated EPs reduced the total pressure DC(45°). However, the maximum reduction resulting from EPs at plane 5 was about 50% compared to AD, which has a more uniform flow and a higher area of average total pressure, i.e., less variation between the maximum and minimum value of total pressure.
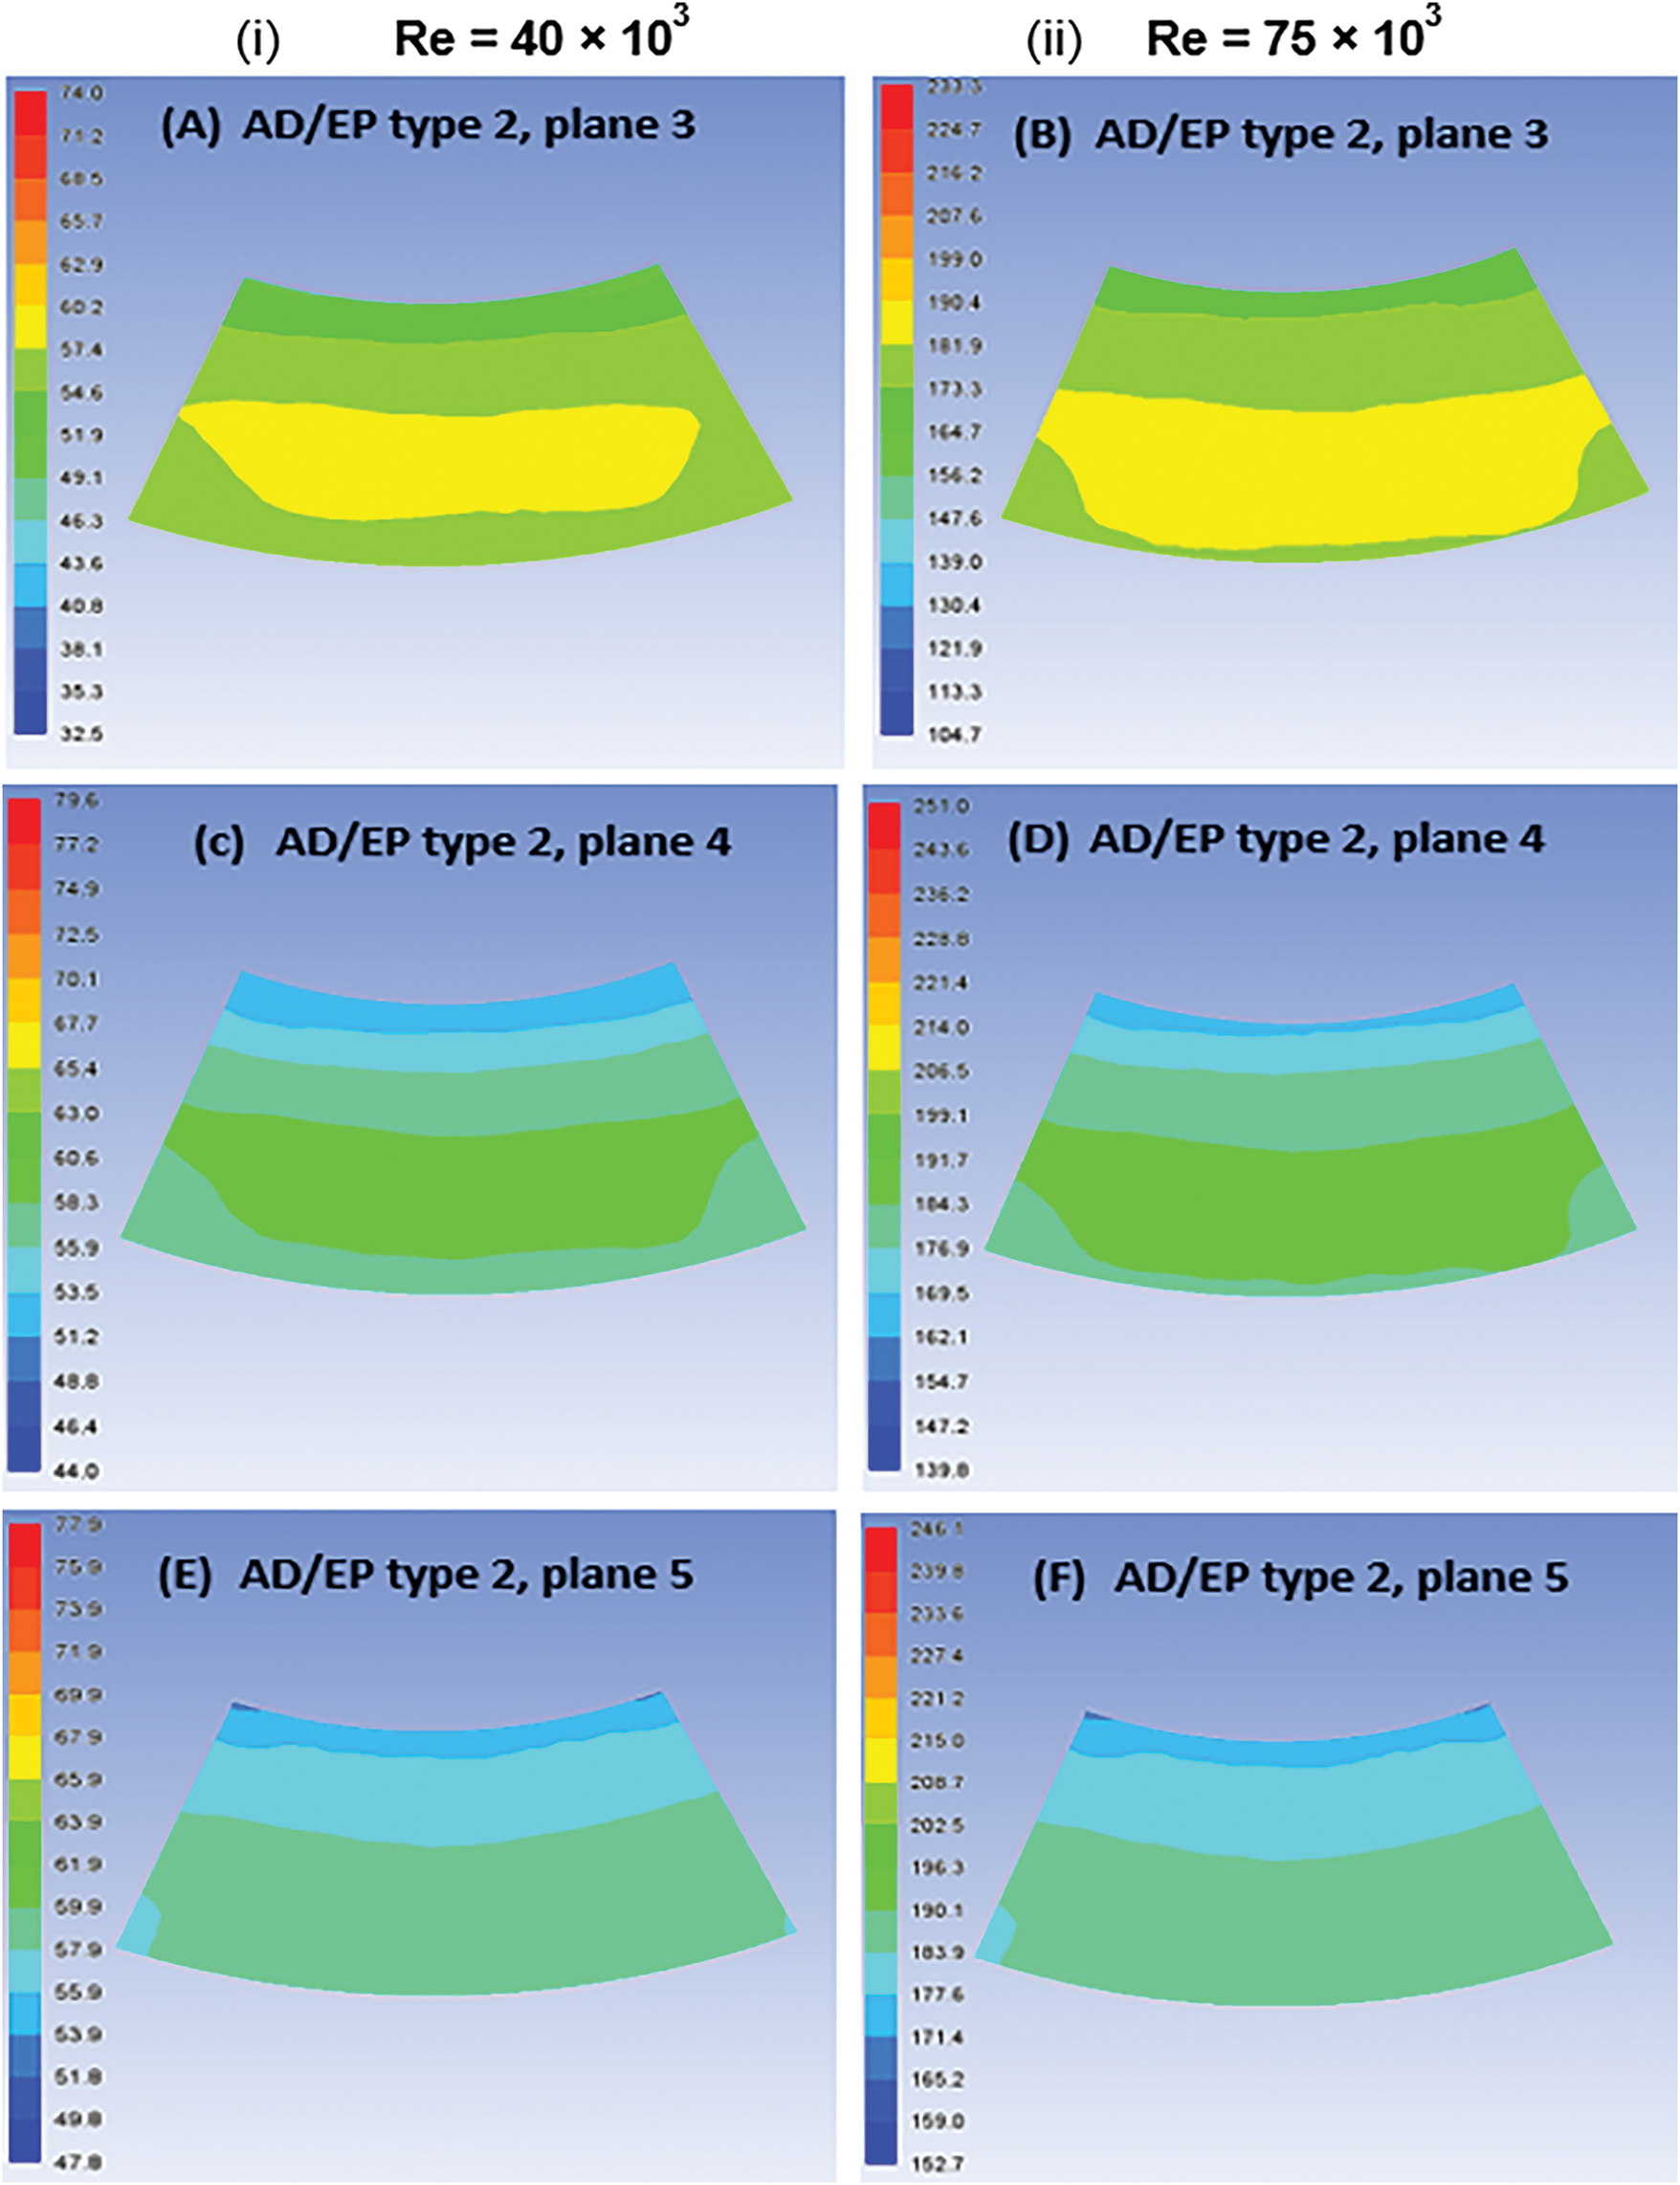
Figure 17: Total pressure contours (Pascal) at the outlet plane of AD/EP at (i) Re = 40,000 and (ii) Re = 75,000 with EPs type 2 at planes 3, 4, and 5
Employing EPs at planes 3, 4, and 5 reduces the DC(45°) of Re = 40,000 by 11%, 19% and 24%, respectively. While with Re = 75,000, DC(45°) reduced by 26%, 40% and 38%, respectively. The reduction of DC(45°) resulting from using EPs type 2 is less compared to types 1 and 3 due to the large variation between the maximum and minimum values of total pressure resulting from the large value of total pressure at the core of the outlet plane and small value on the other sides, as shown in Fig. 18.
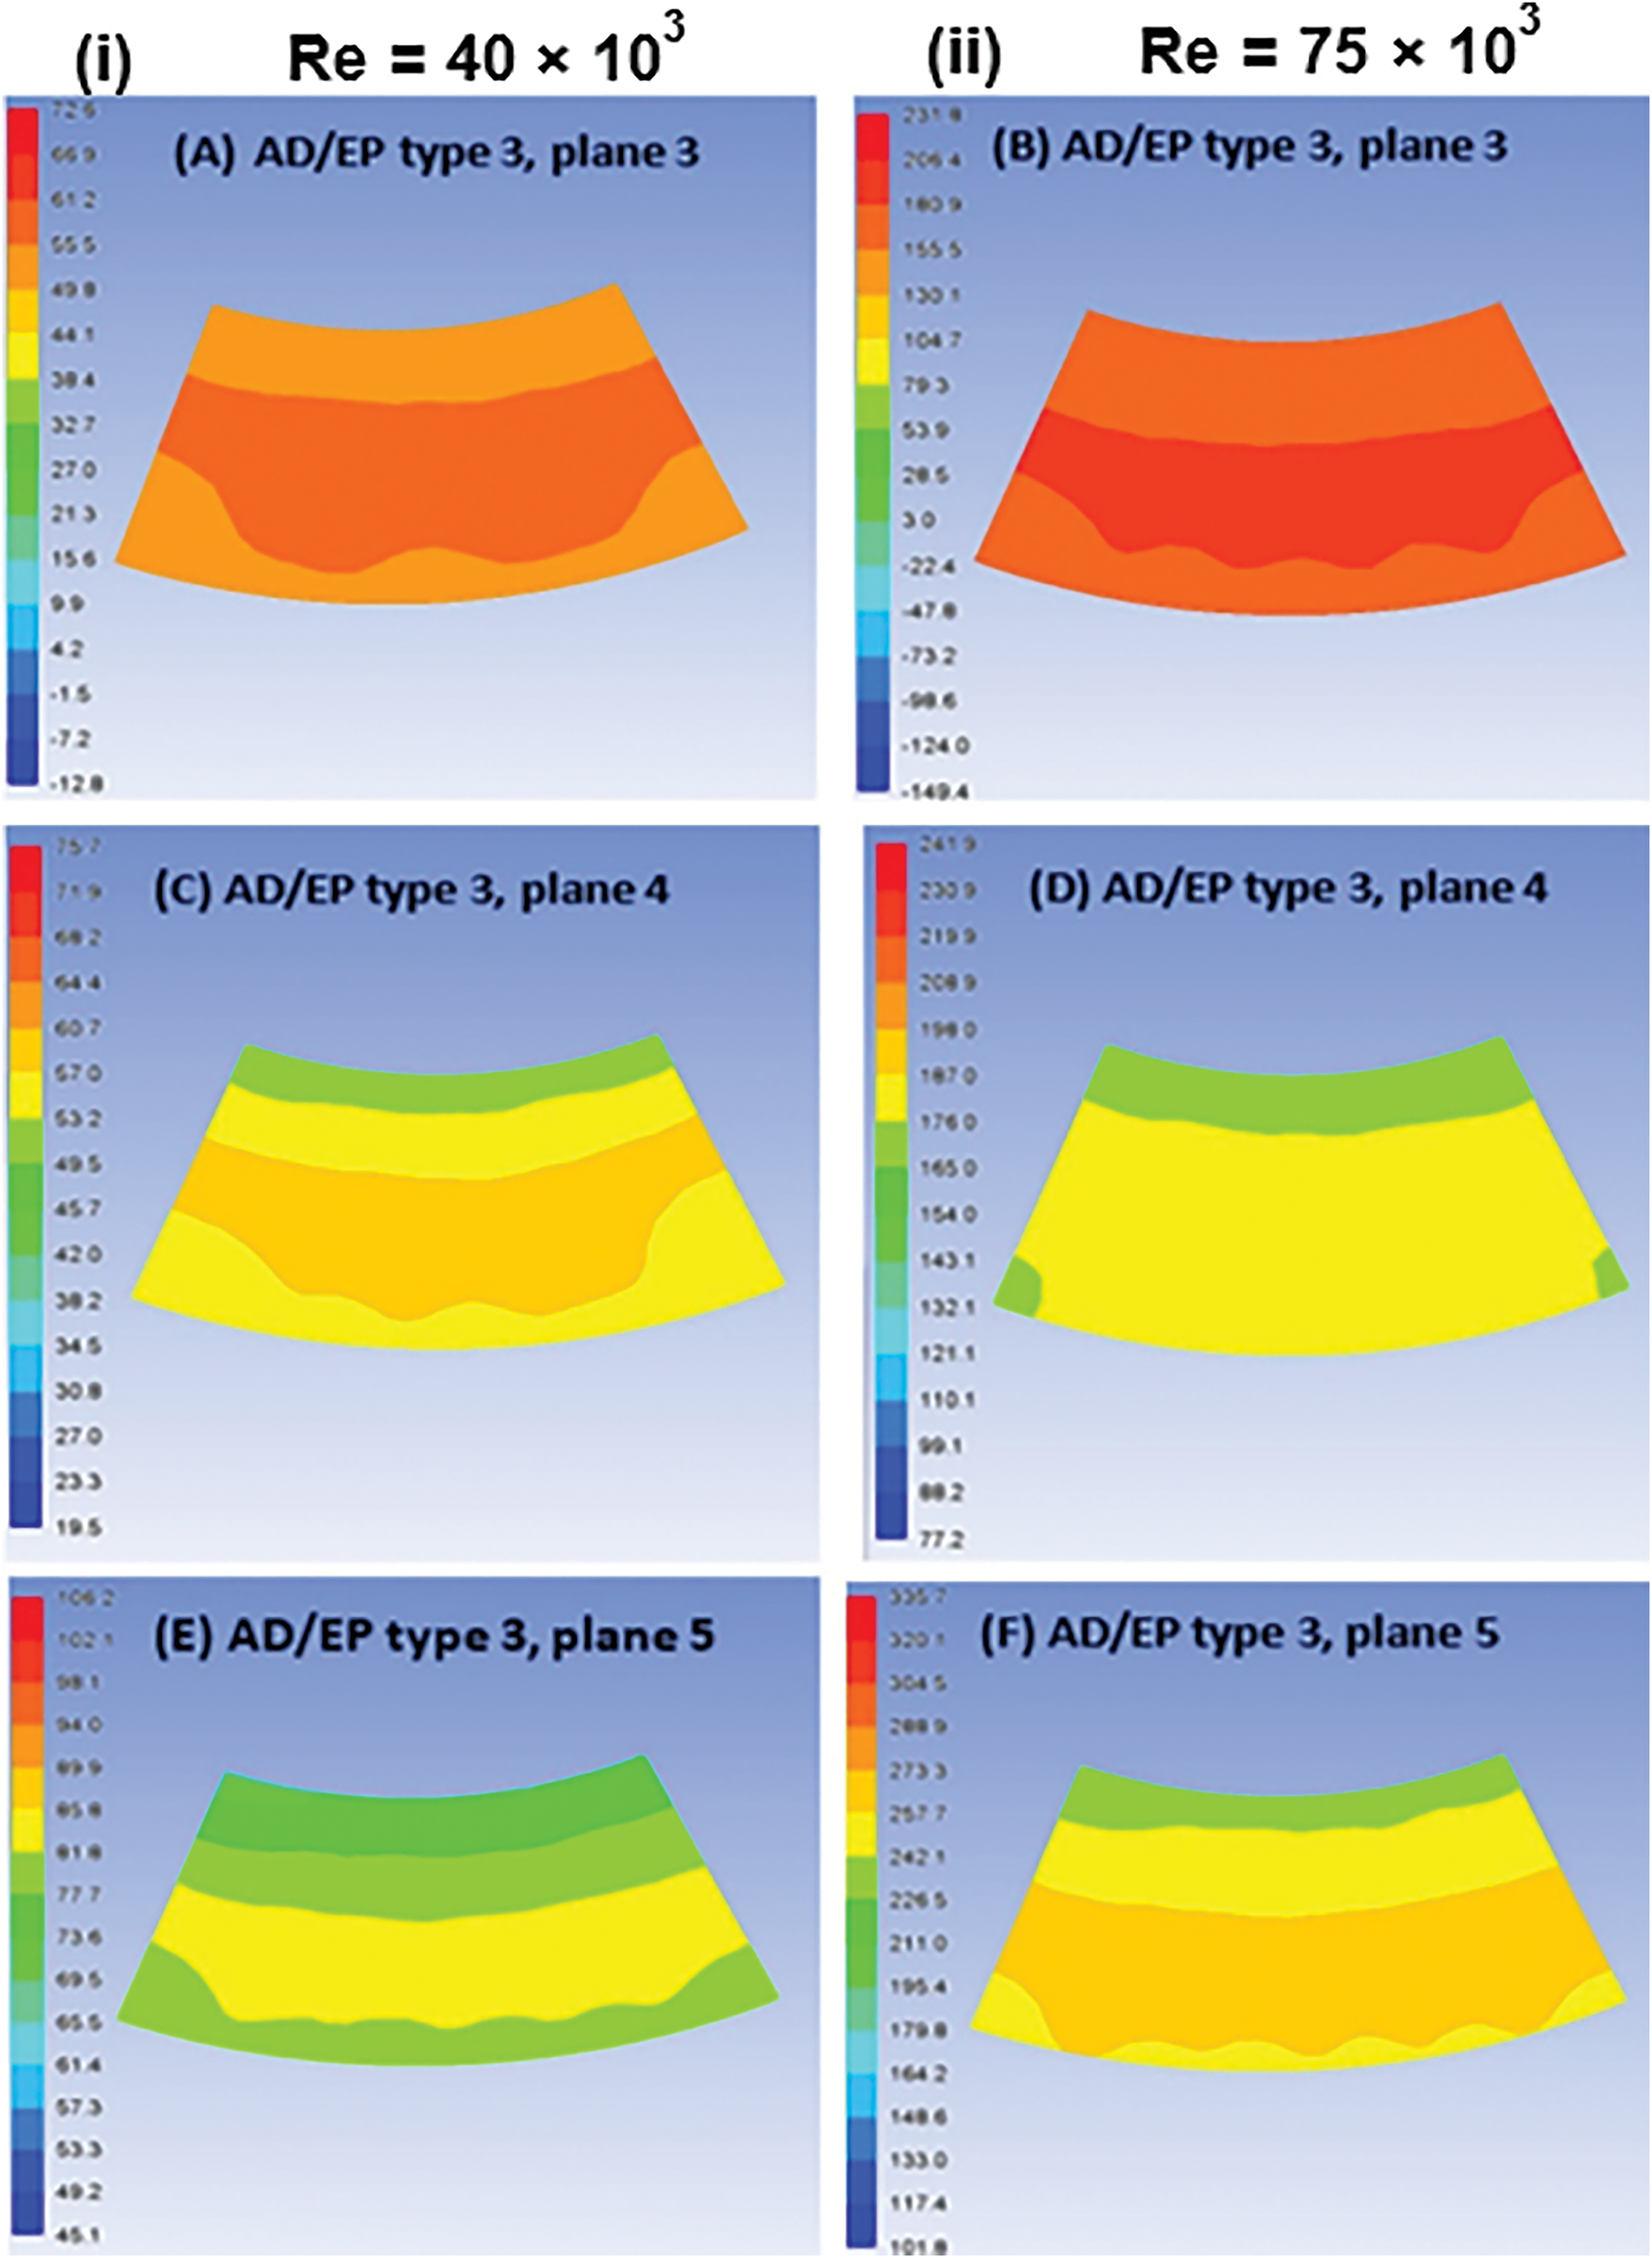
Figure 18: Total pressure contours (Pascal) at the outlet plane of AD/EP at Re = 40,000 and Re = 75,000 with EPs type 3 at planes 3, 4, and 5
Generally speaking, it has been realized that the energy promoters are influencing the flow in two different ways, first, is by directing the secondary flows or reversal flow to the streamwise direction, and second, is to transport the high momentum flow into low momentum boundary layer flow in order to reduce or eliminate boundary layer separation.
There are two methods for the installation of the energy promotors. First is in the manufacturing time, and second is aftermarket installation. In both cases, they are fitted to the internal surface of the diffuser by welding. The production of the energy promotors could be performed by CNC manufacturing or by 3D printing.
The flow fields in a bare S-shaped diffuser, bare S-shaped aggressive diffuser, and aggressive S-shaped diffuser with fitted energy promoters are simulated and evaluated using the CFD approach. Three different types of Eps, three different installation locations, and four operational Reynolds numbers ranging from 40,000 to 75,000 have been considered in computational investigation. The average deviations of CPR between the experimental and CFD results for bare diffusers and bare aggressive diffusers are 5.7% and 5.9%, respectively. The CFD results, together with the experimental measurement results, indicate that employing EPs type 2, i.e., co-rotating streamline sheets, installed at plane 5, achieves the maximum enhancement of the aggressive S-shaped diffuser along with the tested range of Re compared with the other proposed EPs. The pressure recovery enhancements are 19.5%, 22.2%, and 24.5% with EPs at planes 3, 4, and 5, respectively, compared to the aggressive S-shaped diffuser. Installation of EPs at planes 3, 4, and 5 reduces the DC(45°) when Re = 40,000 by 11%, 19%, and 24%, respectively, while with Re = 75,000, DC(45°) is reduced by 26%, 40% and 38%, respectively. Generally, the installation of energy promotors at plane 5 is the most effective location to reduce the reversal and flow separation in the aggressive S-shaped diffuser.
Acknowledgement: The authors acknowledge Universiti Teknologi PETRONAS for technical support in conducting the work in the Advanced Fluid Dynamic Research Lab.
Funding Statement: The authors received no specific funding for this study.
Author Contributions: The authors confirm their contribution to the paper as follows: study conception and design: Hussain H. Al-Kayiem, Raed A. Jessam; data collection: Raed A. Jessam; analysis and interpretation of results: Hussain H. Al-Kayiem, Raed A. Jessam, Sinan S. Hamdi, Ali M. Tukkee. Draft manuscript preparation: Raed A. Jessam, Sinan S. Hamdi; and final revision and proofreading: Hussain H. Al-Kayiem, Ali M. Tukkee. All authors reviewed the results and approved the final version of the manuscript.
Availability of Data and Materials: The authors confirm that the data supporting the findings of this study are copyright of Universiti Teknologi PETRONAS and could be requested as part of the PhD thesis titled Experimental and Numerical Investigation on the Performance of S-Shaped Diffusers Using Energy Promoters. https://utpedia.utp.edu.my/id/eprint/19962/ (accessed on 26 January 2025).
Ethics Approval: Not applicable.
Conflicts of Interest: The authors declare no conflicts of interest to report regarding the present study.
Nomenclature Symbols
| CPR | Static pressure recovery coefficient |
| CTL | Total pressure loss coefficient |
| DC(45°) | Distortion coefficient with 45° |
| h | Height of energy promoter (mm) |
| k | Turbulent kinetic energy (m2/s2) |
| l | Length of energy promoter (mm) |
| li | Inlet area conduit length (mm) |
| lo | Outlet area conduit length (mm) |
| Ltotal | S-shaped diffuser model total length (mm) |
| Dh | Inlet hydraulic diameter of S-shaped diffuser (mm) |
| p | Pressure (N/m2) |
| R | S-shaped diffuser centerline turning radius (mm) |
| TI | Turbulence intensity (%) |
| Uavi | Average inlet velocity (m/s) |
| Uavo | Average outlet velocity (m/s) |
| Abbreviations | |
| AD/EP | S-Shaped Aggressive Diffuser with Energy Promoter |
| AIP | Aerodynamic Inlet Plane |
| AR | Area ratio |
| Bare D | Bare S-Shaped Diffuser |
| Bare AD | Bare S-Shaped Aggressive Diffuser |
| CFD | Computational Fluid Dynamics |
| CNC | Computer Numerical Control |
| LPVG | Low Profile Vortex Generator |
| RANS | Reynolds Averaged Navier-Stokes |
| Re | Reynolds number |
| SA | Spalart–Allmaras turbulence model |
| SST | Shear Stress Transport turbulence model |
| URANS | Unsteady Reynolds Averaged Navier-Stokes |
| VG | Vortex generator |
| Subscripts | |
| d | Dynamic |
| i | Inlet |
| o | Outlet |
| s | Static |
| t | Total |
| w | Wall |
| Greek Letters | |
| θb | S-shaped diffuser turning angle (deg) |
| ρ | Density of air (kg/m3) |
| ε | Turbulence kinetic energy dissipation rate (m2/s3) |
| μ | Viscosity of air (kg/m.s) |
| τw | Wall shear stress (kg/m.s2) |
References
1. Anderson BH, Huang PS, Paschal WA, Cavatorta E. Study on Vortex flow control of inlet distortion. J Propuls Power. 1992;8(6):1266–72. doi:10.2514/3.11472. [Google Scholar] [CrossRef]
2. Al-Kayiem HH, Hon TF. CFD simulation of the intermediate passage of gas turbine with energy promoters. J Appl Sci. 2012;12(24):2511–8. doi:10.3923/jas.2012.2511.2518. [Google Scholar] [CrossRef]
3. Jessam RA, Al-Kayiem HH, Nasif MS. Experimental and numerical analysis of different flow modifier on the reversal flow region in s-shaped aggressive diffuser. In: AIP Conference Proceedings; 2018; Kuala Lumpur, Malaysia. doi:10.1063/1.5075598. [Google Scholar] [CrossRef]
4. Liu J, Liu H, Liu G, Du Q, Wang P, Chang S. Investigation on the flow-control strategy for an aggressive turbine transition ducts. Proc Inst Mech Eng Part G J Aerosp Eng. 2021;235(5):589–99. doi:10.1177/0954410020950848. [Google Scholar] [CrossRef]
5. Hickling T, Ingram G. Reynolds-averaged Navier-Stokes modelling in transonic S-ducts with passive flow control. Proc Inst Mech Eng Part A J Power Energy. 2020;234(1):31–45. doi:10.1177/0957650919845765. [Google Scholar] [CrossRef]
6. Aref P, Ghoreyshi M, Jirasek A, Satchell MJ. CFD Validation and Flow Control of RAE-M2129 S-duct diffuser using CREATETM-AV Kestrel simulation tools. Aerospace. 2018;5(1):31. doi:10.3390/aerospace5010031. [Google Scholar] [CrossRef]
7. Liu Y, Zhang X, Yu Y, Yan B, Cai C, Wu B. Numerical simulation of S-shaped inlet under the intake total pressure distortion. MATEC Web Conf. 2022;355(4):01017. doi:10.1051/matecconf/202235501017. [Google Scholar] [CrossRef]
8. Wang C, Lu H, Kong X, Wang S, Guo S. Experimental and numerical investigation of an S-shaped duct using pulsed jet actuators with multiple angles. Therm Sci Eng Prog. 2023;46(5):102133. doi:10.1016/j.tsep.2023.102133. [Google Scholar] [CrossRef]
9. Li Z, Lu Y, Pan T, Zhang Y. Numerical investigation on the effect of height-to-radius ratio on flow separation features in S-shaped diffuser with boundary layer ingestion. Aerospace. 2023;10(6):551. doi:10.3390/aerospace10060551. [Google Scholar] [CrossRef]
10. Rezek TJ, Camacho RGR, Manzanares-Filho N. A novel methodology for the design of diffuser-augmented hydrokinetic rotors. Renew Energy. 2023;210(4):524–39. doi:10.1016/j.renene.2023.04.070. [Google Scholar] [CrossRef]
11. Burrows TJ, Vukasinovic B, Lakebrink MT, Mani M, Glezer A. Control of flow distortion in offset diffusers using trapped vorticity. Int J Heat Fluid Flow. 2019;75(3):122–34. doi:10.1016/j.ijheatfluidflow.2018.11.003. [Google Scholar] [CrossRef]
12. Chang PK. Control of flow separation: Energy conservation, operational efficiency and safety. New York: Hemisphere Publishing Corp; 1976. [Google Scholar]
13. Gad-el-Hak M, Bushnell DM. Separation control: review. J Fluids Eng. 1991;113(1):5–30. doi:10.1115/1.2926497. [Google Scholar] [CrossRef]
14. Lin JC. Review of research on low-profile Vortex generators to control boundary-layer separation. Prog Aerosp Sci. 2002;38(4–5):389–420. doi:10.1016/S0376-0421(02)00010-6. [Google Scholar] [CrossRef]
15. Kim J, Moin P, Moser R. Turbulence statistics in fully developed channel flow at low Reynolds number. J Fluid Mech. 1987;177:133–66. doi:10.1017/s0022112087000892. [Google Scholar] [CrossRef]
16. Fiola C, Agarwal RK. Simulation of secondary and separated flow in diffusing S ducts. J Propuls Power. 2015;31(1):180–91. doi:10.2514/1.b35275. [Google Scholar] [CrossRef]
17. Jessam R, Al-Kayiem HH, Nasif MS, Abed Jaddoa Albuali A. Experimental and numerical assessment on S-shaped diffuser performance with different turbulence intensity. IOP Conf Ser: Mater Sci Eng. 2020;765(1):012046. doi:10.1088/1757-899x/765/1/012046. [Google Scholar] [CrossRef]
18. Ng BCN, Birk AM. Experimental and CFD study of a rectangular S-bend passage with and without pressure recovery effects. In: ASME Turbo Expo 2013: Turbine Technical Conference and Exposition; 2013; San Antonio, TX, USA. Vol. 68. doi:10.1115/gt2013-94917. [Google Scholar] [CrossRef]
19. Kumar Gopaliya M, Kumar M, Kumar S, Manjaree Gopaliya S. Analysis of performance characteristics of S-shaped diffuser with offset. Aerosp Sci Technol. 2007;11(2–3):130–5. doi:10.1016/j.ast.2006.11.003. [Google Scholar] [CrossRef]
20. Jirásek A. Design of Vortex generator flow control in inlets. J Aircr. 2006;43(6):1886–92. doi:10.2514/1.21364. [Google Scholar] [CrossRef]
21. Lee GG, Allan WDE, Goni Boulama K. Flow and performance characteristics of an Allison 250 gas turbine S-shaped diffuser: effects of geometry variations. Int J Heat Fluid Flow. 2013;42:151–63. doi:10.1016/j.ijheatfluidflow.2013.02.004. [Google Scholar] [CrossRef]
Cite This Article
 Copyright © 2025 The Author(s). Published by Tech Science Press.
This work is licensed under a Creative Commons Attribution 4.0 International License , which permits unrestricted use, distribution, and reproduction in any medium, provided the original work is properly cited.
 Downloads
 Citation Tools