 Open Access
ARTICLE
Analysis of Hydraulic Fracture Network Morphology in Stimulated Coal Reservoirs with Pre-Existing Natural Fractures
1 National Engineering Laboratory for Exploration and Development of Low-Permeability Oil and Gas Fields, CNPC Chuanqing Drilling Engineering Company Limited, Xi’an, 710018, China
2 Changqing Downhole Technology Company, CNPC Chuanqing Drilling Engineering Company Limited, Xi’an, 710018, China
3 School of Petroleum Engineering, Yangtze University, Wuhan, 430100, China
* Corresponding Authors: Luoyi Huang. Email: ; Jinghua Liu. Email:
(This article belongs to the Special Issue: Integrated Geology-Engineering Simulation and Optimizationfor Unconventional Oil and Gas Reservoirs)
Energy Engineering 2025, 122(4), 1491-1509. https://doi.org/10.32604/ee.2025.061171
Received 18 November 2024; Accepted 06 February 2025; Issue published 31 March 2025
Abstract
Hydraulic fracturing is a crucial technique for efficient development of coal reservoirs. Coal rocks typically contain a high density of natural fractures, which serve as conduits for fracturing fluid. Upon injection, the fluid infiltrates these natural fractures and leaks out, resulting in complex fracture morphology. The prediction of hydraulic fracture network propagation for coal reservoirs has important practical significance for evaluating hydraulic fracturing. This study proposes a novel inversion method for predicting fracture networks in coal reservoirs, explicitly considering the distribution of natural fractures. The method incorporates three distinct natural fracture opening modes and employs a fractal probability function to constrain fracture propagation morphology. Based on this method, the study compares hydraulic fracture network morphologies in coal reservoirs with and without the presence of natural fractures. The results show that while both reservoir types exhibit multi-branch fracture networks, reservoirs containing natural fractures demonstrate greater branching and a larger stimulated reservoir volume (SRV). Additionally, the study employs a fractal dimension calculation method to quantitatively describe the geometric distribution characteristics of fractures. The analysis reveals that the geometry and distribution of natural fractures, as well as reservoir geological parameters, significantly influence the fracture network morphology and fractal dimension. The contact angle between natural and hydraulic fractures affects propagation direction; specifically, when the contact angle is π/2, the fractal dimension of the hydraulic fracture network is maximized. Moreover, smaller lengths and spacings of natural fracture led to higher fractal dimensions, which can significantly increase the SRV. The proposed method offers an effective tool for evaluating the hydraulic fracturing of coal reservoirs.Keywords
The growing global demand for energy has positioned the development of unconventional reservoirs, including those from coal reservoirs with their typically poor physical properties and complex hydrocarbon distribution, as a critical strategy in coalbed methane exploration [1,2]. Hydraulic fracturing is very important for the economic exploitation of coalbed methane. Volume fracturing technology, which involves injecting large volumes of fluid into the reservoir to create a complex fracture network, enhances methane recovery by improving reservoir permeability. This involves the mechanical coupling of fluid and rock [3,4]. However, the reservoir structure after fracturing is difficult to monitor. Accurate characterization of fracture morphology after fracturing is crucial for guiding real-time fracturing evaluation and optimization [4–8].
Accurate depiction of fracture morphology is essential for simulating volume fracturing in coal reservoirs. These reservoirs are typically characterized by a multitude of natural fractures with complex distributions, as well as significant heterogeneity and intricate stress distributions, which complicate the description of hydraulic fracture networks. Laboratory experiments, which are among the earliest methods for studying the fracture morphology, can effectively restore the true state of the reservoir. Most coal reservoir physical experiments focus on investigating the intersection mechanisms between hydraulic fractures and natural fractures [9–11]. Cleat systems are developed in coal reservoirs, which play a vital role in the formation of multi-branch fractures. However, the mechanical properties of coal reservoirs are complex, and the intersection criterion of hydraulic fractures and cleat systems is not clear. In addition, the physical experiment is limited by the instrument, resulting in small-scale simulations that cannot guide the development of coalbed methane. With the development of numerical simulation methods, the fracture propagation simulation method is established by combining fracture propagation with numerical simulation [12]. Qian et al. [13] used microseismical monitoring technology combined with particle swarm optimization algorithm to evaluate the influence range of hydraulic fractures on coal seams. Liu et al. [14] proposed a cohesive phase field model to simulate the dynamic fracture process driven by fluid in coal rock. In these methods, the complex mechanical mechanism of coal seam is not considered, and the shape of hydraulic fracture is relatively simple.
The fractal theory has been proven to be an effective method to describe the complexity of fractures [15]. Huang et al. [15] used fractal geometry to characterize the fracture morphology characteristics in the reservoirs, and proposed a fractal fracture network algorithm that accounts for the randomness of fractures. Zhang et al. [16] applied microseismic data constraints and the fractal characteristics of fractures to invert the hydraulic fracture network morphology, and proposed a fractal fracture network model. Fu et al. [17] analyzed the development degree of coal seam fractures using the surface density fractal dimension. However, these methods fail to account for the mechanical behavior of coal rock, nor do they adequately describe the complex fracture networks that emerge when hydraulic fractures intersect with the cleat system in coal rock.
Currently, no existing methods for predicting fracture networks can accurately describe the multi-branch structures formed by hydraulic fracturing in coal reservoirs. This paper introduces a novel simulation method to predict the fracture propagation in coal reservoirs. Considering both the distribution of natural fractures and the inherent stochasticity of fracture network development. To capture this variability, a fractal index is employed. The method incorporates three natural fracture opening modes and applies a fractal probability function to control fracture propagation patterns. Furthermore, it calculates the fractal dimension to quantitatively evaluate the complexity of the hydraulic fracture network.
2 Inversion of Hydraulic Fracture Network Morphology
2.1 Natural Fracture Extension and Mechanical Analysis
Natural fractures (NFs) are commonly found in coal reservoirs. When hydraulic fractures (HFs) intersect with these natural fractures, the fluid pressure from the fractures can extend into the NFs. This pressure can result in the opening of the NFs or cause them to experience shear failure, leading to their connection with the HFs and the development of additional fractures. As NFs connect with HFs, the fluid pressure is transferred, enabling the NFs to further propagate and form a complex multi-branch fracture network.
The opening of NFs relies on the energy provided by HFs. Various scholars have developed different criteria for fracture propagation by integrating experimental data with mathematical models. When NFs intersect with HFs, three possible scenarios can occur, each corresponding to a different propagation mode [18–21]. (a) After HFs connect with NFs, fluid pressure causes the entire surface of the NF to open. However, the HF does not penetrate the NF and instead continues to extend along both sides of it (Fig. 1, Mode One); (b) In the second scenario, part of the fluid enters the NF, partially opening its surface, while the HF penetrates through and continues to propagate (Fig. 1, Mode Two); (c) In the third scenario, fluid fully opens the NF surface, and the HF also penetrates it, continuing to extend through all open fractures (Fig. 1, Mode Three).
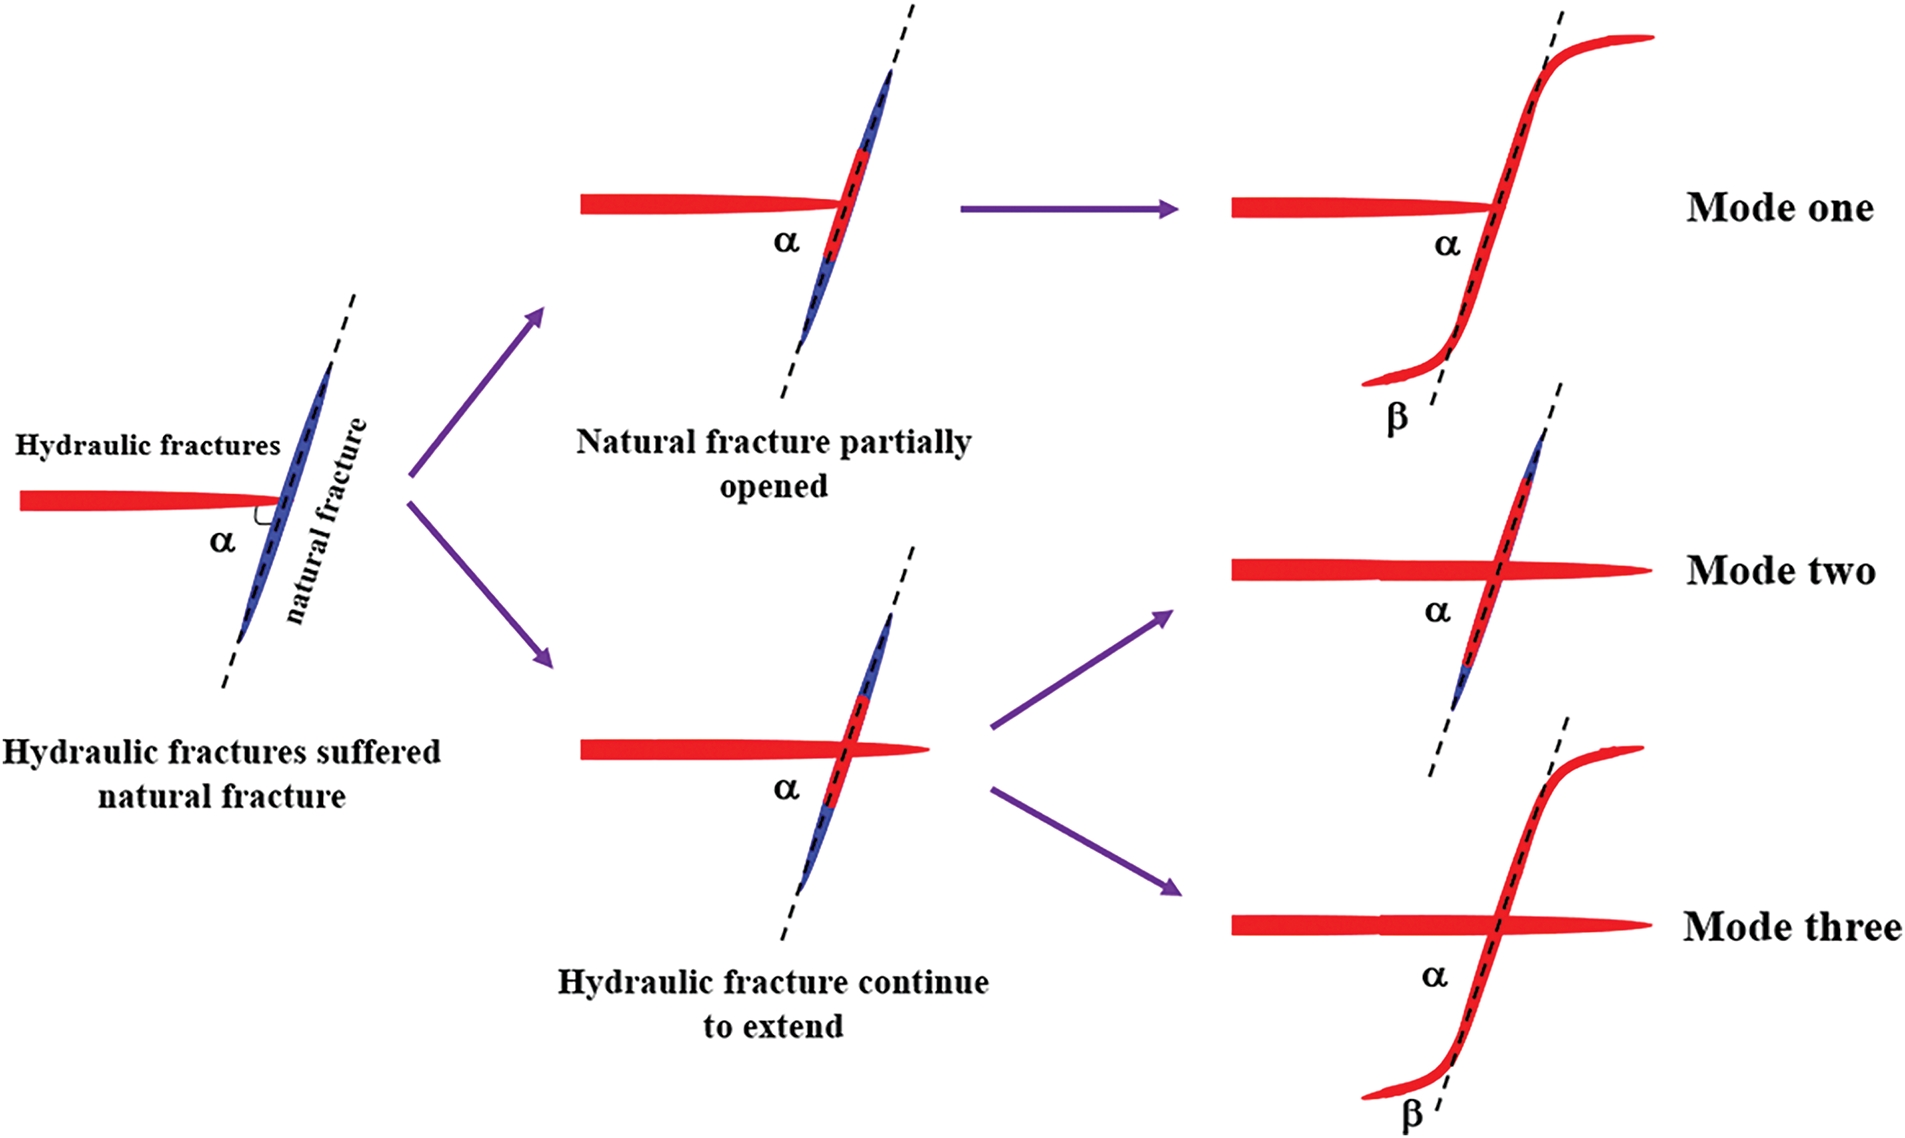
Figure 1: Three extension modes of HFs after encountering NFs
In Mode One, HFs interconnect with NFs, where the fluid pressure induces shear failure in the NFs. When HFs do not penetrate the NFs, the fractures ultimately propagate along the sides of the NFs. This behavior aligns with the mechanical expression presented in Eq. (1).
where, σn is normal stress for fracture surface, MPa. σt is axial stress on fracture surface, MPa. pi is fluid pressure, MPa. Δpi is pressure drop at the intersection with the tip of HF, MPa. Ti is tensile strength of rock at intersection, MPa.
In linear elastic fracture mechanics, the normal stress and axial stress on the fracture are expressed as follows:
After HFs encounter NFs, a fluid pressure drop occurs between the fractures, which can be described by the fluid pressure drop equation, as shown in Eq. (4) [19].
where, pi is the fluid pressure, MPa. kf is the permeability, mD. φf is the porosity, non-dimensional. Lf is length of the NF, m. Ct is the comprehensive compressibility, 1/MPa. ps is the initial reservoir pressure, MPa. μ is fluid viscosity, mPa·s.
Mode Two: When HF encounters NF, the substantial pressure differential triggers shear failure in the NF. However, the pressure of the NF exceeds the fracture pressure, leading to a partial opening. The elevated pressure within the HF causes tensile failure on the NF’s surface, which facilitates the penetration and further propagation of the HF. Blanton’s criterion [22] provides a description of the net pressure at this interface, as represented by Eq. (5).
where, pnet (i) is the the net pressure at the interface between HF and NF, MPa.
When the fracturing fluid enters the NF, the normal pressure on the fracture surface is
where, σ is the normal pressure on the fracture, MPa. σz is the in-situ stress in z direction of the fracture, MPa. χ, γ, ξ is the angle between the principal stress of fracture, [0, π/2].
The net pressure at the contact point of HF and NF is
where, p(i) is the fluid pressure at the contact point, MPa.
Mode Three: When HFs encounter NFs, the fractures can be extended along the NFs and can continue to extend through the NFs. At this time, the fluid pressure in HF is larger, and the rock near NF surface can be opened. At the same time, the fracturing fluid flowing into the NF causes the shear failure of NF. This model can be considered as a combination of Model one and Model two.
2.2 Inversion of Fracture Network Considering NFs
When the fluid enters the perforation channels, the high-pressure fluid opens these channels and continues to propagate into the reservoir, thereby creating new fractures. This model applies an improved version of the maximum circumferential tensile stress theory [23], where fracture propagation is no longer constrained to follow the direction of maximum circumferential tensile stress. Instead, there is a critical circumferential stress σcr for fracture initiation. When the circumferential tensile stress at the fracture tip exceeds this critical value in any given direction, the fracture may propagate in that direction.
Generally, hydraulic fracturing generates type I opening fracture, and the critical circumferential stress of fracture initiation σcr is expressed as
where, KIC is represent the fracture toughness at fracture tip, MPa·m0.5.
The circumferential tensile stress σθ is
where, K1, K2 is type I and type II fracture stress intensity factor, MPa·m0.5. r is the half length of the fracture, m.
The fracture initiation stress intensity is defined as the difference between circumferential stress and critical fracture initiation stress, namely
where, σfr is the fracture initiation stress intensity, MPa.
When there are HFs in the reservoir, the induced stress generated by the new fractures will change the stress distribution of the surrounding rock, which is called stress shadow effect. For a single fracture, the induced stress component satisfies the following mechanical conditions [24]:
where, σxx′, σyy′ and τxy′ is the induced stress, MPa. L is the distance from reservoir (i, j) to fracture center, m. L1 and L2 are the distance from (i, j) to the fracture tip and tail, respectively, m. θ, θ1, θ2 is the angle between (i, j) and the positive direction of the fracture.
Fracture propagation exhibits randomness and fractal properties, with the fractal index used to describe these characteristics. Not every geological unit that meets the fracture condition will generate a fracture, and only one fracture can form at each time step. The fracture probability follows the probability function Pe. The expression is
where, p is the rupture probability. N is the total number of geological units that may generate fracture. γ is the fractal index.
The direction of HF propagation follows a random distribution, based on a probability distribution (Eq. (12)), where the sum of probabilities around fracture tips equals 1. In fracture propagation simulation, a random number is generated to determine the propagation direction, with the fracture following the direction corresponding to the generated number, as shown in Fig. 2.

Figure 2: Probability of fracture points and selection of fracture points
In this paper, the reservoir is divided into several equal spacing geological units, each adjacent geological unit constitutes a connection, as shown in Fig. 3. Among them, the black point is the divided geological unit, the red point is the HF geological unit, the red line is the HF, and the blue line is the NF that is not penetrated by the HF.
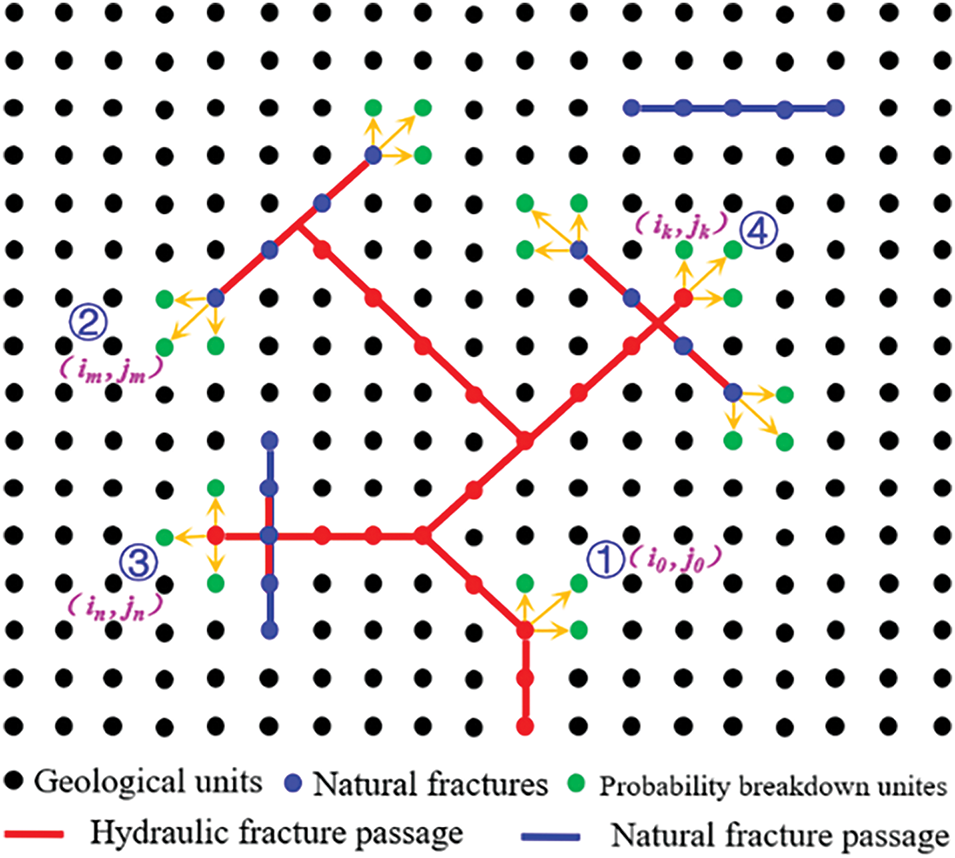
Figure 3: Fracture propagation path diagram
Hydraulic fractures initiate propagation from the initial perforation channel and determine the location of the subsequent fracture based on the HF extension criteria, as depicted in Fig. 3, point ①. Here, the green point signifies the geological unit that is likely to form a HF, while the yellow arrow indicates its direction of extension. Three distinct criteria for NF opening is employed to assess the interaction between fractures and NFs. In Fig. 3, point ② illustrates the scenario where NFs open and continue to propagate along the NF planes (Mode One). In Fig. 3, point ③, the process demonstrates partial opening of the NF with the fracture continuing to extend through it (Mode Two). Fig. 3, point ④, shows the process where fractures traverse NFs and propagate in multiple directions (Mode Three). The combined fractures continue to expand in accordance with the HF extension criteria.
2.3 Microseismic Constrained Method
In this work, we incorporate microseismic data points into the inversion of coal reservoir fractures. Using observed microseismic signals as constraints, we establish a fitting function to optimize fracture locations. The fitting rate between the microseismic data and fracture data serves as the objective value in the fitting function, ensuring that the derived fracture morphology closely matches the observed fracture distribution. The specific formulation is as follows:
where, E is the error metrics between microseismic points and fractures. χ and ψ are the weighting coefficients. m, n denote the number of fractures and microseismic points at stage i, respectively. Nf, i and Mf, i refer to the positions of fractures and microseismic data points at stage i.
The proposed methodology accounts for the stress shadow effect, the stochastic nature of fracture propagation, and three distinct modes of fracture propagation when natural fractures intersect with hydraulic fractures. The steps for fracture propagation are delineated in Fig. 4 and are as follows: (a) Division of geological units based on the reservoir extent; (b) Establishment of perforation parameters, encompassing perforation azimuth, spacing, and length; (c) Specification of initial in-situ stress data, rock mechanics properties, and NF characteristics; (d) Adjustment of the flow pressure within the geological unit; (e) Application of pertinent propagation criteria to assess the progression of HF or NF, and in the case of NFs, to ascertain their opening mode; (f) Utilization of a fractal probability function to calculate the likelihood of potential fractures and to select the subsequent geological unit for expansion; (g) Constraint of fracture direction using microseismic data; (h) Modification of the stress field within the geological unit in light of the new fracture configuration; (i) Iteration of steps (d) to (h) until no further fracture propagation is possible, at which point the calculations are concluded and the fracture morphology is outputted.
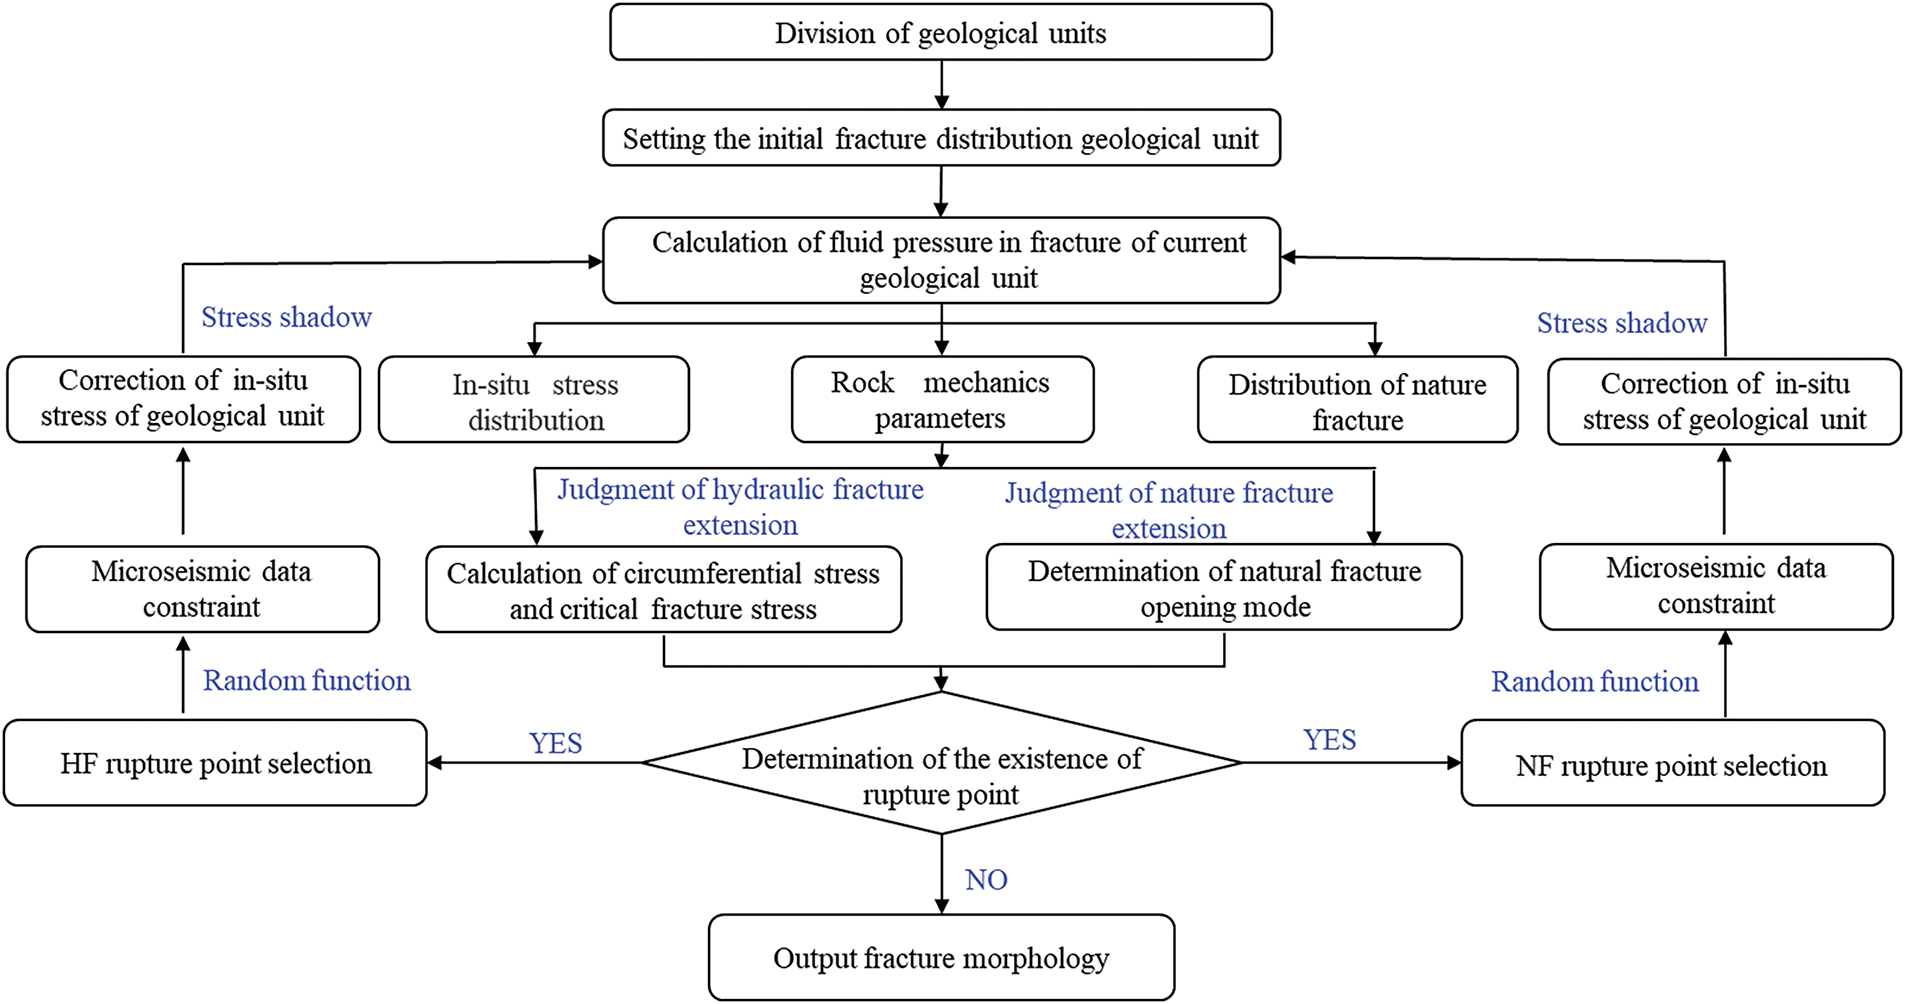
Figure 4: The process of fractal fracture network propagation
3 Evaluation of Hydraulic Fracture Network
In this work, we define a 100 × 400 m2 model. NFs are randomly distributed within the reservoir. The horizontal principal stress difference is 10 MPa, and the fracture’s fractal index is 1.5. The fluid injection rate is set at 5 m3/min, lasting for a total of 50 min. Fig. 5 illustrates the fracture morphology at different injection times. During the fracturing process, the fracture extended approximately 270 m. In the early phase, the HF connected a significant number of NFs, resulting in the formation of multiple fracture branches. As fluid injection continued, the fracture grew predominantly in the direction of the maximum principal stress, with the growth rate gradually decreasing. This is due to the increased fluid friction, which causes insufficient pressure transmission at the fracture tip, making it difficult to sustain further fracture propagation. This observation is consistent with the practical understanding of hydraulic fracturing.
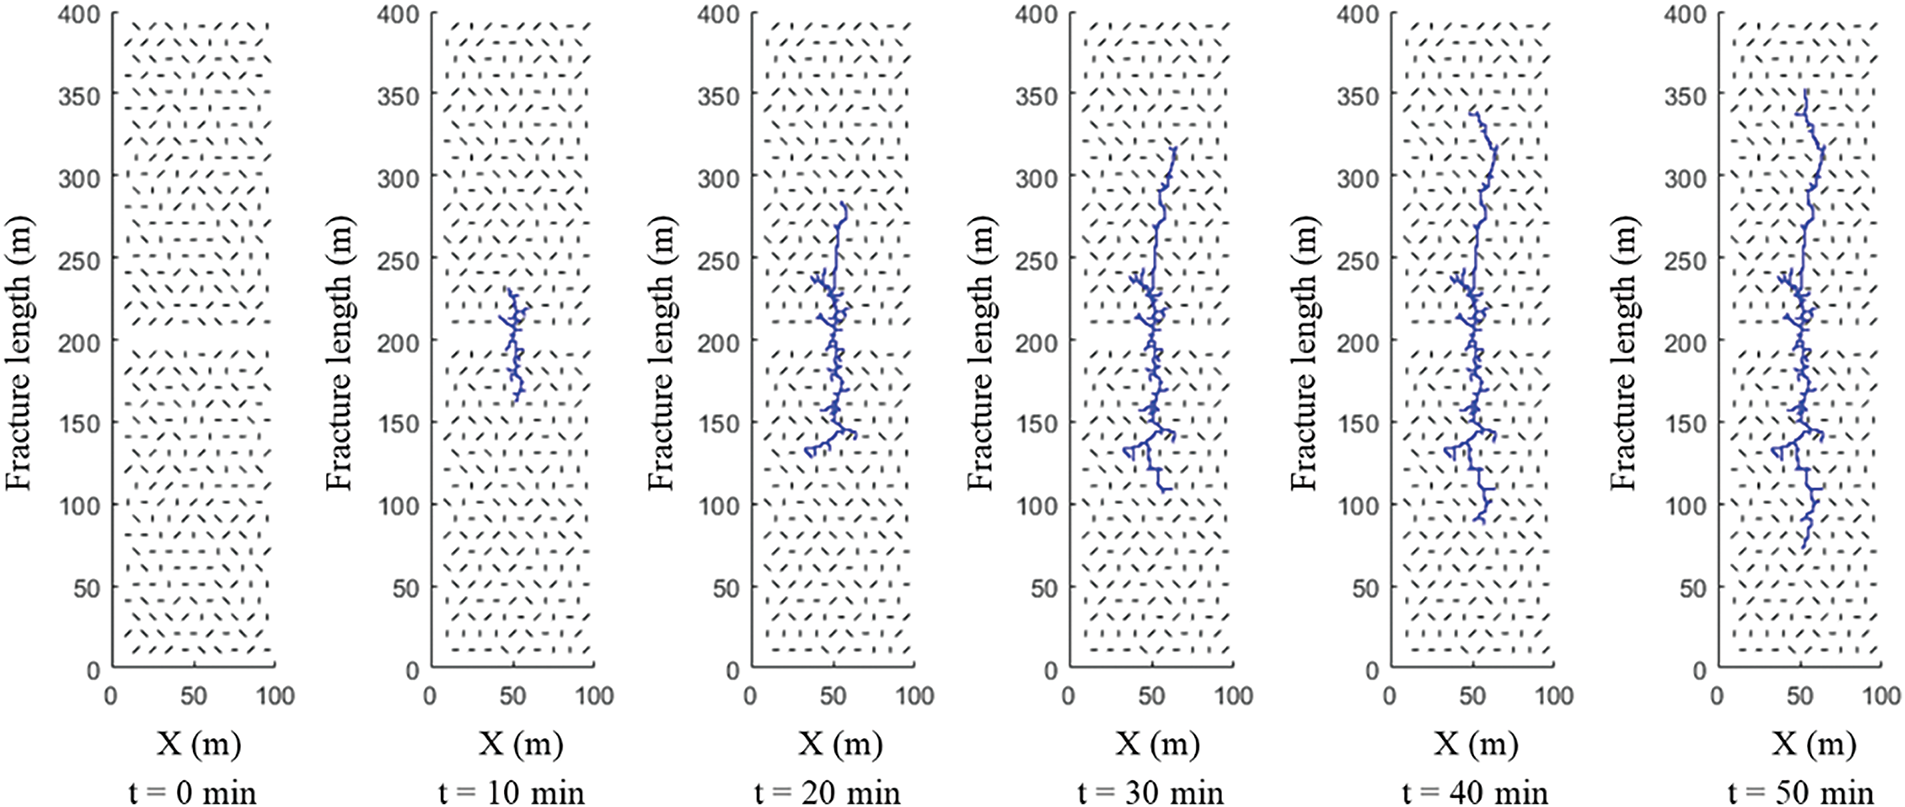
Figure 5: Fracture morphology at different fracturing times
3.2 Comparison of Fracture Network with/without Natural Fractures
This paper establishes a conceptual model for coal reservoirs, with a single-cluster perforation selected for fracture network inversion. The control area of the model is 200 × 200 m2, with an initial maximum principal stress of 55.5 MPa, an initial minimum principal stress of 43 MPa, a vertical stress of 40 MPa, and a pore pressure of 15 MPa. The geological model structure is shown in Fig. 6. Due to the significant heterogeneity of coal reservoirs, the model accounts for the variability in both stress and permeability distributions.
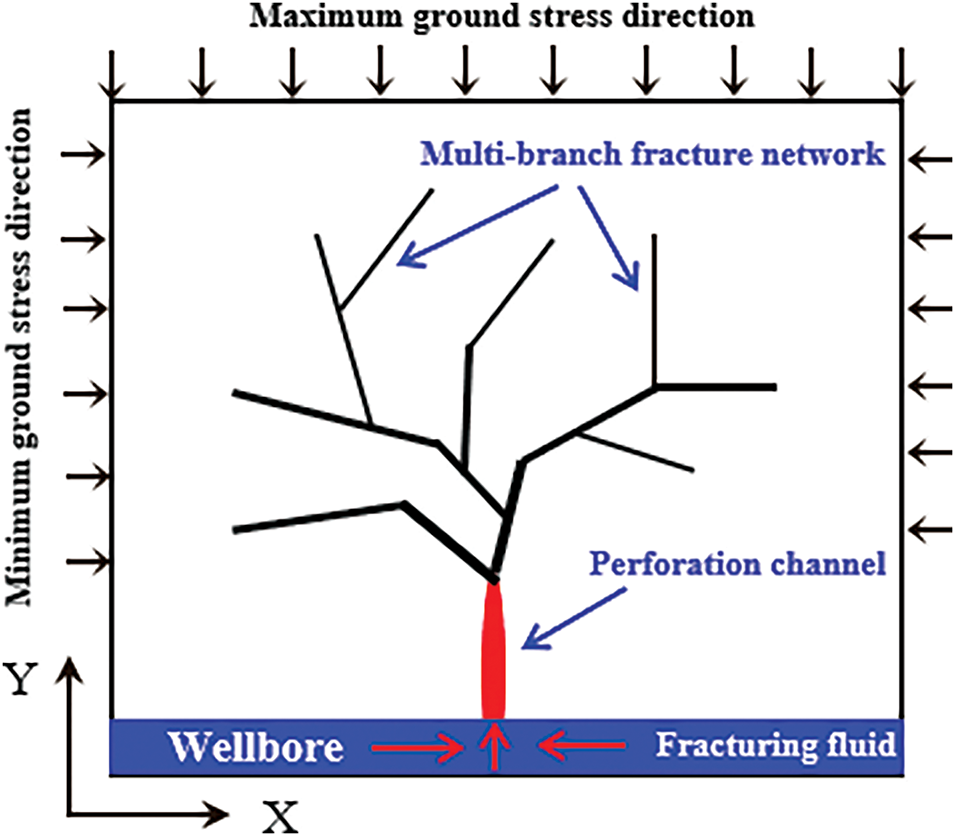
Figure 6: Geological model structure
In terms of in-situ stress, there is a gradient in the stress difference between the principal stresses. This stress gradient is 0.05 MPa/m.
A geological model with 200 × 200 units was established, where each individual geological unit controls an area of 1 × 1 m2. The model assumes perforation at the center of the wellbore, creating a perforation channel. At the beginning, the fluid pressure in the perforation channel is equal to the injection pressure, as shown in Fig. 6. The relevant parameters of the model are provided in Table 1. By applying the calculation methods outlined in Sections 2.1 and 2.2, the fracture network morphology is simulated.

To investigate the impact of NFs on fracture morphology, we compare the results of simulations with and without the presence of NFs. As shown in Fig. 7, when natural fractures are absent (Fig. 7a), the primary fracture grows perpendicular to the wellbore. This occurs because the coal reservoir is homogeneous, and the maximum principal stress is aligned with the wellbore normal, directing the fracture propagation in this specific direction. In contrast, when NFs are present (Fig. 7b), the fracture network becomes more complex and extends further, resulting in a larger stimulated reservoir volume compared to the case without NFs. This is because those natural fractures can change the original dominant propagation path of hydraulic fractures, thereby increasing the possibility of forming induced fracture network. The fluid pressure consumption when fractures communicate with natural fractures is less than that of directly fractured rocks, so it can retain larger fluid pressure and extend farther. The results of fracture morphology in Fig. 7a, b show that the fracture shows multi-branch fracture network. This is because the fractal index is introduced to restrict the fracture morphology, which characterizes the random distribution and fractal characteristics of hydraulic fractures. Fracture propagation is multi-directional, and the fractal index has a significant influence on the fracture direction.
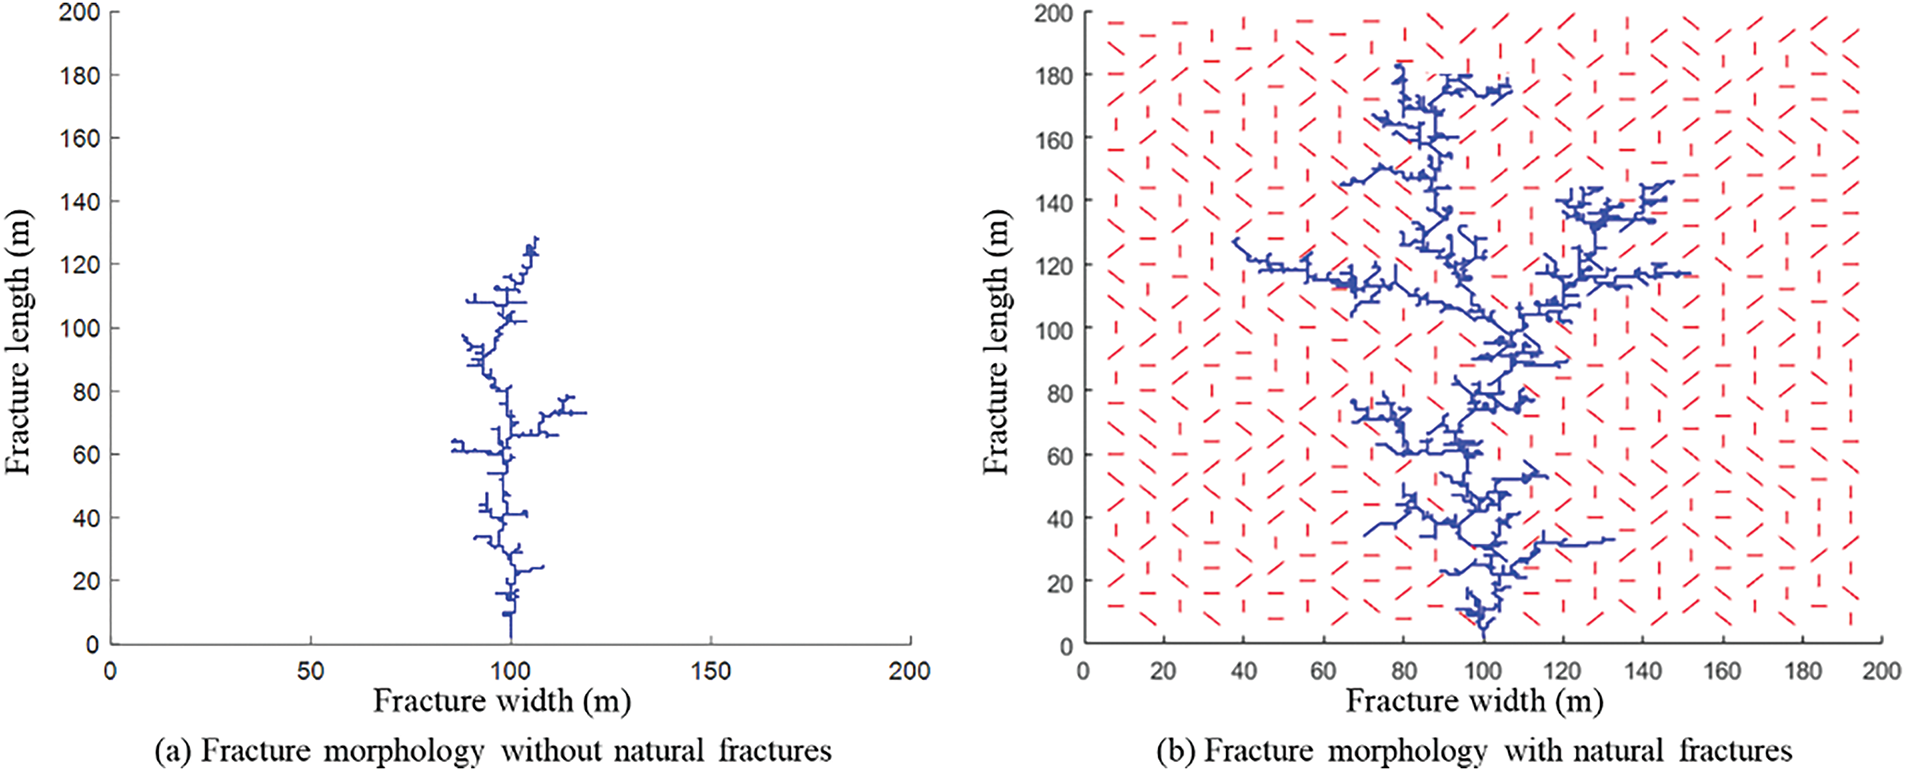
Figure 7: Fracture morphology inversion of conceptual model
3.3 Comparison with Microseismic Monitoring Data
In this study, a conceptual model was developed to compare with microseismic data, integrating the relevant microseismic characteristics. The key parameters of the model are provided in Table 1. The microseismic data, shown in Fig. 8, indicate fracture dimensions of approximately 98 m by 38 m. The simulation results, displayed in Fig. 9, illustrate the fracture geometry at three different time stages. The final simulated fracture dimensions are approximately 85 m in length and 35 m in width. A comparison of the model results with the actual microseismic data shows an 80% correlation. Therefore, the fracture propagation simulation method proposed in this study, combined with the constraints of microseismic data points, can be effectively applied to post-fracturing fracture modeling in practical engineering.
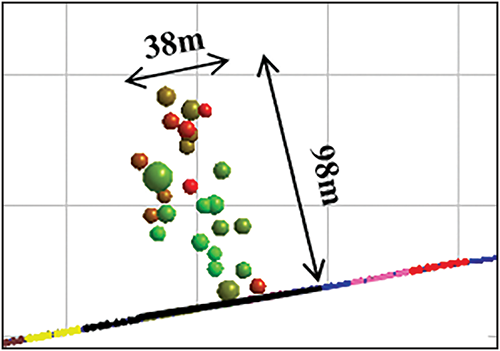
Figure 8: Actual microseismic monitoring of fracture morphology

Figure 9: Microseismic data points and fracture morphology
3.4 Calculation of Fractal Dimension
In previous studies, it is expounded that the microstructure of NFs and HFs in coal reservoirs has fractal characteristics. The multi-branch fracture network in the reservoirs shows certain randomness and self-similarity in statistics. Fractal geometry theory can describe fracture network structural characteristics of coal reservoirs, and fractal dimension is generally used to quantitatively describe the complexity and intensity of fracture network [15].
The calculation of fracture fractal dimensions is conducted using the box-counting method. The specific calculation is as follows:
where, df is the fractal dimension. r is the grid length. N(r) is the number of grids with fracture.
Assumed that there is a fracture network in the reservoir, and the length of reservoir is l. The reservoir is continuously divided into equal intervals, and a set of relevant values about the length r and the number of fracture grids N(r) can be obtained for each division. The general morphology of its division is shown in Fig. 10.
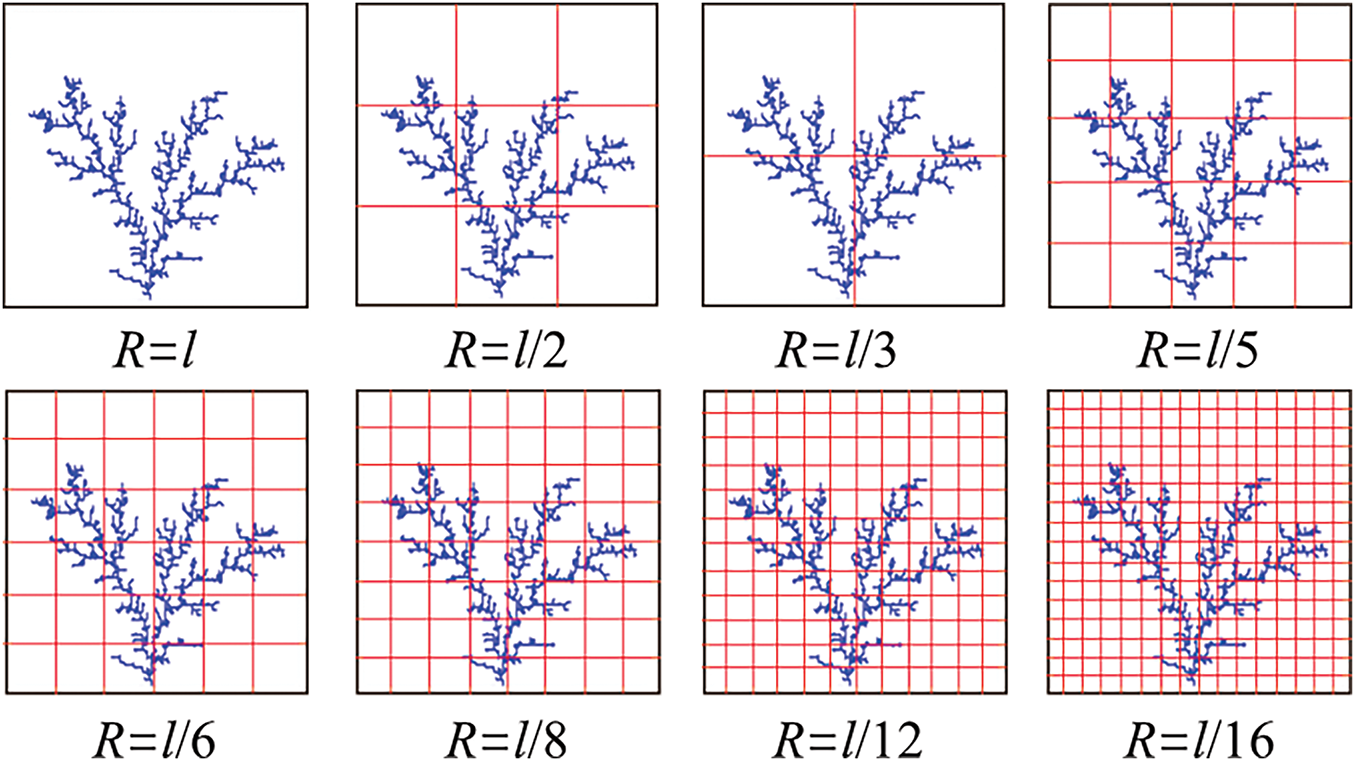
Figure 10: Calculation of fractal dimension by box-counting method
The data are fitted by a straight line with −ln(r) on the x-axis and ln(N(r)) on the y-axis, as shown in Fig. 11. The points closely align with the fitted line, with the slope of the line representing the fractal dimension of the fracture network in Fig. 10. The fractal dimension (df) shown in Fig. 10 is 1.4571.
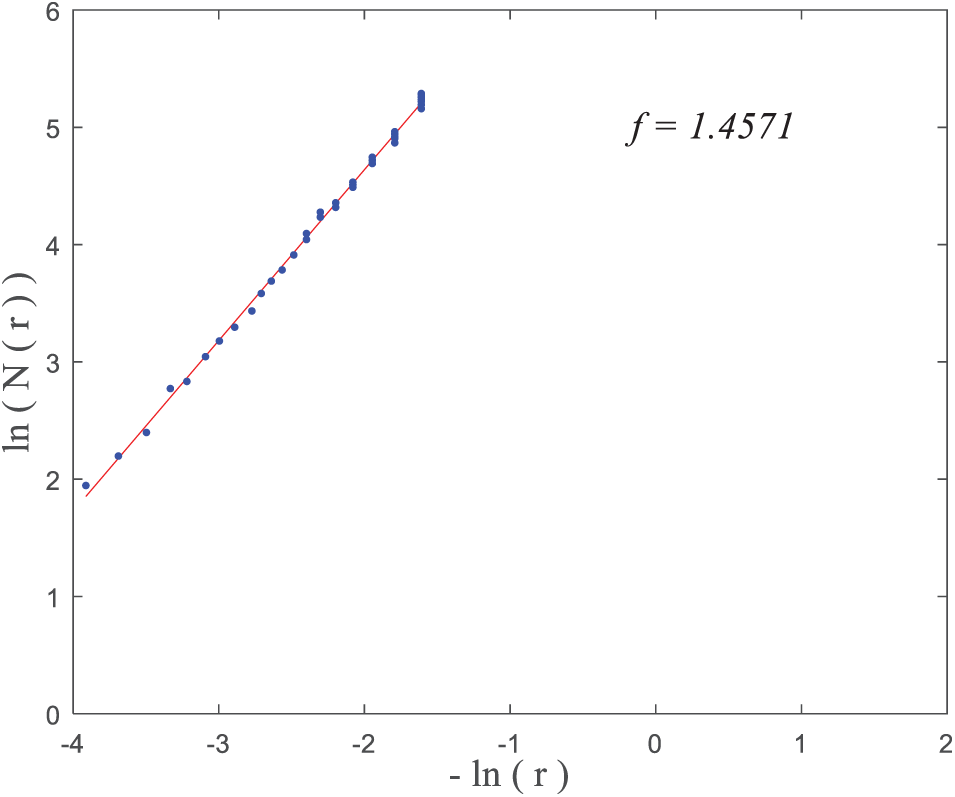
Figure 11: Fractal dimension fitting curve
3.5 Analysis of Fracture Morphology and Fractal Dimension
In this work, the effects of contact angle, NF spacing and NF length are considered. On this basis, sensitivity analysis was carried out. Fractal dimension is used to quantitatively evaluate the reservoir stimulation and fracture network distribution.
(1) Influence of NF contact angle on fracture network morphology
This work simulated fracture network morphology when the contact angles of natural fractures are 0, π/4, π/2, and 0~π/2, respectively. The parameters of natural fractures in Table 2 are used in this part.

The location of NFs in the reservoir is complicated, so this work adopts NF interlaced distribution in the whole reservoir. The distribution of NFs initially constructed by the model is shown in Fig. 12.
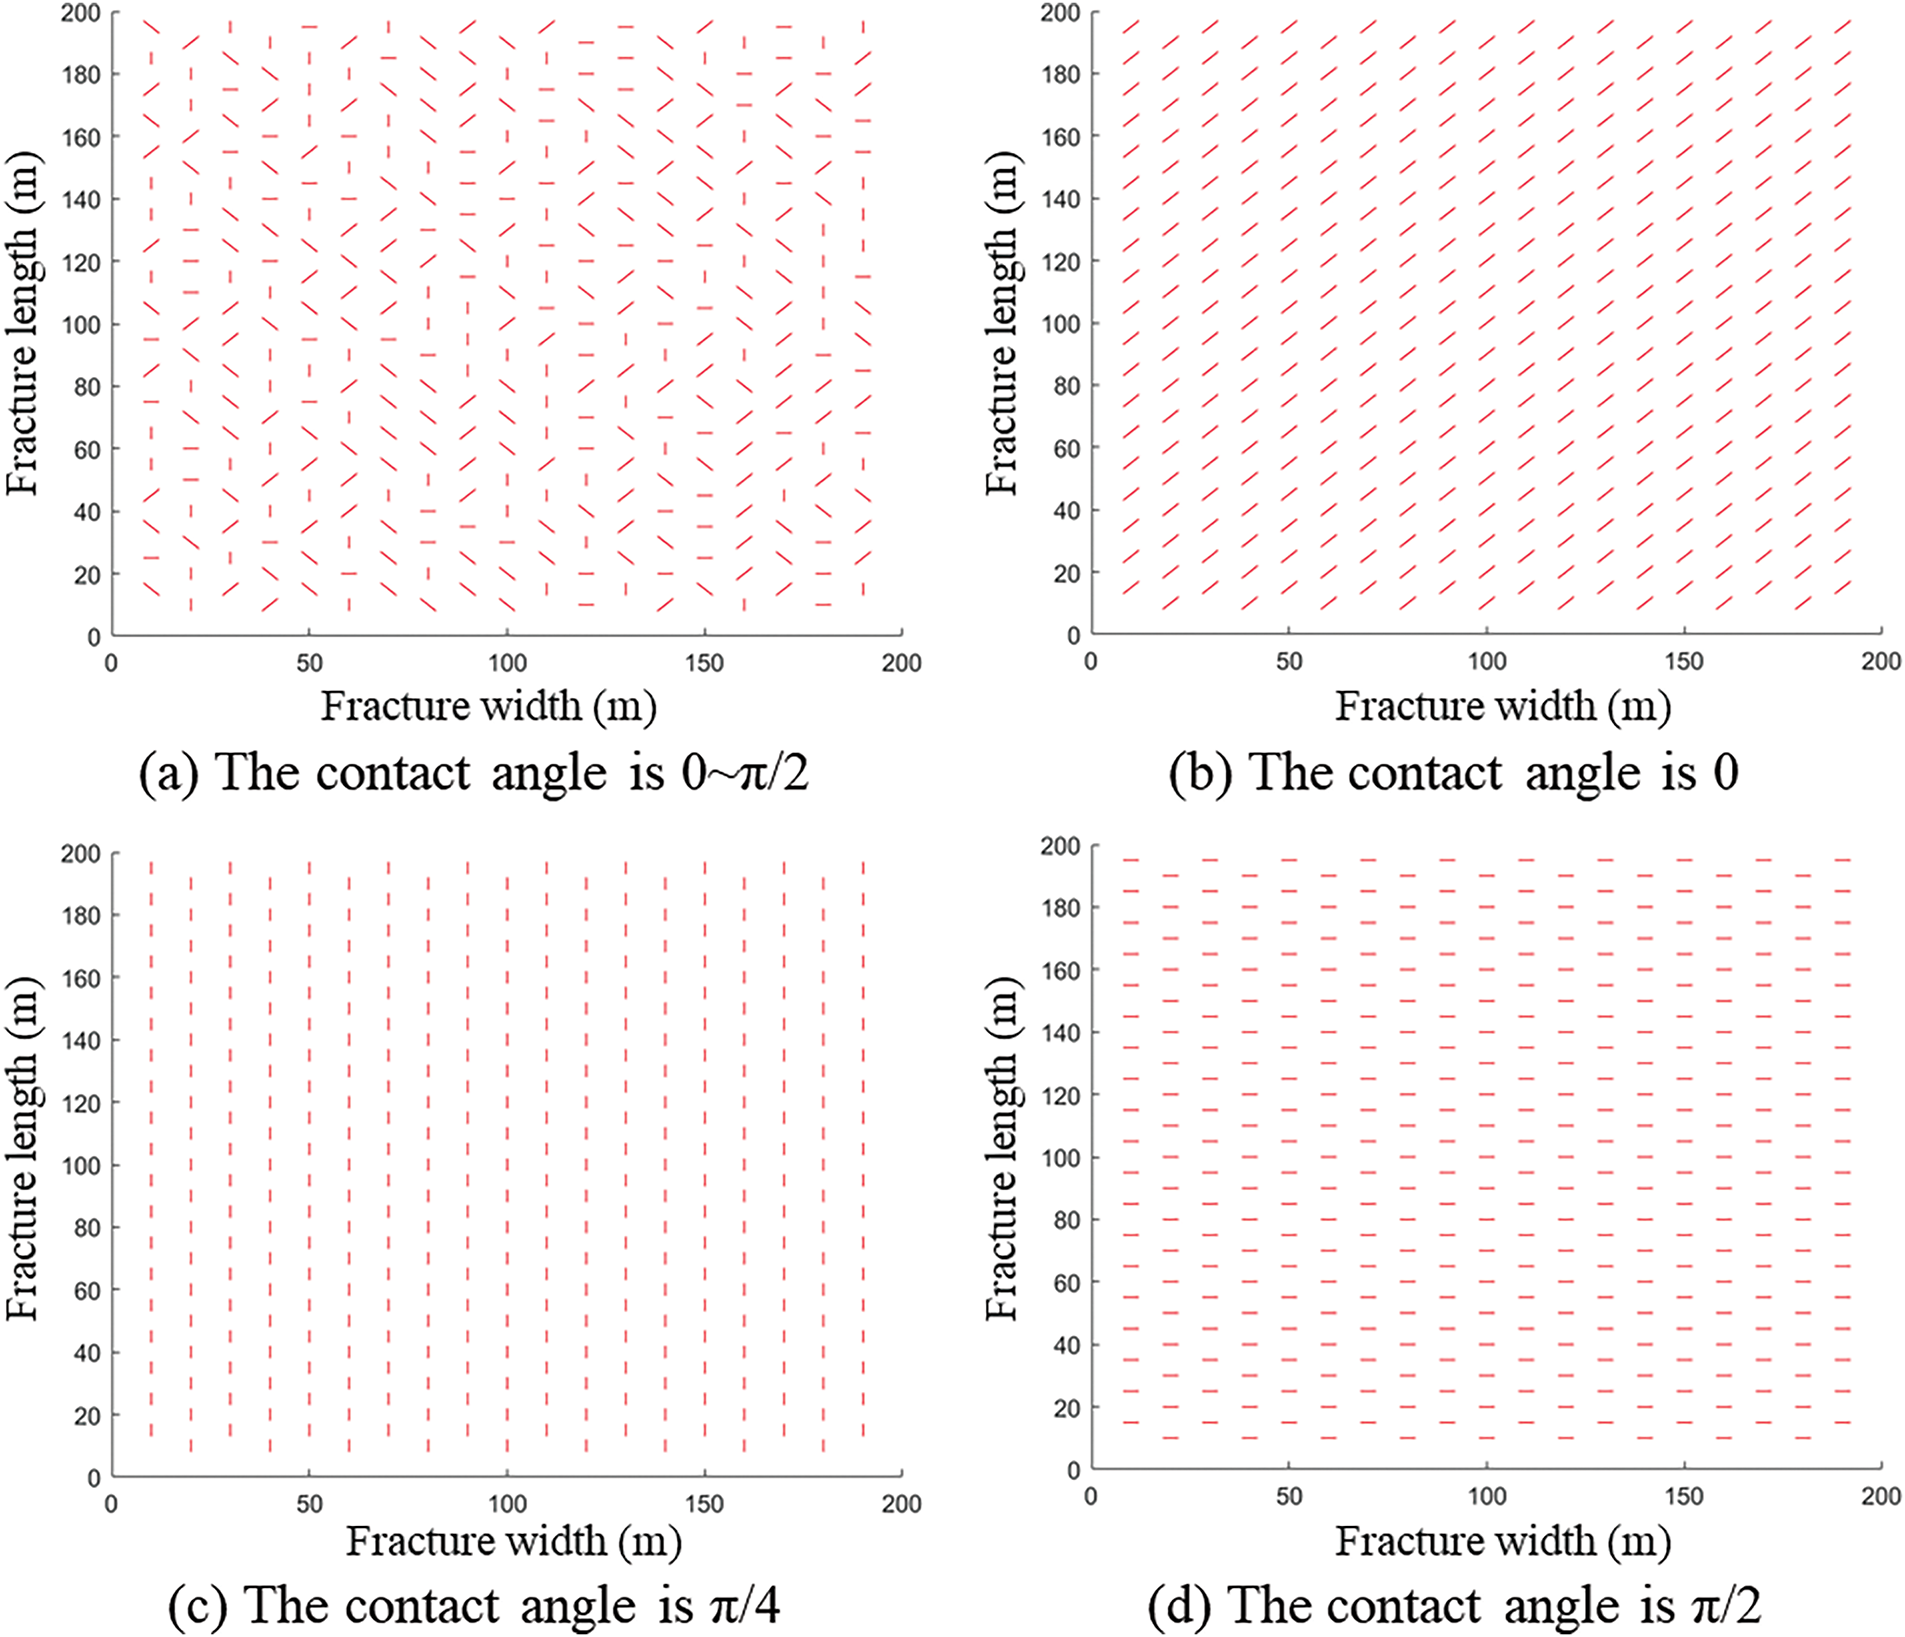
Figure 12: NF morphology with different contact angles
Using the actual parameters in Table 1, the fracture network morphologies with four different contact angles of NFs are calculated, as shown in Fig. 13.
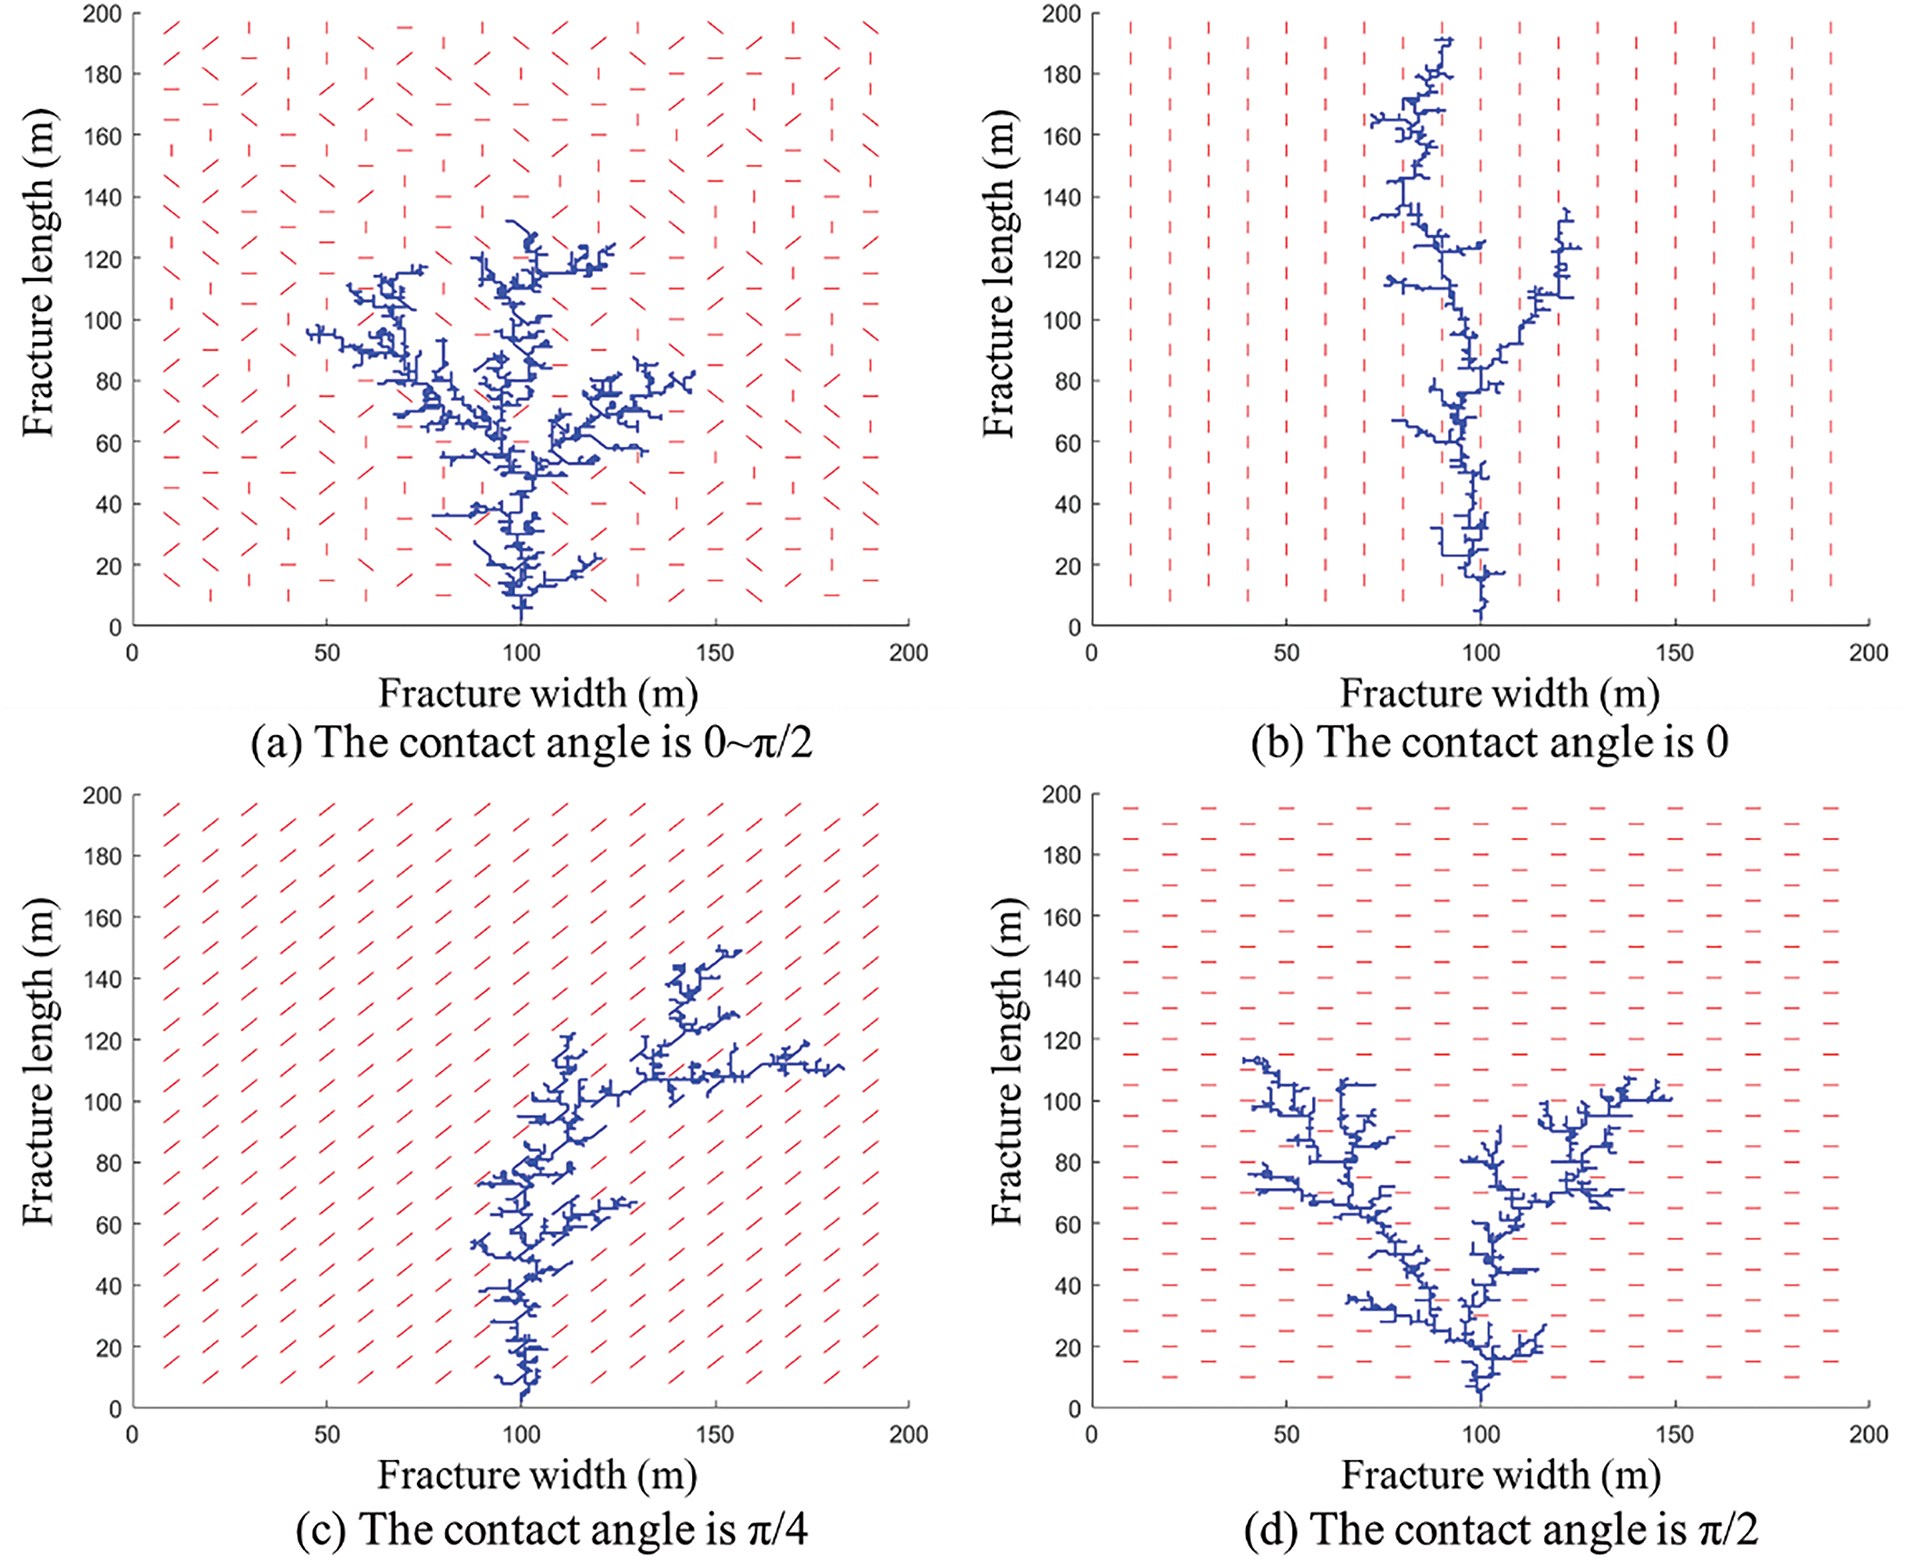
Figure 13: Fracture network morphology with different natural fracture contact angles
Fig. 13a shows that the contact angle of NFs plays a crucial role in determining fracture morphology. The orientation of these fractures affects the propagation path of HFs and creates additional induced fractures. Although HF growth is random, the main fracture generally aligns with the direction of maximum principal stress. Comparing Fig. 13b–d, it is clear that as the angle between the NFs and the principal stress increases, the number of induced fractures also grows.
The fractal dimension results in Fig. 14 indicate that when NFs are randomly distributed, the fracture network has the highest fractal dimension and the largest stimulated reservoir volume (SRV). Conversely, when NFs align with the maximum principal stress, the fractal dimension is minimized. Although HFs can still activate NFs, allowing for further fracture extension, lateral growth is limited, which results in a smaller SRV.
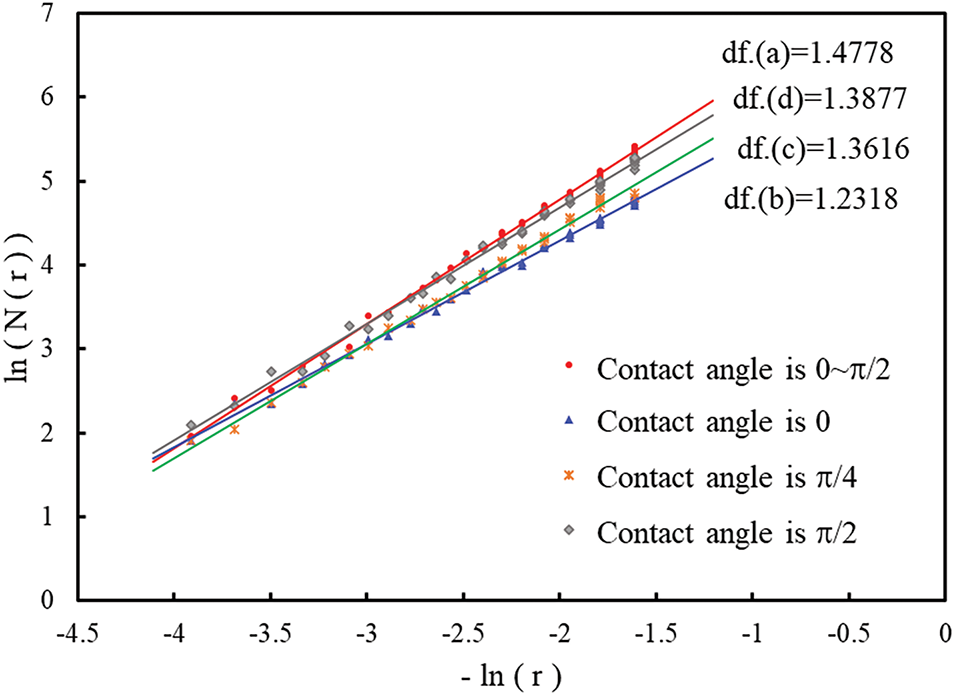
Figure 14: Fractal dimension of fractures with different NF contact angles
(2) Influence of NF length on fracture network morphology
The length of NF has influence on the branch fracture network and net pressure in HF. In this work, three cases with NF length of 4, 6, 8 m are considered to study the influence of the NF length in the reservoir on the fracture by the model. The NF parameters in Table 3 are used in this part.

The inverted fracture morphology in Fig. 15 indicates that the longer the NF length, the fewer induced fractures, and the longer the fracture extension. HFs tend to propagate along NFs. The fractal dimension of fractures in Fig. 16 shows that the fractal dimension of fractures increases with the decrease of the length of NFs. However, when the length of NFs increases, the length of fracture propagation will significantly increase, and the area range those fractures can control will also increase. For large reservoir development, fracturing operation is more advantageous when the reservoir contains a large length of NF distribution.

Figure 15: Fracture network morphology with different NF length
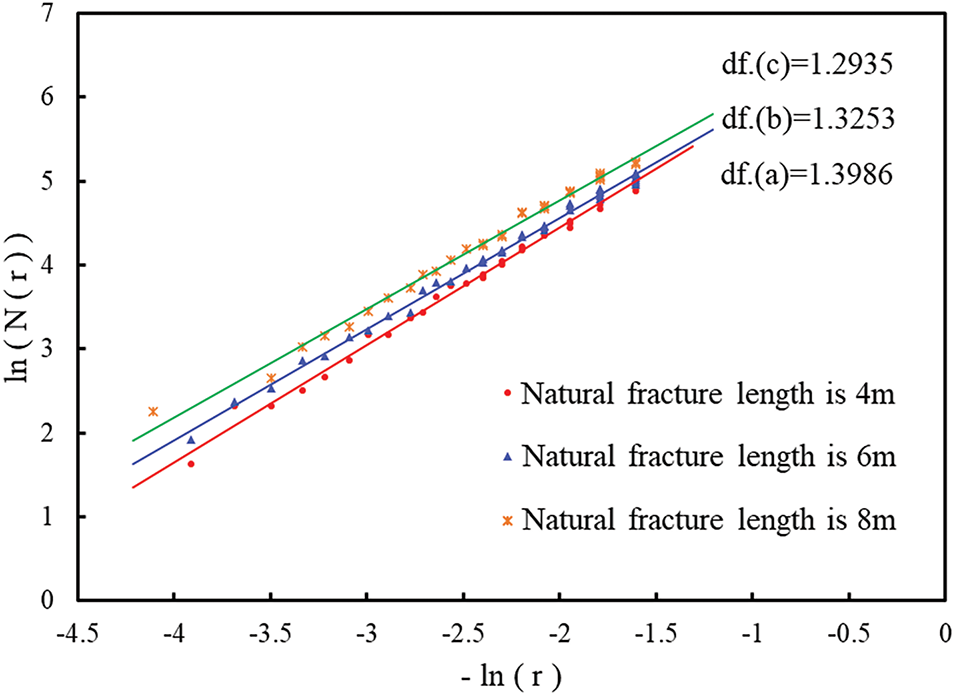
Figure 16: Fractal dimension of fractures with different NF length
(3) Influence of NF spacing on fracture network morphology
The distribution density of NFs in the reservoirs will have a significant impact on the fracture morphology produced by fracturing operation. Thereby increasing the possibility of fracture turning to extend and forming branch fracture networks. In this paper, three fracture models with different NF spacing distribution are established. The NF spacing is 6, 10 and 15 m, respectively. The fracture morphology is simulated according to the established three models, and the role of NF spacing in the fracturing process is analyzed. The NF parameters used in the model are given in Table 4.

Fig. 17a shows that with small NF spacing and dense fracture distribution, HFs interact with numerous NFs, forming many induced fracture branches. As shown in Fig. 17b, with increasing NF spacing, fewer NFs are engaged, and the fracture network becomes more limited. In Fig. 17c, with even sparser fractures, HFs rarely connect to NFs and predominantly extend along the direction of the main fractures.

Figure 17: Fracture network morphology with different NF spacing
Comparing the fracture networks at different NF spacings reveals that smaller NF spacing leads to more interactions between HFs and NFs, resulting in a more intricate fracture network and a larger stimulated reservoir volume (SRV). The fractal dimension results in Fig. 18 show that NF spacing significantly influences the fractal dimension of HFs. Based on the inversion of fracture morphology and the corresponding fractal dimension in Figs. 17 and 18, it can be concluded that smaller NF spacing increases the number of induced fractures branches and raises the fractal dimension, while larger NF spacing results in simpler HFs and a reduced SRV.
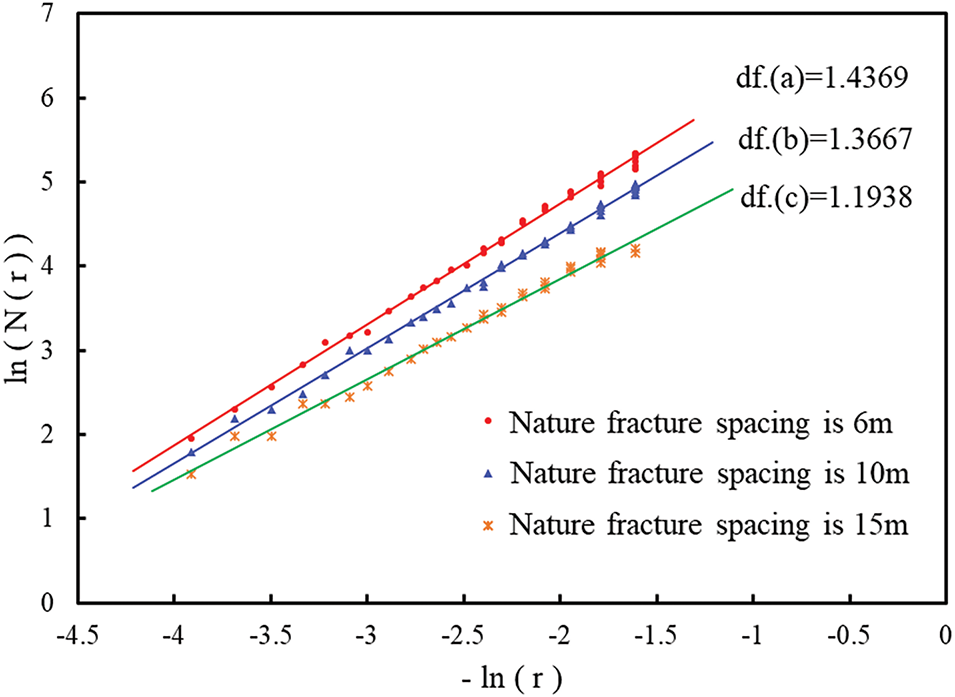
Figure 18: Fractal dimension with different NF spacing
The manuscript proposes a method for inverting the complex fracture morphology in coal reservoirs, which effectively describes the fracture propagation characteristics of the reservoir. By calculating the fractal dimension of fracture morphology, we can quantify the complexity of reservoir stimulation. Furthermore, based on the existing relationship between fracture fractal dimension and reservoir equivalent permeability, this method can be used to quantitatively predict the production dynamics post-stimulation.
(1) This paper presents a simulation approach for v-coal reservoirs, integrating the distribution of natural fractures and the randomness of fracture network propagation, based on the hydraulic fracture network inversion technique.
(2) The study compared fracture network characteristics in reservoirs with and without natural fractures. The results suggest that natural fractures enhance the formation of induced fractures and lead to a significant increase in the stimulated reservoir volume (SRV).
(3) The sensitivity of natural fractures and reservoir parameters to fracture morphology was analyzed. The fracture contact angle is π/2, the reservoir with shorter natural fractures and smaller natural fractures spacing usually has larger stimulated reservoir area and fractal dimension.
Acknowledgement: Not applicable.
Funding Statement: This study was supported by the Foundation of National Engineering Laboratory for Exploration and Development of Low-Permeability Oil and Gas Fields (2023-015).
Author Contributions: The authors confirm contribution to the paper as follows: Conceptualization, Jinghua Liu and Luoyi Huang; methodology, Weiping Ouyang, Jinghua Liu, and Luoyi Huang; software, Weiping Ouyang; validation, Hongzhong Zhang; writing—review and editing, Weiping Ouyang, Jinghua Liu, and Luoyi Huang. All authors reviewed the results and approved the final version of the manuscript.
Availability of Data and Materials: The authors confirm that the data supporting the findings of this study are available within the article.
Ethics Approval: Not applicable.
Conflicts of Interest: The authors declare no conflicts of interest to report regarding the present study.
References
1. Yu J, Li N, Hui B, Zhao W, Li Y, Kang J, et al. Experimental simulation of fracture propagation and extension in hydraulic fracturing: a state-of-the-art review. Fuel. 2024;363:131021. doi:10.1016/j.fuel.2024.131021. [Google Scholar] [CrossRef]
2. Zhang Q, Wang WD, Su YL, Chen W, Lei ZD, Li L, et al. A semi-analytical model for coupled flow in stress-sensitive multi-scale shale reservoirs with fractal characteristics. Petrol Sci. 2024;21(1):327–42. doi:10.1016/j.petsci.2023.10.003. [Google Scholar] [CrossRef]
3. Zhang AS, Yang ZM, Li XS, Xia DB, Zhang YP, Luo YT, et al. An evaluation method of volume fracturing effects for vertical wells in low permeability reservoirs. Petrol Explor Dev. 2020;47(2):441–8. doi:10.1016/S1876-3804(20)60061-1. [Google Scholar] [CrossRef]
4. Liu D, Shu L, Wang Y, Ni X, Huo Z, Wang W. Experimental studies on the crack initiation and propagation of hydraulic fracturing with different coal structure combinations. ACS Omega. 2023;8(41):38072–82. doi:10.1021/acsomega.3c03999. [Google Scholar] [PubMed] [CrossRef]
5. Zhou T, Chen M, Zhang S, Li Y, Li F, Zhang C. Simulation of fracture propagation and optimization of ball-sealer in-stage diversion under the effect of heterogeneous stress field. Nat Gas Ind B. 2020;7(5):523–32. doi:10.1016/j.ngib.2020.09.010. [Google Scholar] [CrossRef]
6. Zhao H, Huang L, Sheng G, Zhan W, Shi C, Ren J, et al. Numerical simulation of low-viscosity fluid proppant transport based on the high-order WENO method. Geoenergy Sci Eng. 2024;241:213156. doi:10.1016/j.geoen.2024.213156. [Google Scholar] [CrossRef]
7. Rao X, He X, Du K, Kwak H, Yousef A, Hoteit H. A novel projection-based embedded discrete fracture model (pEDFM) for anisotropic two-phase flow simulation using hybrid of two-point flux approximation and mimetic finite difference (TPFA-MFD) methods. J Comput Phys. 2024;499:112736. doi:10.1016/j.jcp.2023.112736. [Google Scholar] [CrossRef]
8. Qi J, Zhang L, Zhang K, Li L, Sun J. The application of improved differential evolution algorithm in electromagnetic fracture monitoring. Adv Geo-Energy Res. 2020;4(3):233–46. doi:10.46690/ager.2020.03.02. [Google Scholar] [CrossRef]
9. Chen J, Li X, Cao H, Huang L. Experimental investigation of the influence of pulsating hydraulic fracturing on pre-existing fractures propagation in coal. J Petrol Sci Eng. 2020;189:107040. doi:10.1016/j.petrol.2020.107040. [Google Scholar] [CrossRef]
10. Mou P, Pan J, Wang K, Wei J, Yang Y, Wang X. Influences of hydraulic fracturing on microfractures of high-rank coal under different in situ stress conditions. Fuel. 2021;287:119566. doi:10.1016/j.fuel.2020.119566. [Google Scholar] [CrossRef]
11. Gong D, Chen J, Cheng C, Kou Y. Factors influencing fracture propagation in collaborative fracturing of multiple horizontal wells. Energy Eng. 2024;121(2):425–37. doi:10.32604/ee.2023.030196. [Google Scholar] [CrossRef]
12. Xu C, Yang T, Wang K, Fu Q, Ma S. Gas extraction of coal seam roof fractured zone in China: a review. Fuel. 2024;357(4):129930. doi:10.1016/j.fuel.2023.129930. [Google Scholar] [CrossRef]
13. Qian Y, Li Q, Liang Y, Hu Q, Li W, Li J, et al. Evaluation of hydraulic fracturing in coal seam using ground microseismic monitoring and source location. Rock Mech Rock Eng. 2024;57(1):679–94. doi:10.1007/s00603-023-03577-9. [Google Scholar] [CrossRef]
14. Liu J, Yang Z, Yi L, Yi D, Li X. Cohesive phase-field model for dynamic fractures in coal seams. Int J Mech Sci. 2024;282(6):109617. doi:10.1016/j.ijmecsci.2024.109617. [Google Scholar] [CrossRef]
15. Huang L, Sheng G, Chen YN, Zhao H, Luo B, Ren T. A new calculation approach of heterogeneous fractal dimensions in complex hydraulic fractures and its application. J Petrol Sci Eng. 2022;219(4):111106. doi:10.1016/j.petrol.2022.111106. [Google Scholar] [CrossRef]
16. Zhang K, Ma X, Li Y, Wu H, Cui C, Zhang X, et al. Parameter prediction of hydraulic fracture for tight reservoir based on micro-seismic and history matching. Fractals. 2018;26(2):1840009. doi:10.1142/s0218348x18400091. [Google Scholar] [CrossRef]
17. Fu X, Qing Y, Zhang W, Wei C, Zhou R. Study on coal pore fractal classification and natural classification based on coalbed methane migration. Chin Sci Bull. 2005;S1:51–5. doi:10.3321/j.issn:0023-074X.2005.z1.009. [Google Scholar] [CrossRef]
18. Olson JE, Bahorich B, Holder J. Examining hydraulic fracture—natural fracture interaction in hydrostone block experiments. In: SPE Hydraulic Fracturing Technology Conference; 2012 Feb 6–8; The Woodlands, TX, USA; 2017. SPE-152618-MS. doi:10.2118/152618-ms. [Google Scholar] [CrossRef]
19. Ren L. Fracture network propagation and productivity prediction based on fluid-solid fully coupling of SRV-fractured horizontal wells in tight oil reservoirs [dissertation]. Qingdao, China: China University of Petroleum (East China); 2016. [Google Scholar]
20. Cui X, Radwan AE. Coupling relationship between current in situ stress and natural fractures of continental tight sandstone oil reservoirs. Interpretation. 2022;10(3):SF9–21. doi:10.1190/int-2021-0200.1. [Google Scholar] [CrossRef]
21. Mafakheri Bashmagh N, Lin W, Radwan AE, Manshad AK. Comprehensive analysis of stress magnitude and orientations and natural fractures in complex structural regimes oil reservoir: implications for tectonic and oil field development in the Zagros suture zone. Mar Petrol Geol. 2024;160:106615. doi:10.1016/j.marpetgeo.2023.106615. [Google Scholar] [CrossRef]
22. Blanton TL. Propagation of hydraulically and dynamically induced fractures in naturally fractured reservoirs. In: SPE Unconventional Gas Technology Symposium; 1986 May 18–21; Louisville, KY, USA. doi:10.2118/15261-ms. [Google Scholar] [CrossRef]
23. Hui Z, Guanglong S, Luoyi H, Xun Z, Jingang F, Yuhui Z, et al. Application of lightning breakdown simulation in inversion of induced fracture network morphology in stimulated reservoirs. Paper presented at: International Petroleum Technology Conference; 2021 Mar. doi:10.2523/iptc-21157-ms. [Google Scholar] [CrossRef]
24. Green A, Sneddon I. The distribution of stress in the neighbourhood of a flat elliptical crack in an elastic solid. Math Proc Camb Philos Soc. 1950;46(1):159–63. doi:10.1017/S0305004100025585. [Google Scholar] [CrossRef]
Cite This Article
 Copyright © 2025 The Author(s). Published by Tech Science Press.
This work is licensed under a Creative Commons Attribution 4.0 International License , which permits unrestricted use, distribution, and reproduction in any medium, provided the original work is properly cited.


 Submit a Paper
 Propose a Special lssue
 View Full Text
 Download PDF
 Downloads
 Citation Tools