
 Submit a Paper
 Propose a Special lssue
 Open Access
ARTICLE

Temperature Control Performance and Cooling Release Characteristics of PCM in Large Space: Case Study of Cold Storage
1 College of Energy and Mechanical Engineering, Shanghai University of Electric Power, Shanghai, 201306, China
2 Research and Development Center, Heatmate New Energy Technology Co., Ltd., Shanghai, 200090, China
3 Shanghai Non-Carbon Energy Conversion and Utilization Institute, Shanghai Jiao Tong University, Shanghai, 200240, China
* Corresponding Authors: Yanming Shen. Email: ; Jingyong Cai. Email:
Energy Engineering 2025, 122(3), 885-903. https://doi.org/10.32604/ee.2025.061976
Received 07 December 2024; Accepted 08 February 2025; Issue published 07 March 2025
 View Full Text
 Download PDF
Abstract
Phase Change Material (PCM)-based cold energy storage system (CESS) can effectively utilize the peak and valley power resources to reduce the excessive dependence on the power grid. In this study, a PCM-based CESS was designed for cold storage applications. The optimal number of PCM plates was determined through numerical simulations to meet the required cold storage temperature and control time. Additionally, the air temperature field, flow field, and melting characteristics of the PCM plates during the cooling release process were analyzed. The effects of plate positioning and thickness on the cooling release performance were further investigated. The results indicated that when 64 PCM plates were used, the duration for maintaining temperatures below −18°C increased from 0.6 h to approximately 16.94 h. During the cooling release process, the temperature field in the cold storage exhibited stratification, and the melting of the PCM plates was non-uniform. Placing the PCM plates at the top or within the interlayers without cargo above proved more effective, with their cooling release power being approximately twice that of the PCM plates placed in the interlayers with cargo above. Furthermore, reducing the thickness of the PCM plates from 15 to 7.5 mm resulted in a 3.6-h increase in the time below −18°C and a 4.5-h reduction in the time required to reach 80% liquid phase fraction.Keywords
In recent years, the cold chain logistics market, particularly cold storage, has experienced rapid growth. Driven by rising consumer demand, China’s cold storage industry has entered a phase of high-speed development. Between 2018 and 2022, the country’s cold storage capacity expanded from 43.07 million tons to 56.86 million tons. By 2028, it will reach 90.23 million tons [1]. However, as the scale of cold storage expands, the issue of energy consumption has become increasingly significant.
To investigate the factors influencing energy consumption in cold storage, Evans et al. developed a mathematical model of energy consumption to assess the refrigeration efficiency of various cold storage types [2]. It was found that cold storage capacity is the primary factor affecting both efficiency and energy consumption. Since the capacity of cold storage is typically predetermined, researchers are devoted to enhancing the heat transfer characteristics of cargo to reduce the energy requirements of the facility. The effects of cargo stacking size and modes on the refrigeration characteristics of cold storage were simulated and analyzed by Chourasia et al. [3]. A sensitivity analysis of the shape and dimensions of the cargo was also carried out. It was found that the average temperature and cooling time of the cargo could be reduced by increasing the width-to-height ratio of the cargo. While the opposite effect was shown in terms of volume and height, and the influence on the width direction was not significant. Meanwhile, increasing the vertical spacing could effectively enhance the heat transfer properties of the cargo stack, thereby improving cooling efficiency. Additionally, the operation of the chillers played a crucial role in influencing the overall efficiency of the refrigeration system in cold storage. Ho et al. established a two-dimensional cold storage model and verified it experimentally with a three-dimensional model [4]. Based on the model, different blowing speeds and arrangement positions of chillers were parametrically analyzed. It was found that using higher blowing speeds and arranging the chiller at a lower position close to the cargo columns could improve the uniformity of the temperature and cooling effect. Jing analyzed the flow field inside the cold storage [5]. The analysis results showed that when multiple chillers were arranged inside the cold storage, by changing the speed of those chillers, the blowing speed and the reflux position could be adjusted so as to achieve a better cooling effect.
The traditional research on reducing the cooling load and increasing the operating efficiency of cold storage refrigeration systems has not effectively solved the problem of excessive energy consumption resulting from prolonged system operation. Energy consumption is mainly caused by refrigeration systems, which account for more than 70% of total energy consumption. Under the background of carbon peaking and carbon neutrality, peak-valley electricity price policies have been implemented. If the valley electricity is converted into stable cold energy storage and released at peak time, the problem can be solved effectively [6]. Through the material phase, PCM-based CESS could charge the cold energy and release it [7]. PCM is beneficial in keeping the temperature of refrigerated (frozen) cargo at a constant value without large temperature fluctuations, and it can improve temperature uniformity [8]. During the phase change process, the PCM temperature remains almost unchanged. Compared to sensible heat energy storage, the energy storage density of the latent storage system is higher, and the charging and discharging processes are more controllable than thermochemical storage [9].
In order to enhance the heat transfer of PCM, scholars have conducted research on increasing latent heat [10–12], reducing supercooling degrees, improving stability, etc. [13,14]. In addition, different types of PCM have been tried to use for energy storage. For example, due to its better practicality, solid-liquid PCM has been widely used in cold chain energy storage [15–17]. Composite PCM was inserted into the inner wall of the refrigerated truck box by Xia et al. to control the temperature of the refrigerated truck [18]. It was found that the temperature rise rate of the refrigerated truck with PCM was lower, which was more conducive to the refrigerated transportation of food. PCM plates were arranged by You et al. on the top of the cold storage [19]. Its temperature rise time was delayed two hours compared with the non-PCM-based CESS. As a result, PCM could delay the activation of the refrigeration unit, thereby reducing the reliance on the power grid for cold storage. Additionally, the factors influencing the cooling release effect of the PCM-based CESS were studied further. The positions of the PCM plates in the refrigerated truck were studied in Xie et al.’s research [20]. It was observed that when the plates were placed on the sides, the overall temperature was lower, and the uniformity was better than when PCM plates were partially arranged on the sides and partially on the top. Cao et al. found that the geometric dimensions of the PCM-based latent heat storage unit significantly affect the variations in liquid fraction and the time required for complete solidification [21,22]. The cold energy storage efficiencies of PCM plates were improved by increasing the PCM thermal conductivity and the difference between the surrounding temperature and PCM melting temperature. Furthermore, Omid et al. simulated and analyzed the optimal volume of PCM in a certain freezing space [23]. With the increase of PCM thickness, both the latent and sensible heat transfer were increased, which could extend the time at a specified temperature. Gou et al. analyzed the impact of varying air inlet speeds and PCM plate spacing on the cooling release performance [24]. It was found that increasing the inlet speed could effectively improve the melting rate. However, it simultaneously resulted in uneven melting of the plates and accelerated the rise in outlet temperature. To solve this problem, the spacing between the PCM plates was increased. Researchers also improved PCM-based cold energy storage units to enhance the overall performance of the PCM-based CESS. Liang et al. investigated the impact of key factors [25], such as the size, arrangement, and fin structure of the PCM plates, on the charge and release energy of the cold storage unit. To improve the heat transfer performance, the ice storage process in the ice-CESS was simulated and analyzed by Yang et al. [26]. It was discovered that when the refrigerant inlet temperature of the CESS unit was decreased, the cold storage rate and capacity were increased, but the unit coefficient of performance was decreased. This meant that the overall efficiency of the system should be considered when optimizing its cold storage performance. Furthermore, according to [27,28], the electricity cost of PCM-based refrigerated containers was reduced by 79% compared to the traditional ones. The period for recovery of investment was 4–4.5 years and 7 years for the high-temperature and low-temperature PCM-based refrigerated containers. Besides, PCM plates can be directly placed on cold storage shelves without changing their original structure. Therefore, PCM-based CESS has bright application prospects and low energy consumption.
However, most of the research on CESS focused on the development of PCM, its applications in small spaces like storage containers and refrigerated trucks, and the improvement of the heat transfer performance of CESS units. The application in large space is rarely studied. Taking cold storage as the study object, a PCM-based CESS was designed in this paper. During the valley power period, the refrigeration system stores excess cold energy in the PCM-based CESS while meeting the cooling demand of the cold storage itself. During peak electricity hours, the refrigeration system is closed. By cooling released through the PCM, the cold storage is maintained at a low temperature, which is beneficial to energy conservation and emission reduction. In this paper, the cooling release performance of the PCM-based CESS was analyzed using numerical simulation. The optimal number of the PCM plates was determined. Then, the temperature field, the flow field, and dynamic cooling release characteristics of the PCM plates during the cooling release process were studied. Finally, the influence of the arrangement positions and thickness of the plates on the cooling release effect were analyzed.
2 Description of the PCM-Based CESS
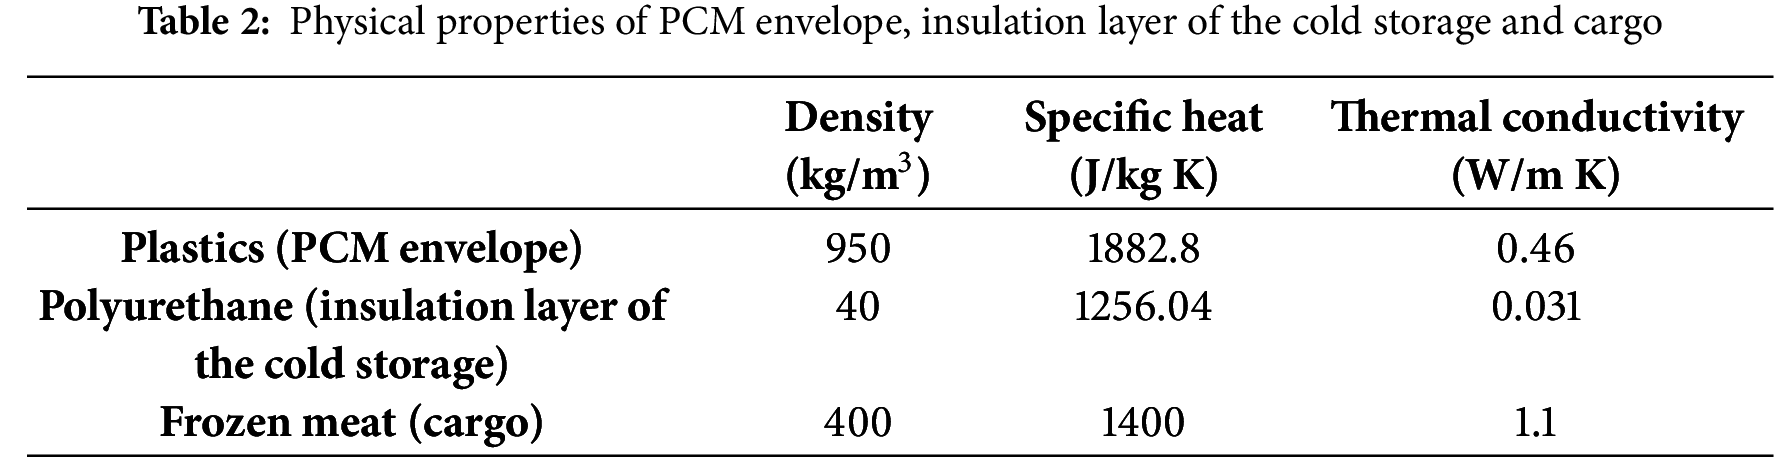
In this paper, cold storage in the Jiading area of Shanghai was taken as the prototype. Its physical model is shown in Fig. 1a. According to the CAD model of the cold storage, its specific dimensions are 32.8 m × 8.7 m × 10.5 m. A polyurethane insulation layer with 100 mm thickness is also used as the enclosure structure for the cold storage. Its temperature should be below −18°C. There are four rows of shelves for storing cargo, each with five layers. The PCM is HM-E-20 of Heatmate New Energy Technology Co., Ltd. (Shanghai, China). It is one of the eutectic phase change materials. Its physical properties are listed in Table 1. The temperature-changing curves of HM-E-20 PCM during the heating and cooling processes are shown in Fig. 2. The PCM was filled in the rectangular plates with a filling rate of 85%. Taking the actual packaging density into account, the latent heat of the PCM plates was reduced to 72% of its original value. The external dimensions of the PCM plates are 452.6 mm × 107.6 mm × 17.6 mm. The PCM envelope is plastic with a thickness of 1.3 mm. The size of each cargo placed on the shelves is assumed to be 1200 mm × 1000 mm × 1550 mm. Referring to the “Cold Storage Design Standards” for temperature requirements for cargo storage, the cargo was set as frozen meat in the simulation. The physical properties of corresponding materials are presented in Table 2.
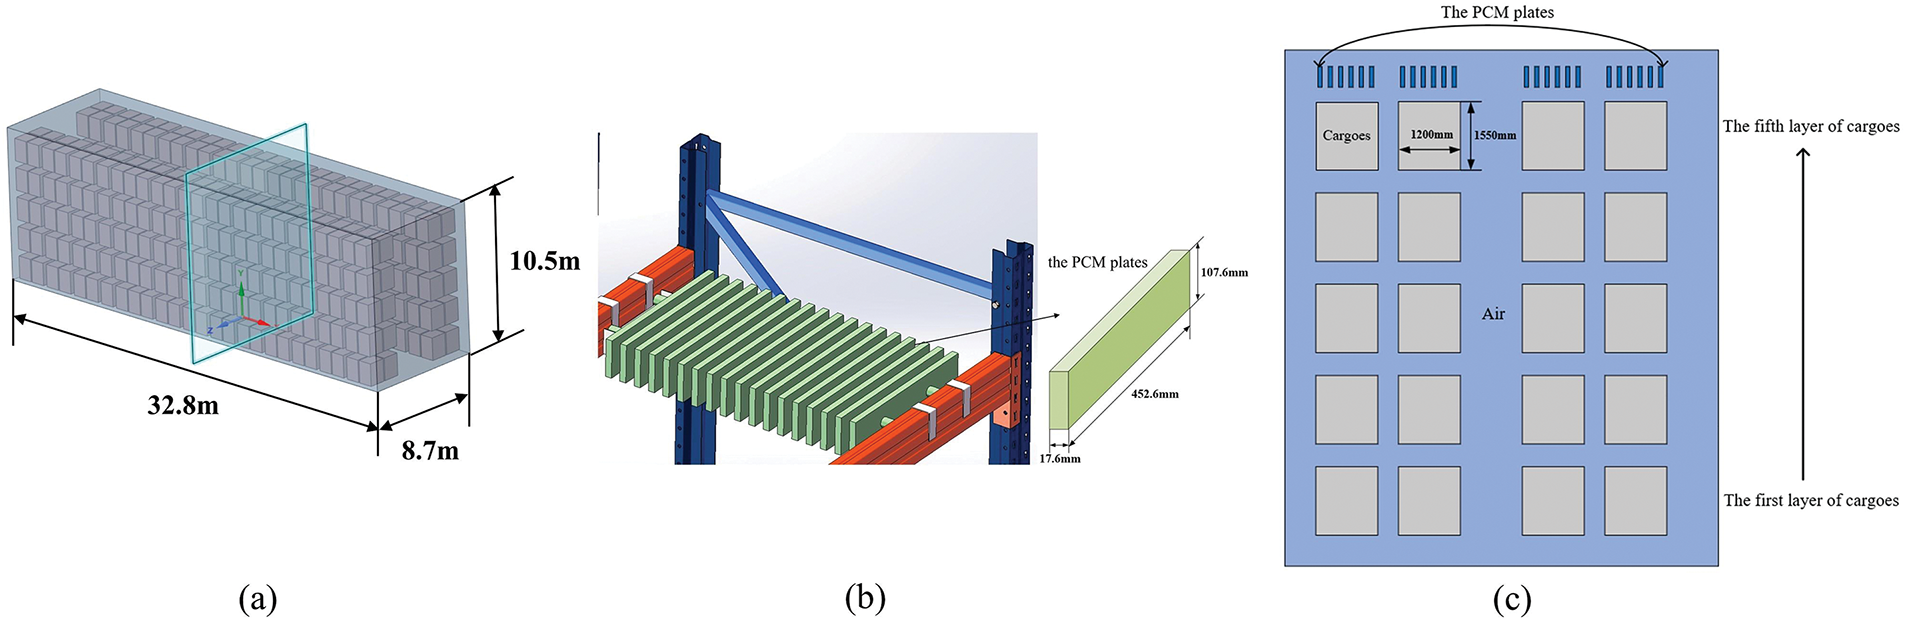
Figure 1: The model of the cold storage and PCM plates; (a) Cold storage physical model; (b) PCM plates module; (c) PCM-based CESS model
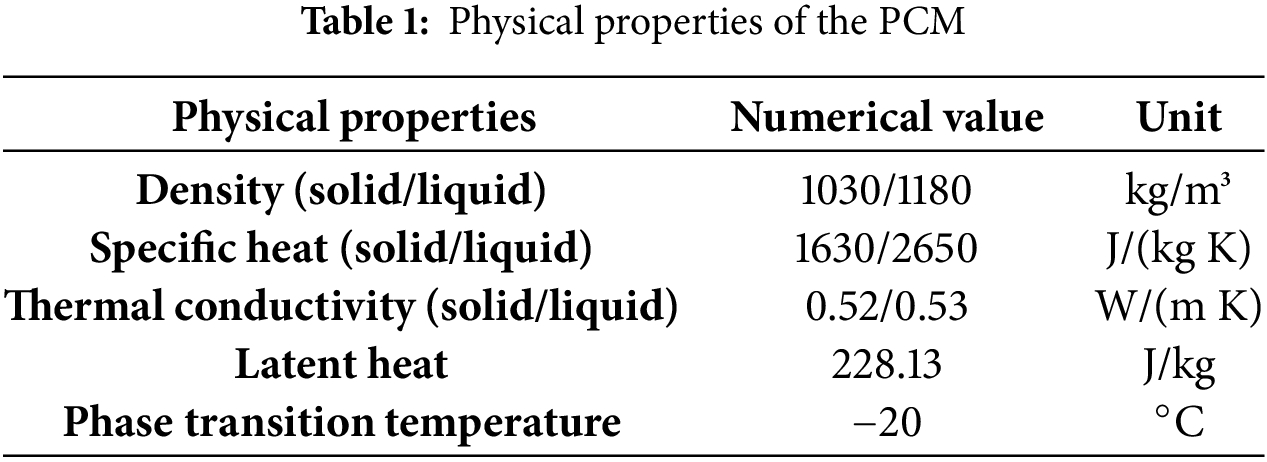
Figure 2: The temperature changing curves of HM-E-20 PCM; (a) Heating curve; (b) Cooling curve
Due to the large model size and high computational requirements, a two-dimensional model of the YZ-axis cross-section was used for simulation. The CESS of the cold storage is the PCM plate modules, which are composed of several PCM plates, as shown in Fig. 1b. During simulation, the PCM plates were simplified as rectangular entities. They were arranged at the highest position of the shelves, 500 mm below the top of the cold storage. The schematic diagram of the two-dimensional model of PCM-based CESS is shown in Fig. 1c.
3 Numerical Model of the PCM-Based CESS
3.1 Mathematical Model and Control Equations
In this paper, ANSYS-Fluent software was used to simulate and analyze the cooling release process of the PCM-based CESS. During the cooling release process, the heat of the PCM plates was exchanged with the air inside the cold storage through natural convection. In order to establish the basic control equations of the temperature and flow fields inside the cold storage and obtain the corresponding solution conditions, the following assumptions were made:
1. The PCM is isotropic and distributed evenly. The matter is not exchanged with the external environment during the phase transition process.
2. Assuming the air inside the cold storage is the incompressible ideal fluid only the effects of temperature changes on air density are considered.
3. Physical parameters of solid and liquid phases of PCM are constant.
4. The cold storage is airtight, with no exchange of materials or substances with the external environment.
5. All fluid on solid boundaries and walls satisfies no-slip boundary conditions.
6. The contact thermal resistances are neglected.
7. Considering that the shelf model was complex and had minimal impact on simulation results, the shelves were ignored during modeling.
The numerical simulation of the cooling release process for the PCM-based CESS was conducted based on the assumptions mentioned above. The governing equations were shown as follows:
where,
The enthalpy porosity equation was used to simulate the melting process of the PCM. The liquid phase was represented in terms of volume fraction and calculated for each cell in the region. Liquid phase fraction was computed at each iteration based on enthalpy balance. Based on the method, the PCM melting process could be studied accurately [29].
where,
where,
where,
when
when
when
where,
Based on the calculation results of the Reynolds number, it was found that the airflow was turbulent. Therefore, the
where,
3.2 Boundary Condition and Mesh-Independent Verification
As it was a large space turbulent flow heat transfer problem, the
The Fluent-mesh software was used for meshing. The quadrilateral was selected as the type of element. Three boundary layers were applied to the surface of PCM plates. Since the flow field around the plates and the upper region of the cold storage was turbulent during the cooling release, the mesh density was refined in these areas. The PCM melting time was used as a reference for grid independence. Take the model with 64 PCM plates at the top of the cold storage as an example, and simulations were conducted for five elements number 61,190, 130,334, 255,849, 308,163, and 430,253. The complete melting time of the PCM under different grid sizes is illustrated in Fig. 3. When the element number was 308,163, the complete melting time was 16.533 h, almost the same as 16.532 h for 430,253 elements. Therefore, 308,163 elements were used for subsequent simulations. The model was further validated by comparing the cold storage wall’s theoretically calculated heat transfer power, 420.78 W, with the simulated heat transfer power, 367.37 W. The error was 14.5%, which was acceptable.
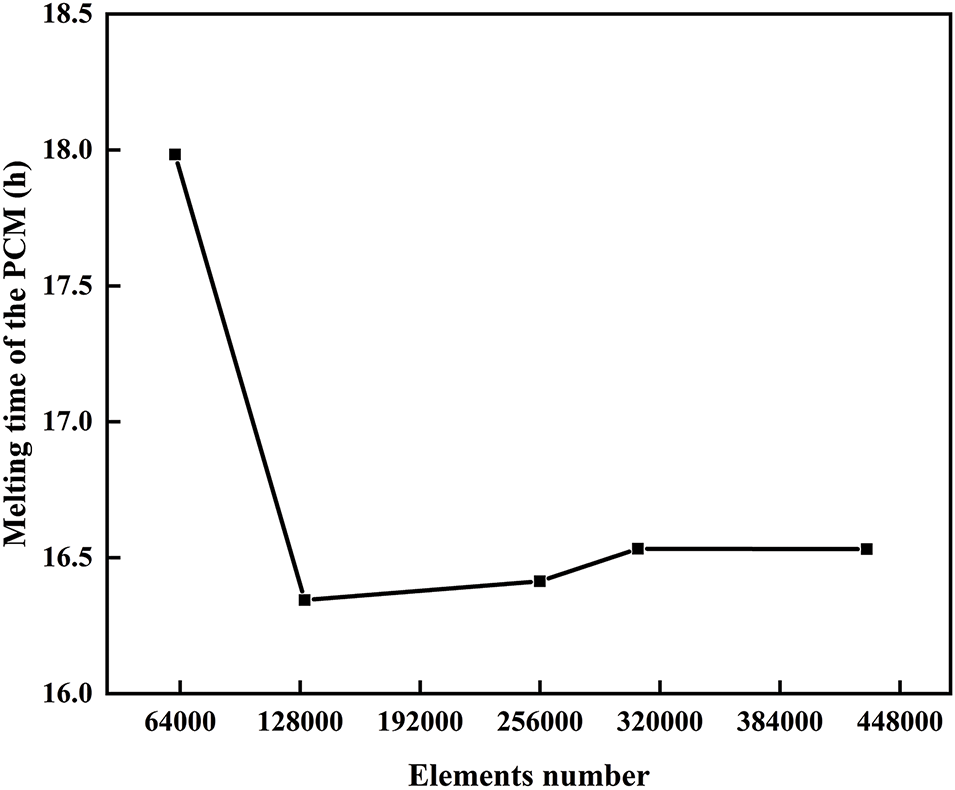
Figure 3: Grid independence verification of the PCM-based CESS
4 Numerical Simulation of the Cooling Release Process in the PCM-Based CESS
4.1 Optimum Utilization Number of the PCM Plates
During the simulation, it was considered that the outer wall of the cold storage was insulated. It was covered with a 100 mm polyurethane layer with a thermal conductivity of 0.3 W/m2 K. In cold storage, the main source of thermal energy is the heat transferred through the enclosure structure. It could be calculated as follows:
where,
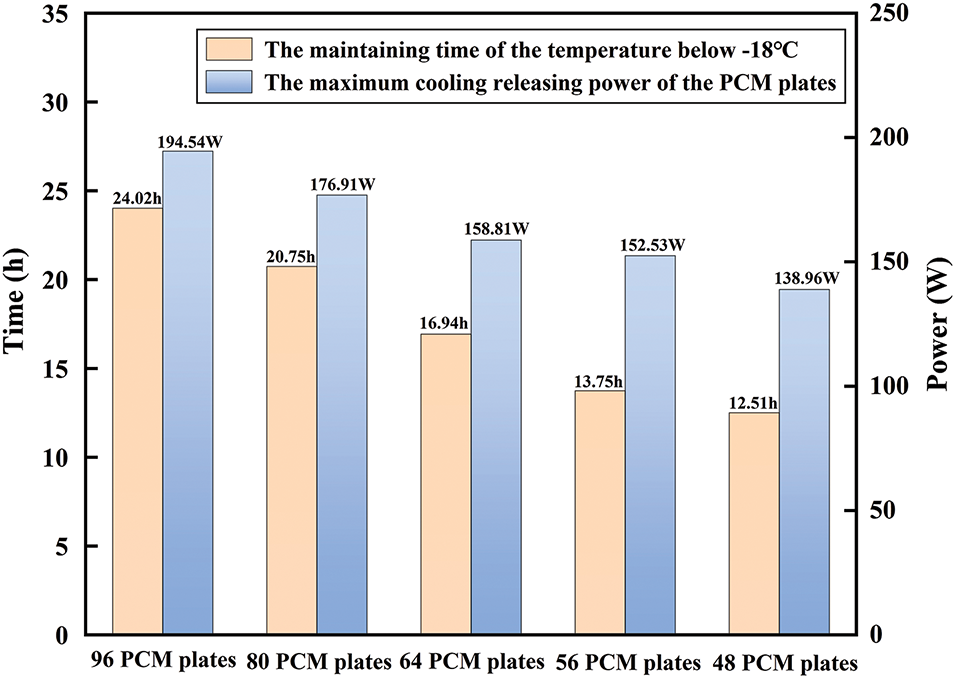
Figure 4: Comparison of different cold storage capacities
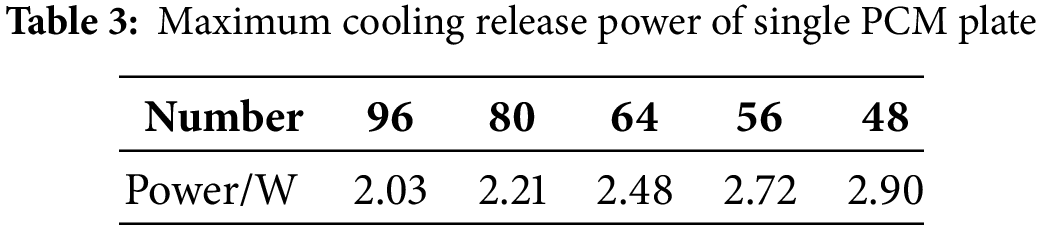
The maximum cooling release power of a single PCM plate with varying numbers of plates is shown in Table 3. It is evident that the cooling release power of a single PCM plate exhibited an opposite trend to the total cooling release power. As the number of plates decreased, the spacing between the PCM plates increased, which in turn enhanced the airflow between the plates and improved heat transfer efficiency.
Taking the arrangement of 64 PCM plates as an example, the process of cooling release was analyzed. The air velocity in the process of cooling release was shown in Fig. 5a, and the heat transfer powers of cargo, PCM plates, and cold storage walls were shown in Fig. 5b. According to the initial condition, the heat from outside flew into the cold storage suddenly at the beginning of the simulation, resulting in a severe turbulent airflow field in the cold storage. Consequently, the air velocity inside was increased rapidly from 0 to a maximum of 0.42 m/s within the first 6 min. At the same time, the heat transfer power of the cold storage walls was increased to 426 W. At one hour, the heat transfer power of the cold storage walls was stabilized at around 406 W. The heat transfer powers of cargo inside and PCM plates were 263 and 135 W, which were essentially balanced with the heat transfer power of cold storage walls (406 W). At this time, the air temperature was −18.8°C according to Fig. 5d. The liquid phase fraction and the average temperature of the PCM during the cooling release process are shown in Fig. 5c. In Fig. 5c, the temperature and the melting rate of PCM were initially increased, then remained relatively constant in the middle stage, and finally decreased towards the end. The air and cargo temperatures are shown in Fig. 5d. As the blue curve shows if only the cargo were arranged, the temperature inside would increase quickly when the chiller closed. Within 0.6 h, the air temperature without PCM plates was higher than −18°C, failing to meet the temperature control requirements. As the red cure in Fig. 5d showed, when the PCM plates were arranged in cold storage, it could effectively slow down the rate of temperature rise.
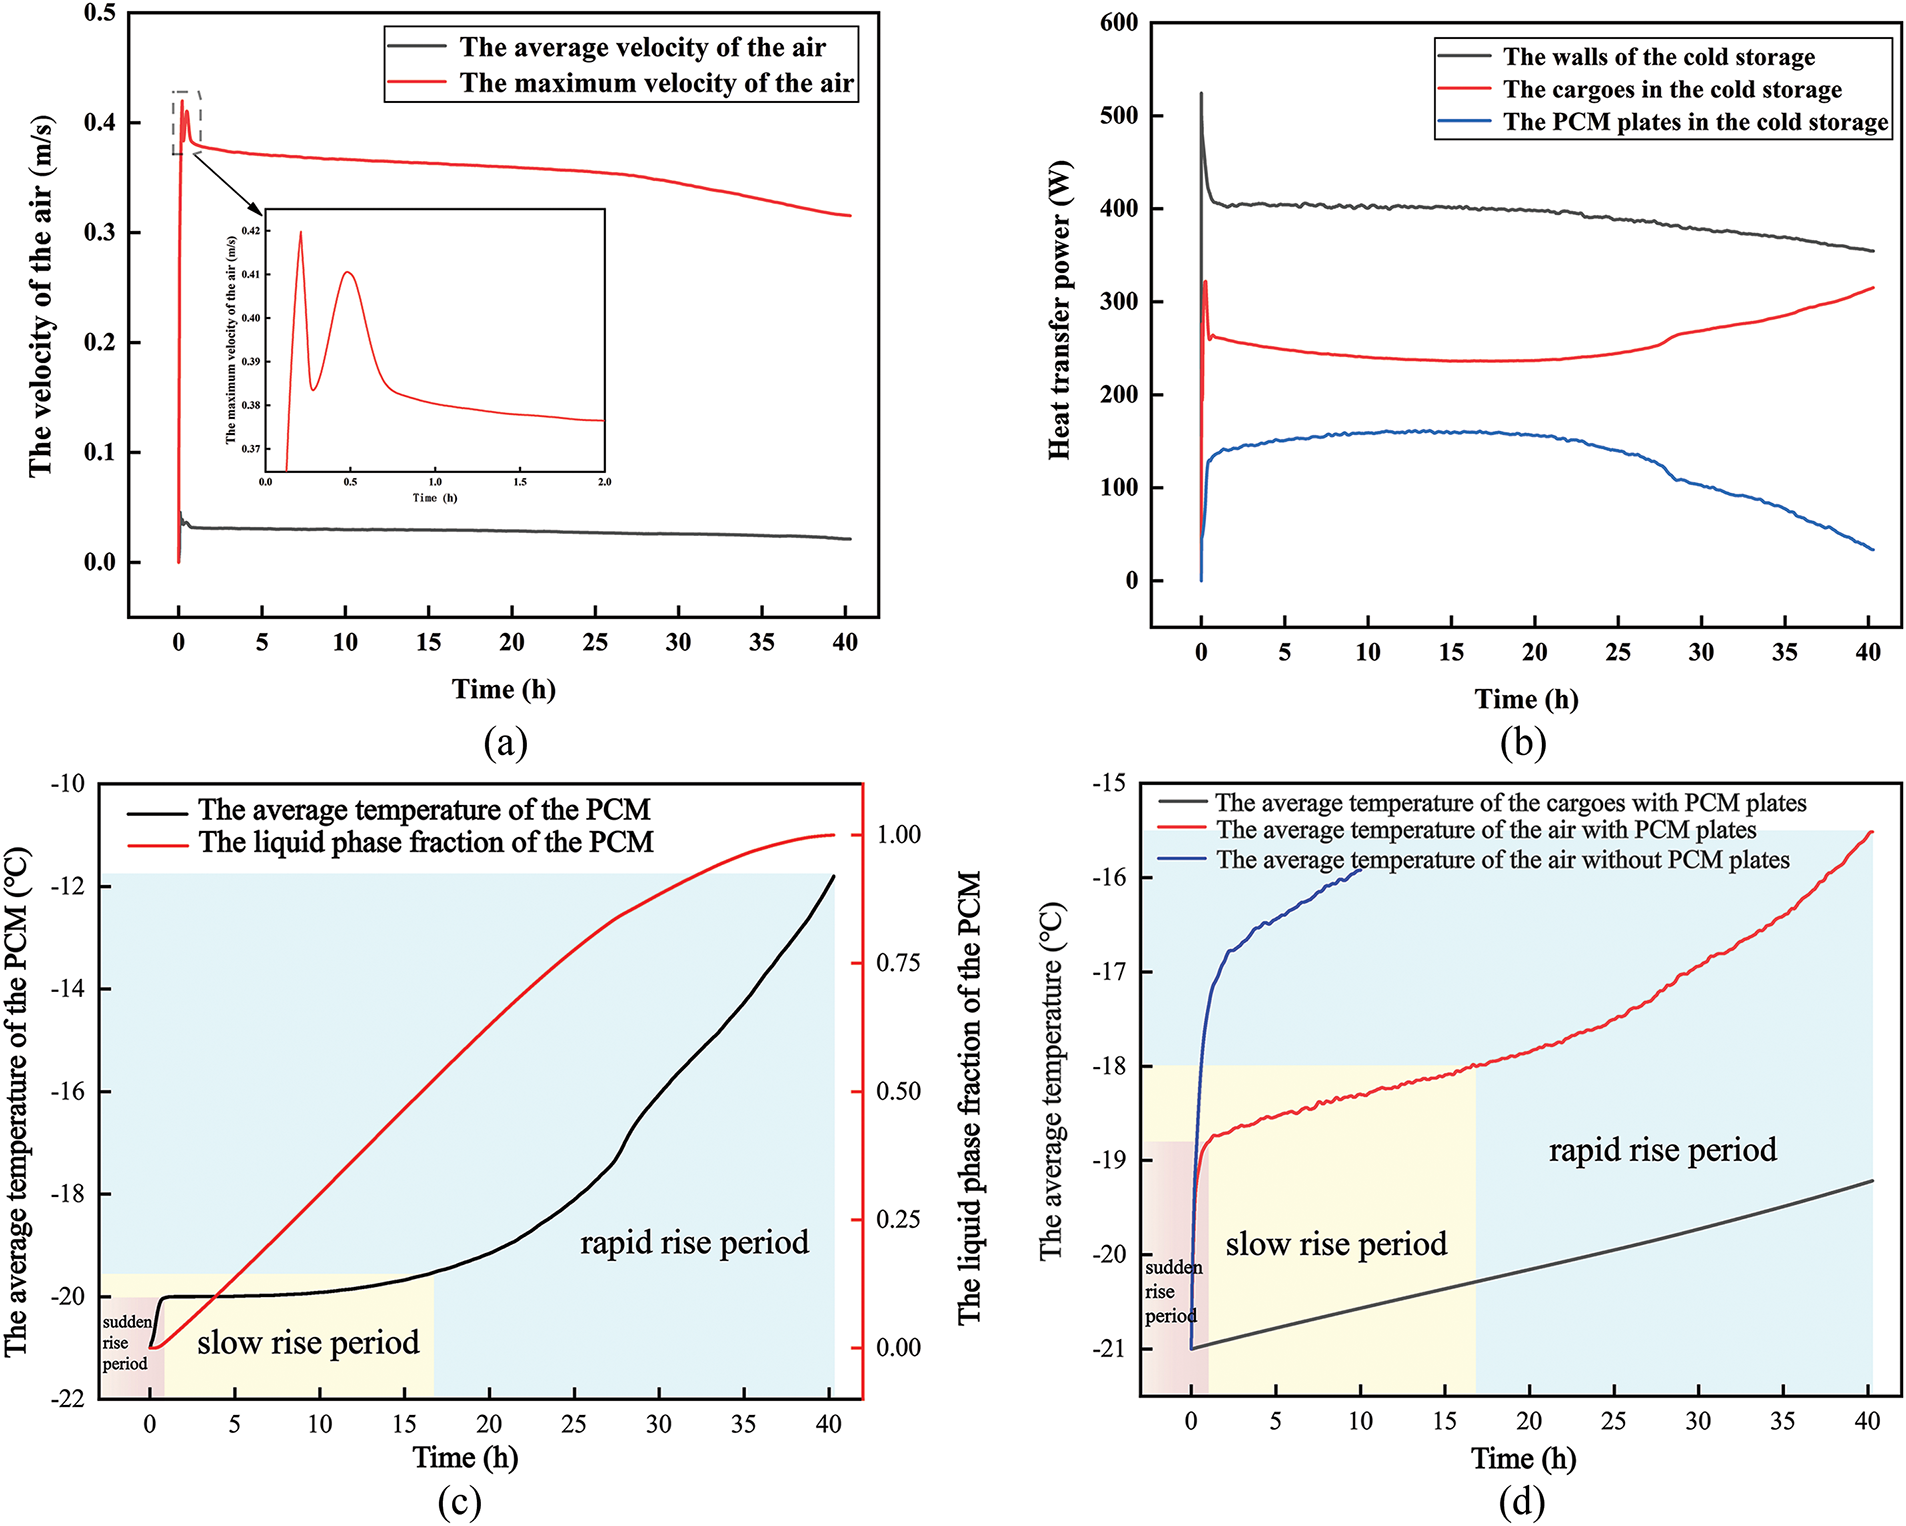
Figure 5: Results of the cooling release process in the cold storage; (a) The air velocity; (b) The heat transfer power; (c) The liquid phase fraction and average temperature of the PCM; (d) The average temperature of the cargo and air
As the red cure in Fig. 5d showed, the changing process of the air temperature can be divided into three stages. In the first stage, the temperature in the cold storage was risen suddenly from −21°C to −18.8°C within 0–1 h. It was defined as the sudden rise period. The initial cooling release temperature was °21°C, which was lower than the phase change temperature of the PCM. As the temperature of PCM plates rose to −20°C, it relied on sensible heat to keep the low temperature inside. However, the sensible heat value is much smaller than the latent heat value, which has a poor effect on temperature control. In this stage, the temperature was below the required temperature for storing cargo. Therefore, the cargo quality was not affected. The second stage was the slow rise period, in which the temperatures of air and cargo in the cold storage with PCM plates were maintained below −18°C for 16.94 h, relying on the latent heat released by the PCM plates and the intrinsic cold of the cargo. The cooling release power of PCM plates tended to be stabilized, and the amount of the PCM melted per unit time was unchanged. Because there was no severe temperature fluctuation and the duration time was relatively long, it was better to store cargo at this stage. The third stage was the rapid rise period. At this stage, most of the PCM have melted, leading to a reduction in the effective heat transfer area. Compared to the first stage, the temperature difference between the air and PCM plates was greater, but the total heat transfer power of the PCM plates was decreased due to the reduced proportion of solid PCM and the decreased effective heat exchange area of the plates. Mainly relying on the PCM sensible heat effect, the temperature control effect was not as good as when latent heat dominated, leading to a faster increase in air temperature inside the cold storage. The temperature of cargo would also be increased, which could influence the cargo quality.
4.2 Analysis of the Temperature Field and Flow Field in the Cold Storage
The temperature distribution within the cold storage at different times during the cooling release simulation process is shown in Fig. 6. The cold storage is affected by the environmental temperature and solar radiation in the actual physical process, so the heat is mainly transferred from the top and the side walls. These walls were assumed to be the main heat sources at a certain high temperature in the simulation. However, the temperature of the cargo was set as −21°C, so the surrounding air temperature was low. Because the densities of the cold and heated air flows differed, heated air along the walls rose upwards through the space between the cargo and walls of the cold storage. This movement resulted in the accumulation of a large amount of heated air at the upper part of the cold storage. Simultaneously, PCM plates began to release cold energy to maintain the surrounding air at low temperatures. The same situation occurred around the cargo. Under gravity, the cold air sunk and accumulated at the bottom, leading to a noticeable temperature stratification within the cold storage. Throughout the cooling release process, the cooing release power of the PCM plates was increased first and then decreased. During the final stage, the cooling release power was insufficient to keep the cold storage at a low temperature, which caused the upper part temperature to increase. The temperature stratification phenomenon became more pronounced in the cold storage.
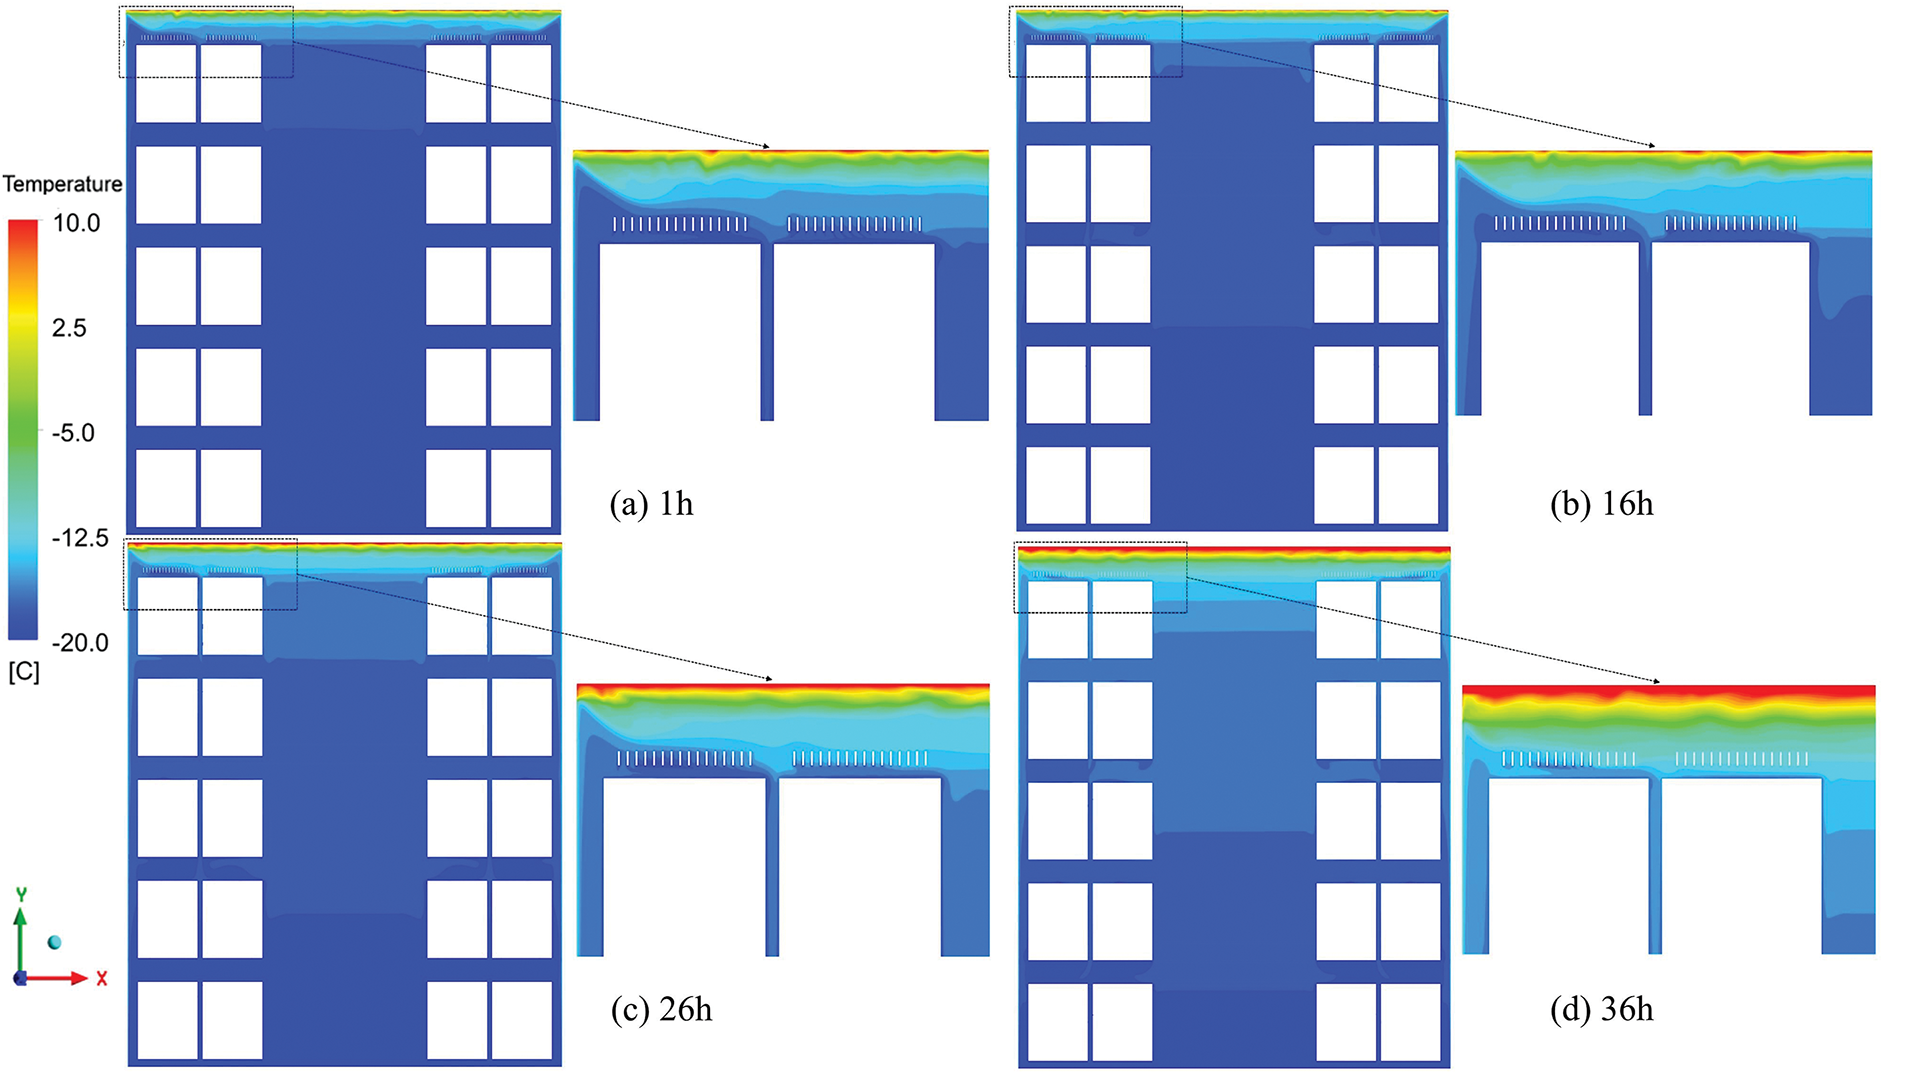
Figure 6: Cloud plots of air temperature at different times in the cold storage; (a) 1 h; (b) 16 h; (c) 26 h; (d) 36 h
The vector of air velocity at different times is illustrated in the following figure. As the structure of the model and the initial boundary conditions were symmetric, the velocity field inside was also approximately symmetric. The high airflow velocities within the cold storage were primarily concentrated in the spaces between the cargo and the walls, gaps between the cargo, and around the PCM plates. This was because as the heat entered inside from the sidewalls, the cold and heated airflows interacted, which led to a great increase in turbulence in the narrow space near the sidewalls. At the same time, the heated airflow was moved upward along the sidewalls. When it reached the top of the cold storage, the airflow was moved toward the center along the arrangement of PCM plates. The heated and cold air interaction around the plates led to severe airflow turbulence. Similarly, some heated air was flown into the gaps between cargo, resulting in high airflow velocity.
From Fig. 7a, it was found that the airflow velocity was faster between the center of the cold storage and the fourth layer of cargo. As the airflow moved along the PCM plates toward the center, the air was flown downward through the gaps between the top layer of cargo when it passed over the PCM plate modules near the sidewalls. While the heated air flew upwards along the sidewalls and into the gaps between the fourth and fifth layers of cargo, it was directed toward the center of the cold storage. These two airflows interacted in the gaps, creating a vortex airflow. Then, parts of the air were flown down through the gaps towards the center, creating turbulence around the fourth cargo layer. From Fig. 7d, we know that the airflow velocity decreased at the end of the cooling release process. This was because the air temperature around the PCM plates was increased. It resulted in a reduction of turbulence near the fourth layer of cargo.
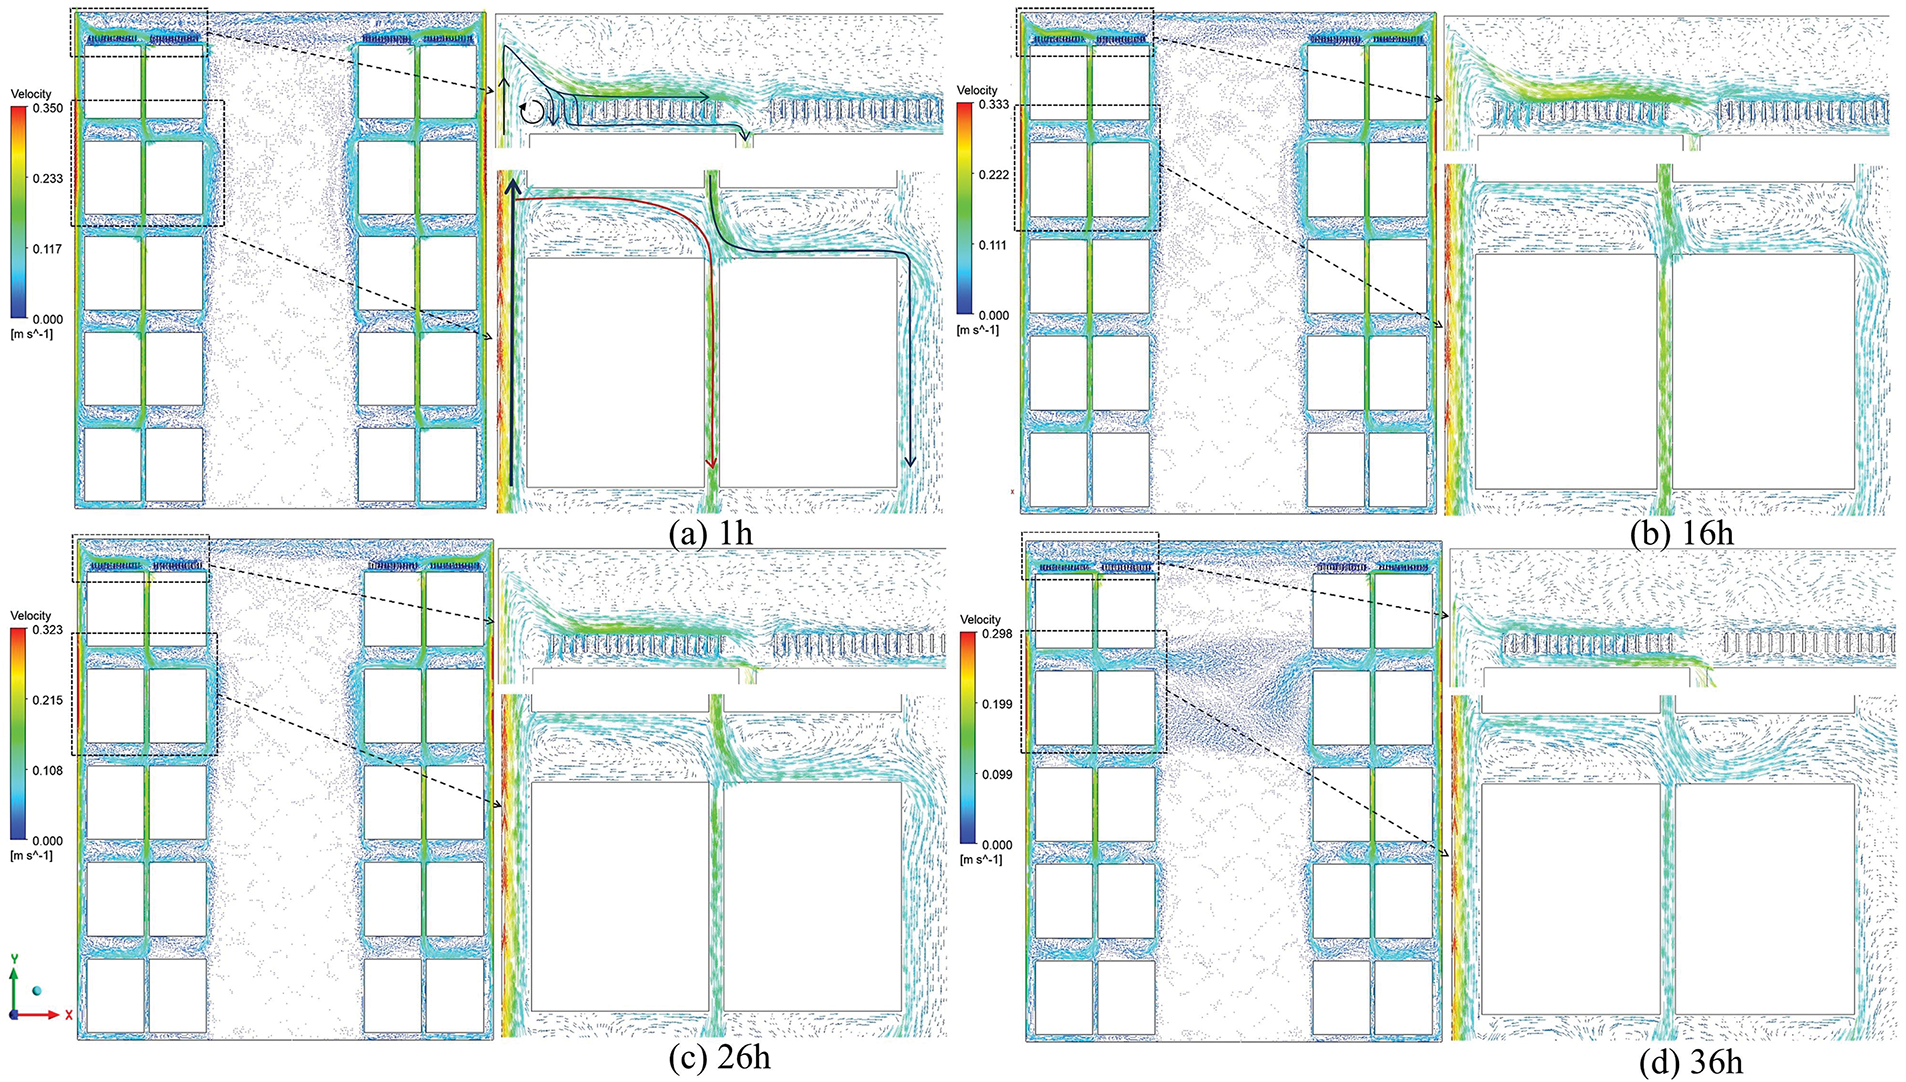
Figure 7: Velocity vector of air in the cold storage at different times; (a) 1 h; (b) 16 h; (c) 26 h; (d) 36 h
4.3 Analysis of Dynamic Cooling Release Characteristics of PCM Plates
The dynamic cooling release process of PCM plates can be categorized into the following stages: (1) 0–1 h, the temperature of PCM plates rose from −21°C to −20°C. The plates began to melt. (2) 1–16 h, the cooling release power of the PCM plates reached its maximum value of 159 W. At 16 h, the overall liquid fraction of the PCM was 50%. (3) 16–26 h, the cooling release power of the PCM plates decreased slightly, and the plates continued to melt. It took 26 h to reach a state with a liquid fraction of 80%, which indicated that the cooling release had ended. (4) 26–36 h, the cooling release power of the plates was decreased significantly. At 36 h, the liquid fraction was 97.35%, representing the completely melted PCM.
The melting cloud of PCM plates at different times is shown in Fig. 8. It can be seen that the PCM plate modules near the center melted faster than those at the sidewalls. Additionally, the PCM plates closer to the center were melted first and quickly. For the PCM plate modules at the sidewalls, the plates close to the center modules were melted first, followed by the ones closer to the cold storage walls. The middle plates in the module near the sidewalls melt slowly, resulting in faster melting on the sides and slower melting in the middle. Most of the PCM had melted at the 36 h. However, the lower part of the middle plates in the modules near the walls did not melt. According to Fig. 7, the airflow velocity around the modules on both sides was higher, which caused the heated air to pass over the plates rapidly. As the airflow moved toward the center of the cold storage, the velocity gradually decreased, around 0.1 m/s near the module at the center. As a result, more heated air was concentrated at the center. Furthermore, the heat exchange was more efficient between PCM plates and the heated air, which led to a faster melting trend of the module at the center. Because the direction of the rising heated air was changed at the top of the cold storage, vortex turbulence was formed between the sidewalls and the PCM plates near the walls, which enhanced the heat transfer effectiveness. This was also why the PCM plates near the walls melted faster than those in the middle for the PCM plate modules near the sidewalls.
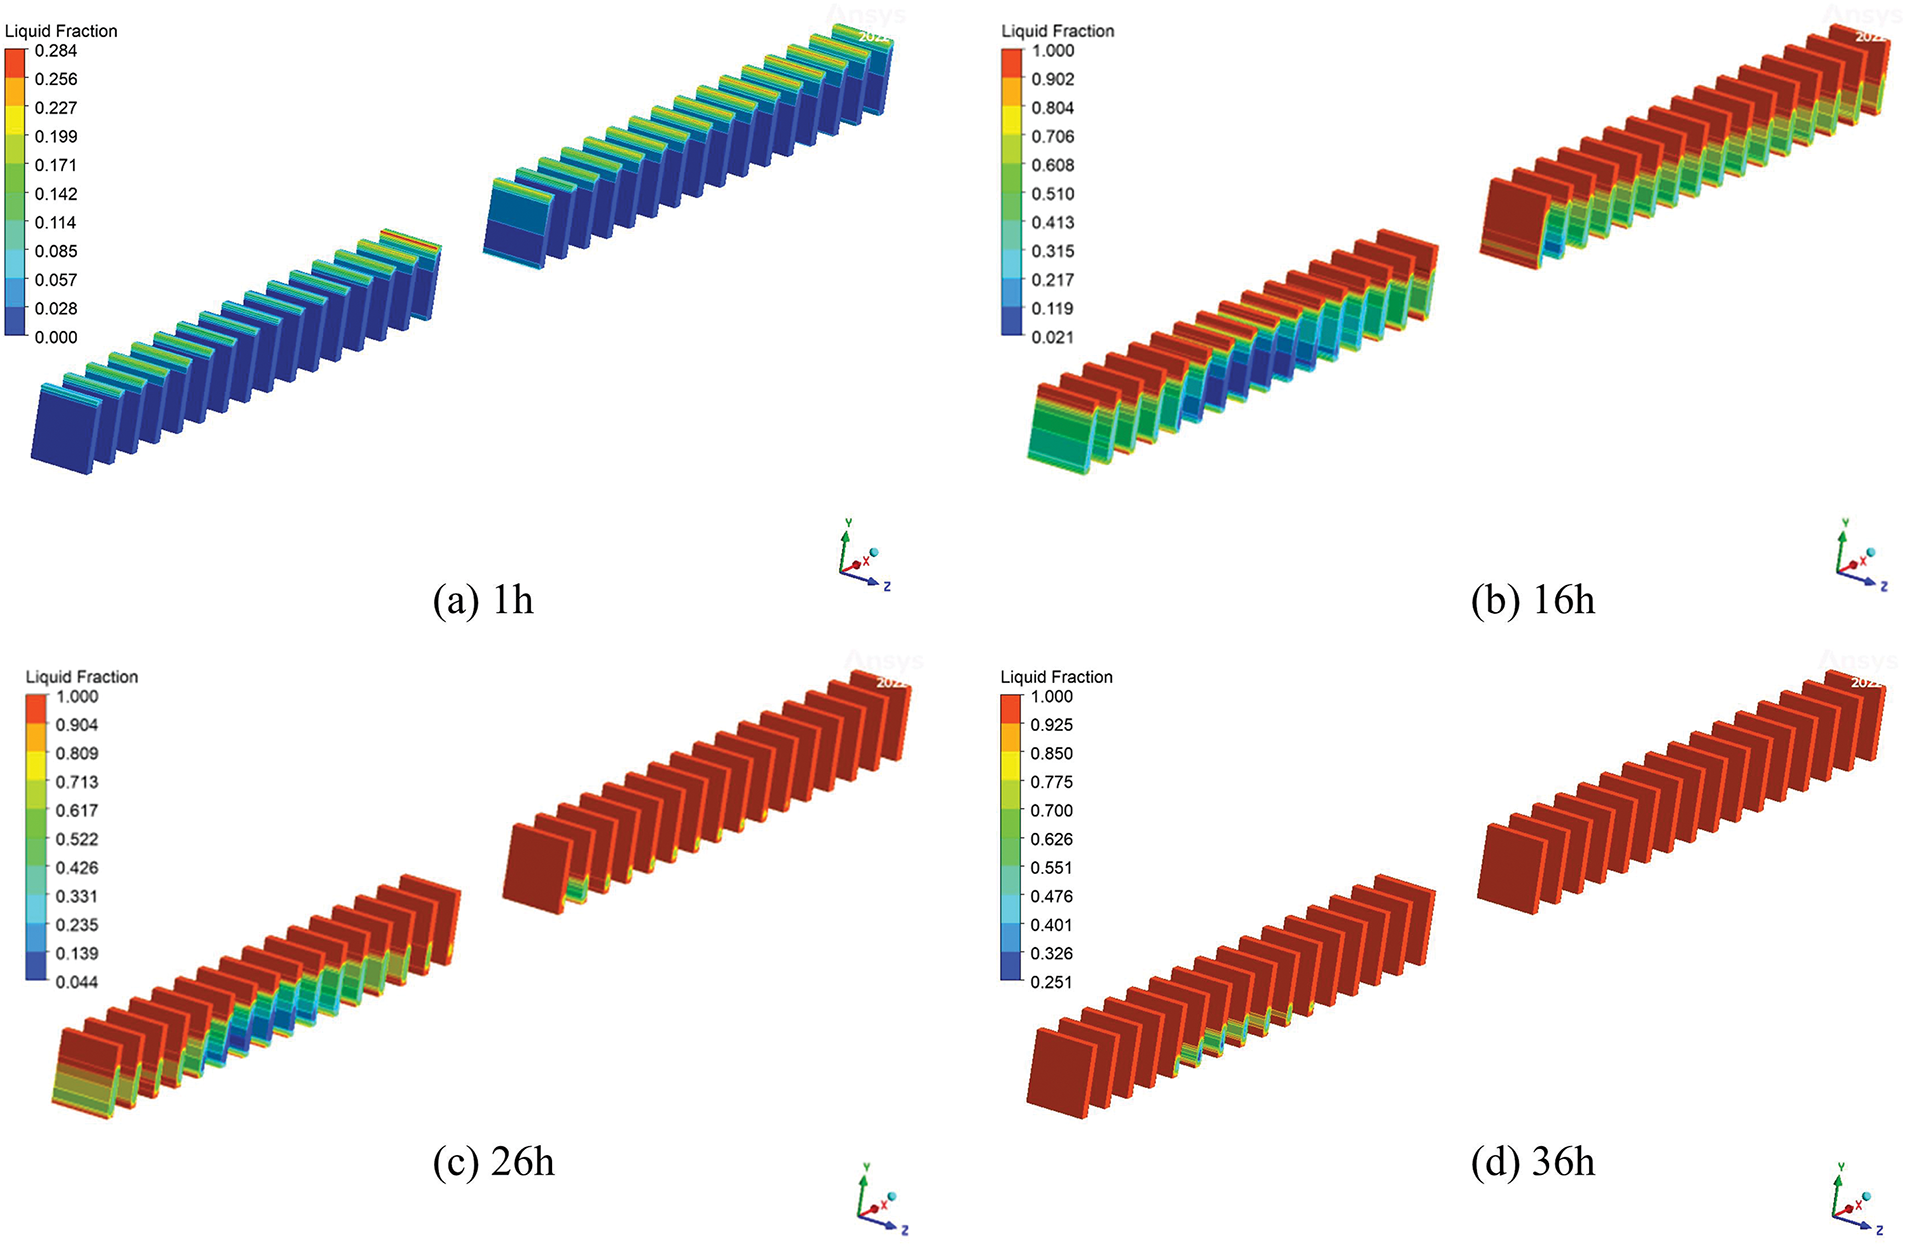
Figure 8: Liquid phase fraction of PCM at different times; (a) 1 h; (b) 16 h; (c) 26 h; (d) 36 h
The temperature cloud of the PCM plates at different times is shown in Fig. 9. As shown in Fig. 9a, at one hour, the maximum temperature of the melted part of the PCM was −19.61°C, which was close to the phase change temperature. Due to the sensible heat transfer, the temperature of the melted part continued to increase rapidly. In Fig. 9d, at 36 h, the highest temperature of melted PCM was −11.66°C. The melting phenomenon was further analyzed based on Figs. 6 and 7. In the upper part, the air temperature around the modules on both sides was lower than near the center. From Fig. 6, we can see that after 16 h, the temperature inside, especially the temperature of the air at the top, increased rapidly. It was because the melting fraction of PCM was more than 50% at that moment, and the cooling release power of PCM plates was insufficient to keep the temperature below −18°C. The heat was exchanged greatly between the melted PCM at the top of the plates and the high-temperature air at the top of the cold storage. It could accelerate the temperature rising speed and lead to larger temperature differences between the top and the bottom of the PCM plates. Therefore, the melting fraction was not uniform. After 26 h, the phenomenon became more obvious.

Figure 9: Temperature plots of PCM at different times; (a) 1 h; (b) 16 h; (c) 26 h; (d) 36 h
4.4 Analysis of Factors Influencing the Cooling Release
4.4.1 The Influence of the Positions of the PCM Plates on the Cooling Release
In reality, sometimes there is not enough space at the top of the cold storage, or the space is occupied with cargo. Therefore, the PCM plates should be placed at the interlayer of the fourth and fifth layers of cargo rather than the top. The cooling release process and the temperature control effect when PCM plates were arranged at the interlayer were analyzed. The results of the analysis are presented in Fig. 10.
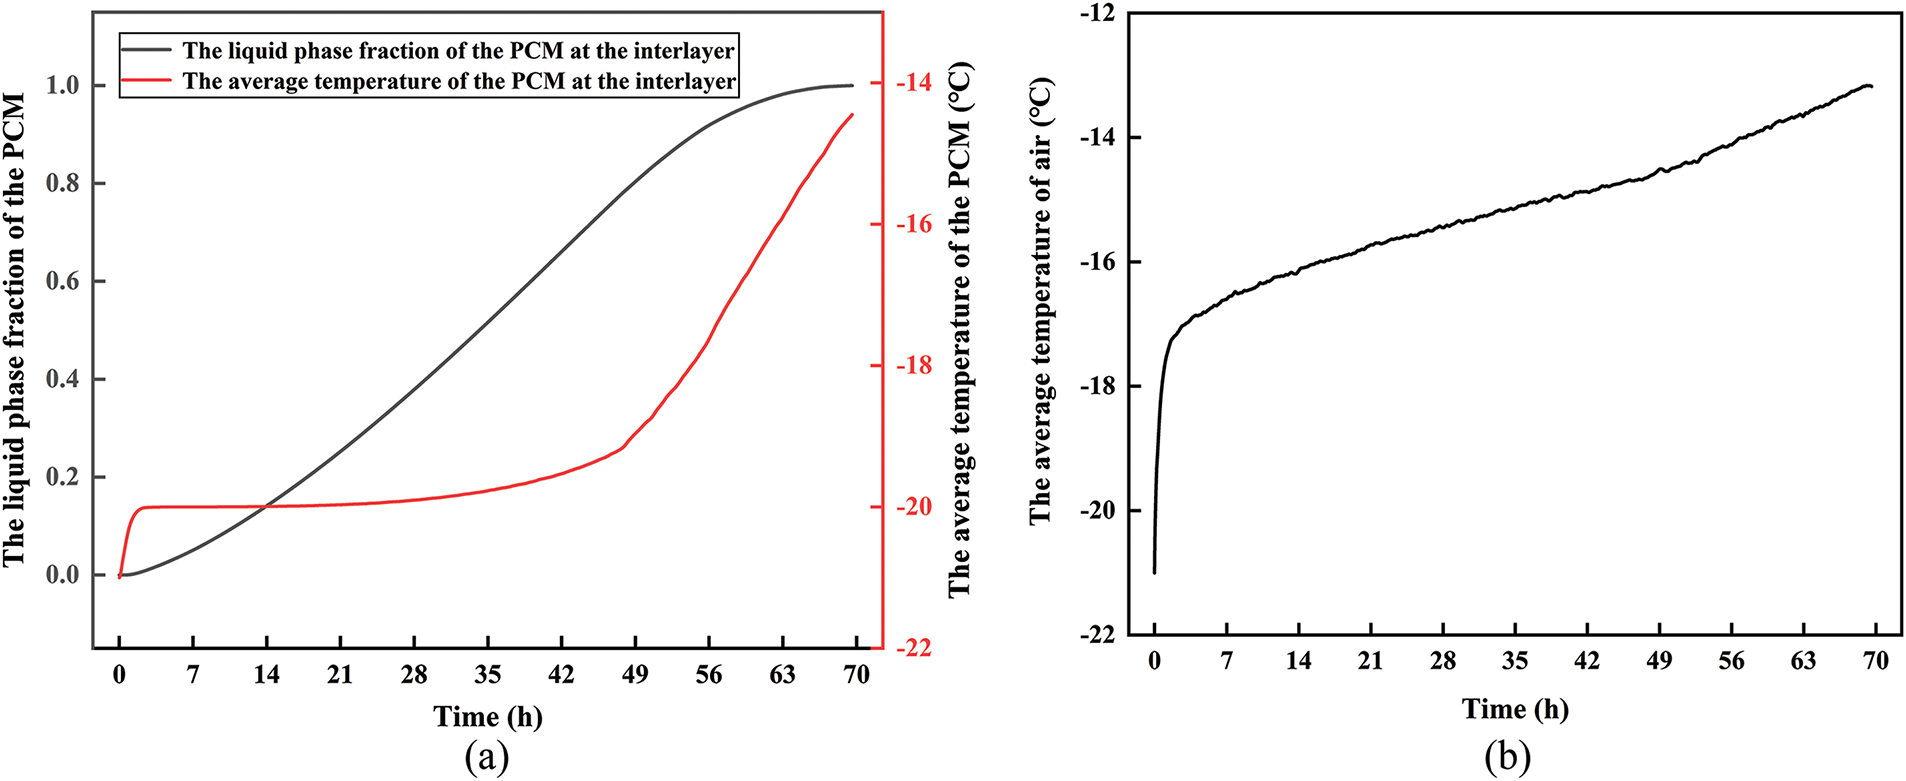
Figure 10: Analysis results when the PCM plates placed at the interlayer with cargo above; (a) The average temperature and liquid phase fraction of the PCM; (b) The average temperature of the air in the cold storage
As shown in Fig. 10b, the air temperature rose from −21°C to −17°C within the first two hours and stabilized at −15°C until 37 h. According to Fig. 10a, the melting time for the PCM plates was almost 70 h indicating that the cold energy could not be released in time, leading to a poor temperature control effect. Because the fifth layer was occupied with cargo, it was unlikely to exchange heat between PCM plates placed at the interlayer and the heated air at the top. Simultaneously, the air temperature at the interlayer was lower due to the cold energy of the cargo, resulting in a small temperature difference. According to Fourier law, the cooling release power of the PCM plates was also small. In order to analyze the influence of the positions of the PCM plates on the cooling release, the simulation was performed after the fifth layer of cargo was removed. The cooling release power and liquid phase fraction of the PCM were key performance indications. The comparison results at various times, based on different plate positions, are shown in Fig. 11.
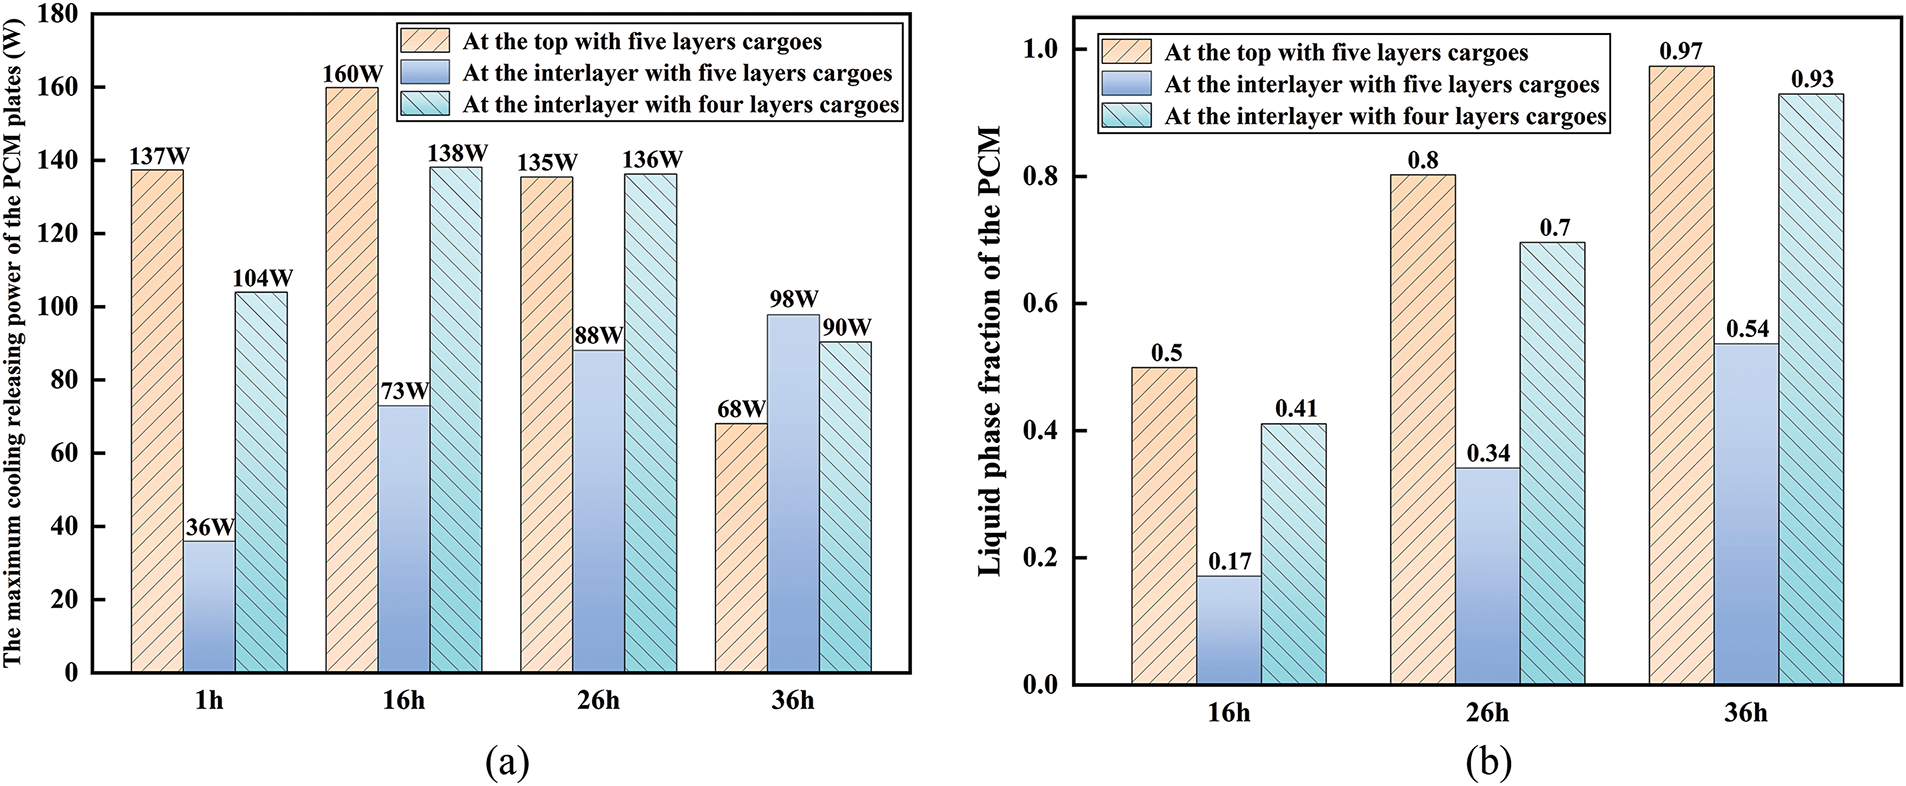
Figure 11: The comparison results when the plates were arranged at different positions; (a) Cooling release power of the PCM plates; (b) PCM liquid phase fraction
In Fig. 11, the cooling release power of PCM plates at the interlayer was 36 W at one hour, which was only 25% of that when the plates were arranged at the top. At 16 h, the cooling release power of the plates was also less than 50% of that at the top. However, when the fifth layer of cargo was removed, the cooling release power of the plates was increased greatly. This was because when there was no cargo, the heat was transferred more greatly between PCM plates and heated air on the top. The increased temperature difference further enhanced the heat transfer rate. In addition, the air temperature rose from −21°C to −15°C in the first 1.2 h, which cannot meet the temperature requirements. Therefore, arranging the PCM plates at the top of the cold storage or in the interlayer without cargo above them was better.
4.4.2 The Influence of the Thickness of the PCM Plates on the Cooling Release
To keep the cold storage temperature below −18°C for 16 h, it was essential to ensure that the cold energy of the PCM plates was released fully and timely. However, as shown in Table 4, the cooling release power of a single PCM plate was low. The spacing between the PCM plates had little impact on the cooling release power. Additionally, the complete melting time of the PCM plates was too long. To improve the effectiveness of the cooling release, we try to enlarge the heat transfer area of the PCM plates by adding patterns to the surface. However, the impact was limited, and the process was complex. Therefore, it was considered that the thickness of the PCM plates should be decreased from 15 to 7.5 mm and that the PCM plate number should be doubled to enlarge the total heat transfer area in this paper. The heat transfer area of each PCM plate remained largely unchanged, and the total volume of PCM was kept constant. When the PCM plates were arranged at the top of the cold storage, the comparison results of 7.5 mm PCM plates (the number 112) and 15 mm PCM plates (the number 56) were shown as follows.
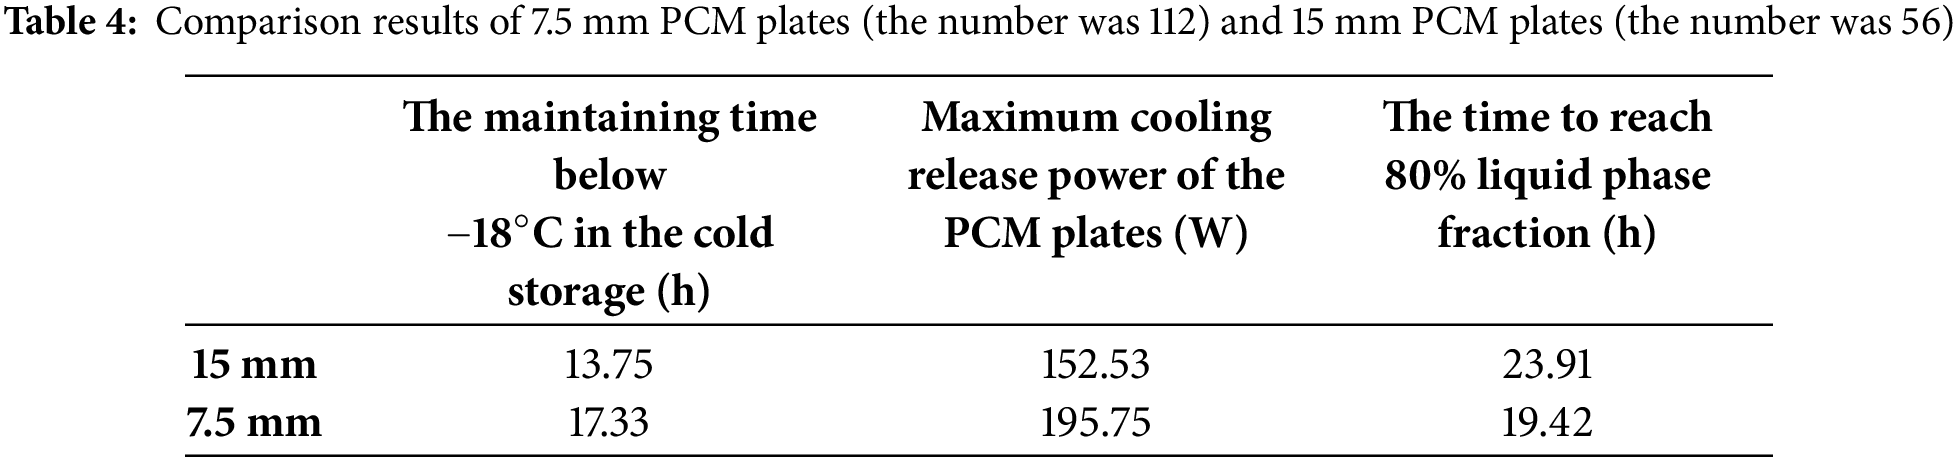
When the 7.5 mm PCM plates were fully placed at the top, it could maintain the temperature below −18°C for 17.33 h. Additionally, the PCM liquid phase fraction reached 80% within 19.42 h. The cooling release was more timely and sufficient than 15 mm PCM plates.
Additionally, the impact of the fifth layer of cargo was investigated. To maintain a constant spacing between the PCM plates, half of the plates were placed in the interlayer between the fourth and fifth layers, while the other half were positioned at the top. The cooling release results for the 7.5 mm PCM plates are shown in Fig. 12.
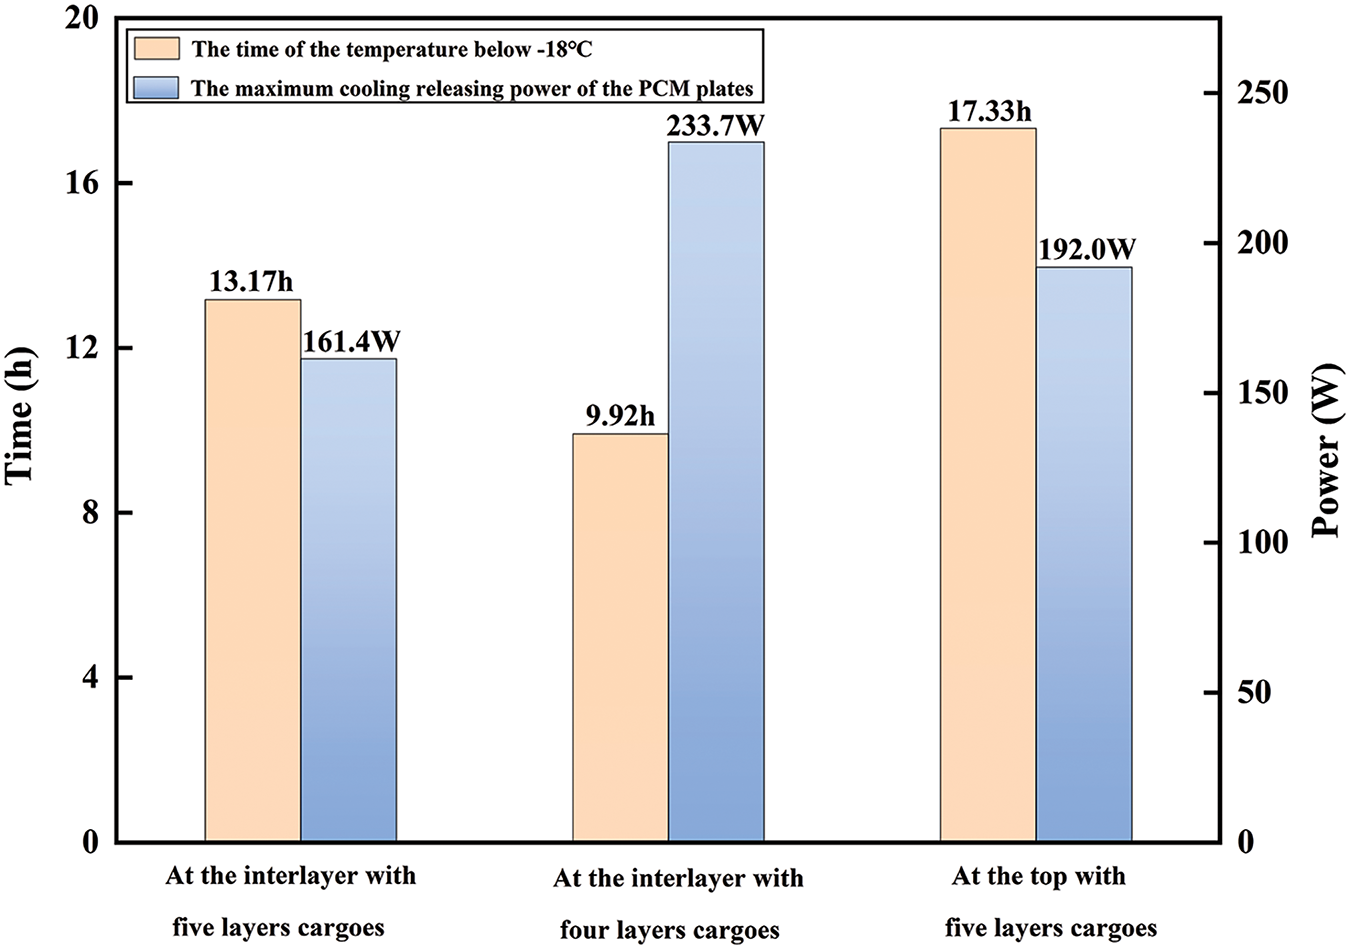
Figure 12: Comparison of cooling release of 7.5 mm PCM plates at different positions
In Fig. 12, the time for maintaining the temperature inside below −18°C was 13.17 h when one-half of the 7.5 mm PCM plates were placed at the interlayer of the fourth and fifth layers, and the other half was placed at the top. The maximum cooling release power of the PCM plates arranged at the top was 134 W, similar to those of 15 mm thick PCM plates. The maximum cooling release power of the PCM plates positioned at the interlayer of the fourth and fifth layers was 70 W, which poorly affected the cooling release. After removing the fifth layer of cargo, the cooling release power provided by PCM plates was still sufficient to maintain the cold storage temperature below the required level for 9.92 h. It can be concluded that the cooling release effect of the PCM-based CESS was strongly dependent on the heat transfer area of PCM plates.
A Phase Change Material (PCM)-based cold energy storage system (CESS) can effectively harness peak and off-peak power resources, reducing excessive dependence on the power grid and energy consumption. In this paper, a PCM-based CESS was designed for large-scale applications, specifically focusing on cold storage. Using the cold storage system as a case study, the performance of cooling release and temperature control was analyzed through numerical simulations. The impacts of different arrangement positions and thicknesses of the PCM plates on the cooling release effects were also investigated. The following conclusions were drawn:
1. Arranging 64 PCM plates at the top of the cold storage allowed the temperature to remain below −18°C for 16.94 h, meeting the temperature control requirements while maximizing economic benefits. During the cooling release process, temperature stratification occurred within the cold storage.
2. The melting of the PCM plates was uneven. Plates near the center of the cold storage melted first, while those near the sidewalls showed a more varied melting pattern, with the side plates melting faster than the ones in the middle. The melting progressed from top to bottom. As the cooling release process continued, the temperature difference within the PCM plates was increased, and the effective heat exchange was reduced.
3. The placement and heat transfer area of the PCM plates significantly affected the cooling release performance. The cooling release power of PCM plates arranged in the interlayers was only 50% of that of plates placed at the top, and their complete melting time was twice as long. By reducing the thickness of the PCM plates (while maintaining the total PCM mass), the heat transfer area was increased, significantly enhancing the cooling effect. When the thickness of the PCM plates was reduced from 15 to 7.5 mm, the maintaining time below −18°C increased by 26.1%, and the time to reach 80% liquid phase fraction decreased by 18.8%.
The findings suggest that PCM-based cold energy storage systems have considerable potential for improving temperature control efficiency. Future research should focus on enhancing the cooling performance by optimizing the structure, material properties, and operational strategies of PCM-based CESS to achieve even better results.
Acknowledgement: The authors appreciated the invaluable support from Heatmate New Energy Technology Co., Ltd.
Funding Statement: The work was supported by National Natural Science Foundation of China (Nos. 51806092, 52201410), Non-Carbon Energy Conversion and Utilization Institute under the Shanghai Class IV Peak Disciplinary Development Program, High-End Foreign Experts Recruitment Plan of China (G2022013028L).
Author Contributions: The authors confirm contribution to the paper as follows: Conceptualization, Hai Hong, Jiongyong Cai, Zhengrong Shi; methodology, Hai Hong, Yanming Shen, Jiongyong Cai; investigation, Hai Hong, Yanming Shen, Jiongyong Cai; writing—original draft preparation, Hai Hong, Zhengrong Shi, Jingyong Cai; writing—review and editing, Hai Hong, Jiongyong Cai. All authors reviewed the results and approved the final version of the manuscript.
Availability of Data and Materials: The data presented in this study are available on request from the corresponding author.
Ethics Approval: Not applicable.
Conflicts of Interest: The authors declare no conflicts of interest to report regarding the present study.
References
1. CCAC. 2022 cold chain logistics market scatter gram [Internet], Bejing, China; 2022 [cited 2024 Jan 14]. Available from: http://lenglianwuliu.org.cn/menu/details.html?menuId=78. [Google Scholar]
2. Evans JA, Foster AM, Huet JM, Reinholdtblg L, Fikiin K, Zilio C, et al. Specific energy consumption values for various refrigerated food cold stores. Energy Build. 2014;74:141–51. doi:10.1016/j.enbuild.2013.11.075. [Google Scholar] [CrossRef]
3. Chourasia MK, Goswami TK. Simulation of effect of stack dimensions and stacking arrangement on cool-down characteristics of potato in a cold store by computational fluid dynamics. Biosyst Eng. 2007;96(4):503–15. doi:10.1016/j.biosystemseng.2006.12.010. [Google Scholar] [CrossRef]
4. Ho SH, Rosario L, Rahman MM. Numerical simulation of temperature and velocity in a refrigerated warehouse. Int J Refrig. 2010;33(5):1015–25. doi:10.1016/j.ijrefrig.2010.02.010. [Google Scholar] [CrossRef]
5. Jing YY. Dynamic model and simulation of cold air machine for mini-cold storage. Cryogenics. 2008;5:61–5. [Google Scholar]
6. Bista S, Hosseini SE, Owens E, Phillips G. Performance improvement and energy consumption reduction in refrigeration systems using phase change material (PCM). Appl Therm Eng. 2018;142:723–35. doi:10.1016/j.applthermaleng.2018.07.068. [Google Scholar] [CrossRef]
7. Huang Y, Zhang X. Research progress of the application of cold storage technology in food cold chain logistics. Pack Eng. 2015;15:23–9. [Google Scholar]
8. Xu XX, Zhang XL. Simulation and experimental investigation of a multi-temperature insulation box with phase change materials for cold storage. J Food Eng. 2020;292(109):1–9. doi:10.1016/j.jfoodeng.2020.110286. [Google Scholar] [CrossRef]
9. Wahid MA, Hosseini SE, Hussen HM, Akeiber HJ, Saud SN, Mohammad AT, et al. An overview of phase change materials for construction architecture thermal management in hot and dry climate region. Appl Therm Eng. 2017;112(2):1240–59. doi:10.1016/j.applthermaleng.2016.07.032. [Google Scholar] [CrossRef]
10. Zhao Y, Zhang X, Xu X, Zhang S. Research progress of phase change cold storage materials used in cold chain transportation and their different cold storage packaging structures. J Mol Liq. 2020;319(9):1–13. doi:10.1016/j.molliq.2020.114360. [Google Scholar] [CrossRef]
11. Oró E, De Gracia A, Castell A, Farid MM, Cabeza LF. Review on phase change materials (PCMs) for cold thermal energy storage applications. Appl Energy. 2012;99:513–33. doi:10.1016/j.apenergy.2012.03.058. [Google Scholar] [CrossRef]
12. Zalba B, Marin JM, Cabeza LF, Mehling H. Review on thermal energy storage with phase change: materials, heat transfer analysis and applications. Appl Therm Eng. 2003;23(3):251–83. doi:10.1016/S1359-4311(02)00192-8. [Google Scholar] [CrossRef]
13. Inaba H, Morita S. Flow and cold heat-storage characteristics of phase-change emulsion in a coiled double-tube heat exchanger. ASME J Heat Transfer. 1995;117(2):440–6. doi:10.1115/1.2822541. [Google Scholar] [CrossRef]
14. Yang L, Villalobos U, Akhmetov B, Gil A, Khor JO, Palacios A, et al. A comprehensive review on sub-zero temperature cold thermal energy storage materials, technologies, and applications: state of the art and recent developments. Appl Energy. 2021;288(49):1–43. doi:10.1016/j.apenergy.2021.116555. [Google Scholar] [CrossRef]
15. Li G, Hwang Y, Radermacher R, Chun HH. Review of cold storage materials for subzero applications. Energy. 2013;51(9):1–17. doi:10.1016/j.energy.2012.12.002. [Google Scholar] [CrossRef]
16. Ndanduleni C, Huan Z. Review on phase change materials for sub-zero temperature application in transport refrigeration. Suid-Afrik Tydskr Vir Nat En Tegnol. 2019;38:1–10. [Google Scholar]
17. Veerakumar C, Sreekumar A. Phase change material based cold thermal energy storage: materials, techniques and applications—a review. Int J Refrig. 2016;67:271–89. doi:10.1016/j.ijrefrig.2015.12.005. [Google Scholar] [CrossRef]
18. Xia QG, Liu BL, Song XY. Design and experimental verification of a new type of refrigerated vehicle model. J Refrigerat. 2014;35(4):108–12. [Google Scholar]
19. You H, Sun J, Xie J. Numerical simulation and experimental verification of a small refrigerated warehouse with PCM plates. Energy Rep. 2022;8(5):15040–7. doi:10.1016/j.egyr.2022.11.048. [Google Scholar] [CrossRef]
20. Xie R, Tang H, Tao W, Liu G, Liu K, Wu J. Optimization of cold-plate location in refrigerated vehicles based on simulation and test of no-load temperature field. Transact Chin Soc Agricul Eng. 2017;33(24):290–8. [Google Scholar]
21. Cao Z, Zhang G, Wang Z, Yin M. Heat transfer performance analysis of phase change material-based latent heat storage unit based on river water source. J Energy Storage. 2024;97(2):1–20. doi:10.1016/j.est.2024.112972. [Google Scholar] [CrossRef]
22. Cao Z, Zhang G, Wu Y, Yang J, Sui Y, Zhao X. Energy storage potential analysis of phase change material (PCM) energy storage units based on tunnel lining ground heat exchangers. Appl Therm Eng. 2023;235(4–6):121403. doi:10.1016/j.applthermaleng.2023.121403. [Google Scholar] [CrossRef]
23. Zarajabad OG, Ahmadi R. Numerical investigation of different PCM volume on cold thermal energy storage system. J Energy Storage. 2018;17(8):515–24. doi:10.1016/j.est.2018.04.013. [Google Scholar] [CrossRef]
24. Guo J, Lin J, Jiang Y, Mei S, Xia J, Lin S, et al. Numerical analysis of cold energy release process of cold storage plate in a container for temperature control. J Energy Storage. 2023;71(4):1–11. doi:10.1016/j.est.2023.108230. [Google Scholar] [CrossRef]
25. Liang Y, Yang H, Wang H, Bao X, Cui H. Enhancing energy efficiency of air conditioning system through optimization of PCM-based cold energy storage tank: a data center case study. Energy. 2024;286(1):1–15. doi:10.1016/j.energy.2023.129641. [Google Scholar] [CrossRef]
26. Yang T, Sun Q, Wennersten R. The impact of refrigerant inlet temperature on the ice storage process in an ice-on-coil storage plate. Energy Proc. 2018;145(1):82–7. doi:10.1016/j.egypro.2018.04.014. [Google Scholar] [CrossRef]
27. Wang F. Design and experimental study of small mobile fresh preservation storage based on phase change cold storage technology [master’s thesis]. Zhejiang, China: Zhejiang University of Science and Technology; 2021. [Google Scholar]
28. Wu LY. Study and economic analysis of cool storage technology using phase change material in refrigerating houses [master’s thesis]. Beijing, China: Chinese Academy of Sciences; 2012. [Google Scholar]
29. Mishra G, Memon A, Gupta AK, Nirmalkar N. Computational study on effect of enclosure shapes on melting characteristics of phase change material around a heated cylinder. Case Stud Therm Eng. 2022;34(9):1–15. doi:10.1016/j.csite.2022.102032. [Google Scholar] [CrossRef]
30. Karami R, Kamkari B. Investigation of the effect of inclination angle on the melting enhancement of phase change material in finned latent heat thermal storage units. Appl Therm Eng. 2019;146:45–60. doi:10.1016/j.applthermaleng.2018.09.105. [Google Scholar] [CrossRef]
31. Soodmand AM, Nejatbakhsh S, Pourpasha H, Aghdasinia H, Heris SZ. Simulation of melting and solidification process of polyethylene glycol 1500 as a PCM in rectangular, triangular, and cylindrical enclosures. Alex Eng J. 2022;61(11):8431–56. doi:10.1016/j.aej.2022.02.011. [Google Scholar] [CrossRef]
32. Liang H, Chen G, Xie J, Ying W, Cheng Z. Numerical simulation of phase change cold storage plates with different packaging structures used in cold storage. Food Machin. 2024;40:135–9. doi:10.13652/j.spjx.1003.5788.2023.80457. [Google Scholar] [CrossRef]
33. Zhuang YM. The design of refrigeration plants. Xiamen, China: Xiamen University Press; 2017. [Google Scholar]
Cite This Article
 Copyright © 2025 The Author(s). Published by Tech Science Press.
This work is licensed under a Creative Commons Attribution 4.0 International License , which permits unrestricted use, distribution, and reproduction in any medium, provided the original work is properly cited.
 Downloads
 Citation Tools