
 Submit a Paper
 Propose a Special lssue
 Open Access
ARTICLE

Centralized-Distributed Scheduling Strategy of Distribution Network Based on Multi-Temporal Hierarchical Cooperative Game
College of Electrical Engineering, Northeast Electric Power University, Jilin, 132011, China
* Corresponding Author: Jing Bian. Email:
(This article belongs to the Special Issue: Emerging Technologies for Future Smart Grids)
Energy Engineering 2025, 122(3), 1113-1136. https://doi.org/10.32604/ee.2025.059558
Received 11 October 2024; Accepted 06 January 2025; Issue published 07 March 2025
 View Full Text
 Download PDF
Abstract
A centralized-distributed scheduling strategy for distribution networks based on multi-temporal and hierarchical cooperative game is proposed to address the issues of difficult operation control and energy optimization interaction in distribution network transformer areas, as well as the problem of significant photovoltaic curtailment due to the inability to consume photovoltaic power locally. A scheduling architecture combining multi-temporal scales with a three-level decision-making hierarchy is established: the overall approach adopts a centralized-distributed method, analyzing the operational characteristics and interaction relationships of the distribution network center layer, cluster layer, and transformer area layer, providing a “spatial foundation” for subsequent optimization. The optimization process is divided into two stages on the temporal scale: in the first stage, based on forecasted electricity load and demand response characteristics, time-of-use electricity prices are utilized to formulate day-ahead optimization strategies; in the second stage, based on the charging and discharging characteristics of energy storage vehicles and multi-agent cooperative game relationships, rolling electricity prices and optimal interactive energy solutions are determined among clusters and transformer areas using the Nash bargaining theory. Finally, a distributed optimization algorithm using the bisection method is employed to solve the constructed model. Simulation results demonstrate that the proposed optimization strategy can facilitate photovoltaic consumption in the distribution network and enhance grid economy.Keywords
With the economic development and the rapid rise of the new energy industry, China’s total installed photovoltaic power generation capacity has reached 773 million kilowatts by October 2024, and it is expected to exceed 1.2 billion kilowatts for wind and photovoltaic power generation combined by 2030, according to authoritative sources such as the National Energy Administration and relevant industry reports [1]. However, with the rapid development of distributed power sources, their large-scale and dense integration into the grid has increased the difficulty of distribution network operation control and reduced the system’s ability to accommodate distributed photovoltaic power. Therefore, it has become an inevitable trend to further research more effective strategies for optimizing the allocation of distribution network resources and exploring new energy consumption strategies that balance regional optimization and energy interaction in the distribution network.
Currently, the optimization strategies for new energy consumption in distribution networks generally focus on a two-stage optimization approach for resources such as source, grid, load, and storage across multiple time scales. Taking into account the complementary effects among controlled distributed energy resources, energy storage systems, and controllable loads across different time scales, and integrating the concept of demand-side management, an innovative source-storage-load coordination strategy has been developed [2]. This strategy effectively leverages the advantages of energy storage systems in terms of rapid power response, while also incorporating the flexible adjustment capabilities of controllable loads, thereby significantly promoting the integration of renewable energy into the local grid. Li et al. proposed a full-time coordinated optimization operation strategy for microgrids that coordinates sources, loads, and storage, considering the operational status of resources and their interactions, to maximize renewable energy consumption and minimize system costs [3]. Jiang et al. proposed an optimal scheduling model with the goal of promoting the integration of wind and solar power, taking into account the characteristics of active distribution networks and distributed energy resources. This model aims to minimize the operational costs over a complete scheduling period. The design of this model helps reduce operational costs throughout the scheduling period, thereby effectively improving economic efficiency [4]. Li et al. established a multi-level control framework, which is divided into global optimal scheduling, cluster optimization control, and local absorption control. This framework can effectively address the challenges posed by distributed photovoltaic systems, while enhancing the operational efficiency and reliability of the distribution network. It adapts to changes in the operational status of the distribution network and also promotes the large-scale application and development of renewable energy [5]. To solve the problem regarding the large-scale grid-connected consumption of a high proportion of new energy sources, Xu et al. developed a concentrating solar power (CSP)-photovoltaic (PV)-wind power day-ahead and intraday-coordinated optimal dispatching method considering source load uncertainty. These models typically aim to optimize system generation costs and ensure the safe and stable operation of the distribution network. Multi-objective optimization scheduling models have been established across multiple time scales, providing strong support for the optimal operation of active distribution networks [6]. Dong et al. utilized electricity prices to control electric vehicles and energy storage systems, effectively improving the issues of renewable energy integration and severe voltage fluctuations in the distribution network [7]. Current research generally focuses on enhancing the capacity for renewable energy integration through the use of controllable loads, energy storage devices, electric vehicles, and multi-level optimization frameworks across multiple time scales. However, there is a lack of methods that also consider the spatial scale for photovoltaic integration.
In the research on energy management and scheduling strategies in distribution networks, Wu et al. proposed a real-time optimal control and dispatching strategy for multi-microgrid energy based on storage collaborative. This model considers the energy storage device as an energy management controller, enabling it to participate in the energy collaborative dispatch of multi-microgrid. This enables the energy storage device in the microgrid not only to actively participate in the optimal scheduling of energy, but also to make the energy in the storage device be reasonably distributed in the multi-microgrid system, to maximize the full absorption of renewable energy in the multimicrogrid, thereby reducing the dependence of the microgrid on the distribution network, and significantly improving the elasticity and reliability of the multi-microgrid system [8]. Zhong et al. applied the Analytical Target Cascading (ATC) method, using the tie-line power as a coupling variable, to decouple the distribution network and microgrid models for achieving distributed optimization. However, they did not consider active electricity trading nor did they discuss the issue of benefit distribution [9]. Zhu et al. established a multi-agent optimal scheduling model for electricity trading among different groups using a Stackelberg game approach, where the system operator acts as the leader and the load aggregator as the follower [10]. Based on the Stackelberg game, Zareia et al. established an optimal configuration model for a multi-microgrid system with operators as the leaders and distribution networks as the followers. However, the strategies formulated by the leaders to maximize their own interests may sacrifice the overall system efficiency or the interests of other stakeholders [11]. Chen et al. established a cooperative operation model based on the Nash bargaining theory. Cooperative game theory focuses on the overall interests, and through cooperative game theory, the handling of electric energy can take into account both individual and overall interests [12,13].
Compared to the aforementioned research works, the main contributions of this paper can be summarized as follows:
(1) Specificity of the hierarchical structure: A scheduling architecture combining a two-stage centralized-distributed approach with a three-level decision-making hierarchy is proposed. This architecture enables the selection of optimal scheduling methods tailored to the operational characteristics and optimization goals of each level, including the distribution network center level, the cluster level, and the transformer area level. It better adapts to the complexity and dynamism of distribution networks, enhancing scheduling flexibility and response speed.
(2) Flexibility in guiding user electricity consumption with two-stage electricity prices: A multi-temporal scale scheduling method guided by two-stage electricity prices is proposed. By setting different electricity prices for different stages of the day-ahead and real-time markets, users are effectively guided to adjust their electricity consumption behavior to adapt to the uncertainty of renewable energy, reduce peak-to-valley differences, optimize power resource allocation, and ultimately help reduce costs and improve economic benefits.
(3) Integration of overall economy and local energy balance: A cooperative game model for the overall economic efficiency of the distribution network and energy balance within regional areas, focusing on energy interaction, is proposed. This model not only emphasizes the optimization of overall costs but also stresses the balanced distribution of energy within clusters and transformer areas, addressing the shortcoming of existing research that often neglects energy distribution balance. It provides a more comprehensive consideration of both the economic efficiency and energy distribution of system operation.
Chapter 2 introduces the basic framework of the model, which adopts a centralized-distributed scheduling architecture. It is divided into day-ahead and real-time scales in terms of time, and into center level, cluster level, and transformer area level in terms of space. The aim is to achieve gradual refined control of various resources, autonomous optimization of clusters, and balance between the overall economy of the distribution network and energy allocation among clusters. Chapter 3 utilizes Monte Carlo simulation to predict wind and solar scenarios in the distribution network, and analyzes user demand response behavior, price relationships, and charging and discharging characteristics of energy storage. Based on these analyses, demand response models and schedulable load models for energy storage vehicles are established. Chapter 4 constructs a two-stage scheduling model based on energy management. In the day-ahead stage, centralized scheduling is adopted, where transformer area resources are directly classified for demand response and scheduling plans are formulated. In the real-time stage, distributed scheduling is employedfter dividing the distribution network into clusters, cooperative game theory based on the Nash bargaining theory is used to consider overall economy and energy allocation among clusters. Chapter 5 presents case study solutions and analyses, using a 33-node distribution network as a typical example. It verifies that the strategy proposed in this paper can meet the energy demands of transformer areas while achieving optimal overall economy and photovoltaic utilization under cluster energy interaction.
2 Basic Framework of the Multi-Temporal and Hierarchical Model
The overall model framework of this paper is shown in Fig. 1. The distribution network follows the basic principles of “layered and partitioned, gradually refined, and locally balanced.” It adopts a centralized-distributed scheduling architecture, which is divided into day-ahead and real-time scales in terms of time, and into center level, cluster level, and transformer area level in terms of space. This ensures the rapidity and accuracy of optimization control.
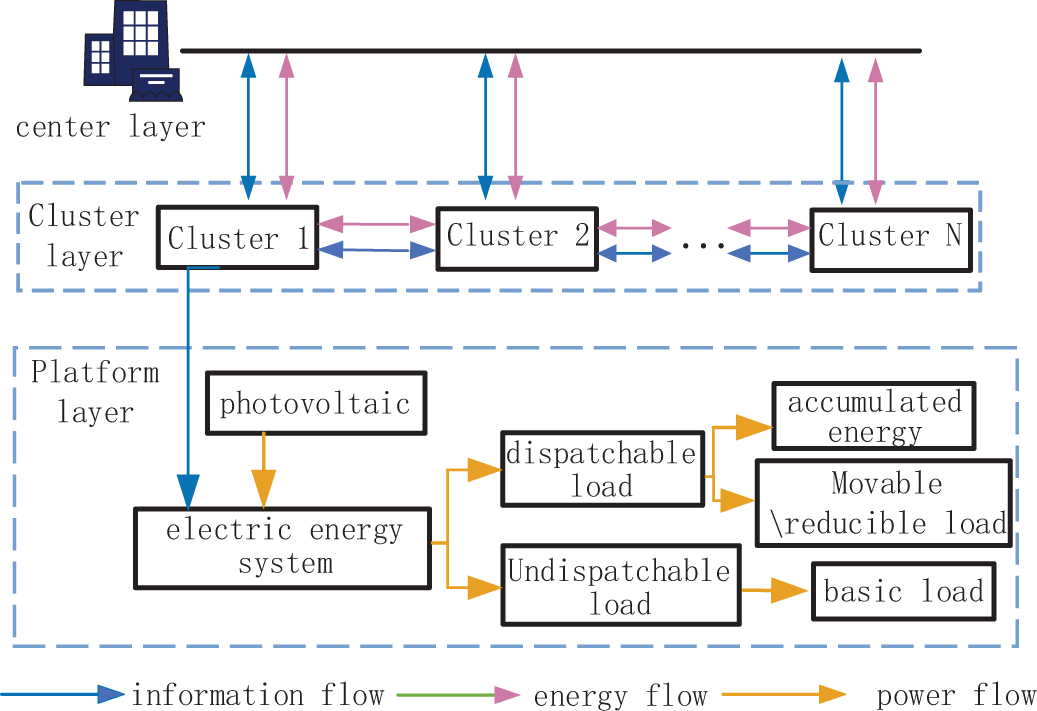
Figure 1: The overall framework of the model
The center level is equipped with electricity consumption devices such as photovoltaic panels, wind turbines, basic user loads, and energy storage vehicles for charging and discharging within the distribution network. Clusters are divided based on the distance between transformer areas and electricity consumption habits, with multiple transformer areas forming a single cluster. Each cluster has a designated leading node. When there is excess photovoltaic output within a cluster, information can be exchanged with neighboring clusters through the leading node, allowing excess energy to be transmitted to other clusters. Conversely, when a cluster is experiencing a shortage of energy, it can also contact neighboring clusters through the leading node to receive energy, achieving energy complementarity.
3 Distribution Network Scenery Scene and Schedulable Model
3.1 Distributed Power Output Model
Illumination has strong temporal regularity characteristics, and studies have shown that the solar illumination intensity at a certain moment follows a Beta distribution [14]:
In the Eq. (1),
The wind speeds in wind farms are random, and repeated analysis of actual measured wind speed data has shown that they follow a Weibull distribution [15]:
Probability distribution functions are described as follows:
In Eq. (2), c and k are the scale parameter and shape parameter of the Weibull distribution, respectively.
Using the Monte Carlo sampling method, a set of photovoltaic output scenarios is randomly generated. For the large number of generated photovoltaic scenarios, if each one is calculated and analyzed individually, the computational load would be significant. To reduce the long-term computational burden on the power grid, an improved backward reduction method is selected for scenario reduction. This method ensures that the reduced set of scenarios retains the smallest probability distance from the original scenarios, resulting in typical photovoltaic output scenarios.
3.2 Electricity Load Model and Demand Response Characteristics
The analysis of the relationship between user demand response behavior and price often employs a demand elasticity matrix, which is composed of own-price elasticity coefficients and cross-price elasticity coefficients for different time periods [16].
In the equation,
In Eq. (7),
When different types of electrical loads respond to the same electricity price, they can be classified into shiftable loads and reducible loads based on their characteristics [17]. The following sections provide models for these two types of loads, respectively:
(1) Transferable load
Shiftable loads refer to loads that users can adjust based on their own electricity usage needs in response to electricity prices. By utilizing a pricing mechanism that guides usage during peak, off-peak, and valley periods, loads can be shifted from peak periods to valley periods. Similarly, the demand response characteristics can be described using the price elasticity matrix. The change in shiftable load at time t after the response is:
In the Eq. (8),
(2) Reduced load
When analyzing the change in electricity price during the demand response period to decide whether to reduce one’s own load, the price elasticity matrix is used to describe the demand response characteristics. The change in reducible load at time t after the response is:
In the Eq. (9),
3.3 Schedulable Load Model of Electric Vehicle
Energy storage vehicle is a kind of special load which mainly uses battery as its own power to meet the traffic demand of users. At the same time, the battery of the energy storage vehicle can be used as an energy storage device to discharge during peak grid load or demand response. Therefore, when formulating a charging and discharging strategy optimization model that conforms to the operation economy of energy storage vehicles [18], on the one hand, the use preference of energy storage vehicle users, that is, the charging and discharging habits of energy storage vehicles, on the other hand, it is necessary to consider the electricity price incentives provided by the distribution network.
Assuming there are M energy storage vehicles (ESVs) in the area, the operating status of the m-th ESV at time t can be represented by a 0–1 variable. Where
Based on the aforementioned parameter configuration, the cost of charging and discharging for energy storage vehicles is:
In Eq. (10),
The constraints for electric vehicles are provided in Appendix A.
4 A two-Stage Scheduling Model Considering Energy Management
This paper proposes a two-stage scheduling and control architecture with multi-temporal and hierarchical layers for distribution substations. In the day-ahead stage, the distribution network center layer is used as the optimization scenario, aiming to achieve voltage stability and optimal economic performance. The electricity usage plan is optimized and the scheduling results are transmitted to the intra-day stage. In the intra-day stage, collaboration and autonomy among substations and clusters are considered, with the goals of optimizing economic performance and balancing energy. Optimization scheduling and energy sharing are implemented, as shown in Fig. 2.

Figure 2: Two-stage scheduling architecture
4.1 Day-Ahead Optimization Model Considering Time-of-Use Electricity Price
Based on medium- and long-term forecasting data of wind, solar, and load, the demand response elasticity matrix model is invoked in the day-ahead stage to formulate an economic dispatch plan for the overall operation of the distribution network for the next day, with a one-hour time interval for each of the 24 periods. Taking into account various loads as flexible resources and assuming no wind curtailment by default, a penalty cost for solar curtailment and a demand response cost are added to the objective function.
The optimized operation model under demand response considers the stability, economy, and efficiency of the power system. By leveraging mechanisms such as time-of-use electricity pricing and the transferable and reducible load characteristics on the user side, it aims to minimize costs and maximize benefits. The minimum value of the sum of electricity purchase cost
In the equation,
The constraints for this section [19] are provided in Appendix B.
4.2 Intraday Optimization Model Considering Cooperative Game
Based on the proposed multi-level and multi-temporal scale optimization model framework, this section constructs a cooperative game model [20] for substations and clusters. The model calculates appropriate energy exchange quantities on a 15-min time scale according to the time-of-use electricity prices calculated in the day-ahead stage, and implements rolling pricing in the intra-day stage. This ensures minimal solar curtailment for each cluster while maximizing cooperative benefits. Distributed optimized scheduling is adopted for the intra-day stage.
Since the stations in this paper do not directly interact with the distribution network, the cluster composed of multiple stations is first used to cooperate on sub-problem 1:
Each cluster takes the minimum cost as the objective function:
In the equation,
The constraints for this section are provided in Appendix C.
4.2.3 Intra-Day Optimal Scheduling Based on Nash Negotiation Theory
The basic framework is shown in Fig. 3, and the game steps [21] are as follows:
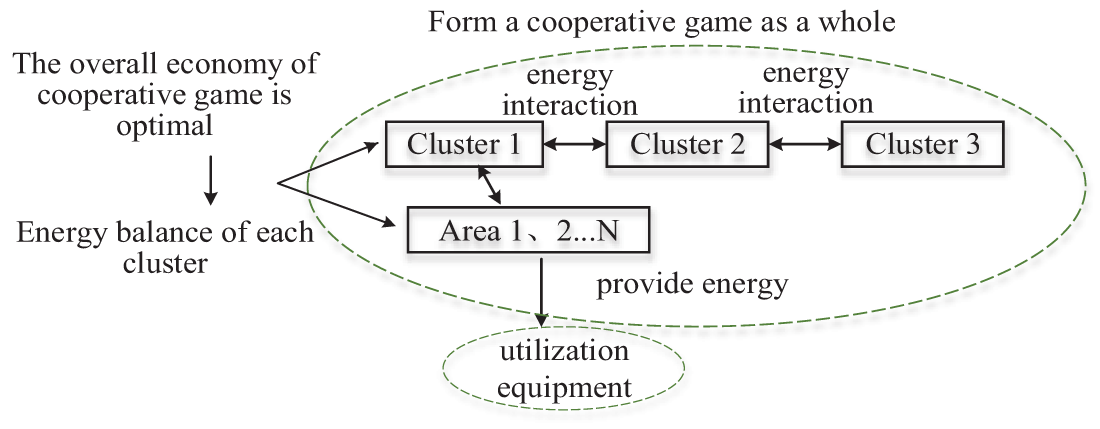
Figure 3: Cooperative game theoretic framework
Step 1: Address the cooperative game problem based on the Nash bargaining theory, and divide the problem into two sub-problems: overall benefit optimization (P1) and cooperative benefit allocation (P2).
Step 2: With the cluster layer as the leader and each substation as a follower, engage in a cooperative game. Incorporate the penalty cost for solar curtailment as part of the economic benefit, and aim for optimal overall economic benefit at the cluster layer (P1). Obtain the optimized rolling electricity prices.
Step 3: Based on the results from sub-problem 1, implement the cooperative benefit allocation (P2) and ultimately calculate the interaction results among clusters that minimize the solar curtailment rate.
Nash bargaining belongs to cooperative game theory, where participants negotiate to achieve Pareto optimality and maximize benefits.
Eq. (23) is the standard form of the Nash bargaining model [22], and the solution to the product represents the Pareto equilibrium solution for cooperation:
In Eq. (23),
In Eq. (24),
Assuming that this paper sets up three clusters, the energy supplied and accepted by each cluster in the cooperative game during the optimization process is as follows:
In the equation:
The ability of each cluster to influence electricity prices in the distribution network due to energy exchange in the cooperative game is as follows:
In the equation:
The energy allocation problem for solving subproblem 2 is:
The advantage of this quantification method is that the larger the proportion of energy supply allocated to a cluster, the greater its impact on the intra-day rolling electricity prices. This allows for the determination of revised electricity prices to guide user consumption and enhance user satisfaction.
4.3 Optimal Scheduling Model Solution
In this paper, the bisection distributed optimization algorithm, as used in Reference [23], is employed to solve the problem. The solution process using the bisection method is shown in Fig. 4.
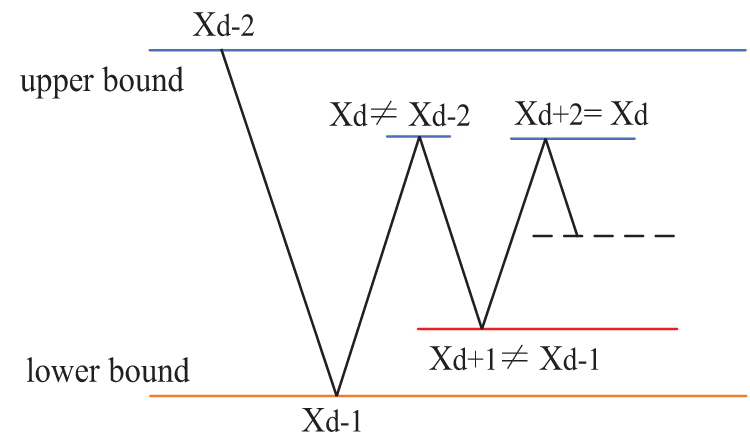
Figure 4: Dichotomy solution process
In the process of solving using the bisection method, the lower and upper bounds are continuously updated in each iteration, causing the solution interval to gradually narrow. The optimal solution is locked in by judging whether the results of two consecutive calculations are equal. If they are equal, the bisection method is used to further narrow the solution interval. If they are not equal, constraints are added, and the solution interval is updated.
Let
Add constraints when
Add constraints when
In each iteration, the convergence is judged according to Eq. (34). When the convergence condition is met, the loop is exited and the equilibrium solution is output.
In Eq. (34):
The problem addressed in this paper is a mixed-integer nonlinear programming problem. A centralized-distributed scheduling architecture is constructed, and a two-stage regulation method, namely day-ahead and intra-day regulation, based on this architecture is proposed. Firstly, Monte Carlo simulation and an improved backward reduction method are utilized to obtain day-ahead wind and solar power load forecasting data. The relationship between price-based demand response and electricity prices is analyzed, and a demand elasticity matrix is constructed. The optimization variable is the time-of-use electricity price, and the day-ahead objective function is solved. Secondly, the output time-of-use electricity prices and the day-ahead electricity consumption plan are input into the intra-day stage, where sub-problems 1 and 2 are modeled using the Nash bargaining approach. Finally, under the constraints of wind and solar power output, energy balance, equipment energy conversion, energy storage devices, and user electricity consumption, the CPLEX and Gurobi solvers are invoked on the MATLAB platform to find the solution. The solution process is illustrated in Fig. 5.
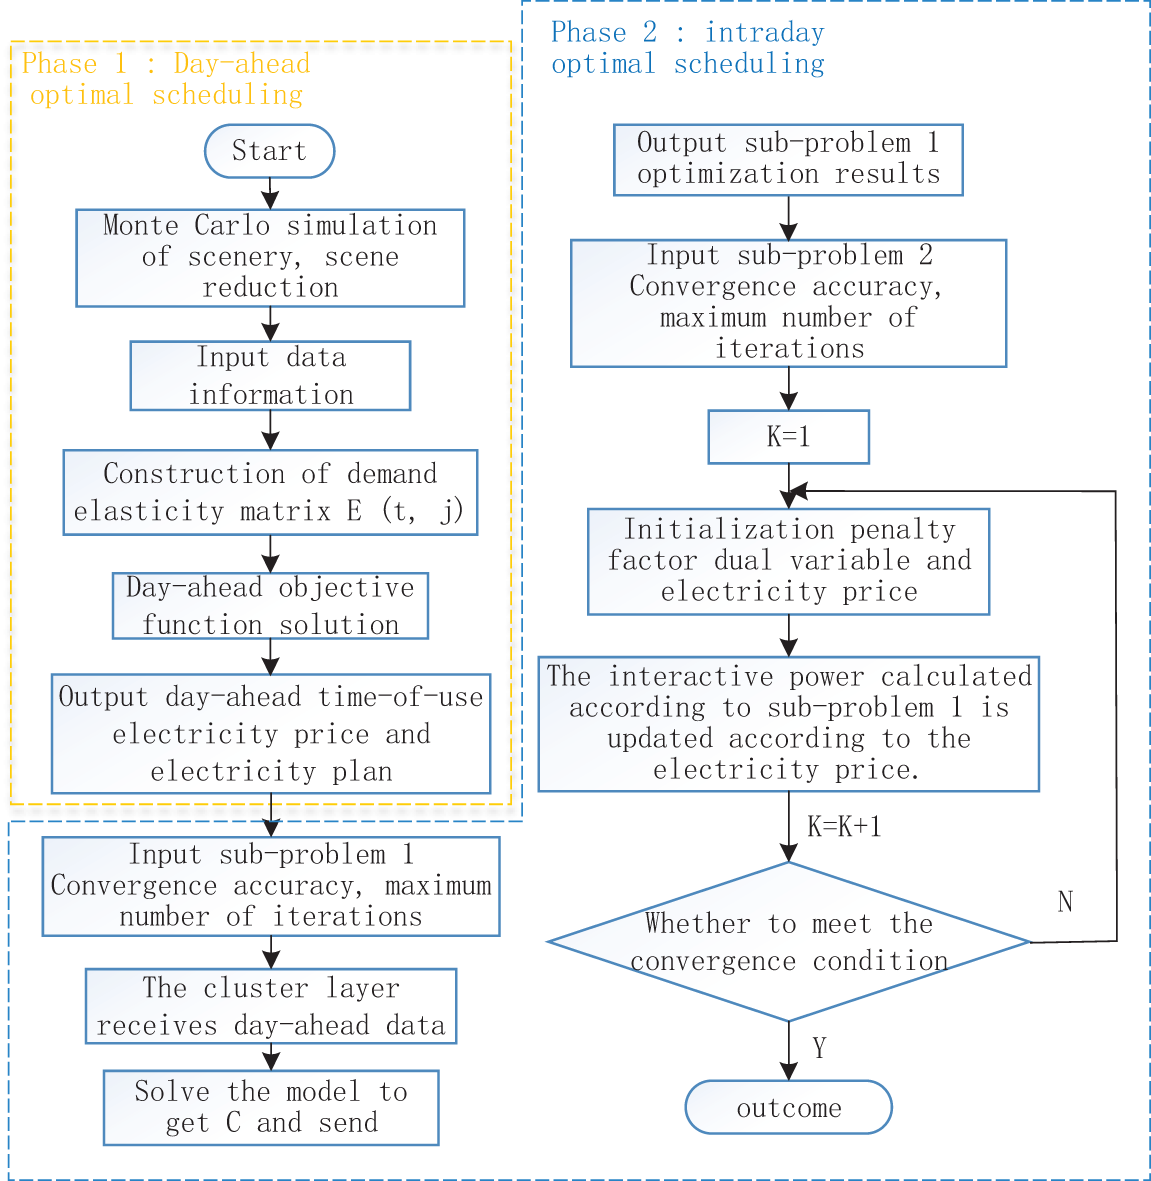
Figure 5: Solving procedure
Taking the IEEE 33-node distribution network as the research object, there are six distributed photovoltaic (PV) systems installed at nodes 7, 9, 15, 27, 29, and 32, with capacities of 1100, 1100, 600, 1000, 900, and 600 kW, respectively. Wind turbines are installed at nodes 12, 21, and 30, with capacities of 600, 1100, and 900 kW, respectively. The grouping situation is shown in Fig. 6.
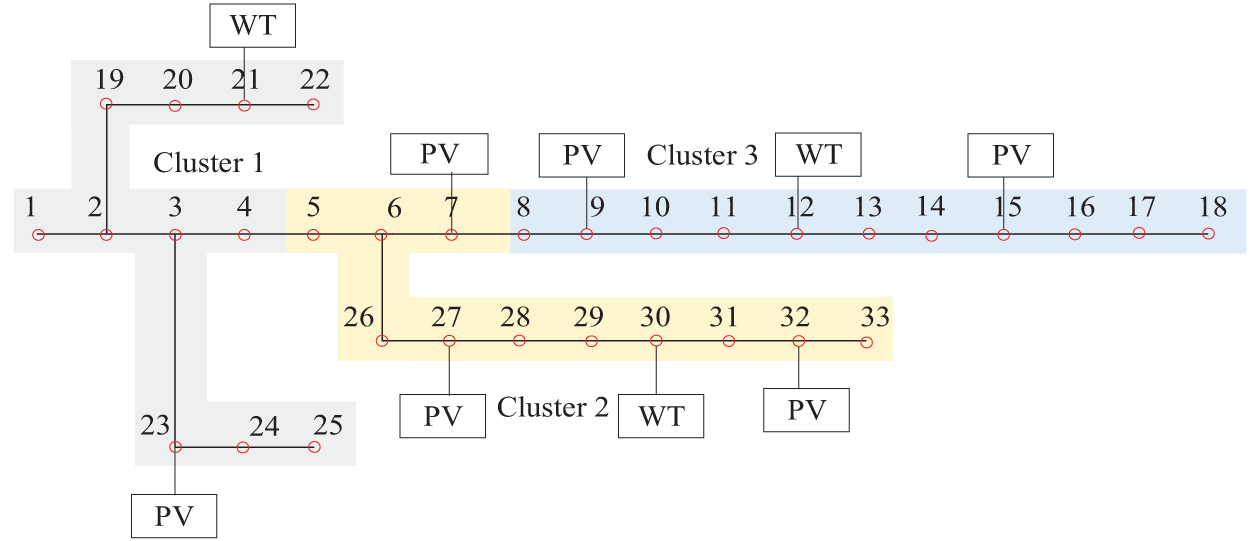
Figure 6: Grouping of IEEE33 nodes
Using the Monte Carlo sampling method, a set of random scenarios is generated. Subsequently, an improved backward reduction method is employed to reduce these scenarios to six wind and solar power output scenarios. As shown in Fig. 7, a is a photovoltaic scene simulation, and b is a wind power scene simulation. The scenario with the highest probability, Scenario 4, is selected as the experimental data. The demand response loads are connected to nodes 1, 16, and 23, with fixed, shiftable, and curtailable load proportions of 50%, 30%, and 20%, respectively. Electric vehicle charging stations are connected to nodes 13, 19, and 31. The parameter values used in the model are based on Reference [24], with a convergence coefficient set to 0.01 and an initial electricity price of 0.11.
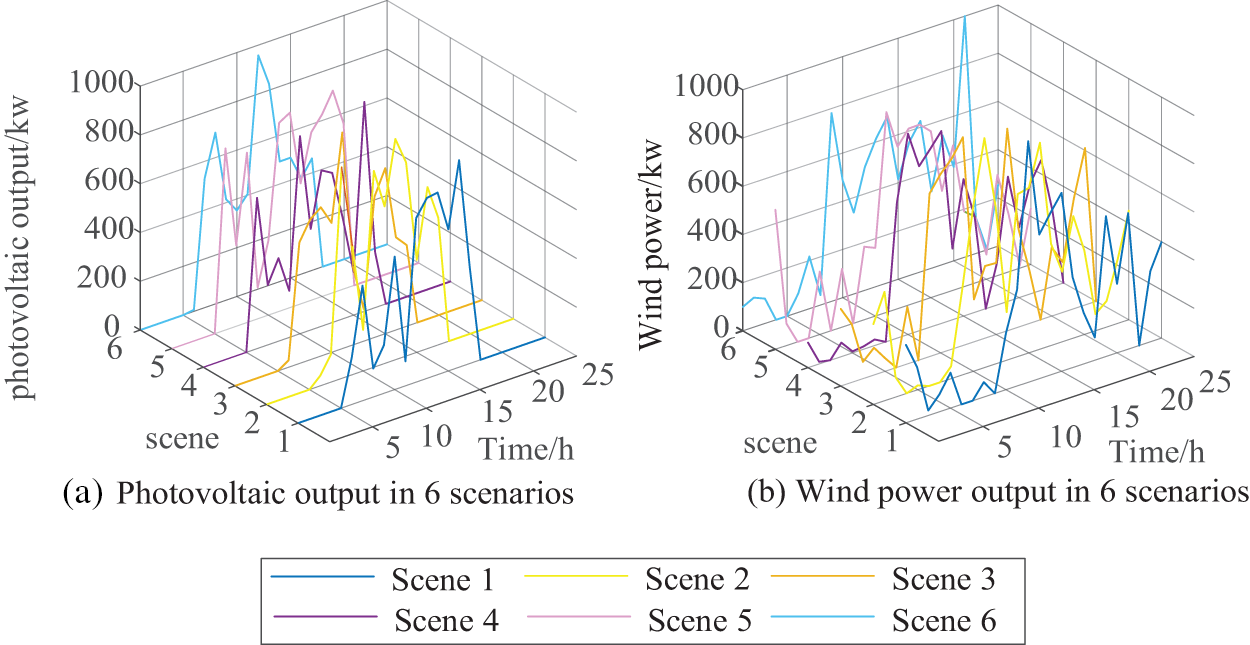
Figure 7: Wind and solar output after scene reduction
5.2 Analysis of Simulation Results
5.2.1 Day-Ahead Result Analysis
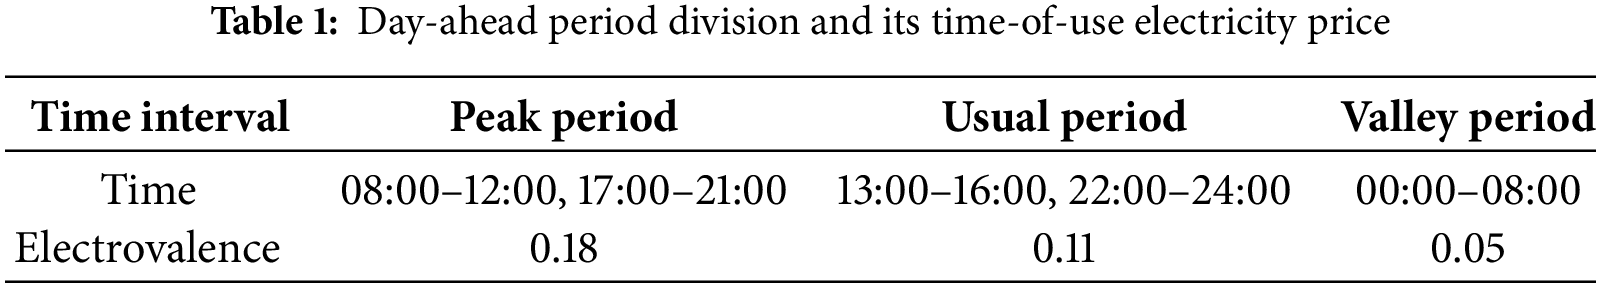
The time-of-use electricity prices for each time period are shown in Table 1. The day is divided into three periods, each lasting eight hours, and the electricity prices for each period are set based on the load conditions.
As shown in Fig. 8, the distribution network prioritizes the consumption of renewable energy to meet user demand and utilizes energy storage to maintain supply-demand balance, thereby reducing operating costs. From 00:00 to 08:00, photovoltaic output is minimal, nearly zero, and the system relies on wind power and energy storage charging to meet user electricity demand. This period is considered the off-peak period. From 13:00 to 16:00 and 22:00 to 24:00, the system relies on wind power, photovoltaic power, and energy storage discharge to meet load supply. This period is considered the mid-peak period. From 08:00 to 12:00 and 17:00 to 21:00, the system may not be able to fully meet load demand solely through wind power, photovoltaic power, and energy storage discharge. During some of these periods, electricity will be purchased from the upstream distribution network. This period is considered the peak period.
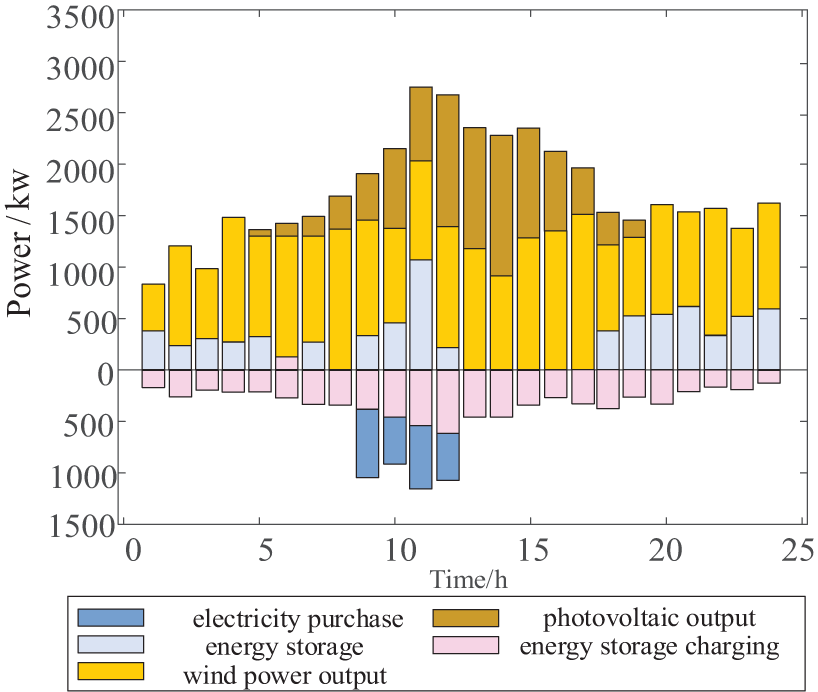
Figure 8: Day-ahead equipment power plan
After adopting time-of-use electricity prices, the 24-hour voltage amplitude for the day-ahead period is shown in Fig. 9. From 13:00 to 16:00, due to the peak electricity usage period, the voltage fluctuation is the greatest. However, under the influence of demand response and day-ahead constraints, the voltage deviation is controlled within 7%.
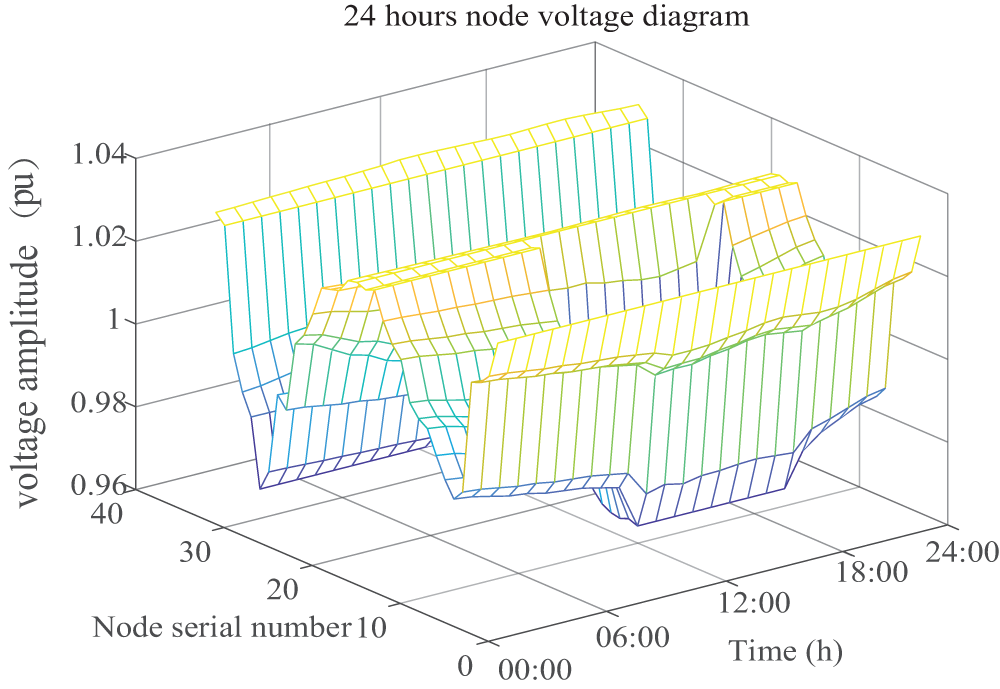
Figure 9: Day-ahead node voltage
Under the influence of time-of-use electricity prices, users respond by shifting their load to flatten the peak and fill the valley. The comparison of loads before and after optimization is shown in Fig. 10. It can be seen that after optimization, the load curve exhibits a significant peak shaving and valley filling effect, especially during the peak period from 08:00 to 11:00 when the load is substantially reduced. Therefore, the day-ahead strategy not only reduces the electricity costs for users but also alleviates the pressure on the microgrid during peak periods and promotes the absorption and utilization of excess renewable energy.
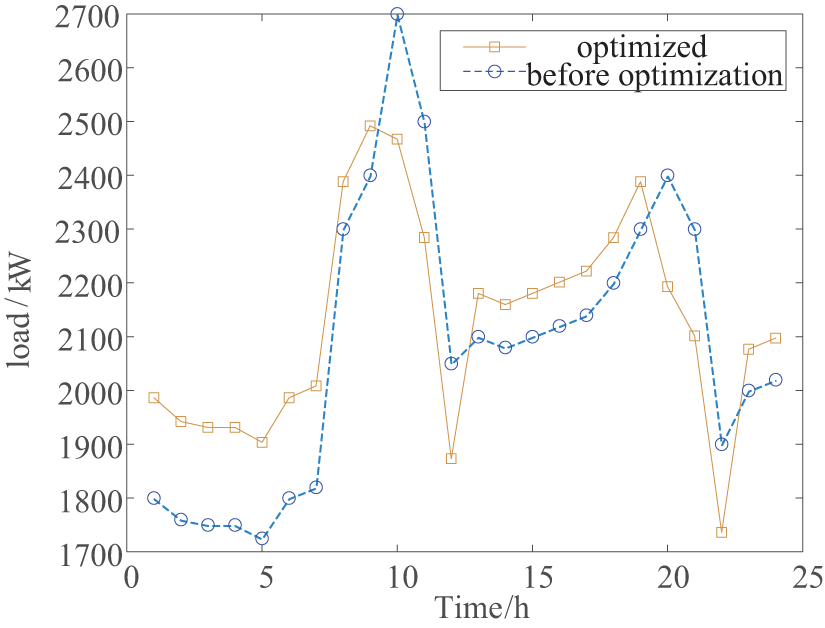
Figure 10: Load curve before and after optimization
5.2.2 Results of Intra-Day Operation
Fig. 11 shows the intra-day rolling electricity prices for 96 time periods. In the game theory-based mode, due to the presence of more targeted hourly prices, the energy transmission of each cluster is not only used to meet user demand but also increases photovoltaic consumption, thereby reducing the internal electricity costs of the clusters.
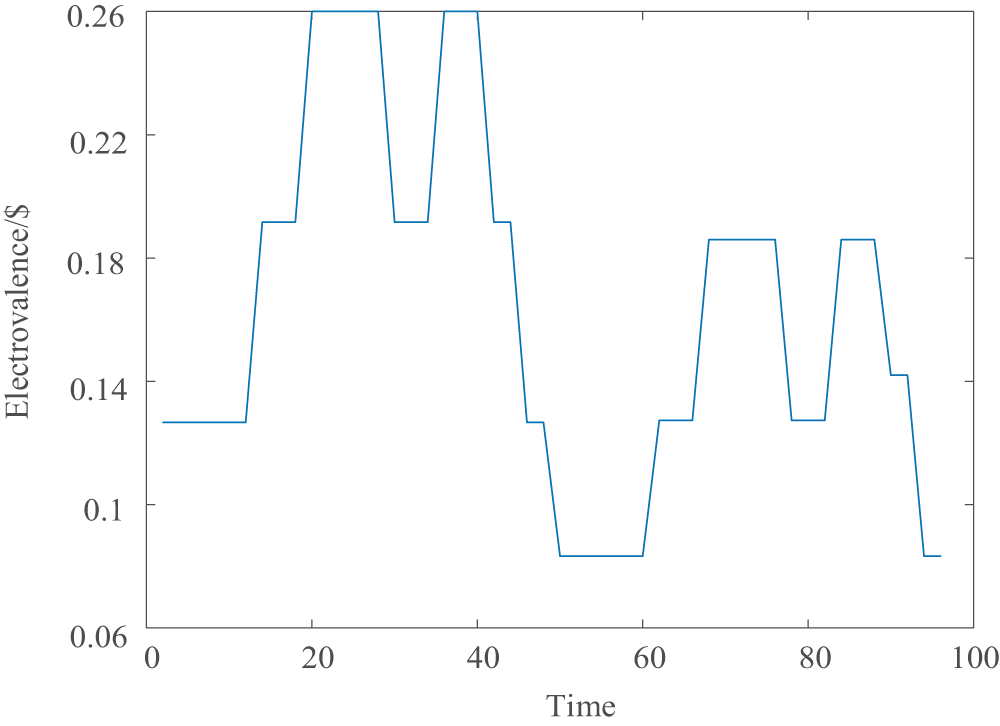
Figure 11: Intraday rolling electricity price
Fig. 12 compares the load curves before and after the guidance of intra-day rolling electricity prices. It can be observed that, due to the shorter time scale of the intra-day prices compared to the day-ahead prices, the overall load curve becomes smoother, and the peak-to-valley difference is reduced, compensating for the low electricity usage at 22:00 in the day-ahead plan. However, the overall adjustment in electricity load is relatively small. This is because the intra-day electricity prices are used to make finer adjustments on a shorter time scale based on the scheduling plan formulated the day before, avoiding significant cost differences between the day-ahead plan and actual conditions.
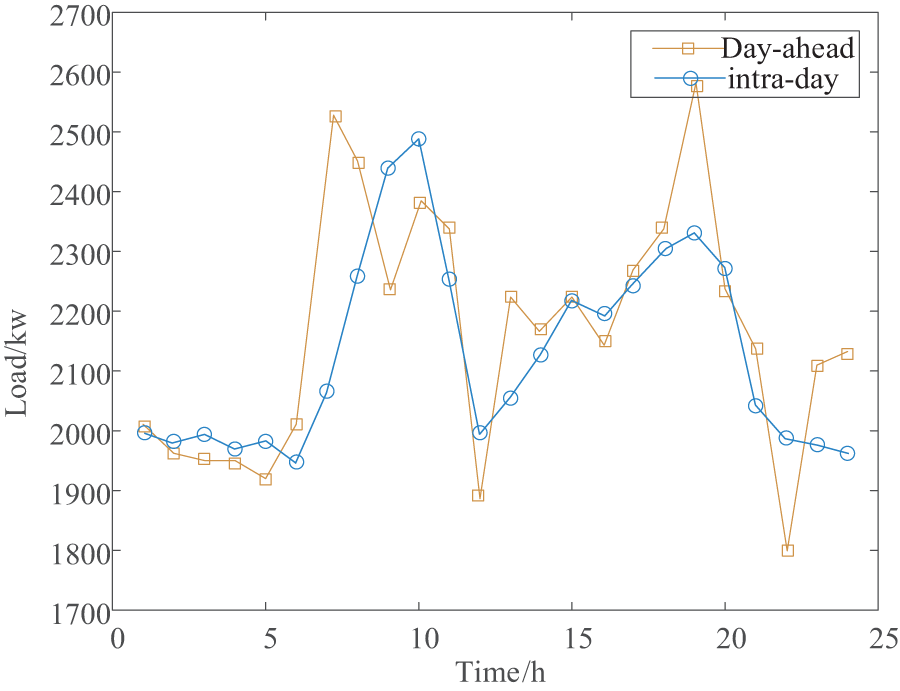
Figure 12: Day-ahead and intra-day load curves
Fig. 13 illustrates the electricity exchange situation among three clusters after adopting a cooperative game approach. Here, a represents the input power of the clusters, and b represents the output power. If the parties do not engage in cooperative gaming, there will be significant curtailment of excess wind and solar power when they are abundant, and all clusters will need to purchase electricity from the upstream grid during peak load periods. Energy surpluses will only occur during certain periods, making it impossible to achieve mutual energy support. Therefore, under the strategy proposed in this paper, the clusters and distribution transformers coordinate and cooperate, improving the matching degree of supply and demand for exchanged power among the clusters. This, in turn, reduces the costs of purchasing electricity from the upstream grid and the costs associated with curtailing wind and solar power.
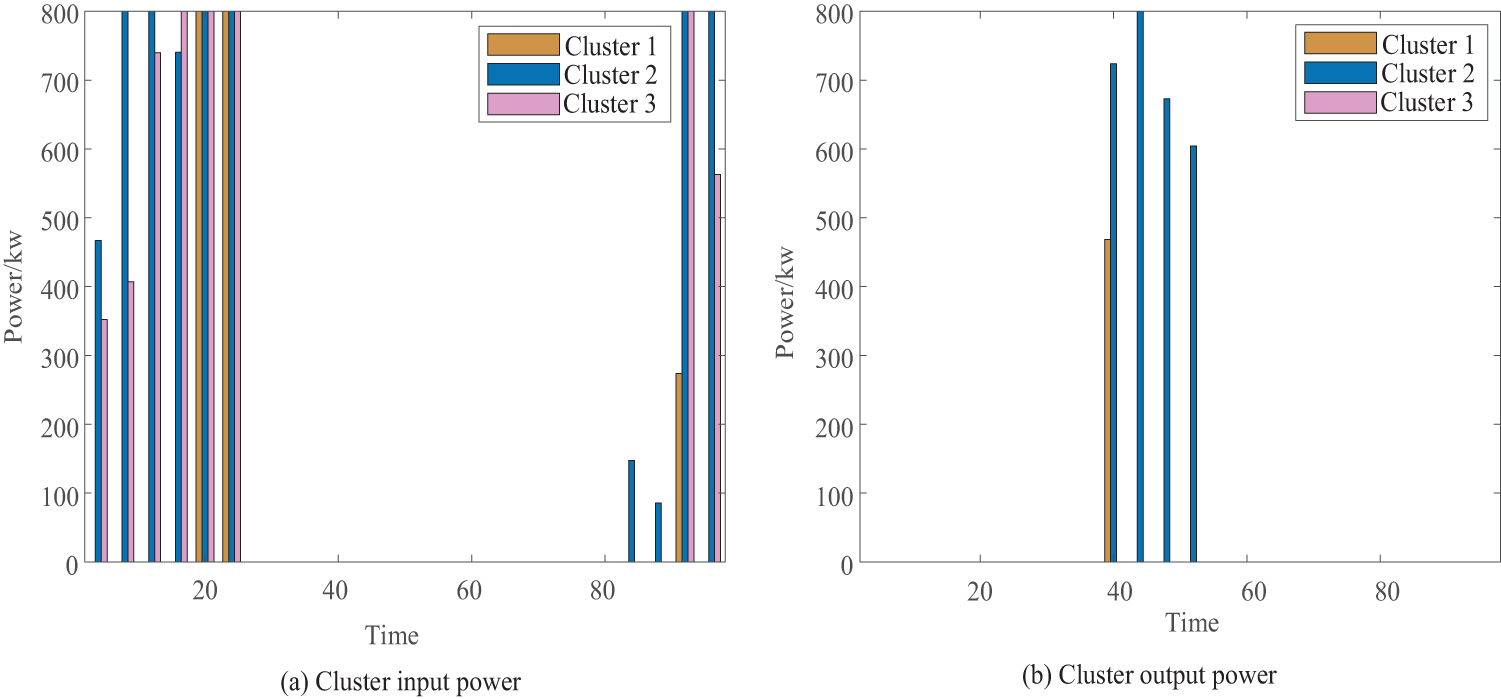
Figure 13: Cluster interactive power
Fig. 14 displays the convergence time of the algorithm. As shown in the figure, the intra-day distributed algorithm converges at the 16th iteration and reaches the game equilibrium point.
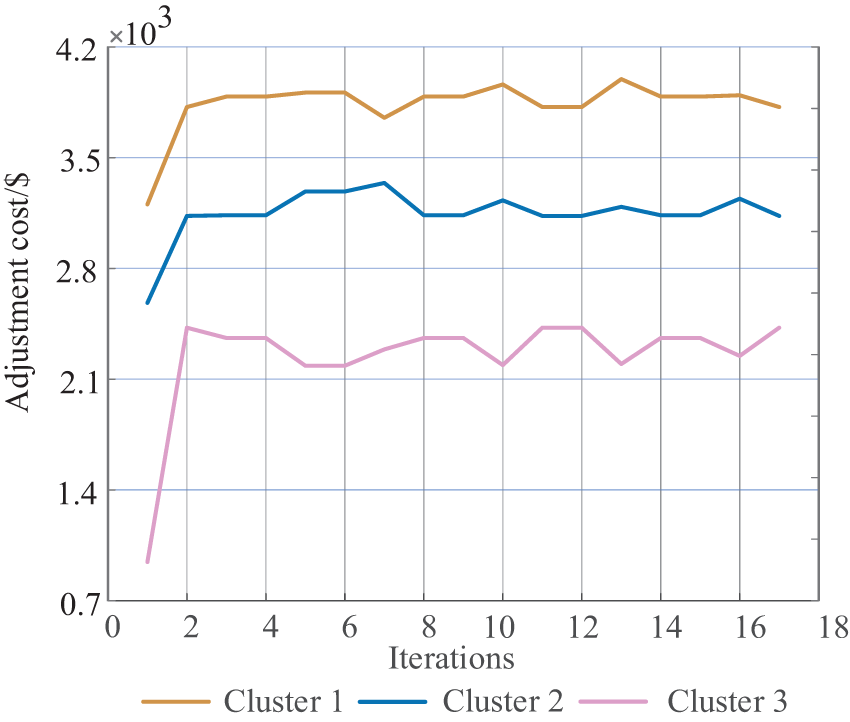
Figure 14: Iterative convergence process of distributed optimization
5.2.3 Comparison and Analysis of Schemes
To further demonstrate the effectiveness of the proposed strategy, this section sets up three comparison scenarios:
Scenario 1: Adopt the centralized-distributed two-stage optimization strategy proposed in this paper.
Scenario 2: Adopt a two-stage centralized optimization strategy [25].
Scenario 3: Do not consider cooperative gaming within the day, only conduct minimal energy exchange without formulating rolling electricity prices [26].
Fig. 15 shows the charging and discharging power of energy storage at various times for the three scenarios. It can be seen that, based on the adoption of time-of-use electricity prices in all three scenarios, the energy storage systems are able to respond to electricity prices by discharging during peak periods and charging during off-peak periods. Compared to Scenarios 2 and 3, Scenario 1 exhibits higher charging and discharging power of energy storage during peak and off-peak periods from 08:00–10:00 and 22:00–23:00. This allows for a faster response to fluctuations and fully utilizes its regulatory capability to reduce the peak-to-valley difference in the load curve.
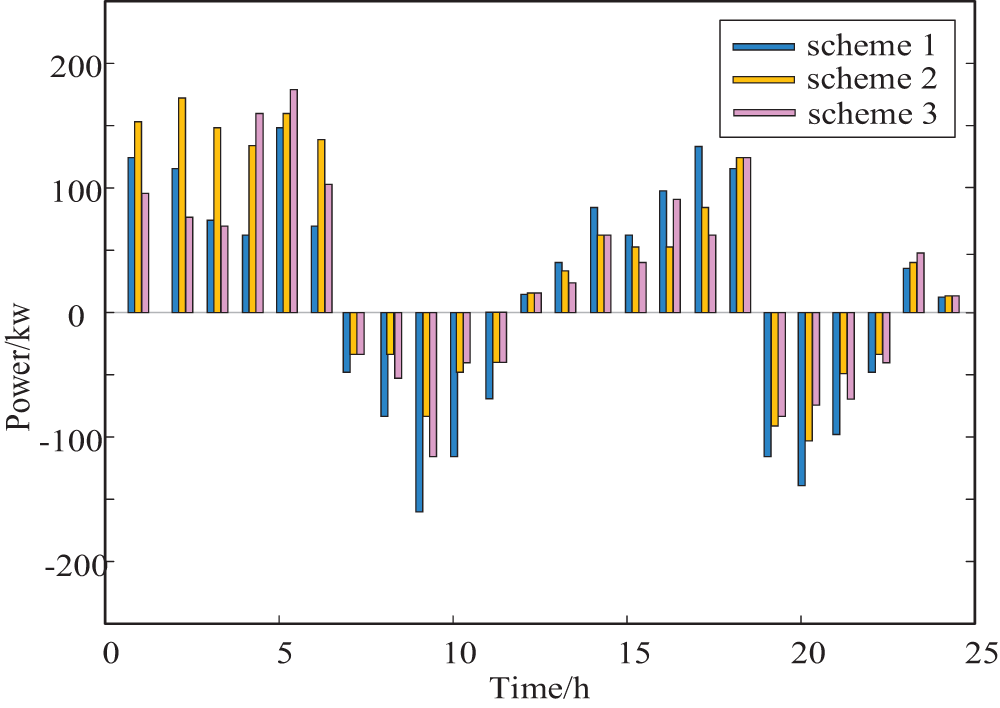
Figure 15: Three schemes of energy storage charge and discharge power
Fig. 16 presents a comparison of the final load curves using the three optimization scenarios. It can be observed that Scenario 1, adopted in this paper, has the smallest peak-to-valley difference and a relatively smoother curve. Scenario 2, which employs centralized scheduling, has an overall peak-to-valley difference that is smaller than Scenario 3, but it is more prone to small load peaks and potential curtailment of renewable energy. Scenario 3 has the largest peak-to-valley difference and is not superior to the Scenario 1 applied in this paper.
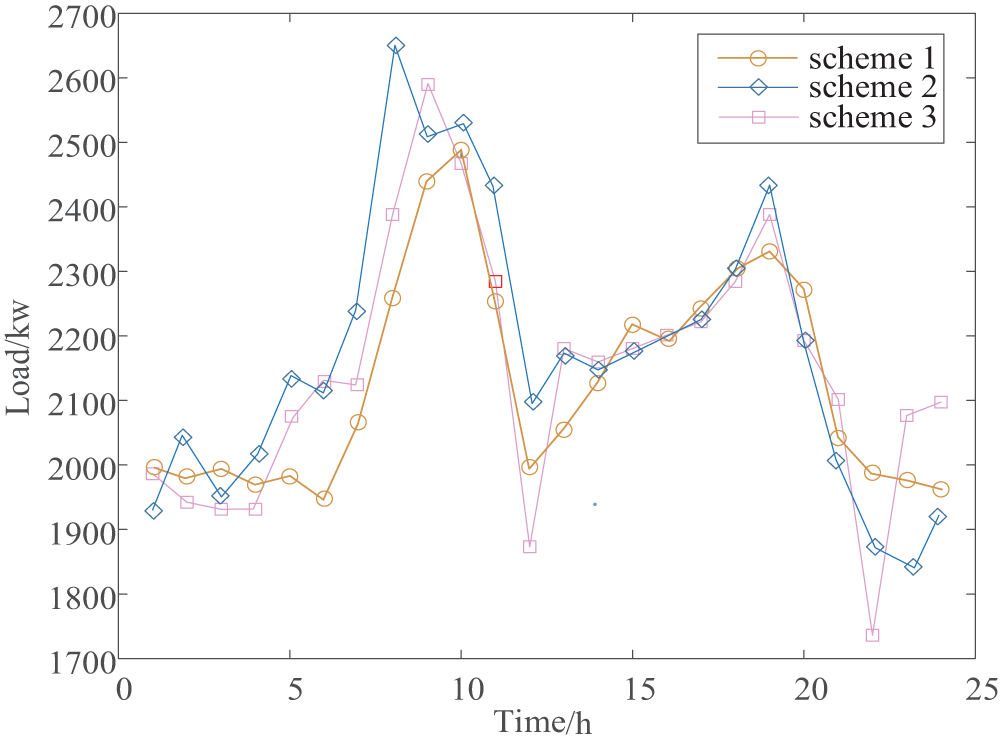
Figure 16: Load curves of three schemes
Fig. 17 shows a comparison of the curtailed solar power among the three scenarios. As illustrated in the figure, Scenario 2, which only adopts a centralized approach, may experience situations where local actions cannot be taken swiftly. Scenario 3, which does not consider intra-day gaming and only reduces excess photovoltaic output through minimal energy exchange among clusters, still results in significant curtailment of solar power within the three clusters. In contrast, under the cooperative mechanism proposed in Scenario 1 of this paper, with the goal of economic efficiency, the operation of loads, energy storage, and other equipment is first optimized through intra-day rolling electricity prices to consume excess photovoltaic output. Then, information is exchanged among clusters, and energy sharing among them is utilized to effectively promote the consumption and utilization of photovoltaic power.
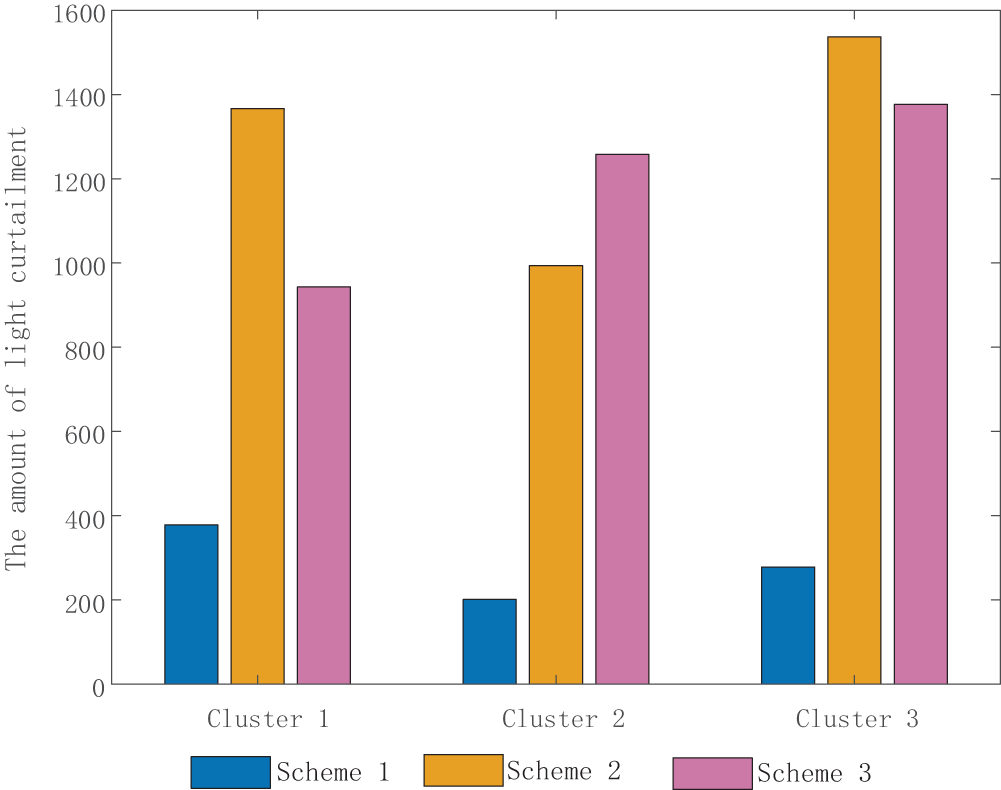
Figure 17: Comparison of the amount of light abandoned by the three schemes
Table 2 presents a comparison of the optimization results for the three scenarios. In comparison to Scenario 2, Scenario 1 adopts a centralized-distributed approach, which avoids the situation where the overall system cannot fully consider the device resources within the distribution transformers, as seen in the centralized approach. As a result, information and energy interaction between clusters will be moretimely, so the cost of scheme 1 in cluster interaction is $435.62 more than that of scheme 2, it results in a saving of $1267.91 for power generation, storage, and charging and discharging of electric vehicles, $482.01 and $300.4, and the total cost of scheme 1 is saved by $1621.37. Compared to Scheme 3, since Scheme 1 considers the cooperative game relationship between clusters and stations, the cost of Scheme 1 is $1084.38 less than that of Scheme 3, and the cluster interaction cost, power generation cost, energy storage cost, electric vehicle charging and discharging cost and loss cost are saved by $391.67, $212.11, $97.62 and $141.76, respectively. This is due to the introduction of Nash negotiationtheory, while ensuring the total cost reduction, the scheduling cost of each cluster is also reduced to a certain extent.
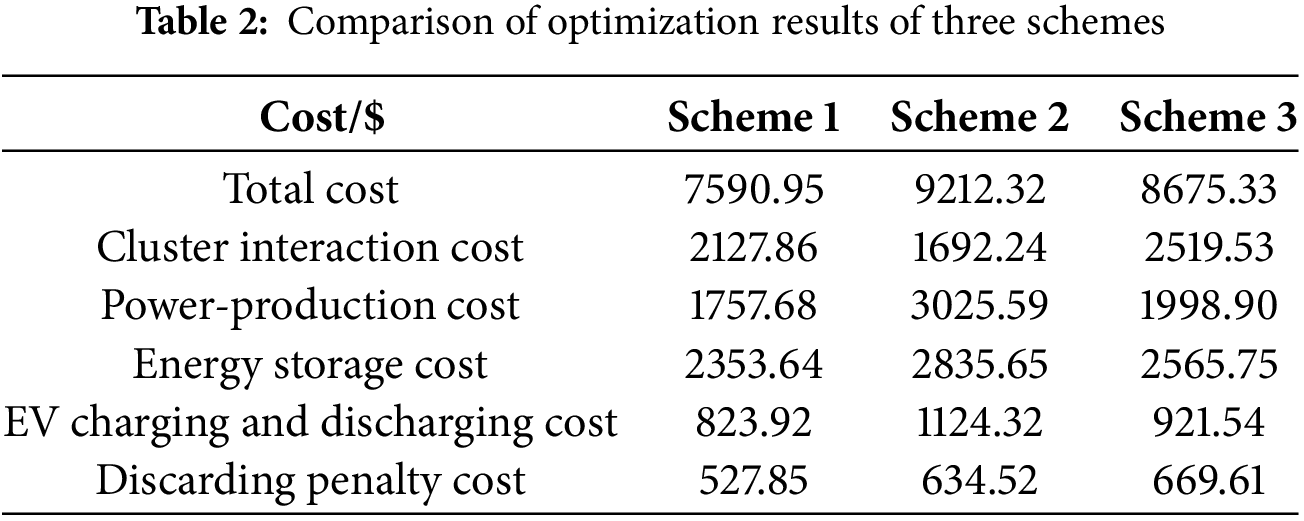
In terms of the penalty cost for curtailed solar power, compared to Scenarios 2 and 3, Scenario 1 reduces the penalty cost by 39.78% and 47.16%, respectively. This is because the centralized-distributed approach allows for scheduling decisions to be made within small clusters, enabling local consumption of renewable energy generation. Additionally, the introduction of the intra-day cooperative game model enables the determination of optimal energy exchange amounts, reducing curtailed solar power when there is excess photovoltaic output and reducing electricity purchases when photovoltaic output is insufficient.
This paper proposes a two-stage energy management optimization and scheduling strategy based on a centralized-distributed approach for a distribution system that includes three decision-making levels: the distribution network center layer, the cluster layer, and the transformer area layer. Through simulation verification, it has been demonstrated that both the photovoltaic absorption rate and the overall economic efficiency of the clusters can be improved. The main conclusions are as follows:
(1) The proposed centralized-distributed three-level decision-making scheduling architecture, guided by two-stage electricity prices for day-ahead and intra-day, is well-suited for overall centralized scheduling on a day-ahead basis due to the broad scope and slow response time of the central layer, aiming to reduce the operational costs of the distribution network. The cluster layer and transformer area layer, characterized by their fast response times and ability to facilitate energy interactions, are more appropriate for intra-day distributed scheduling among regions. The advantage of this architecture lies in its ability to allocate scheduling tasks based on the characteristics and response speeds of different levels, achieving more refined and efficient energy management. This enables better adaptation to the uncertainty of renewable energy sources such as photovoltaic, optimizes load distribution, and enhances the economic efficiency and reliability of the system.
(2) In the day-ahead stage, by reasonably dividing the load curve into peak, off-peak, and shoulder periods, and calculating the own-price elasticity and cross-price elasticity coefficients, the electricity demand price elasticity coefficient matrix is computed to determine the day-ahead time-of-use electricity prices, thereby achieving peak shaving and valley filling of the load curve. This effectively regulates the electricity load on a day-ahead basis to better match it with photovoltaic output. The calculation results show that the overall curtailment rate of the distribution network is reduced by 39.78%. However, with a one-hour time step, there may still be mismatch between load and output in certain periods. This means that although day-ahead time-of-use electricity price regulation improves the overall matching between photovoltaic output and load, further refined regulation may be needed in specific periods to optimize the matching effect.
(3) In the intra-day stage, a cooperative game model is established based on the Nash bargaining theory. The problem is first divided into two sub-problems: overall benefit optimization and cooperative benefit distribution. Then, the Nash bargaining theory is used to solve these sub-problems separately, resulting in intra-day optimized electricity prices. This approach ensures coordinated operation of electricity use at the cluster and transformer area levels while enabling cooperation and energy sharing among clusters. Compared to centralized scheduling, the total cost is reduced by 17.6%, and the curtailment rate of each cluster is reduced by at least 73%. This effectively improves the overall benefit of the distribution network and the photovoltaic absorption performance.
Acknowledgement: This paper is supported by the research was funded by the Jilin Province Science and Technology Development Plan Project (20230101344JC).
Funding Statement: This research was funded by the Jilin Province Science and Technology Development Plan Project (20230101344JC).
Author Contributions: Conceptualization, Guoqing Li, Jianing Li, Kefei Yan and Jing Bian; Resources, Jianing Li and Jing Bian; Writing—original draft, Jing Bian and Jianing Li; Supervision, Jing Bian and Jianing Li; Funding acquisition, Guoqing Li; Writing—editing, Guoqing Li, Jianing Li, Kefei Yan and Jing Bian. All authors reviewed the results and approved the final version of the manuscript.
Availability of Data and Materials: Not applicable.
Ethics Approval: Not applicable.
Conflicts of Interest: The authors declare no conflicts of interest to report regarding the present study.
In order to meet the constraints, there are three charging states: charging, discharging, and not charging or discharging:
The charging and discharging power meet the upper and lower limit constraints:
In the equation,
At the same time, based on the driving demand of electric vehicles, the initial capacity equation constraint for electric vehicles to reach the charging station is as follows:
Through the above model establishment method for the optimization problem of electric vehicle charging and discharging strategy, the charging cost of the user can be minimized, and the operation efficiency of the power grid and the user ‘s satisfaction can be improved.
Wind and solar output constraints:
Node voltage constraint:
Branch current constraint:
Distribution network power flow constraints:
Energy storage capacity constraints:
Demand response constraints:
Power balance constraints:
In the equation:
Energy storage charge and discharge constraints:
Cluster n cost constraints:
Cluster n interacts with other clusters with power constraints:
The energy interaction equation constraint between clusters:
In the equation: When time t reaches
References
1. Czeplo F, Borowski P. Innovation solution in photovoltaic sector. Energies. 2024;17(1):265. doi:10.3390/en17010265. [Google Scholar] [CrossRef]
2. Zhan Q, Su J, Lin JY, Shen G. Coordinated optimization of source-storage-load in distribution network based on edge computation. Energy Rep. 2023;9(8):492–8. doi:10.1016/j.egyr.2023.04.324. [Google Scholar] [CrossRef]
3. Li Q, Liao YX, Wu KM, Zhang LQ, Lin JY, Chen MY, et al. Parallel and distributed optimization method with constraint decomposition for energy management of microgrids. IEEE Trans Smart Grid. 2021;12(6):4627–40. doi:10.1109/TSG.2021.3097047. [Google Scholar] [CrossRef]
4. Jiang QY, Xue MD, Geng GC. Energy management of microgrid in grid-connected and stand-alone modes. IEEE Trans Power Syst. 2013;28(3):3380–9. doi:10.1109/TPWRS.2013.2244104. [Google Scholar] [CrossRef]
5. Li ZN, Su S, Jin XL, Chen HH, Li YJ, Zhang RZ. A hierarchical scheduling method of active distribution network considering flexible loads in office buildings. Int J Elect Pow Enegy Syst. 2021;131(10):67–8. doi:10.1016/j.ijepes.2021.106768. [Google Scholar] [CrossRef]
6. Xu M, Li WW, Feng ZH, Bai WW, Jia LL, Wei ZH. Economic dispatch model of high proportional new energy grid-connected consumption considering source load uncertainty. Enegies. 2023;16(4):11696. doi:10.3390/en16041696. [Google Scholar] [CrossRef]
7. Dong HZ, Li SD, Dong HY, Tian ZB, Hillmansen S. Coordinated scheduling strategy for distributed generation considering uncertainties in smart grids. IEEE Access. 2020;8:86171–9. doi:10.1109/ACCESS.2020.2992342. [Google Scholar] [CrossRef]
8. Wu N, Xu J, Linghu JQ, Huang J. Real-time optimal control and dispatching strategy of multi-microgrid energy based on storage collaborative. Int J Elect Pow Energy Syst. 2024;160:111063. doi:10.1016/j.ijepes.2024.110063. [Google Scholar] [CrossRef]
9. Zhong WF, Xie SL, Xie K, Yang QY, Xie LH. Cooperative P2P energy trading in active distribution networks: an MILP-based Nash bargaining solution. IEEE Trans Smart Grid. 2021;12(2):1264–76. doi:10.1109/TSG.2020.3031013. [Google Scholar] [CrossRef]
10. Zhu BY, Wang DZ. Master-slave game optimal scheduling for multi-agent integrated energy system based on uncertainty and demand response. Sustainability. 2024;16(8):3182. doi:10.3390/su16083182. [Google Scholar] [CrossRef]
11. Zare K, Moghaddam MP, Sheikh-El-Eslami MK. Risk-based electricity procurement for large consumers. IEEE Trans Power Syst. 2011;26(4):1826–35. doi:10.1109/TPWRS.2011.2112675. [Google Scholar] [CrossRef]
12. Chen CM, Li Y, Qiu WQ, Liu C, Zhang Q, Li ZY, et al. Cooperative-game-based day-ahead scheduling of local integrated energy systems with shared energy storage. IEEE Trans Sustain Energy. 2022;13(4):1994–2011. doi:10.1109/TSTE.2022.3176613. [Google Scholar] [CrossRef]
13. Wei CQ, Wang JJ, Zhou Y, Li YX, Liu WL. Co-optimization of system configurations and energy scheduling of multiple community integrated energy systems to improve photovoltaic self-consumption. Renew Energy. 2024;225:120230. doi:10.1016/j.renene.2024.120230. [Google Scholar] [CrossRef]
14. Qais M, Loo KH, Hasanien HM, Alghwainem S. Optimal comfortable load schedule for home energy management including photovoltaic and battery systems. Sustainability. 2023;15(12):9193. doi:10.3390/su15129193. [Google Scholar] [CrossRef]
15. Li CY, Zheng KD, Guo HY, Kang CQ, Chen QX. Computation-power coupled modeling for IDCs and collaborative optimization in ADNs. IEEE Trans Smart Grid. 2024;15(3):2762–75. doi:10.1109/TSG.2023.3321376. [Google Scholar] [CrossRef]
16. Wang YL, Li F, Yu HY, Wang YD, Qi CY, Wang JL, et al. Optimal operation of microgrid with multi-energy complementary based on moth flame optimization algorithm. Energy Sour Part A-Raecovery Utiliz Environ Eff. 2020;42(7):785–806. doi:10.1080/15567036.2019.1587067. [Google Scholar] [CrossRef]
17. Hu JJ, Liu XT, Shahidehpour M, Xia SW. Optimal operation of energy hubs with large-scale distributed energy resources for distribution network congestion management. IEEE Trans Sustain Energy. 2021;12(3):1755–65. doi:10.1109/TSTE.2021.3064375. [Google Scholar] [CrossRef]
18. Chis A, Koivunen V. Coalitional game-based cost optimization of energy portfolio in smart grid communities. IEEE Trans Smart Grid. 2019;10(2):1960–70. doi:10.1109/TSG.2017.2784902. [Google Scholar] [CrossRef]
19. Huang ZW, Liu L, Liu JC. Multi-time-scale coordinated optimum scheduling technique for a multi-source complementary power-generating system with uncertainty in the source-load. Energies. 2023;16(7):3020. doi:10.3390/en16073020. [Google Scholar] [CrossRef]
20. Tushar W, Saha TK, Yuen C, Morstyn T, Nahid-Al M, Poor HV, et al. Grid influenced peer-to-peer energy trading. IEEE Trans Smart Grid. 2020;11(2):1407–18. doi:10.1109/TSG.2019.2937981. [Google Scholar] [CrossRef]
21. Dehghanpour K, Nehrir H. An agent-based hierarchical bargaining framework for power management of multiple cooperative microgrid. IEEE Trans Smart Grid. 2019;10(1):514–22. doi:10.1109/TSG.2017.2746014. [Google Scholar] [CrossRef]
22. Naz K, Zainab F, Mehmood KK, Bukhari SBA, Khalid HA, Kim CH. An optimized framework for energy management of multi-microgrid systems. Energies. 2021;14(19):6012. doi:10.3390/en14196012. [Google Scholar] [CrossRef]
23. Zhou YZ, Shahidehpour M, Wei ZN, Li ZY, Sun GQ, Chen S. Distributionally robust unit commitment in coordinated electricity and district heating networks. IEEE Trans Power Syst. 2020;35(3):2155–66. doi:10.1109/TPWRS.2019.2950987. [Google Scholar] [CrossRef]
24. Chen LF, Zhu ZW, Wang K, Guo B, Shuai WL. Optimal operation of distribution network and multi-integrated energy microgrid based on hybrid game. Power Grid Technol. 2023;47(6):2229–43. doi:10.13335/j.1000-3673.pst.2022.1828. [Google Scholar] [CrossRef]
25. Cai FL, Hu ZC, Cao MJ, Cai DF, Chen RS, Sun GQ. Collaborative planning of centralized and distributed battery energy storage to improve the absorptive capacity of new energy. Power Syst Automat. 2022;46(20):23–32. [Google Scholar]
26. Du XD, Wang LB, Zhao JL, He YL, Sune K. Power dispatching of multi-microgrid based on improved CS aiming at economic optimization on source-network-load-storage. Electronics. 2022;11(17):2742. doi:10.3390/electronics11172742. [Google Scholar] [CrossRef]
Cite This Article
 Copyright © 2025 The Author(s). Published by Tech Science Press.
This work is licensed under a Creative Commons Attribution 4.0 International License , which permits unrestricted use, distribution, and reproduction in any medium, provided the original work is properly cited.
 Downloads
 Citation Tools