
 Submit a Paper
 Propose a Special lssue
 Open Access
ARTICLE

Two-Stage Scheduling Model for Flexible Resources in Active Distribution Networks Based on Probabilistic Risk Perception
1 Beijing Kedong Power Control System Co., Ltd., State Grid Electric Power Research Institute, Beijing, 100192, China
2 School of Electrical and Electronic Engineering, North China Electric Power University, Beijing, 102206, China
* Corresponding Author: Yukai Li. Email:
Energy Engineering 2025, 122(2), 681-707. https://doi.org/10.32604/ee.2024.058981
Received 25 September 2024; Accepted 06 December 2024; Issue published 31 January 2025
 View Full Text
 Download PDF
Abstract
Aiming at the problems of increasing uncertainty of low-carbon generation energy in active distribution network (ADN) and the difficulty of security assessment of distribution network, this paper proposes a two-phase scheduling model for flexible resources in ADN based on probabilistic risk perception. First, a full-cycle probabilistic trend sequence is constructed based on the source-load historical data, and in the day-ahead scheduling phase, the response interval of the flexibility resources on the load and storage side is optimized based on the probabilistic trend, with the probability of the security boundary as the security constraint, and with the economy as the objective. Then in the intraday phase, the core security and economic operation boundary of the ADN is screened in real time. From there, it quantitatively senses the degree of threat to the core security and economic operation boundary under the current source-load prediction information, and identifies the strictly secure and low/high-risk time periods. Flexibility resources within the response interval are dynamically adjusted in real-time by focusing on high-risk periods to cope with future core risks of the distribution grid. Finally, the improved IEEE 33-node distribution system is simulated to obtain the flexibility resource scheduling scheme on the load and storage side. The scheduling results are evaluated from the perspectives of risk probability and flexible resource utilization efficiency, and the analysis shows that the scheduling model in this paper can promote the consumption of low-carbon energy from wind and photovoltaic sources while reducing the operational risk of the distribution network.Keywords
Nomenclature
| The probability that the node voltage crosses the upper limit | |
| The probability that the node voltage crosses the lower limit | |
| The probability that the transmitted power crosses the limit | |
| The probability that the power is sent backward | |
| Celec | Purchased power tariff |
| Closs | Network loss cost |
| Cload | Flexible load operation cost |
| Celec | Operation and maintenance cost of the storage device |
| Pess | Output of energy storage devices |
| Pload | Output of flexible loads |
| Pslack | Output of the main grid |
| PL | Power transmitted by the line |
| DGi,t | Output power of the ith DG in period t |
| τ | Weighting coefficient that affects the output power |
| Bsafet | Core security boundary of the distribution network at moment t |
| Becot | Core economic boundary of the distribution network at moment t |
| B | Core security economic operation boundary |
| T | 24 h |
| ρ | Acceptable risk probability |
| Ri,t | Quantized value of the risk of the ith security boundary at the moment t |
| α | Weight factor of the node’s voltage crossing the higher limit |
| β | Weight factor of the approximation of the core security boundary |
| ui,t | Voltage amplitude of the ith node at the moment t |
The importance of low-carbon renewable energy sources is increasing day by day globally and as a result, the share of distributed generation (DG) in the energy network is gradually increasing [1].
With the deepening trend of ADN, temperature, weather, and other fluctuating factors affect the distribution network showing a variety of operating modes and complex forms of trend transfer and supply. This leads to a sudden increase in the difficulty of power prediction, current supply, dispatch control, and other issues. Literature [2] proposes the electric power system is undergoing considerable changes as a result of the integration of Renewable Energy Resources (RERs), which leads to new difficulties in the transformation of the smart grid (SG) with advanced automation and control technologies. With the wide application of energy storage technology, the degree of interaction between the “supply and demand” dual-attribute equipment in the ADN has deepened, and the scheduling object is constantly enriched. This puts forward higher requirements for distribution network risk perception, real-time response, and disposal capability [3,4].
According to the user demand response strategy, the active distribution network adjusts the load size of users based on real-time power generation, to better control and optimize the distribution of network power [5]. This approach ensures the security and economy of the distribution network while realizing the efficient consumption of low-carbon energy. As a result, literature [6] particularly focuses on electric vehicles and demand response aggregators, aiming to enhance the self-sufficiency and economic efficiency of power grids by optimizing energy resources and strategies. Literature [7] proposes the presence of more than one energy supply/storage system requires the control of energy flow among the various sources, and optimizing the size of the components and adopting an energy management strategy (EMS) are essential to decreasing the cost of the system and limiting its negative effects. Literature [8] proposes peer-to-peer (P2P) platforms, as a way to enable and encourage energy trading among peers, which have been demonstrated to boost renewable energy integration, thus allowing users and low-scale generators to engage in local markets, paving the way to improve their economy and efficiency. Literature [9] proposes a two-stage scheduling model based on probabilistic power flow, which solves the fluctuation problem of short-term forecasting through intraday load storage devices. However, stochastic wind power prediction error (WPPE) is not effectively handled and the potential information from its historical data is not fully utilized. Literature [10,11] establish an active distribution network reactive power and voltage optimization model based on mixed integer second-order cone programming using branch power flow equations. However, the objective function was only to minimize the active power loss and did not consider the issue of wind and photovoltaic power consumption. Literature [12,13] use multi-agent to control distributed power sources and constructs a day ahead real-time multi-time scale scheduling model to achieve economic and stable operation of the distribution network. However, it does not fully consider the uncertainty of intermittent power sources and flexible loads in the distribution network; Therefore, based on the study of the uncertainty of wind and photovoltaic power output, this article introduces an economic safety operating boundary in the two-stage scheduling model, fully utilizing the role of flexible resources to consume wind and photovoltaic energy while ensuring safety.
More and more flexible resources are being integrated into the distribution grid this year [14]. By charging batteries during off-peak hours and then discharging the stored energy during high-demand hours, the stress on the distribution grid can be significantly reduced. However, a major challenge to the effective use of flexibility resources is energy uncertainty. Although some studies have proposed optimization models for flexible resources [15,16], these studies rely on directly estimating demand from historical data rather than lacking a perception of real-time prediction status. The scheduling of flexible resources requires a sense of the current and future state of the distribution grid. If batteries are discharged during typical peak hours, but the peak deviates from the average load time, the system will be ineffective in removing the highest energy loads. Therefore, awareness of the current and future operational state of the distribution grid is critical to improving effectiveness and can facilitate more efficient energy management.
At present, the methods for reliability assessment of power systems can be generally divided into three types: analytical method, approximate method, and simulation method. Analytical methods mainly include the fast Fourier transform method and semi-invariant method, which are computationally simple, have short power flow calculation time, but have large errors. The approximation method is mainly represented by the point estimation method and the first-order second-order matrix method, which approximate the statistical distribution of the output variables and have significant errors. The MCS method, as the foundation of simulation, can consider a large number of uncertain factors, but the calculation time is relatively long. To maintain the accuracy of calculations and reduce the computation time of simulation methods, scholars have been improving simulation methods. Latin hypercube sampling (LHS) is an effective method for reflecting the overall distribution of random variables using sampled values [17]. At present, scholars have applied this method to the research of power systems, such as power system adequacy planning [18], wind power dispatch planning [19], probabilistic power flow calculation [20], etc.
The study of arranging flexible resources based on the uncertainty of wind and photovoltaic power output is of great significance, as previous research has not comprehensively addressed this issue. Table 1 summarizes recent research on optimizing scheduling models, including research subjects, risk assessment, Operation cost/Robustness/Consumption of wind and photovoltaic energy/Low-carbon, model, and solution.

The problems with traditional scheduling plans are summarized as follows:
1) A shorter intraday rolling time window can affect the long-term scheduling effectiveness of flexible resources. This scheduling strategy only considers local scheduling ranges when dealing with flexible resources, and cannot reflect the global scheduling goals of the day, thus failing to fully utilize its peak-shaving and valley-filling capabilities.
2) Traditional scheduling plans lack judgment on the operating status of the system, and the measurement standards between safety and economy are subjective, which is not suitable for active distribution networks with strong uncertainty.
Therefore, this paper combines the risk quantization theory with the two-phase scheduling model to consider the safety and economy of the system operation state. The optimized flexible resource plan can effectively dispose of the future risks revealed by historical data and forecast information, and focus the limited flexible resources on the actual risky period, to approach the global scheduling target of the day. Compared with existing studies, this paper solves the problem that traditional intraday scheduling plans only consider the local scheduling scope when dealing with flexible resources, and quantitatively evaluates the uncertainty problem. Firstly, this article uses an improved Latin hypercube sampling method to analyze historical source load information, which greatly reduces the correlation of sampled data and improves the solving efficiency. This generates a probabilistic power flow sequence for the entire operation cycle of ADN, which serves as input for scheduling models; Then, a two-stage scheduling model considering risk quantification was proposed. In the day-ahead dispatching phase, based on the probability current sequence of the distribution network, the second-order cone programming method is used to calculate the output range of flexible resources in each period with the goal of economy and the constraint of security. By quantitatively comparing the threat levels of transmission power, voltage limits, wind, and photovoltaic energy losses, this article proposes the safe and economic operating boundaries of the distribution network at each period; During the intraday rolling scheduling phase, strict safety output intervals and risk quantification theory were proposed to identify risk periods, dividing the operational status of the distribution network into safety periods and low/high-risk periods. This effectively solves the source load uncertainty in the operation of the distribution network by transferring flexible resources from safe and low-risk periods to high-risk periods. Finally, in the IEEE 33-node distribution system and a real example, the risk improvement effect of active regulation strategies considering safety boundary risks on the operation of active distribution networks was analyzed, providing a reference for active distribution networks to improve renewable energy consumption capacity, and reduce operation and regulation risks. The optimized intraday scheduling plan for flexible resources can reflect the overall scheduling goals of the day, and fully utilize the ability of flexible resources to peak shaving and valley filling, thereby improving the consumption rate of new energy, reducing the purchase of electricity from the higher-level power grid, and promoting the decarbonization process of the distribution network.
2 Probabilistic Current Sequence Generation for ADN Based on Source Load Historical Data
In this study, a modified Latin Hypercube Sampling-Monte Carlo (LHS-MC) method is used for probabilistic trend calculation. Since the Monte Carlo method requires sampling of raw data, stratified sampling is performed by the Latin Hypercube method to cover as large a distribution interval as possible [27]. In addition, since multiple scenic nodes are involved in the ADN, the sampled data need to be correlated to reduce the inter-sample correlation to improve the sampling accuracy [28].
The LHS-MC method has two steps: ① Sampling: sampling the input samples to ensure that the sampling points can cover the distribution range of the samples. ② Reordering: adjusting the order of each sampled value to minimize the correlation of the sampled values [29,30].
The LHS-MC processed samples are entered into the trend calculation to produce the probabilistic trend results for branches, nodes, etc. This article proposes a state boundary ΩADN to integrate three risk indicators of line capacity, voltage amplitude, and reverse power in different periods. The state boundary in each period is:
where: f represents the voltage resultant vector of the trend calculation, p represents the node active load, q represents the node reactive load; PWT represents the output of the wind power plant, PPV represents the output of the photovoltaic power plant; Vmax represents the upper limit of node voltage safety amplitude, and Vmin represents the lower limit of node voltage safety amplitude; PLmax represents the upper limit of transmission power of each branch.
The node voltage, branch power, and wind and light abandonment probability can be calculated according to the following formula:
where: Fv, Fs, and Fw represent functions that integrate the probability densities of the node voltages, line transmission power, and main network output results from the probabilistic trend calculations, respectively.
3 Day-Ahead Scheduling Model for ADN Flexibility Resources Based on Historical Probabilistic Current Sequences
In the day-ahead phase, the probabilistic tidal current sequence of the ADN is used as the operational reference for day-ahead scheduling because it is difficult to obtain accurate prediction information to implement accurate regulation of the load-storage side resources. In this phase, considering the probabilistic security risk constraints and minimizing the response cost of the load-storage side, the second-order cone planning method is used to obtain the upper and lower limits of the response interval of the load-storage-side flexibility resources, which guarantees that each operation boundary always lies within the probabilistic security range.
Considering the source-load side time-series probabilistic tidal current, the branch tidal current transmission power overrun probability, node voltage overrun probability, and wind and light abandonment probability are constrained to be within a safe range by adjusting the upper and lower limits of the energy storage and flexible load outputs, and minimizing the distribution network load and storage-side resource response cost and line loss cost. The objective function can be expressed as follows [31]:
where: T represents the time period of 24 h covered by the day-ahead scheduling plan;
3.2 Second-Order Conic-Convex Optimization Planning
The optimal flow model used in this paper is extended to the full operating cycle based on the single-time period optimal flow to form a multi-time period optimal flow model. According to the literature [32–34], the optimal power flow (BFM-OPF) of the branch power flow model is subjected to SOCR conversion processing, and the following second-order cone relaxation full operating cycle optimal flow model is obtained:
where: Vj represents the voltage at node j; rij represents the resistance of the line between node i and node j; xij represents the reactance of the line between node i and node j. ηessc and ηessd are the charging and discharging efficiencies of the energy storage device. μessc,t and μessd,t are 0–1 variables, which denote the charging and discharging states of the energy storage device, respectively. The optimization variables for optimal currents contain node injected power (p, q), branch currents (P, Q), node voltage (V) and branch current (I).
Eq. (9) is the objective function of the purchase cost of electricity, with input variables including the active and reactive load values of each node in each period, node voltage values, transmission line current values, transmission active and reactive power values of each transmission line, flexible load power, and energy storage charging and discharging power. By adjusting the size of each variable at different times, the model finds the solution that minimizes the objective function, denoted as the optimal power, to minimize the economic cost of power grid losses and the total cost of operating the scheduling unit.
Eq. (10) is the node injection power equality constraint. The meaning of the constraint on node injection power equation: For each node, the total active and reactive power injected into the node needs to be equal to the total active and reactive power flowing out of the node. Specifically, it includes the active power and reactive power transmitted from the line; The incoming active power and incoming reactive power of the line; The transmission active power loss
Eq. (11) is the branch flow constraint. The branch flow constraint ensures that the flow of active and reactive power in each branch of the power system conforms to physical laws. Specifically, for each branch, the flow of active and reactive power is influenced by the resistance and reactance, as well as the voltage j, i at the two end nodes.
Eq. (12) is the second-order cone relaxation constraint. To address the non-convexity in the original OPF model, the second-order cone relaxation technique is used to transform non-convex constraints into convex constraints. This involves transforming nonlinear power and voltage constraints into second-order cone programming problems, which can be solved using commercial solvers. This article transforms the square constraint of line current into the second-order cone form mentioned above.
Eqs. (13) and (14) are the maximum and minimum values of line current and node voltage constraints. The amplitude of node voltage needs to be within a certain range, which is usually determined by the operational requirements of the power system and the limitations of the equipment. These constraints ensure the stability and safety of the node voltage. The current amplitude in the circuit cannot exceed its thermal limit to avoid equipment damage or safety issues caused by overheating.
Eq. (15) is the energy storage device constraints, including energy storage power security constraints, energy storage capacity constraints, energy storage device energy balance constraints, and energy storage device charge/discharge conversion constraints [35]; The state transition variables ζectd,t and ζedtc,t are used to calculate the number of energy storage charging and discharging state transitions; State variables μec,t and μed,t are used to constrain the charging and discharging power of energy storage at each moment. The constraint ensures that the energy storage charge is within a safe range. The charge at the beginning of each day is equal to the charge at the end of each day, ensuring that the energy storage device operates normally on consecutive days. In this paper, the selected energy storage device is a battery storage station with a millisecond response time, which is less than the day-ahead scheduling scales, so Eq. (16) does not constrain the rapidity of regulation.
Eq. (16) ensures that the output power of the flexible load remains within the flexible adjustment range. In this paper, the selected flexible load is a residential user, and the response time is a minute scale, which is smaller than the day-ahead scheduling scale. Therefore, Eq. (16) does not limit the adjustment speed.
3.3 Flexible Resource Output Range Sequence
In the absence of accurate predictive data, this paper proposes a method for determining the flexible resource output range for each period in the day ahead stage. During the intraday scheduling phase, the output power of these resources is limited within these computational ranges. This method addresses the limitations of traditional intraday scheduling models, which only focus on local periods and fail to consider full-day scheduling plans.
The output range of flexibility resources in each period is:
Setting the minimum value of energy storage output to 0 is to avoid violating the state logic constraints during energy storage output.
4 Dynamic Adjustment Model for Intraday Flexibility Resources Based on Risk Situational Awareness
In the intraday phase, the strict safety range of wind power output is set in advance, and the wind forecast information is input to determine whether the wind information is located within the strict safety range or the risk range. For the wind information located within the risk range, the core safe economic operation boundary of the scenario is extracted. Then, by calculating the approximation between the current source load power and the core safe and economic operation boundary, the operation risk is quantified, and a short-term risk perception is formed, which in turn determines the safety period and the low/high-risk period, and dynamically adjusts the remaining available flexibility resources to cope with the future security/economic risks of the distribution network.
4.1 DG Outputs’ Strict Safety Range ( SSR)
Through the probability distribution statistics of the historical data, the upper and lower reference limits of the safety boundary of each distributed power output in each period can be obtained, which are denoted as DGmaxi,t and DGmini,t, respectively, and used to calculate the strict safety range of the DG output. Set the magnitude of the output power of each DG in each period as:
The initial value of τ is set to 1, and then the output power of each DG is taken as the known data for trend calculation, and the value of τ is reduced step by step by the cyclic iteration method, until there are two kinds of system risk situations successively, which are the over-limit of transmission power of the branch circuit, the insufficiency of power supply capacity of the system and the over-limit of the voltage of the node, etc., and then the model gets the values of τmax and τmin, which represent the limit of the capacity of wind power consumption and the limit of the capacity of power supply of distribution network, respectively. The strict safety range of the output power of each DG in each period is thus derived:
where: DGupperi, t represents the upper bound of the safe power output of the ith DG at time t, and DGloweri, t represents the lower bound of the safe power output of the ith DG at time t. The distribution network operation state is initially judged to be safe when the distributed power output is in the safe power interval with a confidence level of 90% or more.
When the distributed power output is in the safe output interval with 90% confidence, the preliminary judgment is that the distribution network operation state is safe; and when the distributed power output is below the lower bound or above the upper bound with more than 10% confidence, it indicates that there is a probabilistic risk in the distribution network operation, and the risk needs to be further quantified. During the intra-day risky scheduling identification process, safe/potentially risky periods can be quickly identified by the above methodology, thus extracting available flexibility resources from non-risky periods to high-risk periods, while shortening the solution time of the scheduling plan.
The specific flowchart for solving SSR is shown in Fig. 1.

Figure 1: The solution process of SSR
4.2 Distribution Network Operation Risk Posture Perception
During the intraday real-time scheduling phase, if the DG output is outside the strict security boundary range, i.e., there is a risk of distribution network operation, the distribution network will probably be in a state of insufficient power supply capacity or power backward transmission, and the risk of boundary crossing in this scenario needs to be assessed.
4.2.1 Identifying the Core Safe and Economic Operation Boundary Conditions
In the intra-day scheduling stage, for the short-term forecast period, the probability of exceeding the risk level of each safety and economic operation boundary indicator in the corresponding period of the day-ahead scheduling is assessed, and the core safety and economic indicators are quickly screened out.
In this paper, when setting the core security and economic operation boundary of distribution network operation, the principle is to guarantee security. The consumption of low-carbon energy is further considered based on ensuring that there are no security problems to improve the economy of the distribution network. The specific methods are as follows:
At the day-ahead scheduling stage, the probability distribution data of each node voltage, branch transmission power, and incomplete consumption of wind and light are counted at each moment, and if the risk probability of voltage overrun/transmission power overrun of the distribution network in a certain period is greater than the acceptable risk probability ρ, then the higher risk node voltage limit/branch transmission power limit of voltage/transmission power will be used as the core security and economic operation boundary in that period; If the risk of node voltage exceeding the limit and transmission power exceeding the limit is greater than the acceptable risk probability ρ within a certain period, it will be regarded as the core safety and economic operation boundary.
If the risk probability of node voltage or transmission power in a certain period is less than the acceptable risk probability ρ, it indicates that the security of distribution network operation is guaranteed. In this case, further consideration should be given to improve the economic efficiency of distribution network operation, with wind power and photovoltaic power consumption as the core security and economic operation boundary. Finally, by arranging the core boundaries of each period in chronological order, the core security and economic operation boundaries of the 24 h can be obtained. The formula is as follows:
4.2.2 Quantitative Risk Assessment
For the situation where the output of DG exceeds the limit at a certain moment, the approximation degree of the core safety and economic operation boundary of the distribution network at that moment can be quantitatively solved by substituting the power generation and load data of each node into the power flow calculation. Taking the voltage amplitude of node i as the core safety boundary as an example, the quantified risk value of the system operating at the high voltage at a certain moment is:
The first part of the equation represents the assessment of the current level of risk based on historical data, while the second part represents the degree of approximation of the predicted state to the dangerous state.
This article has obtained the probability density curve fi,t (u) of the voltage of node i at time t through probabilistic power flow, as shown in Fig. 2.

Figure 2: Probability density curve of node voltage
During the intraday rolling scheduling, the output of wind and photovoltaic power sources during the predicted period is input into the power flow calculation model to obtain the predicted voltage values ui, t of weak nodes, and Fi, t (ui,t) is calculated according to the following formula:
According to the local distribution network safety requirements, the model sets the risk threshold γ for the core safety and economic operation boundary γ. By comparing whether the risk level of system operation is within the acceptable range, the model in this paper judges the low-risk period and the high-risk period, which serves as the basis for dynamically adjusting the elastic resources. The specific judgment method is as follows:
(1) If Ri,t is greater than γ at this time, it means that the risk of distribution network operation exceeds the acceptable range and is in a high-risk operation state, and it is necessary to concentrate the flexible resources on scheduling at this time.
(2) If Ri,t is less than γ, it indicates that the distribution network operation risk is within the acceptable range, in a low-risk operation state, and the energy storage devices and flexible loads do not carry out scheduling actions in that period.
4.3 Summary of Probability Risk Perception Theory
In Section 4.1, this article iteratively solves the strict safety range of the output of wind and photovoltaic power sources in each period corresponding to the power supply limit and wind and photovoltaic consumption limit of the distribution network without the participation of flexible resources. During the intraday scheduling phase, based on the probability density curve of wind and photovoltaic power sources, calculate the confidence level that the wind and photovoltaic power output is within a strict safety range, and preliminarily divide the operation status of the distribution network into safe and risk periods. In Section 4.2 of this article, the core safety economic operation indicators for each period were first determined, and the degree of distribution network operation risk during the risk period was further quantified. This article further divides the risk state into low-risk and high-risk based on Eq. (21), using core boundary risk and approximation degree as risk quantification indicators, as shown in Fig. 3.
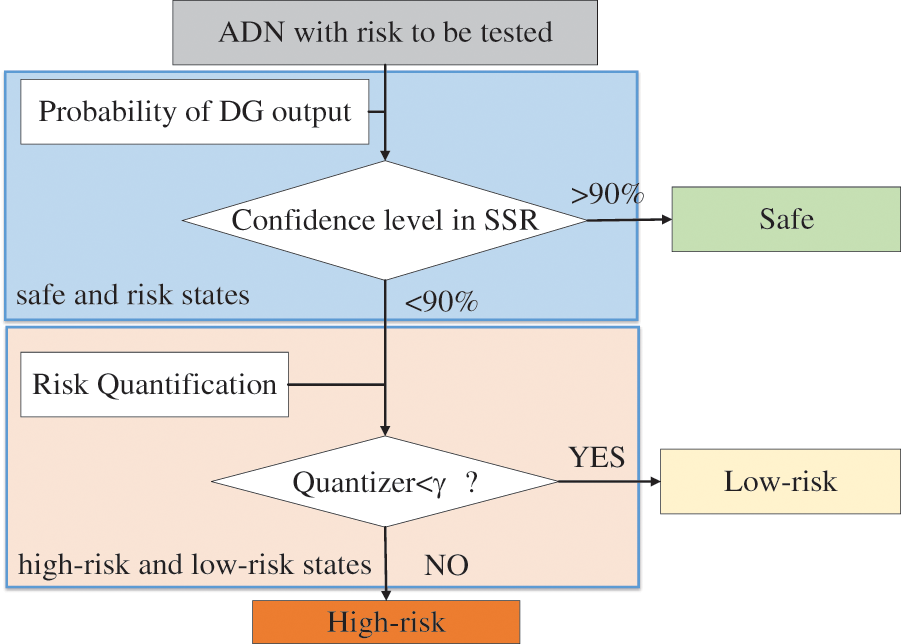
Figure 3: Risk perception process diagram
4.4 Dynamic Adjustment Model for Intraday Flexibility Resources
Risk quantification theory determines the need to commit flexibility resources during the intraday scheduling phase by quantifying the economic risk level/safety risk level of the current period promptly. For low-risk periods, the model allocates fewer flexibility resources; in contrast, for high-risk periods, the model concentrates flexibility resources to address the risk. The optimized intraday rolling scheduling model reflects the day’s global scheduling goals and makes full use of the flexibility resources.
This paper combines the risk quantization theory with the intraday rolling scheduling model, thus proposing the intraday dynamic adjustment model of flexible resources proposed in this paper is shown in Fig. 4.
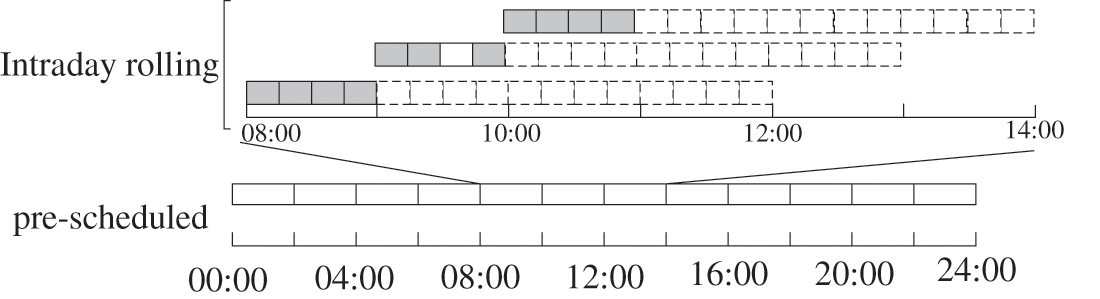
Figure 4: Multi-time scale model
In the intraday scheduling session, the intraday rolling optimization technique is adopted to minimize the distribution network operation cost as the goal, with no node voltage overrun risk and complete wind and photovoltaic energy consumption as the constraints, and to design the scheduling plan covering the next one hour by considering the output range of the day-ahead scheduling plan arrangement, and updating the scheduling plan every 15 min, to realize the rolling optimization scheduling [36,37]. On this basis, based on the risk perception results in Section 4.2, skipping the safe and low-risk periods, the objective function can be expressed as follows:
where:
The framework of the two-phase scheduling model designed in this paper is shown in Fig. 5.
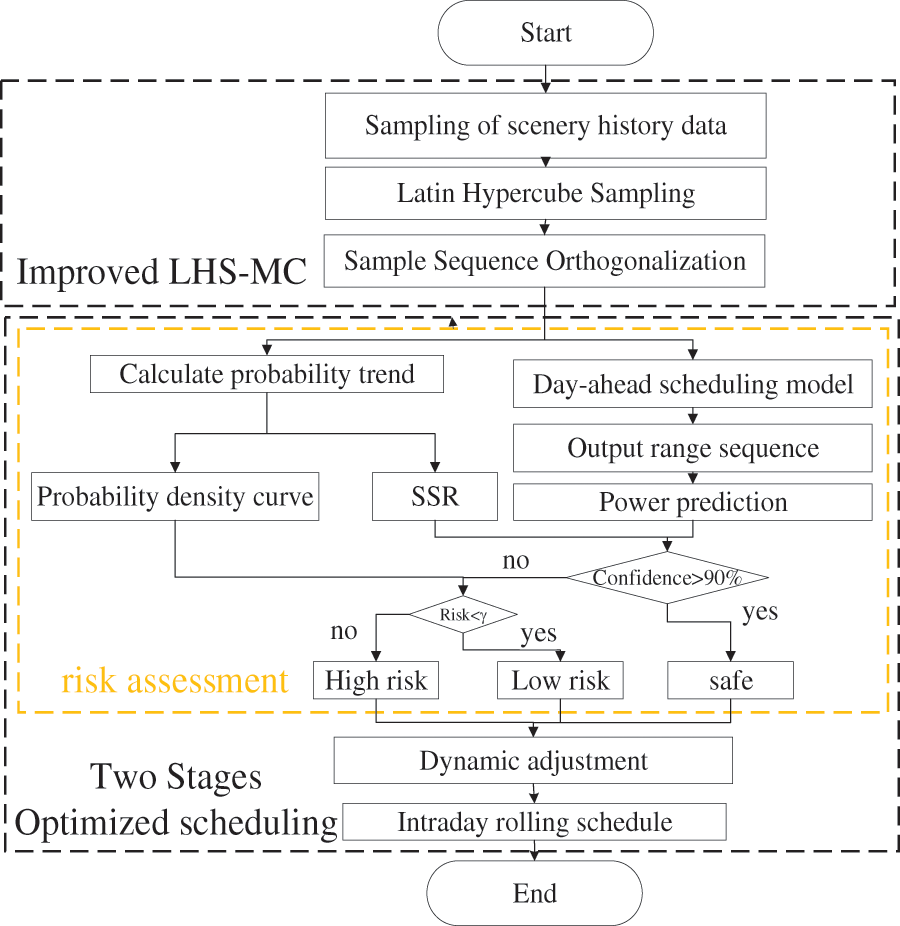
Figure 5: Modeling framework
As shown in the framework, this paper first adopts the improved Latin hypercube sampling method to sample the data of wind power stations and photovoltaic power stations, and then generates the ADN probability trend of the whole operation cycle based on the samples; then, according to the probability trend, it examines the security boundary conditions of each line and voltage in the operation cycle and calculates the exceeding probability of each security boundary condition in each period, and takes the boundary with the highest threat degree as the core boundary. The model combines the SSR theory with the core boundary to classify the distribution network operation state level by level; finally, the dispatch plan is dynamically adjusted in the intraday dispatch. This paper realizes the function of controlling the risk of ADN operation within an acceptable range, which enhances the risk-resistant ability and stable operation of ADN and is suitable for wide promotion and application.
6.1 Algorithm Parameterization
The model in this paper is simulated in an enhanced IEEE 33-node power distribution system. The wind energy conversion systems are positioned at nodes 8, 14, and 30, while photovoltaic (PV) generation facilities are installed at nodes 18, 26, and 31, with an assigned generation capacity of 2 MW for each wind turbine and PV unit. Energy storage systems are deployed at nodes 15 and 32, characterized by a storage capacity of 1 MW per unit and an efficiency of 0.9 for both charging and discharging processes. The flexible load demand is quantified at 1 MW, and the load of ADN is escalated to threefold that of its baseline value. For the probabilistic risk assessment conducted in this paper, the acceptable risk probability (ρ) is stipulated at a threshold of 5%.
The voltage magnitude at each node within the system is constrained to adhere to upper and lower bounds of 1.07 and 0.93 p.u., respectively. Concurrently, the transmission power capacity of each branch is prescribed to a maximum limit of 8 MW, thereby defining the security boundary conditions for the ADN. The network structure is shown in Fig. 6.
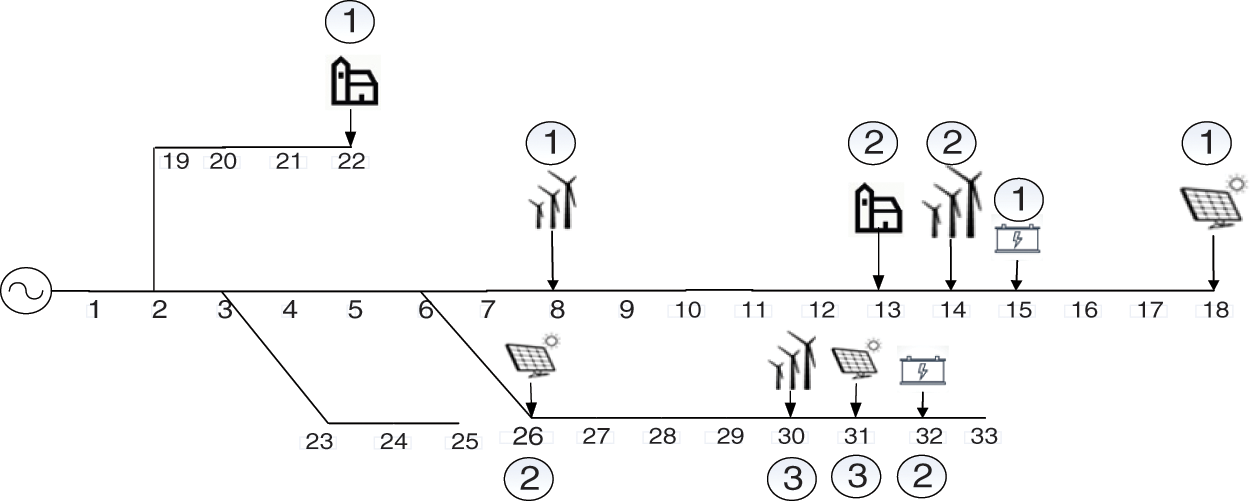
Figure 6: Distribution network topology
In the calculations used in this paper, the wind and light data are taken from [38], 90-day data for the Belgian region, the load data are described as normally distributed based on typical daily load fluctuations, the mean is taken as the expected value of the load for each period, and the standard deviation is 5% of the expected value. The corresponding costs of energy storage, flexible load regulation costs, and network loss costs are shown in Table 2.

The distribution intervals of wind power and load curves in the region are shown in Fig. 7.
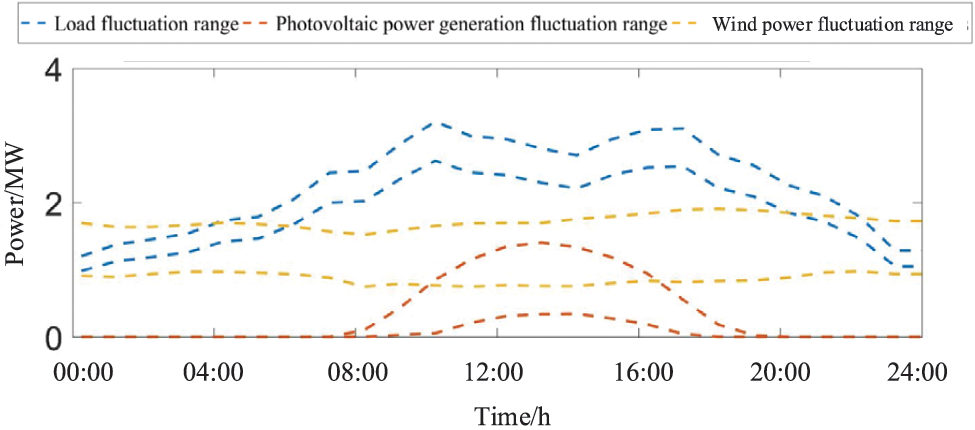
Figure 7: Typical daily wind and photovoltaic load power fluctuation curve
6.2 Analysis of Day-Ahead Scheduling
When there is no flexible response, by fitting the probabilistic trend results of the source-load data in the full cycle of history, we obtain the probability of voltage crossing the upper limit and lower limit, the probability of wind and light abandonment, and the probability of branch current crossing the limit of the ADN in each period, and the results are shown in Fig. 8.
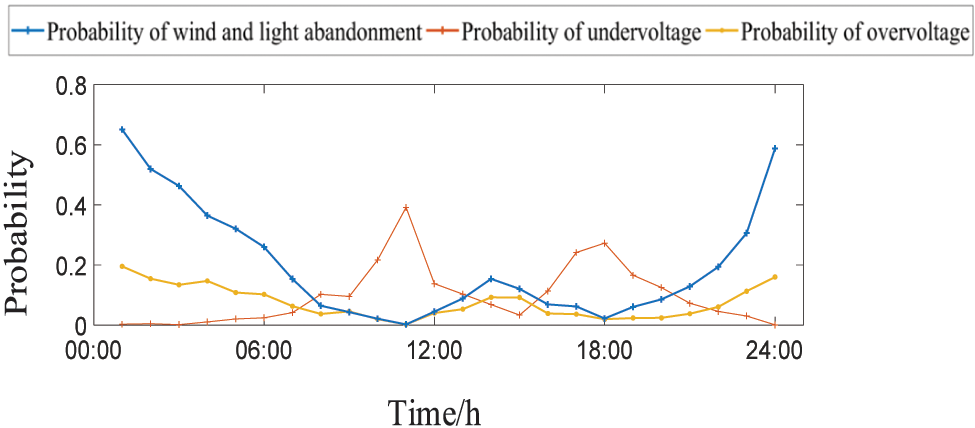
Figure 8: The operational risks of distribution networks in response to inflexible resources
As can be seen in Fig. 8, there are large differences in the risk of security boundary crossing faced by the ADN in each period. Among them, in the 21:00–07:00 time period, wind and light abandonment is the main threat, and the maximum probability of wind and light abandonment can reach 0.7; in the 08:00–14:00,16:00–20:00 time periods, the voltage crossing the lower limit probability is the main threat, and the probability of the risk can reach 0.4; and in the 14:00–15:00 time period, the risk of distribution grid operation is re-dominated by the probability of wind and light abandonment, with the maximum wind and light abandonment probability reaches 0.2.
In the day-ahead scheduling stage, the risk of overrun of each security boundary is constrained within an acceptable range through the flexible resource response on the load and storage. Fig. 9 shows the calculation results of the energy storage output range in the day-ahead scheduling of the ADN.
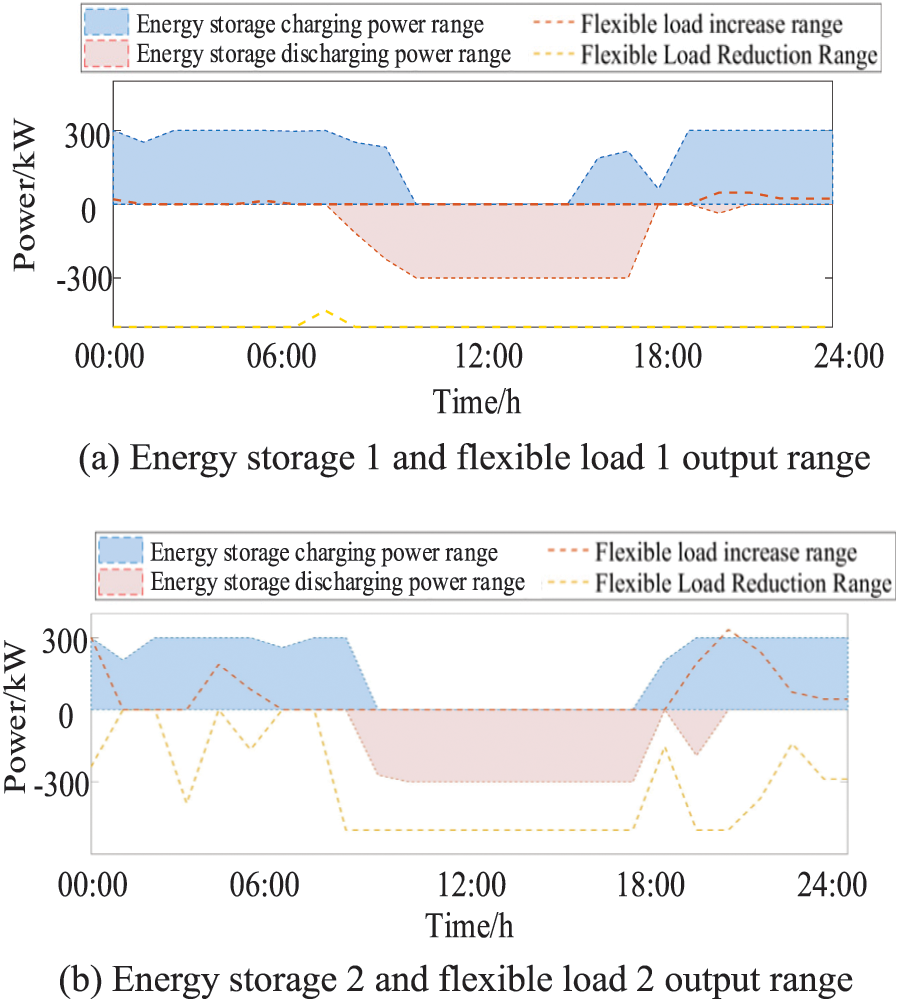
Figure 9: Output range of energy storage device in the day ahead dispatching stage
As can be seen in Figs. 8 and 9, during the 20:00–08:00 time period, energy storage maintains a high charging demand state for a long time, and flexible load 2 maintains a high increasing demand state for a long time. This is because the ADN is located in the period of high wind power generation and low load period, and the existing load is difficult to fully consume wind power generation. The source-load matching conflict changes with time, and the probability of wind and light abandonment increases and then decreases, reaching a peak of 70% at 24:00, and the wind and light abandonment boundary is the core security boundary of the distribution network during this time. In some of these periods, there is a risk of voltage magnitudes exceeding the prescribed upper threshold, but compared with the risk of wind and light abandonment, the risk of voltage surpassing the upper limit is low, so it is not the core security boundary in this period.
During the 10:00–12:00 and 16:00–18:00 time periods, both energy storage locations maintain high discharge demand for a long time, and the flexible load maintains high curtailment demand for a long time. Because this time is located in the wind power trough period, load rise or fall period, the internal power supply capacity of ADN cannot meet the load demand. This leads to a high risk of voltage crossing the lower limit, which becomes the core security boundary and requires the energy storage device to discharge and cut the load at the same time. As can be seen in Fig. 8, if there is no load-storage-side energy storage device regulation, the probability of system voltage crossing the lower boundary reaches up to 0.4.
In the 12:00–16:00 time period, the energy storage also maintains in the high discharge demand state, and the flexible load maintains in the high curtailment demand state. Although this time is located in the wind power valley, peak load period, but the PV power is in the peak interval, the voltage crosses the lower limit risk is reduced, the core risk of the distribution network in the voltage crosses the limit, wind abandonment and abandonment of light between the conversion, the need for energy storage devices for discharge adjustment. As can be seen from Fig. 8, if there is no load storage side of the energy storage device adjustment, the system voltage lower boundary crossing probability up to 0.18.
In addition, in the 07:00–10:00 and 18:00–20:00 time periods, due to the intervention/withdrawal of PV power generation, the state of source-load supply within the ADN changes, the degree of overrun of each security boundary fluctuates greatly, and the core security boundary is converted, resulting in the demand for storage charging/discharging in this period are in the higher range.
In addition, flexible load 1 is maintained in a high curtailment demand state for a long period, because the node it accesses is located at the end of the distribution network with lower voltage, and the distribution network voltage can be stabilized by curtailing the flexible load.
The results of the risk of each security boundary of the ADN under the resource response on the load and storage side are shown in Fig. 10.
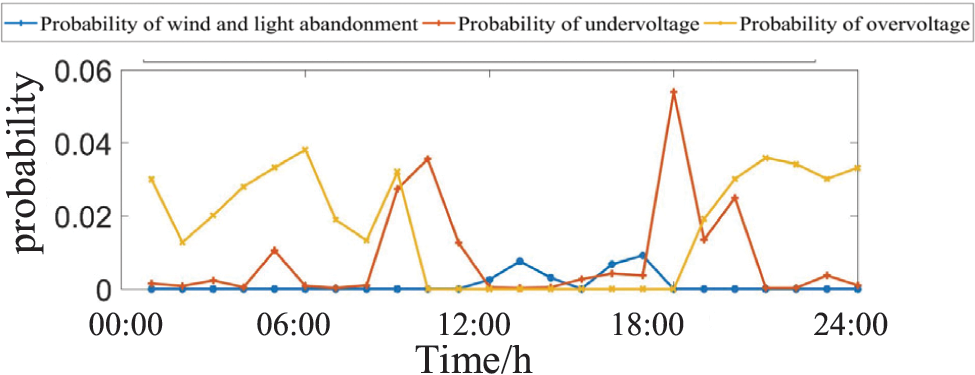
Figure 10: The operational risks of distribution networks after flexible resource response
As can be seen from Fig. 10, through the regulation of flexible resources such as energy storage, the node voltage specification can be controlled between 0.93 and 1.07, with a confidence level of 94% or more, and the range of node voltage fluctuation is significantly improved. At the same time, the probability of wind and light abandonment is also significantly reduced from 0.7 to 0.04. Under the coordination of the load and storage resources, the carrying capacity of the ADN for renewable energy is effectively improved from the perspective of probabilistic security, which provides a reference for further correction of the flexible resource output during the day.
6.3 Intraday Risk Assessment of Distribution Networks
Through the application of probabilistic distribution analysis to historical data, the statistical range of output power for each distributed power source across different periods can be delineated. Through the loop iteration, the values of τmax and τmin are calculated to be 0.7 and 0.46, respectively. Taking wind power 1 as an example, according to the probability distribution of the real-time prediction of the output power of the wind power station during the day, the safety range of the output power can be obtained as shown in Fig. 11.
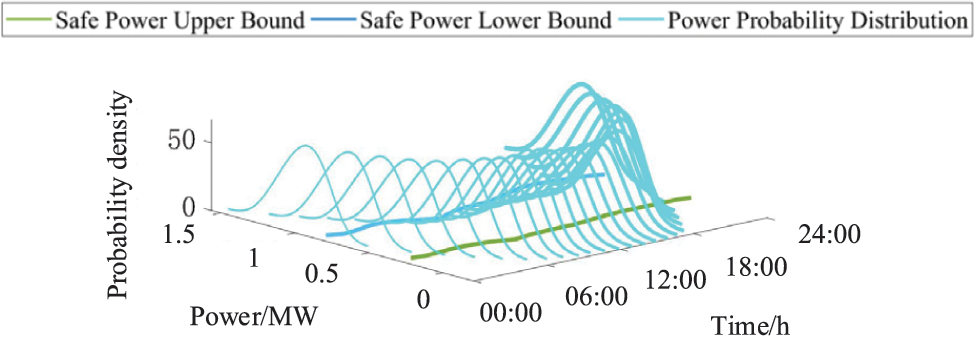
Figure 11: Safe range of output for wind power No. 1
As shown in Fig. 11, during the periods 04:00–05:00 and 20:00–21:00, the generation power of wind power No. 1 is within the security boundary with more than 90% confidence probability, and thus the periods 04:00–05:00 and 20:00–21:00 are judged to be safe. For the rest of the period, the generation power of wind power 1 is within the security boundary with a confidence probability of less than 90%, and further risk assessment is required. By counting the probability distribution of each distributed power source for each period at 15-min intervals and calculating the range of each safe output, the following table can be derived.
As shown in Table 3, in periods 17–21 and 76–80, the probability distribution of the output of each power source is within the security boundary, so there is no risk in the operation of the ADN, and the scheduling scheme can be adjusted to skip the no-risk periods and focus resources on the risk periods.

In the remaining period, there are distributed power outputs exceeding the security range, at this time the distribution grid is in a risky period, and it is necessary to calculate the proximity of each core security boundary under the current source-load state. Take the 00:00–10:00 time period as an example, set the security threshold γ = 0.15, the risk assessment results for this period are shown in Table 4.
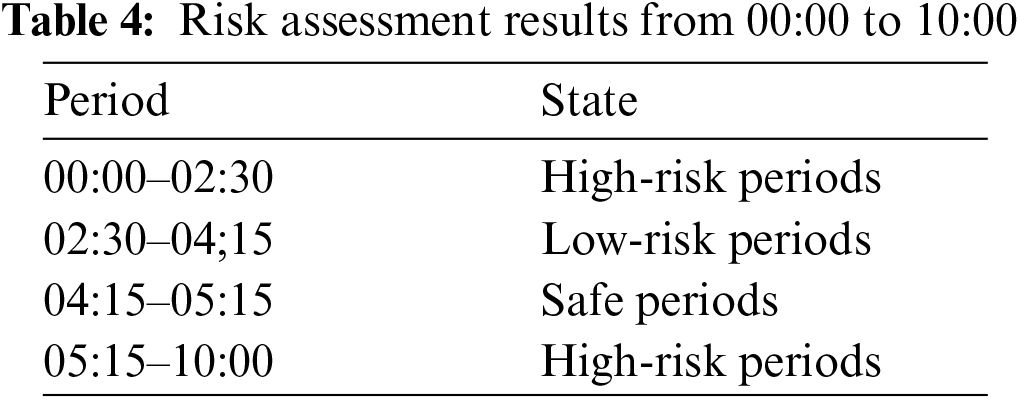
From the analysis in Section 6.2, it can be seen that the core safe and economic operation boundary for the period shown in Table 4 is wind and light abandonment, and the system can ensure safe operation within the acceptable risk range without scheduling during the period of 02:30–05:15. At this point, the remaining flexibility resources for that period can be dynamically adjusted to a higher-risk period.
6.4 Analysis of Intraday Scheduling
The results of the intraday rolling scheduling of the load and storage flexibility resources based on risk identification are shown in Fig. 12.
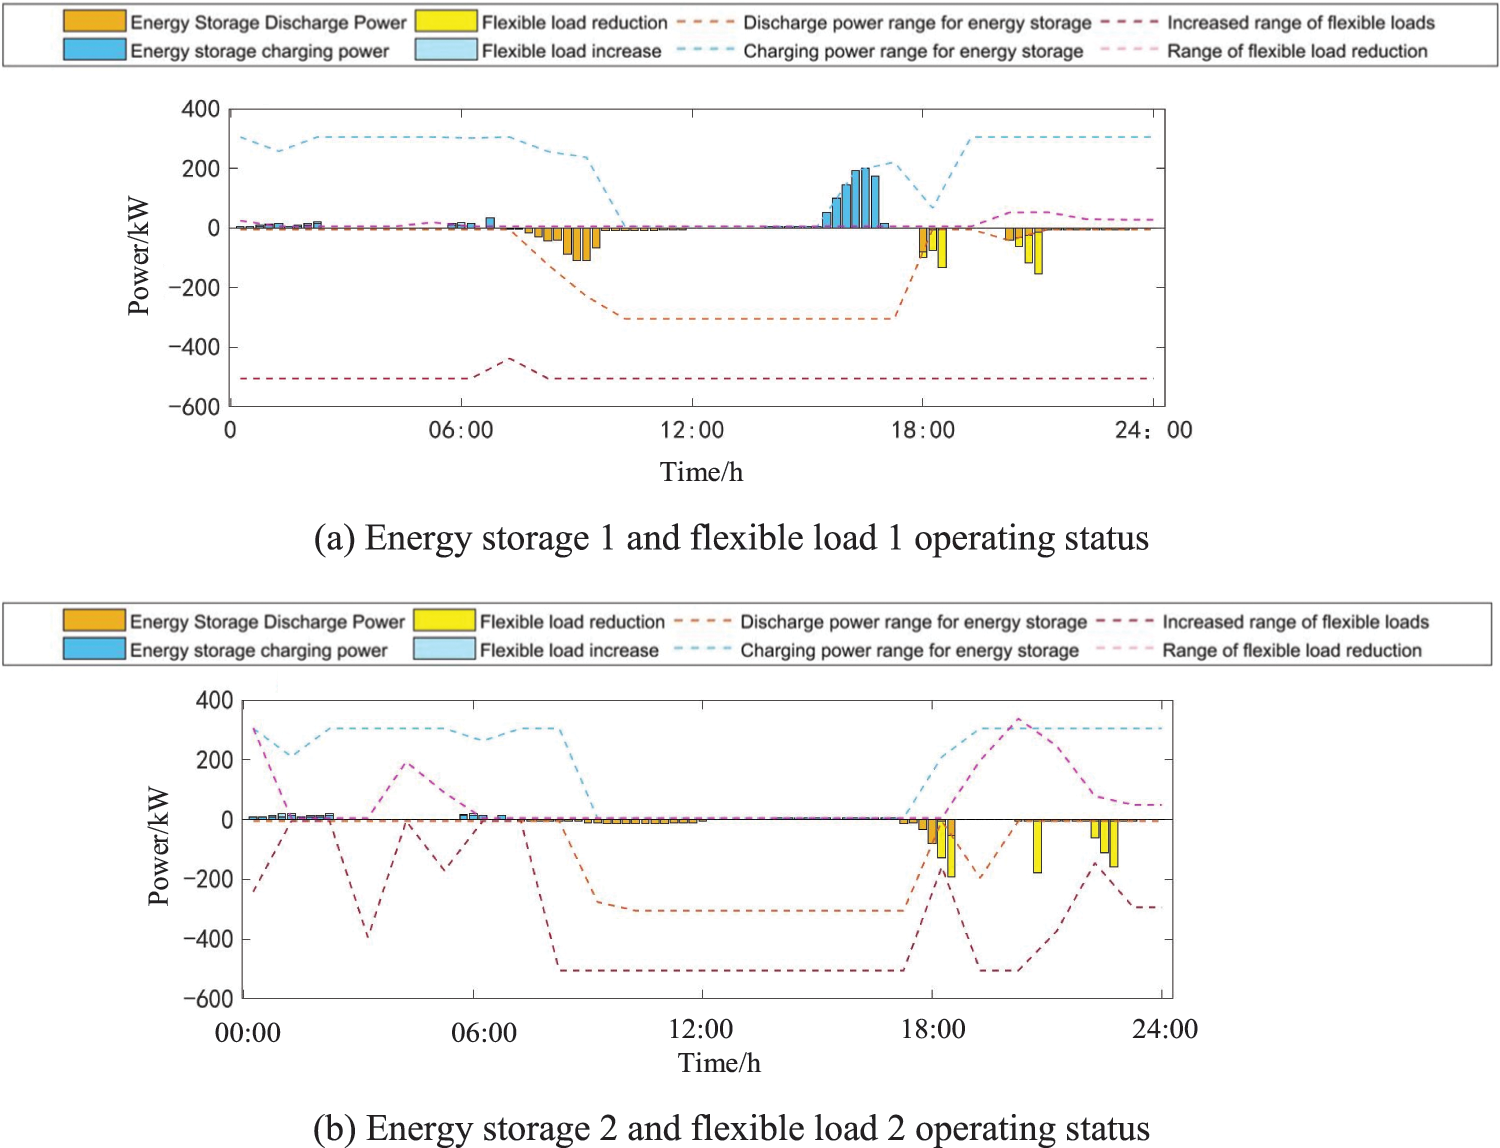
Figure 12: Risk perception based on intraday scheduling results
As shown in Fig. 12, in the 08:00–10:00 and 16:00–18:00 time periods, the energy storage operates in a continuous, long-time discharge/charging state, because this time is in the core security boundary changeover time, the system operating state is unstable, and a large number of flexible resources need to be involved in regulating to adapt to the operating state transition. In the 24:00–06:00 time period, the energy storage device is in the charging demand state for a long time, when the wind power generation is in the peak period and the load is in the trough period, so to promote low-carbon energy consumption and stabilize the operating voltage of the distribution network, the energy storage and the flexible loads must participate in a coordinated response. In the 20:00–23:00 time period, the flexible load is in the cutting state for a long time, because the system judges that it needs to concentrate the energy storage resources in the 08:00–10:00/17:00–19:00 risky period, and the energy storage capacity is insufficient, so it adopts the way of cutting the flexible load for the distribution grid scheduling. The flexible load storage device and the flexible loads are always within the output range determined by the day-ahead scheduling plan to guarantee the safe and stable operation of the distribution network during the intra-day phase.
The flexible resources on the load and storage side of the distribution network do not carry out actions during the 02:30–05:30, 06:30–06:45, and 19:30–20:00 time periods, and as shown in Table 3, the model determines that the 02:30–05:30 and 19:30–20:00 time periods are safe, and the 06:30–06:45 time period is a low-risk period, and therefore, when formulating the scheduling plan for this period, each of the Therefore, when scheduling plans are made for this period, each scheduling device does not take action, so that the voltage at each node of the distribution network, the risk of wind and light abandonment, and the risk of tidal overrun can be maintained in the safety zone, thus focusing flexibility resources on coping with high-risk periods.
By adjusting the intra-day scheduling plan, a safe period of 15 min * 15 min is judged within that 24 h and the period that flexible resources need to be adjusted is reduced by 15.6%, and the regulation and control of energy storage devices and flexible loads are efficiently concentrated when the system is weak, reducing the number of calculations for solving the scheduling plan.
The results of the two-stage scheduling without considering risk identification are analyzed, as shown in Fig. 13.
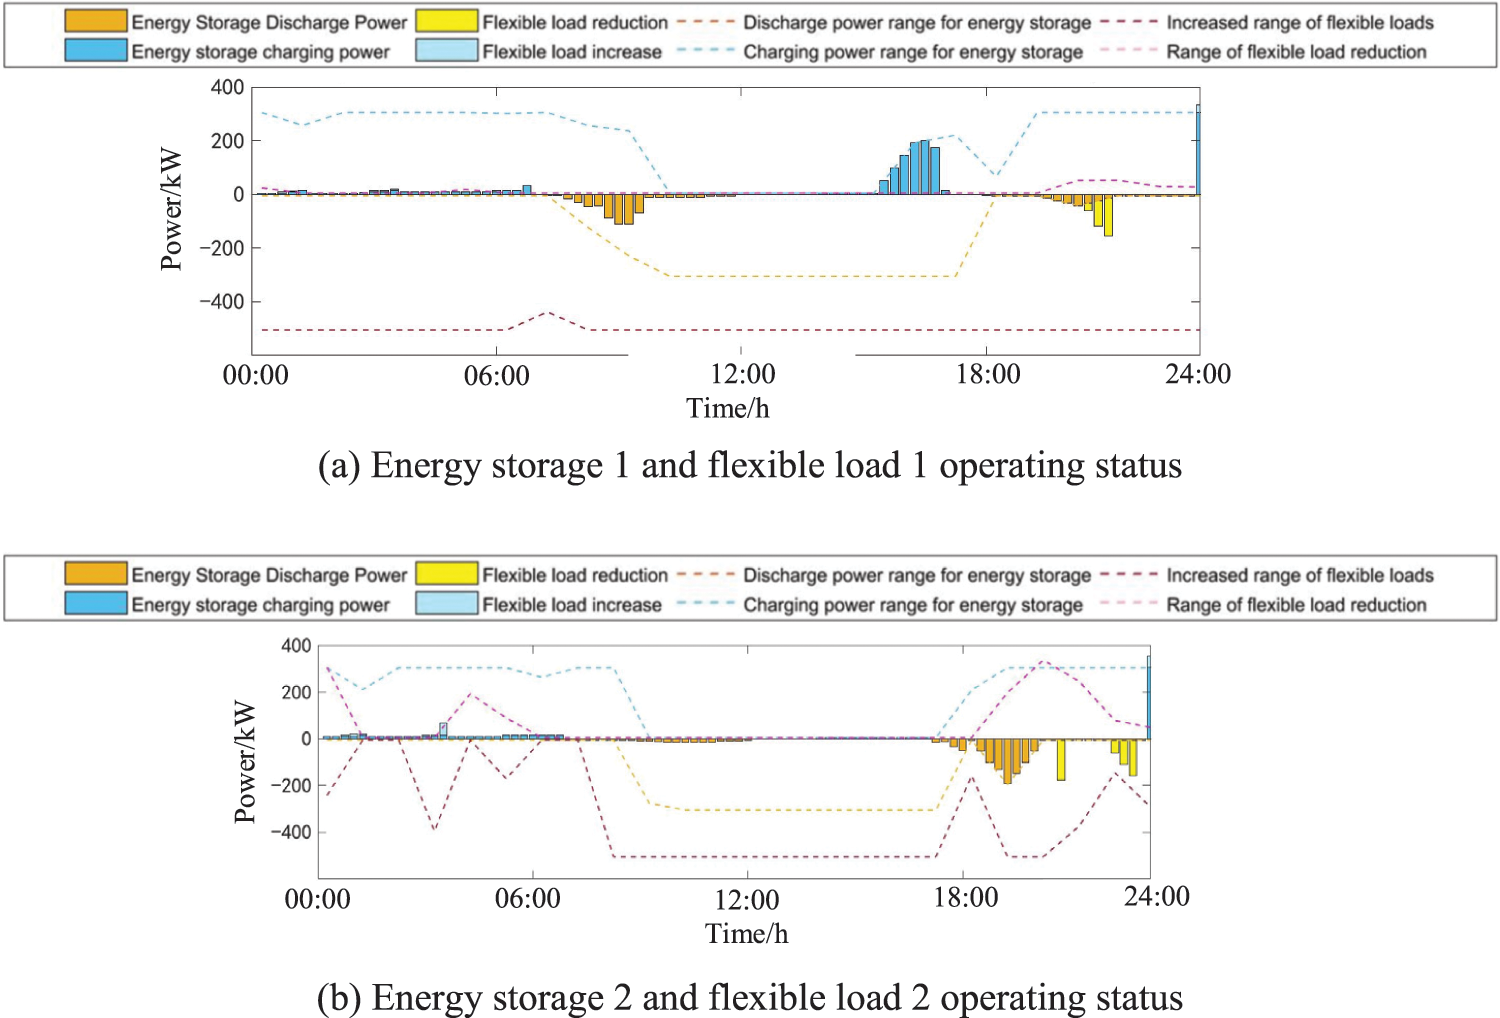
Figure 13: Distribution network topology
Due to the absence of risk perception and dynamic adjustment links, the scheduling plan time occupancy at this time is high, the energy storage device works continuously for a long time, and part of the scheduling resources are consumed in the safe/low-risk period, which has no obvious effect on the safety enhancement, and at the same time, the scheduling resources are consumed too much, which reduces the economy.
To study the applicability of the model in real cases, this paper adds a simulation analysis of a 50-node 10 kV voltage level distribution network in a region of Fujian, China, as shown in Fig. 14.
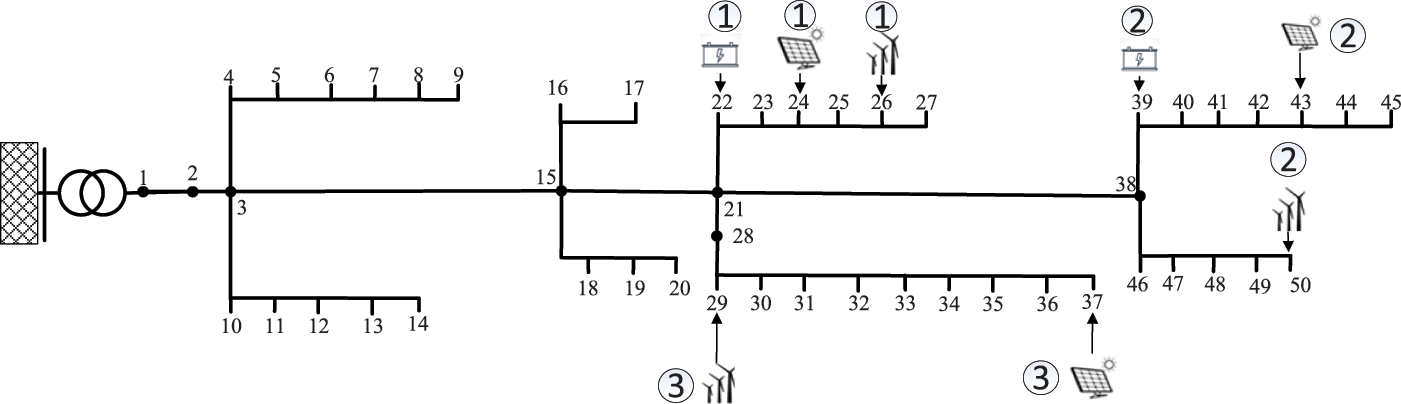
Figure 14: 50 node distribution network
In the 50-node example, the wind energy conversion system is located at nodes 26, 29, and 50, while the photovoltaic (PV) power generation facilities are installed at nodes 24, 37, and 43, with each wind turbine and PV unit having an allocated capacity of 1 MW. The energy storage system is deployed at nodes 22 and 39, characterized by a storage capacity of 1 MW per unit and an efficiency of 0.9 for both charging and discharging processes. The voltage amplitude of each node in the system is limited to the upper and lower limits of 1.07 and 0.93 p.u., respectively, and the maximum transmission power of the line is set to 6 MW.
Similar to the 33-node system, this article obtained the probability of voltage exceeding the upper and lower limits, wind and photovoltaic power curtailment, and branch power flow exceeding the limit of the active distribution network in each period by fitting the probability flow results of the historical full cycle internal load data without flexible resource response. The results are shown in Fig. 15.
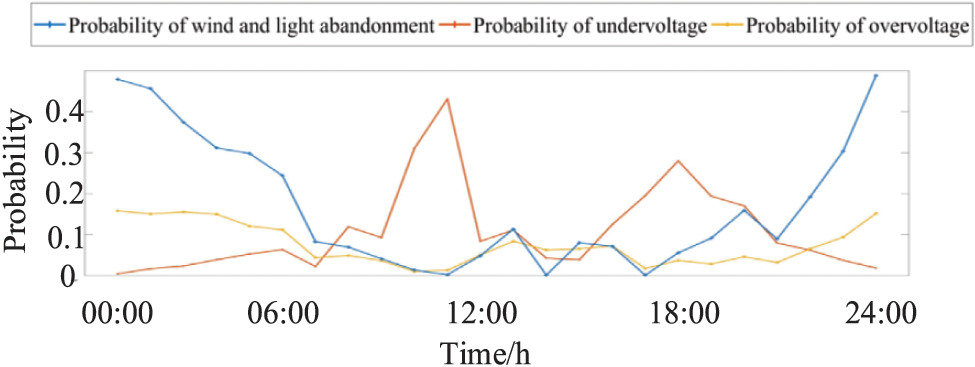
Figure 15: Risk probability calculation for each period
From the above figure, it can be seen that the risk distribution of the actual example is similar to the calculation results of the 33-node example. Among them, during the period of 21:00–7:00, wind and photovoltaic power curtailment are the main threats, and the maximum probability of wind and photovoltaic power curtailment can reach 0.5; During the periods of 08:00–13:00 and 16:00–20:00, the probability of voltage exceeding the lower limit is the main factor, and the risk probability can reach 0.4; During the 14:00–15:00 period, the operational risk of the distribution network is mainly based on the probability of wind and photovoltaic power curtailment/voltage exceeding the upper limit.
This article simulates the above example and calculates the energy storage output before and after the optimization of intraday rolling scheduling, as shown in Fig. 16.
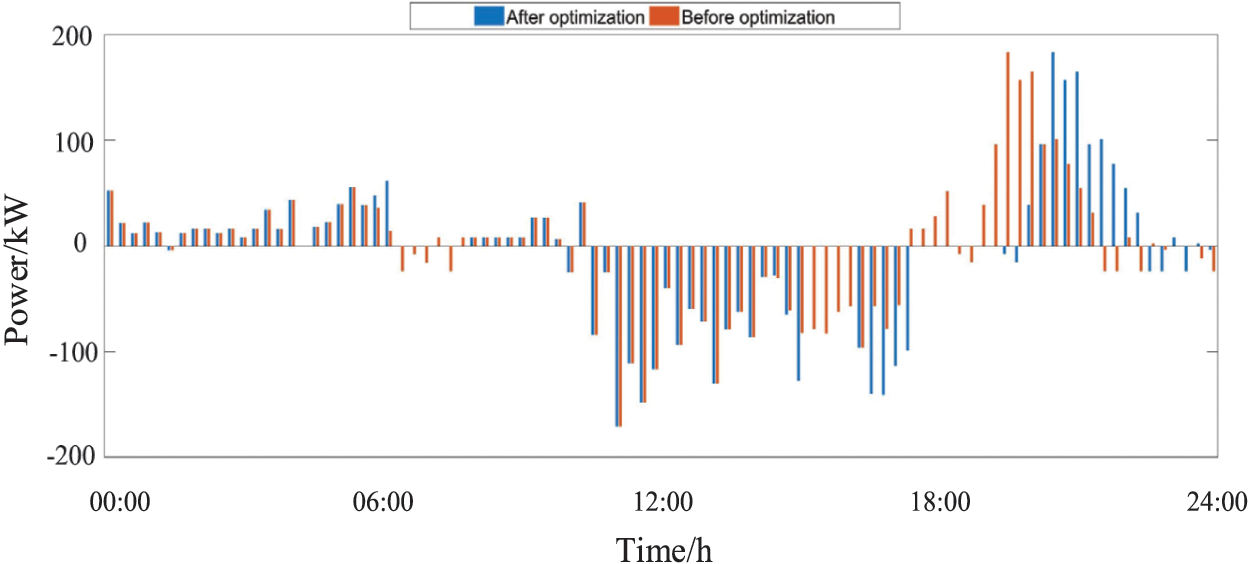
Figure 16: Energy storage output plan before and after optimization
From the above figure, it can be seen that the optimized energy storage plan concentrates more flexible resources on discharge from 15:00 to 17:30, which can more effectively cope with the increasing probability of voltage crossing the lower limit in the distribution network during this period; At the same time, the optimized scheduling plan allocates more flexible resources for charging during the 20:00–23:00 period, which can effectively address the problem of wind and photovoltaic power curtailment in the distribution network during this period.
Table 5 summarizes the specific economic indicators before and after optimization, and compares the optimization effects of traditional robust optimization (RO) algorithms with the model proposed in this paper.
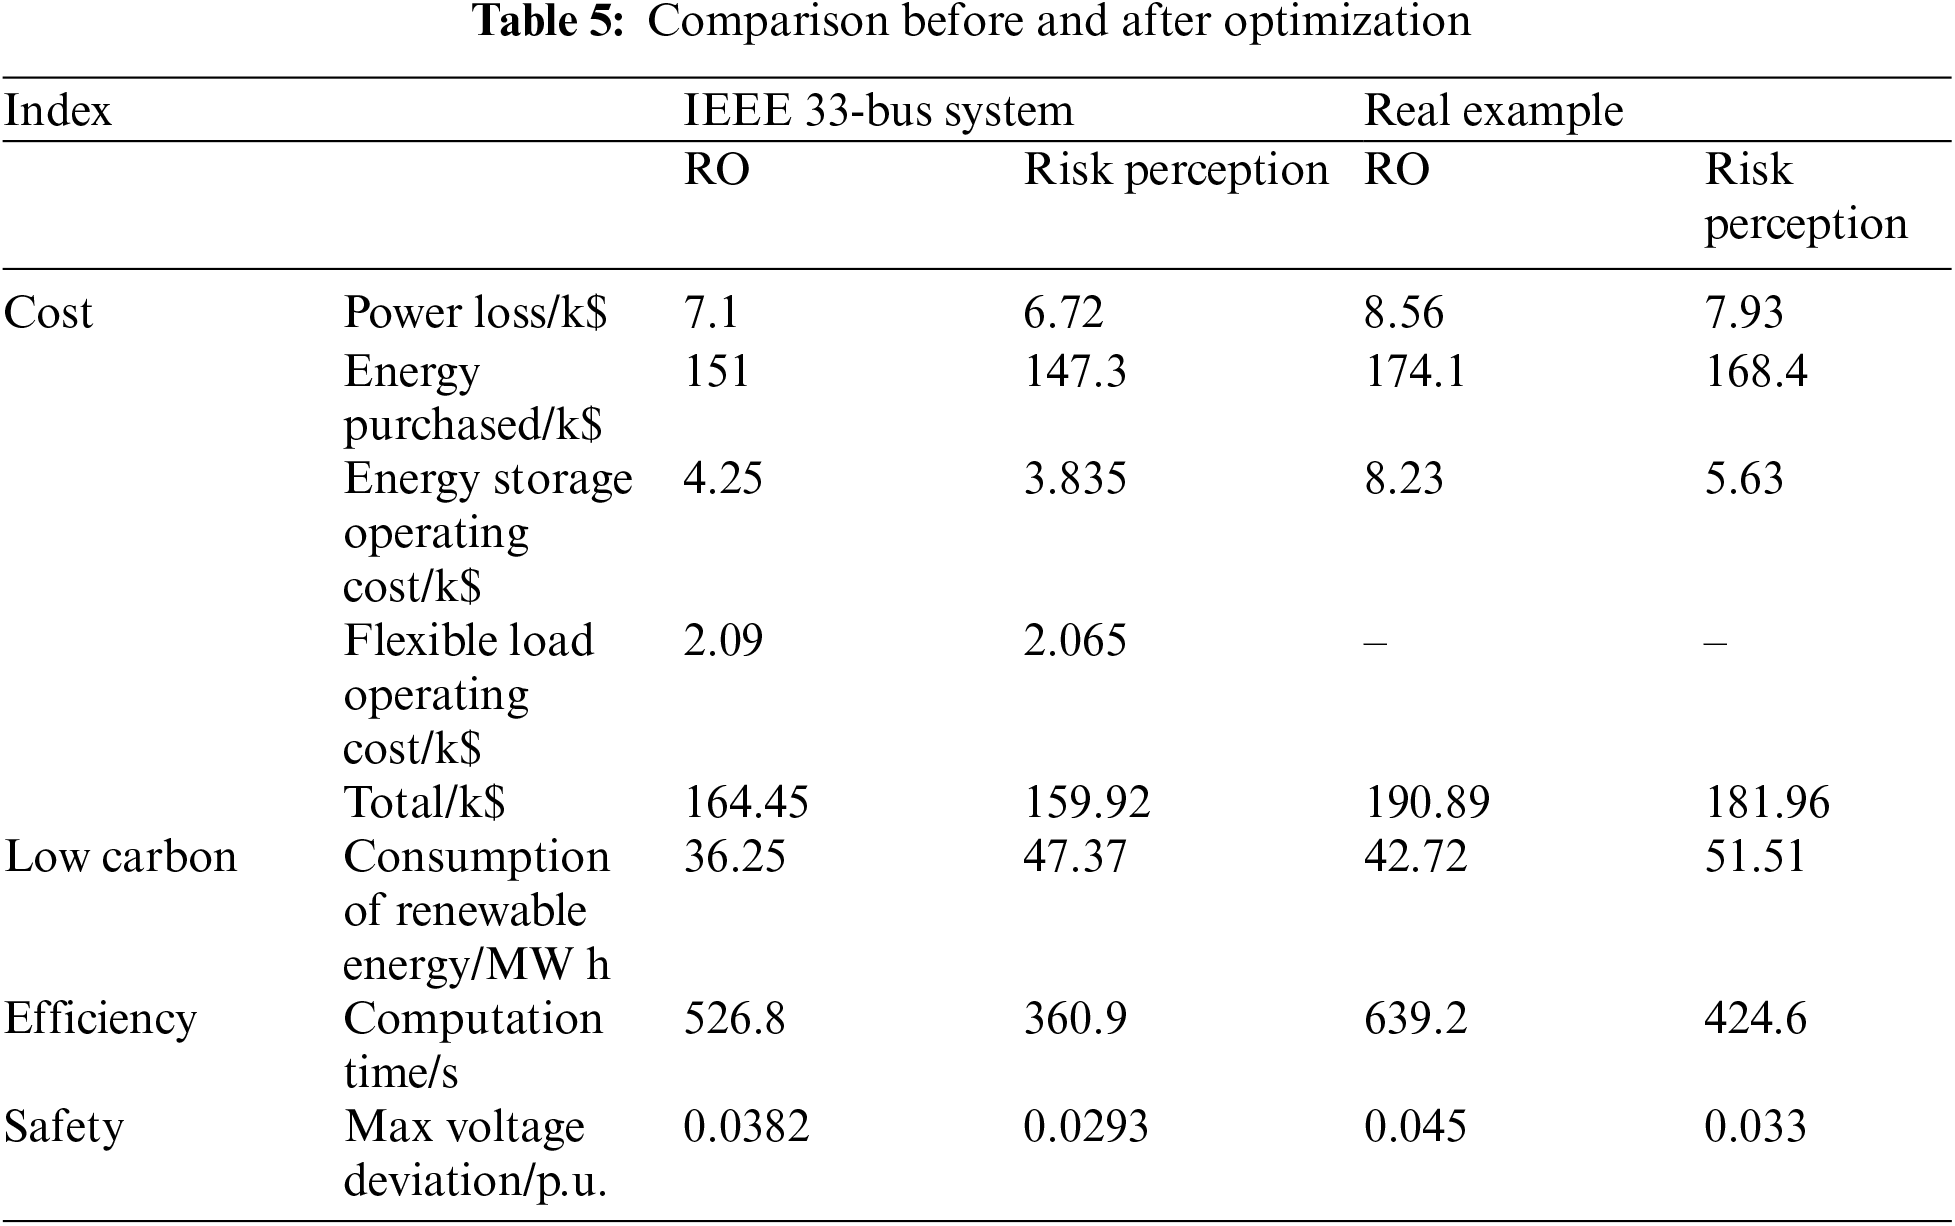
From Table 5, it can be seen that in the IEEE 33-node system and actual examples, the optimized model outperforms the RO model in terms of total operating cost, new energy consumption efficiency, and computational speed. Among them, due to the reasonable scheduling of flexible resources, the cost of purchasing electricity from the higher-level power grid has been reduced by 2.5% and 3.3%, respectively; The total cost of scheduling has decreased by 2.7% and 4.6%, respectively. From the perspective of new energy consumption, the amount of new energy consumption increased by 30.6% and 20.5%, respectively. Meanwhile, the computation time of the model was reduced by 31.5% and 33.5%, respectively. It can be seen that the proposed method can effectively improve the economic benefits and computational efficiency of the distribution network operation.
It is necessary to consider both the economic optimization effect and the degree of risk when determining the value of the risk threshold. Considering that one of the purposes of the model proposed in this article is to reasonably schedule flexible resources to improve the ability of the distribution network to absorb wind and photovoltaic energy, this article calculates the total consumption of wind and photovoltaic energy as an indicator to evaluate the optimization effect of the model; Meanwhile, a higher risk threshold can cause the model to classify slightly high-risk scenarios as low-risk scenarios, resulting in a certain level of risk. Therefore, this article summarizes the quantitative risk values for each period as indicators for evaluating system operational risk (Risk). As shown in Fig. 17.
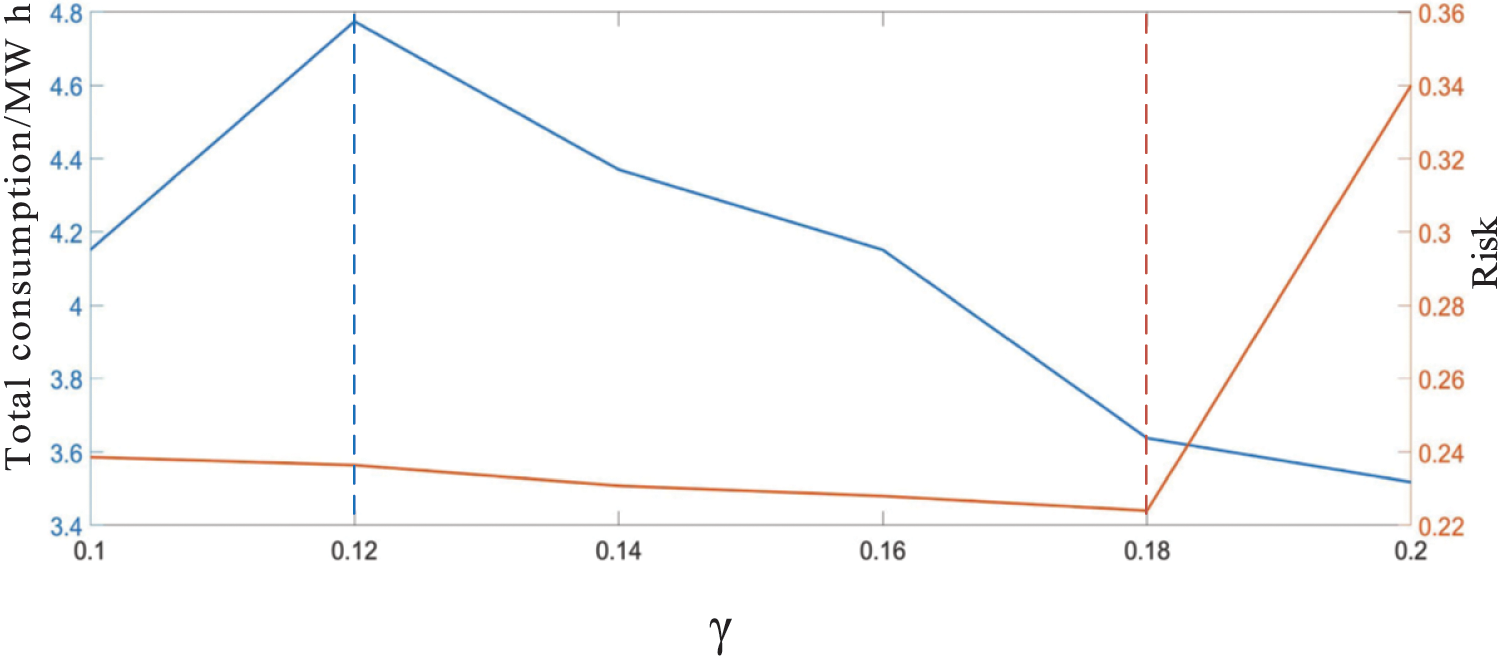
Figure 17: Sensitivity analysis of safety threshold
As shown in the above figure, with the increase of the safety threshold γ, the total consumption of wind and photovoltaic energy undergoes a process of first increasing and then decreasing. This is because when the gamma is too small, the system will allocate flexibility resources to low-risk periods, resulting in insufficient flexibility resources during periods of high wind and photovoltaic output, which reduces the system’s ability to absorb wind and photovoltaic energy. When the gamma value is too high, the system considers the operation state of power reversal as a safe situation, resulting in excessive concentration of flexibility resources and neglecting the consumption role of flexibility resources in other periods.
At the same time, as the safety threshold γ increases, the total value of risk quantification undergoes a process of first decreasing and then increasing. This is because when γ is too small, the system will allocate flexibility resources to low-risk periods, resulting in insufficient flexibility resources during periods of high wind and photovoltaic power output volatility, which increases the overall operational risk level; When the gamma value is too high, the system will concentrate its flexibility resources too much on a few high-risk periods, while ignoring the lower risks in other periods, which will also lead to an increase in operational risks throughout the entire cycle.
Considering the economy and safety of the distribution network operation, the value of γ should be set between 0.12 and 0.18. This is because, within this range, the trends of economic and risk changes concerning γ are the same. The stronger the economy within this range, the higher the risk, and vice versa. The specific value of γ is determined based on the preferences of local managers for economy and safety. To improve the applicability of the model, the value of γ is 0.15 in this article.
In this paper, a two-phase optimal dispatch model based on day-ahead risk situational awareness is proposed to address the volatility and uncertainty of low-carbon energy sources and loads in ADN.
(1) Based on the historical data of the active distribution network, this paper uses the probabilistic security of each security boundary as a constraint to obtain the upper and lower limits of the flexible resource outputs on the load side and storage side in the day-ahead scheduling phase. Thus, it provides a reference for intraday real-time optimization.
(2) In the intra-day rolling phase, a risk period identification and risk quantification methodology are proposed to sense and identify no/low/high-risk periods based on low-carbon energy (wind, PV) and load forecast information. In the 33-node arithmetic example, 15.7% of the scheduling periods are shortened, which provides a reference for intra-day scheduling plan adjustment and promotes the concentration of available flexible resources for load and storage.
(3) The intraday rolling optimization model is based on the operation risk assessment technique to realize the dynamic adjustment of the dispatch plan. In 33 nodes and real cases, it improves the operation speed and reduces the calculation time by more than 30%; at the same time, it can more effectively cope with the uncertainty of source loads during distribution network operation. Compared with the traditional model, it improves the rate of wind and photovoltaic energy consumption by more than 20% and reduces the cost of power purchase by 2%~3%, which can safely and effectively promote low-carbon renewable energy consumption and facilitate the process of decarbonization of the distribution network.
Acknowledgement: The authors would like to thank the headquarters of State Grid Corporation of China for their financial support in managing technology projects.
Funding Statement: This work is supported by Key Technology Research and Application of Online Control Simulation and Intelligent Decision Making for Active Distribution Network (5108-202218280A-2-377-XG).
Author Contributions: Yukai Li: Writing—original draft, Conceptualization, Methodology, Investigation, Formal analysis, Data curation, Visualization. Ruixue Zhang, Yongfeng Ni and Hongkai Qiu: Conceptualization, Writing—review & editing, Supervision, Methodology, Investigation, Data curation, Validation. Yuning Zhang and Chunming Liu: Writing—review & editing, Validation. All authors reviewed the results and approved the final version of the manuscript.
Availability of Data and Materials: Data will be made available on request.
Ethics Approval: This study adheres to ethical standards and has been approved.
Conflicts of Interest: The authors declare no conflicts of interest to report regarding the present study.
References
1. P. Zhou, Y. Lv, and W. Wen, “The low-carbon transition of energy systems: A bibliometric review from an engineering management perspective,” Engineering, vol. 29, no. 1, pp. 147–158, 2023. doi: 10.1016/j.eng.2022.11.010. [Google Scholar] [CrossRef]
2. A. A. Abdullah and T. M. Hassan, “Smart grid (SG) properties and challenges: An overview,” Discov. Energy, vol. 2, 2022, Art. no. 8. doi: 10.1007/s43937-022-00013-x. [Google Scholar] [CrossRef]
3. H. Wang, L. Le, Z. Kai, X. Chai, X. Li and M. Xie, “Risk grading of distribution network equipment group based on fuzzy clustering factor analysis,” in 2020 Int. Conf. Sens. Measur. Data Analyt. Era Artif. Intell. (ICSMD), Xi’an, China, 2020, pp. 582–586. [Google Scholar]
4. C. Xie, D. Jia, J. Liu, X. Sun, and J. Zhou, “Research on operation risk prevention and control technology of intelligent distribution network based on ultra short term load forecasting,” in 2020 IEEE 1st China Int. Youth Conf. Elect. Eng. (CIYCEE), Tianjin, China, 2020, pp. 1–6. [Google Scholar]
5. X. Wang, X. Du, H. Wang, S. Yan, and T. Fan, “Research on coordinated optimization of source-load-storage considering renewable energy and load similarity,” Energies, vol. 17, no. 6, 2024, Art. no. 1301. doi: 10.3390/en17061301. [Google Scholar] [CrossRef]
6. X. P. Nie, S. A. Mansouri, A. Rezaee Jordehi, and M. Tostado-Véliz, “A two-stage optimal mechanism for managing energy and ancillary services markets in renewable-based transmission and distribution networks by participating electric vehicle and demand response aggregators,” Int. J. Elect. Pow. Energy Syst., vol. 158, pp. 1–15, 2024. doi: 10.1016/j.ijepes.2024.109917. [Google Scholar] [CrossRef]
7. M. Ali, K. Prakash, M. A. Hossain, and H. R. Pota, “Intelligent energy management: Evolving developments, current challenges, and research directions for sustainable future,” J. Clean. Product., vol. 314, no. 5, pp. 1–15, 2021. doi: 10.1016/j.jclepro.2021.127904. [Google Scholar] [CrossRef]
8. M. Tostado-Véliz, S. A. Mansouri, A. Rezaee Jordehi, S. A. Habeeb, and F. Jurado, “A risk-aware P2P platform involving distributed generators, energy communities and storage assets,” J. Energ. Stor., vol. 100, no. 2, pp. 1–15, 2024. doi: 10.1016/j.est.2024.113606. [Google Scholar] [CrossRef]
9. Y. Zhao, Z. Li, P. Ju, and Y. Zhou, “Two-stage data-driven dispatch for integrated power and natural gas systems by using stochastic model predictive control,” Appl. Energy, vol. 263, no. 4, pp. 1–19, 2023. doi: 10.1016/j.apenergy.2023.121201. [Google Scholar] [CrossRef]
10. T. Luo, A. Xuan, Y. Wang, G. Li, J. Fang and Z. Liu, “Energy efficiency evaluation and optimization of active distribution networks with building integrated photovoltaic systems,” Renew. Energy, vol. 219, pp. 1–15, 2023. doi: 10.1016/j.renene.2023.119447. [Google Scholar] [CrossRef]
11. B. Ji, H. Liu, P. Cheng, X. Ren, H. Pi and L. Li, “Phased optimization of active distribution networks incorporating distributed photovoltaic storage system: A multi-objective coati optimization algorithm,” Ener. Stor., vol. 38, no. 1, pp. 1–13, 2024. doi: 10.1016/j.est.2024.112093. [Google Scholar] [CrossRef]
12. Z. Cheng, P. Wang, and Y. Xu, “Multi-time scale optimization scheduling of microgrid considering source and load uncertainty,” Energy Rep., vol. 2, pp. 1–9, 2023. doi: 10.1016/j.egyr.2022.02.016. [Google Scholar] [CrossRef]
13. H. Sheng, C. Wang, and J. Liang, “Multi-timescale active distribution network optimal scheduling considering temporal-spatial reserve coordination,” Int. J. Electr. Power Energy Syst., vol. 125, no. 10, pp. 1–11, 2021. doi: 10.1016/j.ijepes.2020.106526. [Google Scholar] [CrossRef]
14. A. Rahimi, M. Zarghami, M. Vaziri, and S. Vadhva, “A simple and effective approach for peak load shaving using Battery Storage Systems,” in 2013 North American Power Symp. (NAPS), Manhattan, KS, USA, 2013, pp. 1–5. [Google Scholar]
15. M. D. de Souza Dutra, M. F. Anjos, and S. L. Digabel, “A framework for peak shaving through the coordination of smart homes,” in 2019IEEE PES Innov. Smart Grid Technol. Conf.-Latin America, Gramado, Brazil, 2019, pp. 1–6. [Google Scholar]
16. Y. Guo, Q. Zhang, and Z. Wang, “Cooperative peak shaving and voltage regulation in unbalanced distribution feeders,” IEEE Trans. Power Syst., vol. 36, no. 6, pp. 5235–5244, 2021. doi: 10.1109/TPWRS.2021.3069781. [Google Scholar] [CrossRef]
17. Z. Shu and P. Jirutitijaroen, “Latin hypercube sampling techniques for power systems reliability analysis with renewable energy sources,” IEEE Trans. Power Syst., vol. 26, no. 4, pp. 2066–2073, 2011. doi: 10.1109/TPWRS.2011.2113380. [Google Scholar] [CrossRef]
18. J. Guo et al., “Security risk assessment of power system based on latin hypercube sampling and daily peak load forecasting,” in 2020 IEEE 4th Conf. Ener. Inter. Energy Syst. Integrat. (EI2), Wuhan, China, 2020, pp. 2787–2792. [Google Scholar]
19. J. Cai, L. Hao, Q. Xu, and K. Zhang, “Reliability assessment of renewable energy integrated power systems with an extendable Latin hypercube importance sampling method,” Sustain. Energy Technol. Assessm., vol. 50, no. 10, pp. 1–13, 2022. doi: 10.1016/j.seta.2021.101792. [Google Scholar] [CrossRef]
20. Q. Li, X. Wang, and S. Rong, “Probabilistic load flow method based on modified latin hypercube-important sampling,” Energies, vol. 11, no. 11, 2018, Art. no. 3171. doi: 10.3390/en11113171. [Google Scholar] [CrossRef]
21. J. Lu, H. Du, R. Zhao, H. Li, Y. Tan and W. Guo, “Optimal scheduling of the active distribution network with microgrids considering multi-timescale source-load forecasting,” Electronics, vol. 13, no. 17, 2024, Art. no. 3455. doi: 10.3390/electronics13173455. [Google Scholar] [CrossRef]
22. Q. Xing, Z. Chen, T. Zhang, X. Li, and K. H. Sun, “Real-time optimal scheduling for active distribution networks: A graph reinforcement learning method,” Int. J. Elect. Pow. Energy Syst., vol. 145, 2023, Art. no. 108637. doi: 10.1016/j.ijepes.2022.108637. [Google Scholar] [CrossRef]
23. M. Choobdari, M. Samiei Moghaddam, R. Davarzani, A. Azarfar, and H. Hoseinpour, “Robust distribution networks reconfiguration considering the improvement of network resilience considering renewable energy resources,” Sci. Rep., vol. 14, no. 1, 2024, Art. no. 23041. doi: 10.1038/s41598-024-73928-1. [Google Scholar] [PubMed] [CrossRef]
24. M. Hemmati, B. Mohammadi-Ivatloo, M. Abapour, and A. Anvari-Moghaddam, “Optimal chance-constrained scheduling of reconfigurable microgrids considering islanding operation constraints,” IEEE Syst., vol. 14, no. 4, pp. 5340–5349, 2020. doi: 10.1109/JSYST.2020.2964637. [Google Scholar] [CrossRef]
25. Y. Gao, M. Tahir, P. Siano, Y. Bi, S. Hu and J. Yang, “Optimization of renewable energy-based integrated energy systems: A three-stage stochastic robust model,” Appl. Energy, vol. 377, no. 4, pp. 123–134, 2025. doi: 10.1016/j.apenergy.2024.124635. [Google Scholar] [CrossRef]
26. X. Lyu, T. Liu, X. Liu, C. He, L. Nan and H. Zeng, “Low-carbon robust economic dispatch of park-level integrated energy system considering price-based demand response and vehicle-to-grid,” Energy, vol. 263, no. 3, pp. 1–12, 2023. doi: 10.1016/j.energy.2022.125739. [Google Scholar] [CrossRef]
27. T. P. Abud, A. A. Augusto, M. Z. Fortes, R. S. Maciel, and B. S. M. C. Borba, “State of the art monte carlo method applied to power system analysis with distributed generation,” Energies, vol. 16, no. 1, pp. 394–418, 2023. doi: 10.3390/en16010394. [Google Scholar] [CrossRef]
28. D. Roos, “Latin hypercubic sampling based on adaptive orthogonal decomposition,” in Proc. ECCOMAS Congress 2016, Crete Island, Greece, 2016, pp. 3333–3343. [Google Scholar]
29. C. Feng, X. Wang, and H. Chen, “Optimal unit maintenance scheduling of a power prouducer under price uncertainty,” in 2009 IEEE/PES Power Systems Conf. Exposit., Seattle, WA, USA, 2009, pp. 1–8. [Google Scholar]
30. B. Shao, Z. Wang, D. Song, W. Ge, and C. Wang, “Stochastic unit maintenance model of power prouducers considering market price uncertainty,” in IEEE PES Innov. Smart Grid Technol., Tianjin, China, 2012, pp. 1–5. [Google Scholar]
31. J. Liu, C. Hu, A. Kimber, and Z. Wang, “Uses, cost-benefit analysis, and markets of energy storage systems for electric grid applications,” J. Energy Stor., vol. 32, no. 5, pp. 1–12, 2020. doi: 10.1016/j.est.2020.101731. [Google Scholar] [CrossRef]
32. W. Wei, J. Wang, N. Li, and S. Mei, “Optimal power flow of radial networks and its variations: A sequential convex optimization approach,” IEEE Trans. Smart Grid, vol. 8, no. 6, pp. 2974–2987, 2017. doi: 10.1109/TSG.2017.2684183. [Google Scholar] [CrossRef]
33. H. Hijazi, C. Coffrin, and P. V. Hentenryck, “Convex quadratic relaxations for mixed-integer nonlinear programs in power systems,” Math. Prog. Comp., vol. 9, no. 3, pp. 321–367, 2016. doi: 10.1007/s12532-016-0112-z. [Google Scholar] [CrossRef]
34. M. M. -U -T. Chowdhury and S. Kamalasadan, “A new second-order cone programming model for voltage control of power distribution system with inverter-based distributed generation,” IEEE Trans. Ind. Appl., vol. 57, no. 6, pp. 6559–6567, 2021. doi: 10.1109/TIA.2021.3107825. [Google Scholar] [CrossRef]
35. D. A. Elalfy, E. Gouda, M. F. Kotb, V. Bureš, and B. E. Sedhom, “Comprehensive review of energy storage systems technologies, objectives, challenges, and future trends,” Energy Strategy Rev., vol. 54, no. 45, pp. 1–23, 2024. doi: 10.1016/j.esr.2024.101482. [Google Scholar] [CrossRef]
36. W. Shen, B. Zeng, and M. Zeng, “Multi-timescale rolling optimization dispatch method for integrated energy system with hybrid energy storage system,” Energy, vol. 283, no. 4, pp. 360–374, 2023. doi: 10.1016/j.energy.2023.129006. [Google Scholar] [CrossRef]
37. X. Ma, B. Peng, X. Ma, C. Tian, and Y. Yan, “Multi-timescale optimization scheduling of regional integrated energy system based on source-load joint forecasting,” Energy, vol. 283, no. 4, pp. 1–12, 2023. doi: 10.1016/j.energy.2023.129186. [Google Scholar] [CrossRef]
38. “Elia Wind power generation,” Accessed: Dec. 05, 2024. [Online]. Available: https://www.elia.be/en/grid-data/power-generation/wind-power-generation [Google Scholar]
Cite This Article
 Copyright © 2025 The Author(s). Published by Tech Science Press.
This work is licensed under a Creative Commons Attribution 4.0 International License , which permits unrestricted use, distribution, and reproduction in any medium, provided the original work is properly cited.
 Downloads
 Citation Tools