
 Submit a Paper
 Propose a Special lssue
 Open Access
ARTICLE

Analysis of Renewable Energy Absorption and Economic Feasibility in Multi-Energy Complementary Systems under Spot Market Conditions
School of Electrical Engineering, Northeast Electric Power University, Jilin, 132013, China
* Corresponding Author: Chuang Liu. Email:
Energy Engineering 2025, 122(2), 577-619. https://doi.org/10.32604/ee.2024.056748
Received 30 July 2024; Accepted 31 October 2024; Issue published 31 January 2025
 View Full Text
 Download PDF
Abstract
As the power system transitions to a new green and low-carbon paradigm, the penetration of renewable energy in China’s power system is gradually increasing. However, the variability and uncertainty of renewable energy output limit its profitability in the electricity market and hinder its market-based integration. This paper first constructs a wind-solar-thermal multi-energy complementary system, analyzes its external game relationships, and develops a bi-level market optimization model. Then, it considers the contribution levels of internal participants to establish a comprehensive internal distribution evaluation index system. Finally, simulation studies using the IEEE 30-bus system demonstrate that the multi-energy complementary system stabilizes nodal outputs, enhances the profitability of market participants, and promotes the market-based integration of renewable energy.Keywords
In 2015, the Central Committee of the Communist Party of China issued the document “Several Opinions on Further Deepening the Reform of the Electric Power System (Zhongfa [2015] No. 9)” [1], which proposed accelerating the establishment of a competitive electricity market system. This marked the beginning of a new round of electricity market reforms in China, including the construction of a power spot market. Under the guidance of Document No. 9, various provinces (regions) have actively initiated a range of reform practices, including the determination of transmission and distribution electricity prices, retail market reforms, and direct trading, in accordance with policy requirements and their own realities. Significant progress has been made in the construction of a market-oriented electricity system [2]. However, due to insufficient experience during the trial operation, there have been issues in mechanism design, leading to losses for some power generation companies. For example, as mentioned in the literature [3], during the 2023 May Day period, the Shandong power system experienced 21 h of negative electricity prices in the Shandong electricity spot market, causing economic losses for market participants. In response to existing issues in the spot market, literature [4] provided a comparative analysis of the construction of spot markets in pilot regions and summarized key points for market development.
In the construction of the electricity spot market, the study of bidding strategies for generators is crucial for power generation entities to maximize their profits. Currently, research on bidding strategies for power generation companies can be broadly categorized into four types: 1) Cost-Based Bidding Strategies [5,6]: Generators bid by adding a certain profit margin to their known generation costs; 2) Clearing Price Forecast-Based Bidding Strategies [7–11]: Generators adjust their bids based on forecasts of market clearing prices, seeking reasonable output levels to enhance their revenues; 3) Multi-Agent Model-Based Pricing Strategies [12–14]: Utilizing adaptive learning capabilities of agents, generators employ specific machine learning algorithms to continuously adjust their bidding strategies during the learning process, aiming to maximize their profits; 4) Game Theory-Based Bidding Strategies [15–17]: The main idea is to construct a game model based on an understanding of the trading behaviors of market participants and then find the equilibrium point of this model to determine the optimal bidding strategy for generators.
In recent years, wind and photovoltaic power have continued to grow, and the penetration of renewable energy in the power system has been increasing annually. To date, at least 160 countries have established renewable energy targets, and an estimated 145 countries have implemented renewable energy support policies [18]. Many countries have adopted incentives for renewable energy development [19], including feed-in tariffs, guaranteed grid access, green certificates, investment incentives, tax credits, and cost-sharing measures. In the past five years, the global installed capacity of renewable energy has increased by approximately 50%. Solar photovoltaic (PV) is the fastest-growing renewable energy source, with an annual growth rate exceeding 20%. As of 2023, the global installed capacity of solar PV has surpassed 1200 gigawatts (GW). However, as renewable energy continues to grow, issues with integrating new energy into spot markets have become increasingly prominent. To facilitate the effective integration of renewable energy, extensive research has been conducted both domestically and internationally on smart grids and integrated energy storage systems for renewable energy. Smart grids, by integrating various advanced technologies and strategies, use system integration to connect different energy sectors, as discussed in references [20,21]. They complement the characteristics of multiple energy sources to meet the flexible supply needs of renewable energy, delivering the most efficient and clean energy possible in terms of timing, quantity, and quality [22]. Wind and solar power face output instability due to their inherent intermittency. Developing energy storage technologies can mitigate this intermittency, enhancing the utilization of renewable energy and improving the safety and economic operation of power systems. This approach is an effective measure for addressing the integration of renewable energy into the grid [23,24].
For the issue of revenue distribution among multiple cooperating entities, the existing mainstream distribution methods generally belong to the field of cooperative game theory [25]. Literature [26] quantifies the risk-benefit of each entity based on marginal contribution and marginal expected loss to distribute virtual power plant revenues. Literature [27] established a cooperative game model for microgrid community (MGC) and used Nash bargaining to coordinate the revenue distribution among microgrids. Literature [28] establishes a Nash-Harsanyi bargaining theory-based profit distribution mechanism for wind-hydrogen-storage consortiums, aiming to enhance the participation of members in market competition through equitable profit sharing. Literature [29] considered the factors of risk, profit, and carbon emissions, and developed a Nash bargaining-based GPW-VPP profit distribution strategy. The allocation scheme satisfies the comprehensive contributions of multiple parties. Literature [30] employs a utility function to quantify the risk aversion of each distributed energy source within a virtual power plant and combines factors such as prediction accuracy and marginal contribution to establish a revenue distribution model for cooperative alliances participating in the two-settlement energy market. These studies have developed optimization models for the joint operation of renewable energy and thermal power units, promoting the efficient integration of renewable energy. However, the complementary advantages of joint operation between renewable energy and thermal power have not been specifically addressed in the context of the spot market.
This paper constructs a wind-solar-thermal multi-energy complementary system at the same grid connection point, considering the impact of different bidding strategies of generation entities on spot market revenues. It proposes an internal revenue distribution method based on cooperative game theory. Firstly, the analysis focuses on the internal coupling and coordination within the multi-energy complementary system and the external competitive bidding relationships, as well as participation processes in the day-ahead and real-time markets. Secondly, the study considers the impact of different bidding strategies on spot market prices and revenues, developing a bi-level optimization model for generation entity bidding to analyze the operational revenue of the multi-energy complementary system. It also considers the contributions of generation entities within the system to the day-ahead and real-time balancing markets, proposing a cooperative game-based revenue distribution mechanism. Finally, case studies verify the effectiveness of the multi-energy complementary system’s participation in the spot market in enhancing the profitability of market participants and the market-based integration of renewable energy.
2 The Concept of Multi-Energy Complementary Systems and Their Market Research Value
2.1 The Concept of Multi-Energy Complementary Systems
Broadly speaking, a regional power grid can form a multi-energy complementary system by integrating and coupling various types of generation units. Such a system, which includes multiple generation units, is collectively referred to as a multi-energy complementary system. In a narrower sense, the multi-energy complementary system discussed in this paper specifically refers to an integrated energy system formed by coupling wind and solar renewable energy sources with traditional coal-fired power units at the same grid connection point, as shown in Fig. 1. This form of coupling is diverse. Although multi-energy complementary systems at different grid connection points are essentially similar to existing bundled wind-solar-coal configurations, at the same grid connection point, the multi-energy complementary system forms a unified control and operational entity. This allows it to participate in power market competition as a whole, thus holding significant research value.
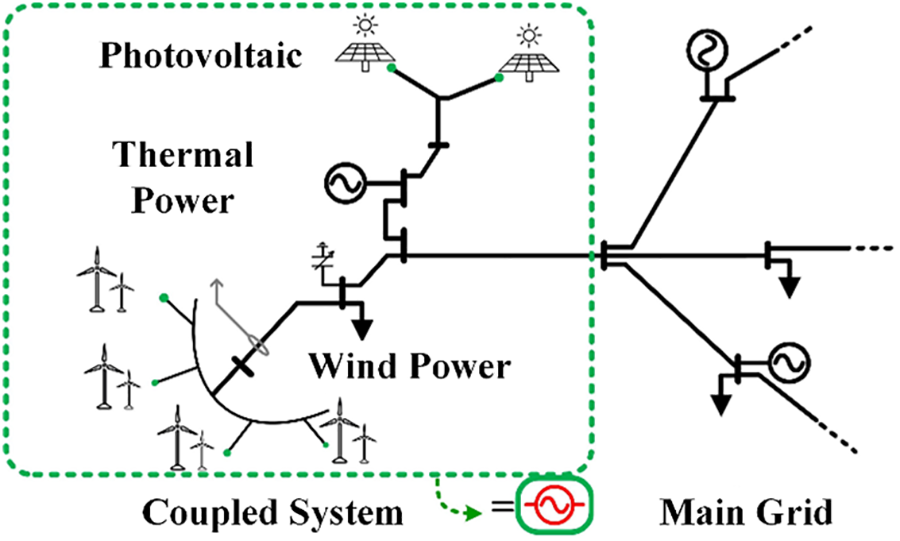
Figure 1: Schematic diagram of a multi-energy complementary system
2.2 The Market Research Value of Multi-Energy Complementary Systems
The power spot market refers to a market where eligible entities conduct unified day-ahead, intraday, and real-time electricity transactions on a trading platform. The specific trading rules of the spot market are shown in Fig. 2.
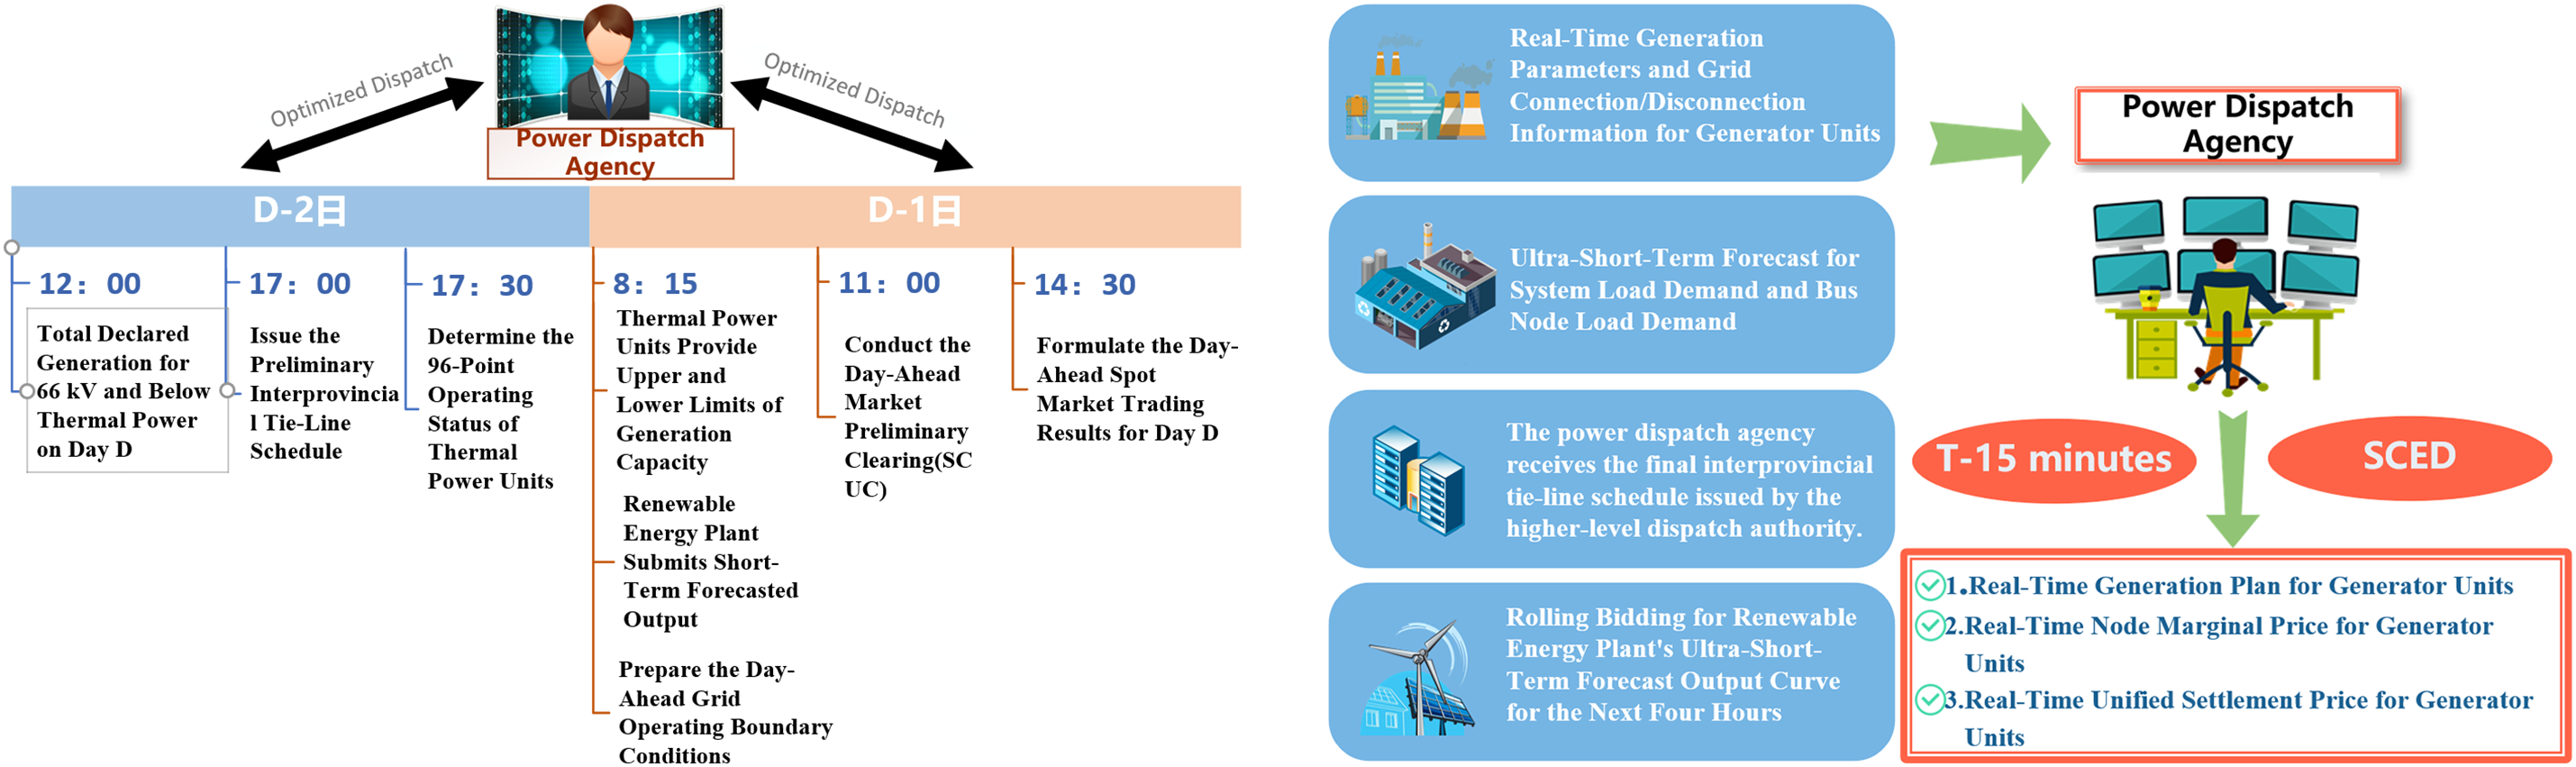
Figure 2: Operating rules of the spot market
In the initial phase of developing China’s spot market, a unilateral bidding method is implemented. In the day-ahead market, generation entities must submit a single monotonic non-decreasing generation price curve for the entire day to the electricity trading institution to participate in market bidding. New energy power stations submit short-term forecast output curves and prices on the bidding day and participate in market clearing with 10% of their day-ahead short-term forecast output, ensuring system security is met. After the market clearing is completed, the settlement is conducted on a daily and monthly basis. The forecast deviation for new energy is assessed based on the deviation area between the forecast curve and the actual output curve.
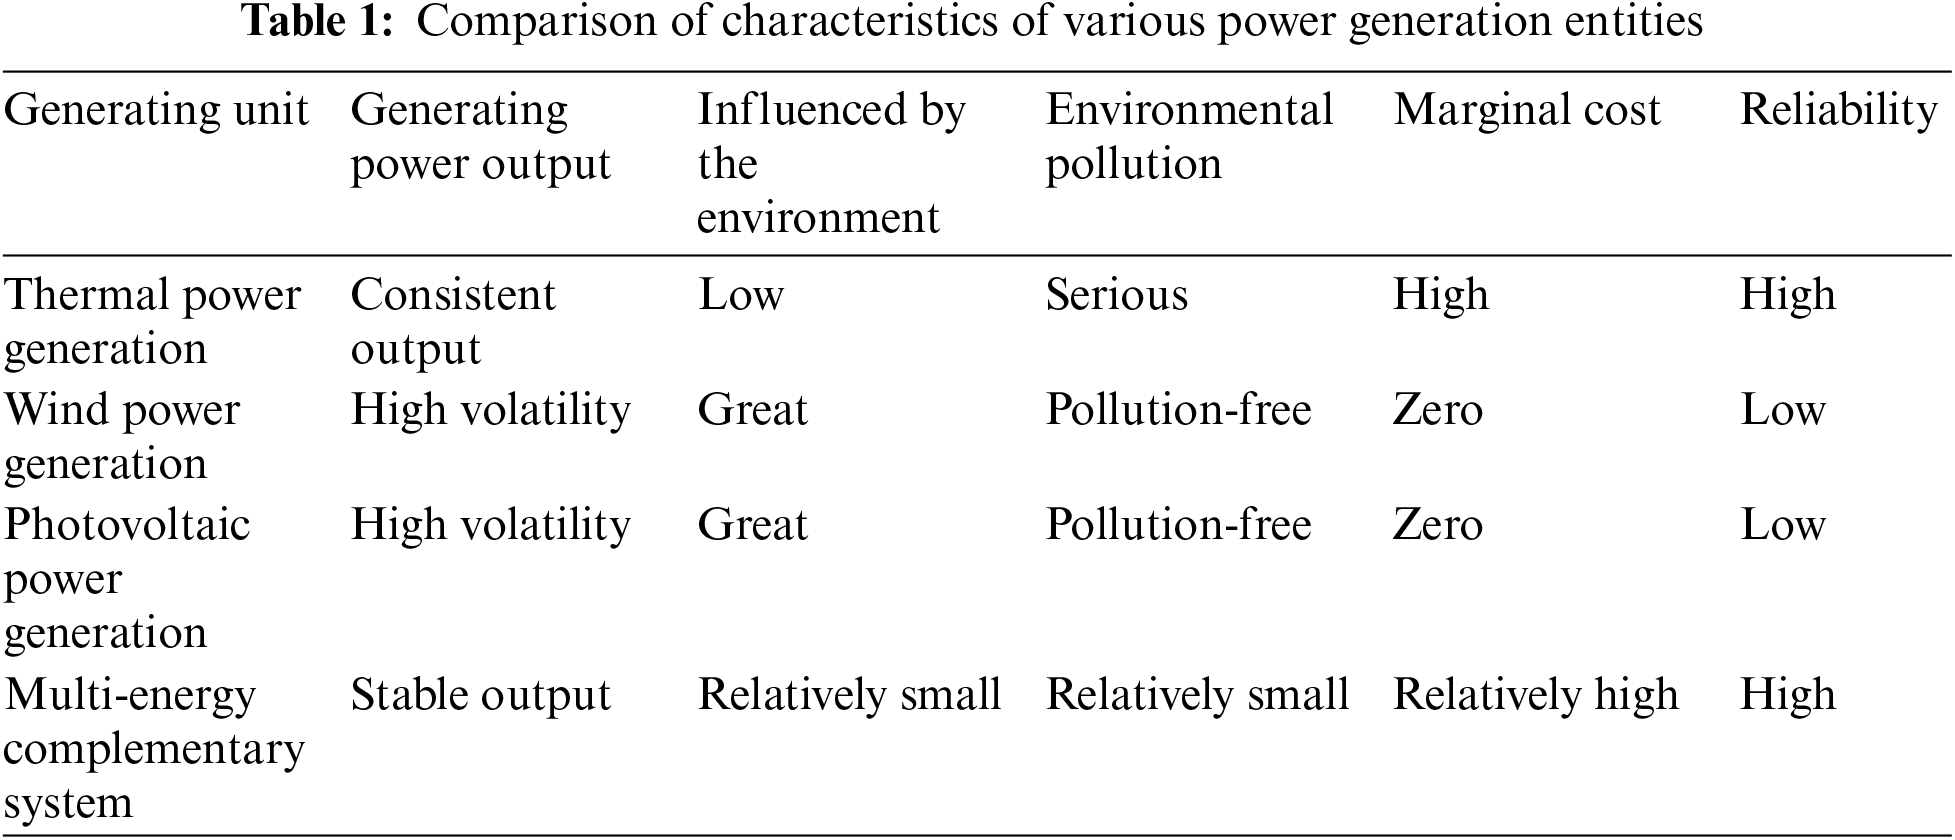
In the context of the current green and low-carbon energy transition, the penetration of renewable energy in the grid is gradually increasing. However, under the existing power spot market mechanism, renewable energy faces significant deviation penalties due to its output volatility and uncertainty. This limits the profitability of market participants and creates challenges for the market-based absorption of renewable energy. Thermal power plants, in accommodating renewable energy output and smoothing fluctuations, experience reduced average operating conditions and increased operational costs, leading to losses in the spot market. Therefore, studying multi-energy complementary systems has become extremely important. The multi-energy complementarity system leverages its inherent advantages by combining multiple renewable energy sources. Not only can the forecasting errors of individual sources offset each other and create complementarity, but the system can also use the flexibility of thermal power units to balance renewable energy fluctuations. This significantly reduces the costs associated with renewable energy deviation assessments and enhances the overall system benefits. Additionally, it results in high controllability and predictability of the multi-energy complementarity system as a whole. This creates a new collaborative model where “renewable energy sources provide the primary energy, and thermal power units provide ancillary services,” offering advantages in the market such as lower marginal costs and better output quality, as shown in Table 1. Furthermore, the multi-energy complementarity system establishes an internal benefit distribution evaluation framework, where renewable energy sources provide reasonable compensation to thermal power units, ensuring the profitability of all participants in the system.
3 Day-Ahead Market Multi-Energy Complementary System Coordinated Bidding Bi-Level Optimization Model
With the increasing installed capacity of renewable energy, China’s power system is facing some deep-seated issues, such as low overall efficiency, insufficient coordination among generation, grid, storage, and load, and weak complementarity among various power sources. As the proportion of renewable energy installations continues to rise, these issues are becoming more pronounced and require comprehensive optimization. Internationally, multi-energy complementarity is widely recognized as an effective approach to addressing the challenges of renewable energy integration. It is crucial for ensuring the security of the electricity supply and achieving an economically reasonable energy structure [31]. Currently, many researchers have conducted extensive studies on the flexibility enhancement of thermal power units, focusing on improving the flexibility adjustment capabilities of these units, which provides technical support for stabilizing renewable energy fluctuations within multi-energy complementarity systems.
Based on this, this paper proposes a bi-level optimization model for multi-agent collaborative bidding that incorporates a multi-energy complementarity system. In the spot market, each generation entity receives boundary condition information such as day-ahead load forecasts and renewable energy output forecasts from the market operator before submitting their bids. Each generation entity then formulates its bidding strategy with the objective of maximizing its own profits, based on its operational data and public market information. The power market operator combines the bid information from each generation entity with system operating parameters and conducts market clearing through Security-Constrained Unit Commitment (SCUC). The generation entities obtain their awarded energy quantities and revenues, and based on this, they optimize their bidding strategies for the next stage, continuing this cycle. This forms the basis for constructing a bi-level optimization model for generation entities, as illustrated in Fig. 3.
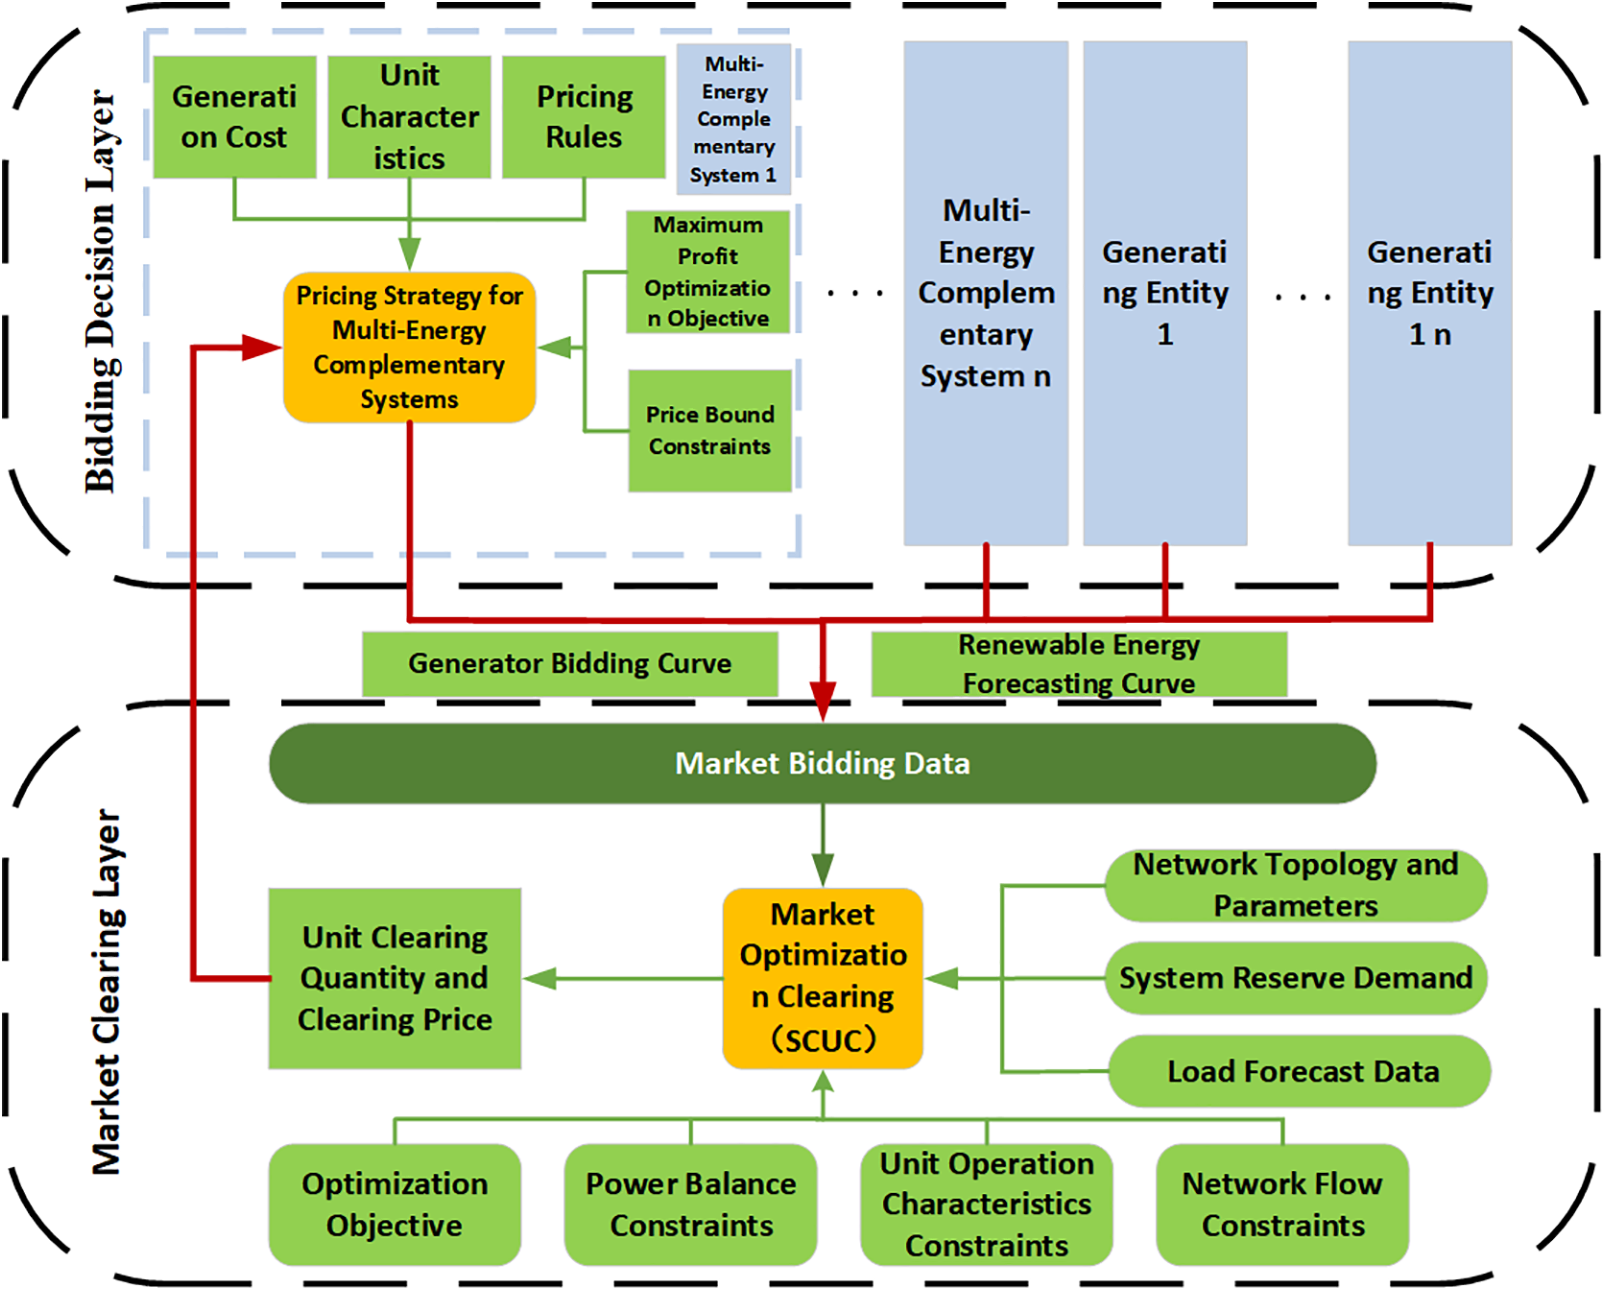
Figure 3: Bi-level optimization model for day-ahead bidding of power generation entities
3.1 Upper-Level Objective Function of Power Generation Entities
3.1.1 Profit Objective Function for Multi-Energy Complementary Systems
In the spot market, the multi-energy complementary system operates as a unified market entity and submits a single bidding strategy. This system combines the characteristics of thermal power units and new energy generation. For thermal power units, the calculation of marginal costs must account for coal consumption and environmental costs, which typically result in higher marginal costs. In contrast, new energy generation, such as wind or solar power, primarily involves fixed investment and maintenance costs, exhibiting zero marginal costs. Consequently, the overall bidding strategy for the multi-energy complementarity system not only considers the high marginal costs of thermal power units but also fully accounts for the zero marginal cost of renewable energy sources. Additionally, due to the differences in capacity ratios and annual average utilization hours between thermal power units and renewable energy units within the system, the final system marginal cost is calculated as a weighted average of the various costs.
However, from the perspective of overall operations, the multi-energy complementary system needs to pursue the maximization of collective benefits. The optimization objective function comprehensively considers the revenues, startup and shutdown costs, and operational costs of thermal power units, as well as the revenues from new energy power plants:
where:
3.1.2 Profit Objective Function for Thermal Power Enterprises
For an individual thermal power unit, the focus is solely on maximizing its own profits, which consist of revenues from thermal power generation, as well as the startup, shutdown, and operational costs:
where:
3.1.3 Renewable Energy Station
At this stage, new energy power plants primarily participate in the spot market competition with 10% of their forecasted energy output [3]. To ensure their grid-connected energy output, they typically compete in the market with a low declared energy price. Given the low amount of energy bid by new energy in the spot market and the common practice of bidding at a low price, this paper does not optimize the bidding strategies of new energy generation entities for the time being.
According to the existing spot market rules, each generation entity is required to submit a monotonic non-decreasing generation price curve:
where:
3.2 Construction of Bidding Strategies for Market Participants
In the initial stage of the spot market in China, a unilateral bidding approach was adopted. In this system, the user side acts as a price taker and participates in the market by submitting quantities without quoting prices. In contrast, generation entities, primarily thermal power units and new energy power stations, are required to participate in the electricity spot market clearing by submitting both quantities and prices. According to regulations, these generation entities must submit a monotonic non-decreasing generation price curve for the entire day to the electricity trading institution to participate in the market. Under these circumstances, generation entities in the existing spot market commonly use stepped bidding curves. Generation entities first construct segmented bidding curves based on marginal costs. They then create a bidding strategy space by multiplying each segment of the bidding curve by the same factor. This approach allows them to comply with market regulations while leveraging the flexibility of market rules to optimize their bidding strategies. According to the study in literature [32], generators commonly employ an economic withholding strategy, where they declare high prices for the latter part of the bidding curve to achieve economic withholding, while bidding the remaining capacity at opportunity cost or marginal cost, as shown in Fig. 4. The adoption of this strategy is intended to maximize economic benefits while ensuring participation in market clearing.
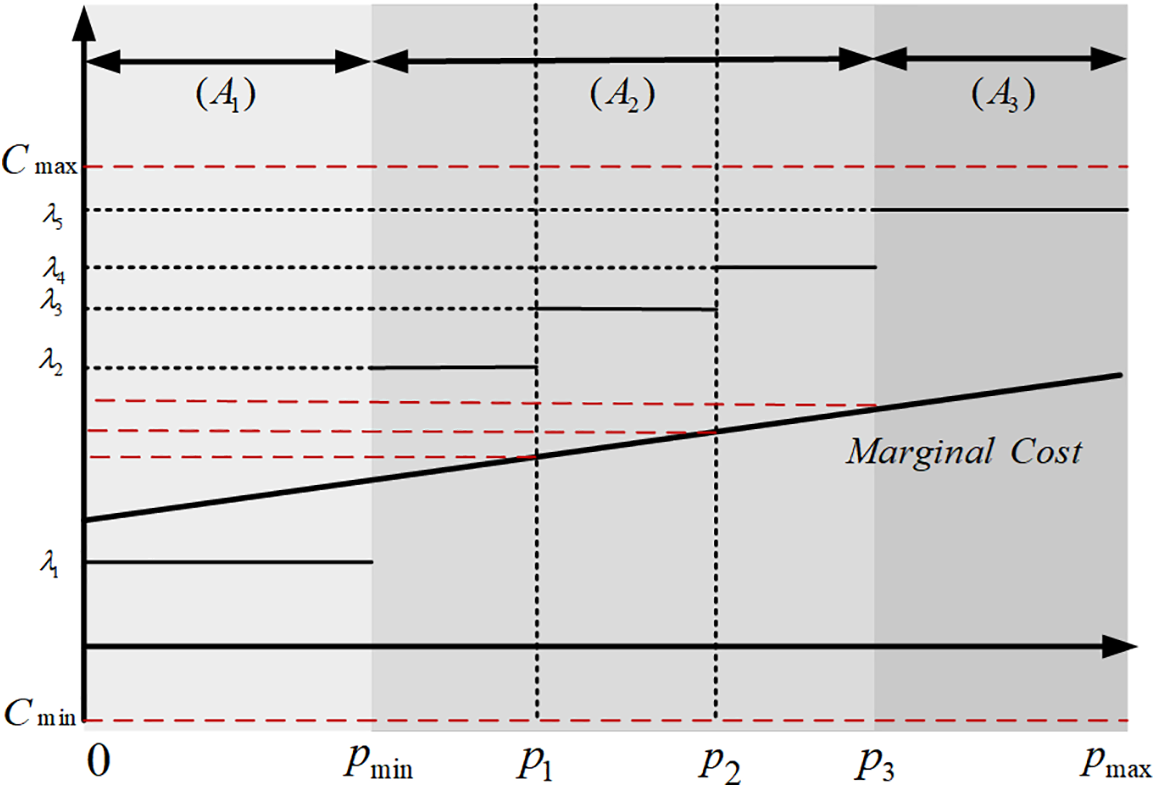
Figure 4: Segmented stepwise bidding curve
Thermal power enterprises generally divide the unit capacity into three segments:
(1) First Segment:
(2) Middle Segment:
(3) Third Segment:
The marginal cost of the generation entity is:
When submitting electricity prices, the generation entity selects its bidding strategy based on its marginal cost, with the aim of maximizing its expected profits. The bidding function is:
where:
This paper divides the bidding optimization space for generation units into three segments, considering the economic withholding strategy of the generation entities. The first segment focuses on ensuring continuous operation without shutdown; therefore, the bidding optimization space can be set below the marginal cost. The second segment aims to prevent economic losses by ensuring that the output does not fall below the marginal cost of generation, selecting the marginal cost with a 10%–30% profit margin for the bidding optimization space. The third segment considers earning excess profits during periods of electricity shortage, using the marginal cost with a 30% profit margin as the lower limit for the bidding optimization, with the market’s specified maximum bid cap as the upper limit.
3.3 Lower-Level Optimization Function
The lower-level optimization function is the electricity system clearing layer, which aims to maximize social welfare. The objective function is:
where:
Relevant constraints:
1) Output constraints for each bidding segment of the generation entity
where:
2) System power balance constraint
where:
3) Ramp rate constraint
where:
4) Generation unit output upper and lower limits constraint
where:
5) Renewable energy output constraint
where:
6) Minimum continuous startup and shutdown time constraint for thermal power units
where:
7) System thermal reserve constraint
where:
8) Line flow constraints
where:
3.4 Solving the Bi-Level Optimization Model
This paper utilizes a Particle Swarm Optimization (PSO) algorithm to solve the bi-level optimization model. The solution process is shown in Fig. 5. The specific steps are as follows:
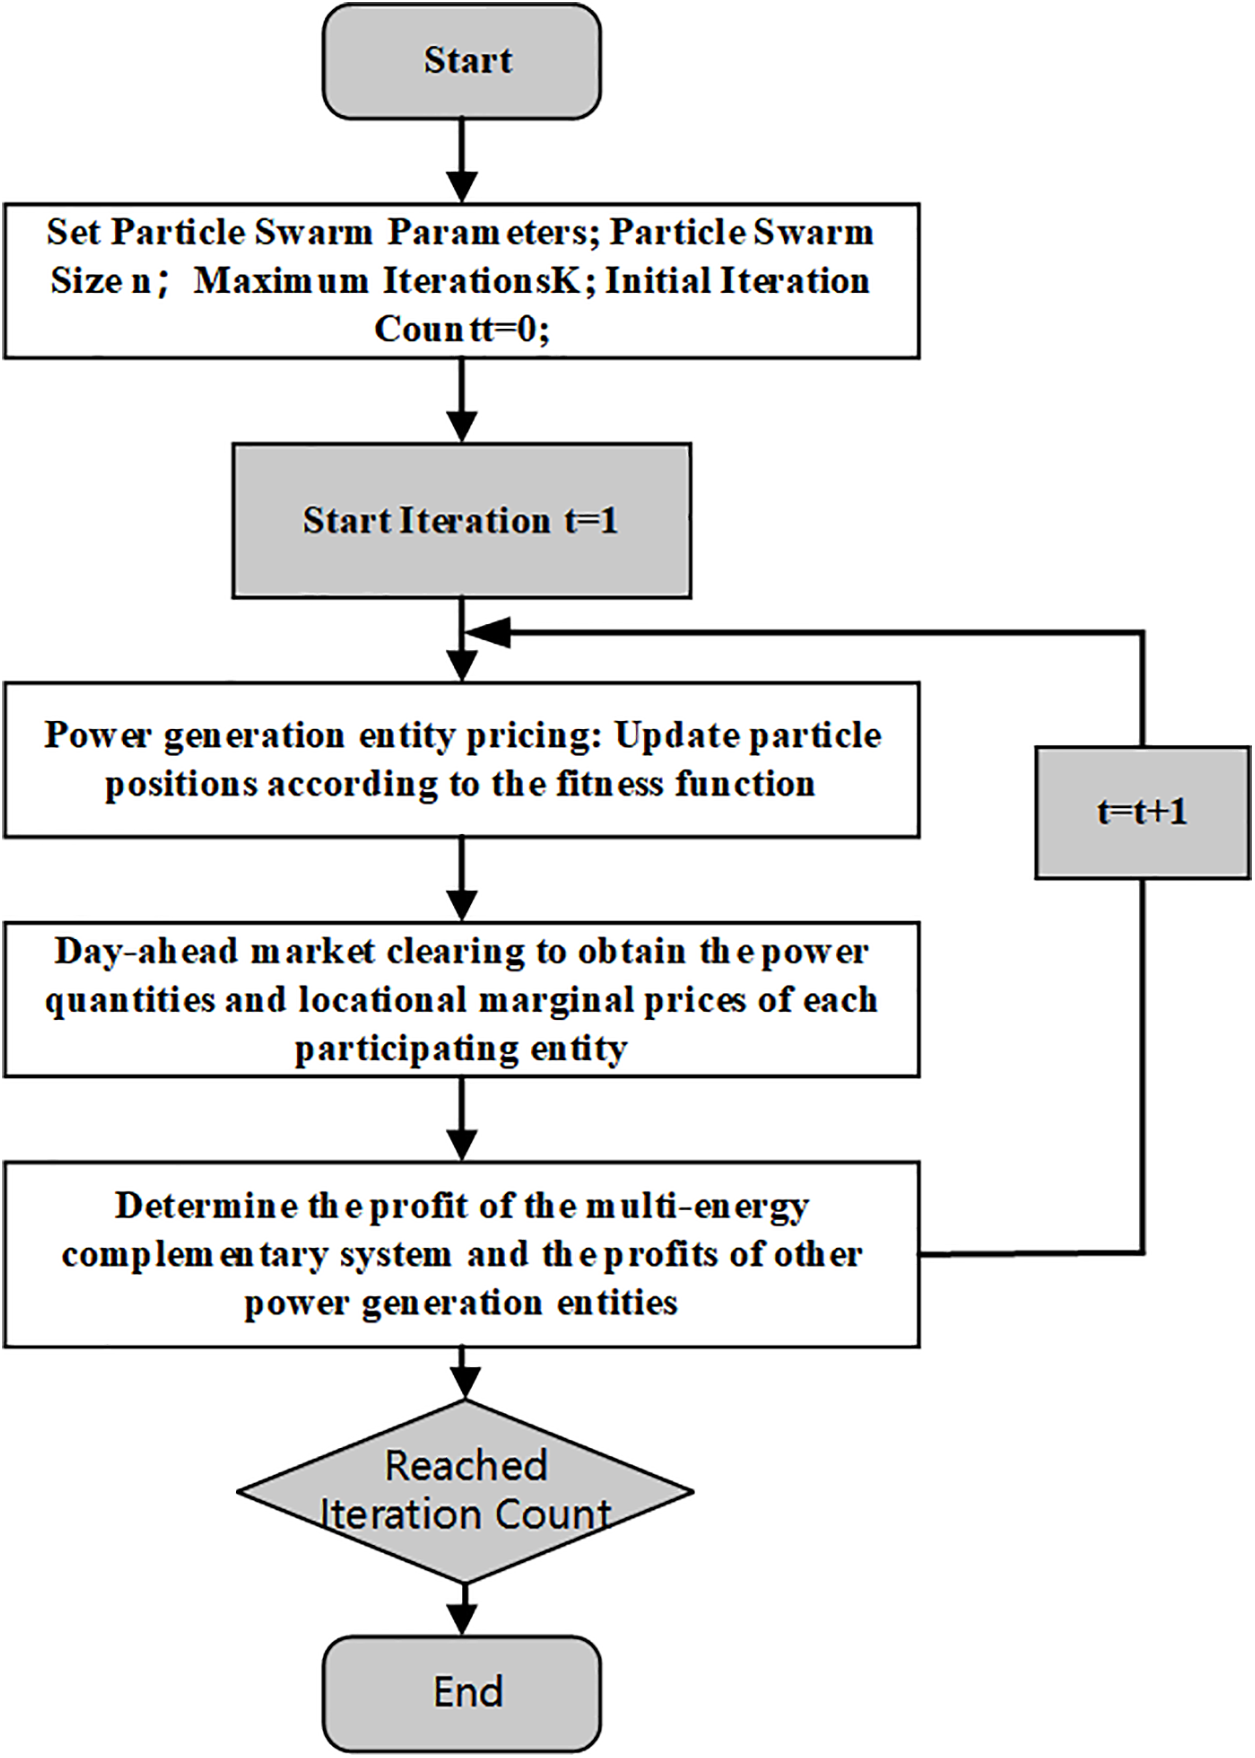
Figure 5: Flowchart of the solution process for the bi-level optimization model
(1) In the application scenario, multiple market participants are dispersedly arranged. Each participant is considered as a particle swarm, and each generation entity is viewed as a particle for environmental modeling. The Particle Swarm Optimization (PSO) algorithm parameters are initialized as follows: particle swarm size n, optimization dimensions d, and maximum number of iterations
(2) Within the range of bid upper and lower limits, randomly initialize the initial positions X and initial velocities V of N particles, and initialize the positions s and velocities V of M market participants;
Within the range of bid upper and lower limits, use the profit functions of each market participant as the fitness functions (Eqs. (1) and (5)). After clearing the lower-level (Eq. (10)), obtain the transaction volumes and revenues, and then calculate the individual best and global best solutions;
(3) Update the bids of each market participant and proceed to the next iteration level;
(4) When the fitness values no longer change significantly or the maximum number of iterations is reached, the loop ends, resulting in the optimal solution for that period.
4 Internal Balance Optimization of the Multi-Energy Complementary System
In the day-ahead and real-time markets, the multi-energy complementary system first ensures its internal energy balance to maintain stable output at its node.
In the day-ahead market stage, the multi-energy complementary system primarily relies on the full participation of the short-term forecasted output of renewable energy in energy allocation. The thermal power units are tasked with distributing the remaining energy with the objective of minimizing the overall coal consumption operational costs of the system, thereby ensuring the maximization of economic benefits.
In the real-time market, the multi-energy complementary system primarily focuses on adjusting for deviations in the output of renewable energy stations to reduce the penalties incurred due to forecast deviations. The renewable energy stations must adhere to the short-term forecast output principles declared in the day-ahead market while submitting ultra-short-term forecast outputs. This approach enables the multi-energy complementary system to achieve real-time energy balance. Meanwhile, the system’s optimization strategy continues to focus on minimizing overall coal consumption operational costs, thereby enhancing economic operational efficiency while ensuring the safety and stability of the power supply.
Optimization Objectives of the Multi-Energy Complementary System:
where:
Relevant Constraints:
Internal Energy Balance Constraint for the Multi-Energy Complementary System:
where:
The ramp rate constraints and output upper and lower limit constraints for each unit within the multi-energy complementary system refer to the relevant constraints in the lower-level clearing function, such as those in Eqs. (16) and (17).
4.2 Spot Market Settlement Rules
(1) Settlement Rules for the Multi-Energy Complementary System:
where:
(2) Settlement Rules for Individual Thermal Power Units:
where:
(3) Settlement Rules for Renewable Energy Stations:
where:
4.3 Internal Revenue Distribution Mechanism for the Multi-Energy Complementary System
In the spot market, internal coordination within the multi-energy complementary system enables internal renewable energy units to secure higher grid-connected electricity with the support of thermal power units. This cooperation significantly reduces penalties incurred due to energy imbalances. Compared to participating in the market independently, renewable energy stations experience an increase in profitability. However, as the flexible regulating power sources within the system, thermal power units undertake a substantial amount of load-following tasks to ensure the overall stable output of the system. This situation makes it challenging to ensure their economic benefits. If the internal revenue distribution within the system is based solely on the generated electricity, thermal power units may not receive adequate compensation to reflect the flexibility value they provide to the system. This could result in insufficient revenues for these units, potentially leading to losses, which would be detrimental to the stable operation of the multi-energy complementary system.
To address this issue, this study employs cooperative game theory to explore the internal revenue distribution mechanism within the multi-energy complementary system, aiming to accurately assess the respective contributions of renewable energy and thermal power units. The Nash bargaining theory, an important branch of cooperative game theory, is applied to solve the revenue distribution problem. This approach not only balances individual and collective interests but also ensures the identification of an equilibrium solution that maximizes the Nash product, achieving Pareto optimality for all participants in the system. This means that no party can improve their own benefits without harming others.
(1) Contribution of Participants in the Multi-Energy Complementary System
After participating in the multi-energy complementary system, the contributions of renewable energy stations and thermal power units to the spot market are specifically manifested as follows:
1. Day-ahead Market Energy Value of Each Generation Entity;
2. Value of Flexibility Services Provided in the Real-Time Market.
This paper introduces the concept of the contribution of generation entities within the multi-energy complementary system, considering both energy contribution and flexibility contribution. The contribution of power generation entities participating in the multi-energy complementary system is shown in Fig. 6.

Figure 6: Contributions of participating entities in the multi-energy complementary system
1) Day-Ahead Market Energy Contribution
In the multi-energy complementary system, the energy contribution of each generation entity can be calculated by multiplying the electrical energy they provide by the nodal price. Since the renewable energy stations and thermal power units present only the system’s overall bid curve in the market, it is challenging to separately distinguish the energy contribution of each generation entity. To address this, this study applies the Vickrey-Clarke-Groves (VCG) mechanism theory, which defines a participant’s contribution by considering the substitute benefits it provides to other market members. In the proposed benefit distribution model, the energy contribution of a participant is defined as the change in the total awarded energy of the system before and after the participant joins the multi-energy complementary system.
where:
2) The flexibility contribution in the real-time market
The flexibility contribution in the real-time market reflects the value of flexibility provided by the participants in the multi-energy complementary system. The calculation method involves multiplying the imbalance electricity in each period of the real-time market by the corresponding node price. This contribution is determined using VCG (Vickrey–Clarke–Groves) theory, which evaluates it by comparing the overall imbalance in the system before and after the generation entity joins the multi-energy complementary system. If the output deviation of a participant helps reduce the overall system deviation, its flexibility contribution is positive, indicating that its actions enhance the overall revenue. Conversely, if it exacerbates the system deviation, its flexibility contribution is negative, signifying that its actions increase the demand for system flexibility, leading to revenue loss.
where:
3) Market Contribution
Based on the above analysis, the market contribution of each participant in the multi-energy complementary system during joint operation is calculated as the ratio of the sum of the participant’s day-ahead energy contribution and real-time market flexibility contribution to the total contributions of all members in the multi-energy complementary system.
where:
4) Revenue distribution mechanism for multi-energy complementary systems
Based on the contribution levels of each participant, this paper constructs a revenue distribution method using Nash bargaining theory. However, traditional Nash bargaining models allocate the cooperative surplus equally among participants, which fails to reflect the differences in contributions made by participants with varying characteristics in joint operation and does not provide effective incentives. To address this, this paper introduces a market contribution indicator for distributing the cooperative surplus. Adopting the concept of the Cobb-Douglas utility function, the objective function is defined as the maximization of the product of the increase in revenue for each participant in the multi-energy complementary system before and after cooperation. The specific distribution method can be obtained by solving the following Nash bargaining model based on the contribution levels of system participants:
Relevant Constraints:
where:
To facilitate calculation and solution, the analytical optimal solution of the above Nash bargaining model is proposed. First, taking the natural logarithm of the objective function, the Nash bargaining model can be expressed as:
By applying the Karush-Kuhn-Tucker (KKT) conditions to the above expression, we obtain:
By combining the contribution levels of each participant, the final distribution method for the multi-energy complementary system can be determined as follows:
The revenue distribution results can be essentially divided into two parts. The first part ensures that the participants in the multi-energy complementary system receive revenue at the level they would have achieved before cooperation, which corresponds to their expected revenue when participating independently in the spot market. The second part involves distributing the cooperative surplus based on the contribution levels of the market participants.
Through the above revenue distribution mechanism, the final distribution results consider the energy contribution and flexibility contribution of different participants from both day-ahead and real-time market perspectives. This approach ultimately achieves a fair and reasonable distribution of the cooperative surplus.
5.1 Basic Setup of the Case Study
This paper conducts a case study analysis based on the IEEE 30-bus system, as illustrated in Fig. 7. The system includes one multi-energy complementary system consisting of three thermal power units, one wind power station, and one photovoltaic (PV) power station as the generation entities. To fully demonstrate the complementary advantages of thermal power units and renewable energy within the multi-energy complementary system participating in the spot market, the study selects two 600 MW thermal power units, a 300 MW offshore wind power station, and a 400 MW PV power station. The analysis uses actual annual generation data from these sources. These three generation entities are integrated into the multi-energy complementary system at the same grid point. Additionally, the study considers the independent participation of a thermal power unit and a renewable energy unit with the same rated capacity in the spot market, along with a competing 1000 MW thermal power unit. The basic information of the thermal power units is presented in Table 2 and Appendix Section. The renewable energy output data is sourced from a wind farm in the northeastern region, and the user load data is taken from the actual electricity load of a province in 2020, scaled down proportionally according to the active load of each node in the original system. The market bid floor is set at −0.08 RMB/(kW·h), the market bid cap is 1.3 RMB/(kW·h), and the spot market clearing price range is −0.1–1.5 RMB/(kW·h).
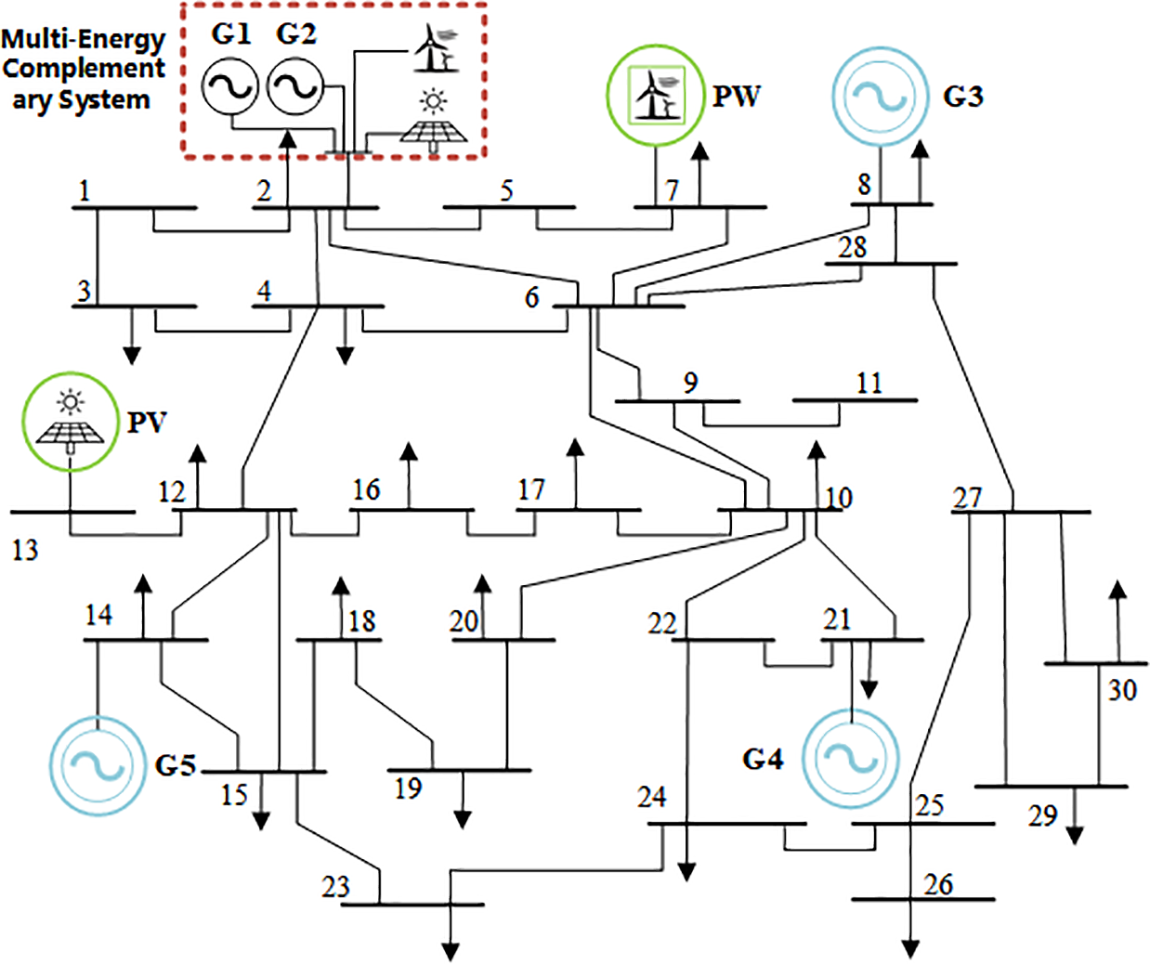
Figure 7: IEEE 30-bus system

5.2 Renewable Energy-Load Clustering
This paper clusters the historical load data and renewable energy output data from a province over 12 months. The data for each month is input into the dataset to be clustered, and an improved K-means algorithm based on density layers is applied to obtain multiple typical scenario sets within each quarter, as illustrated in Figs. 8–10.
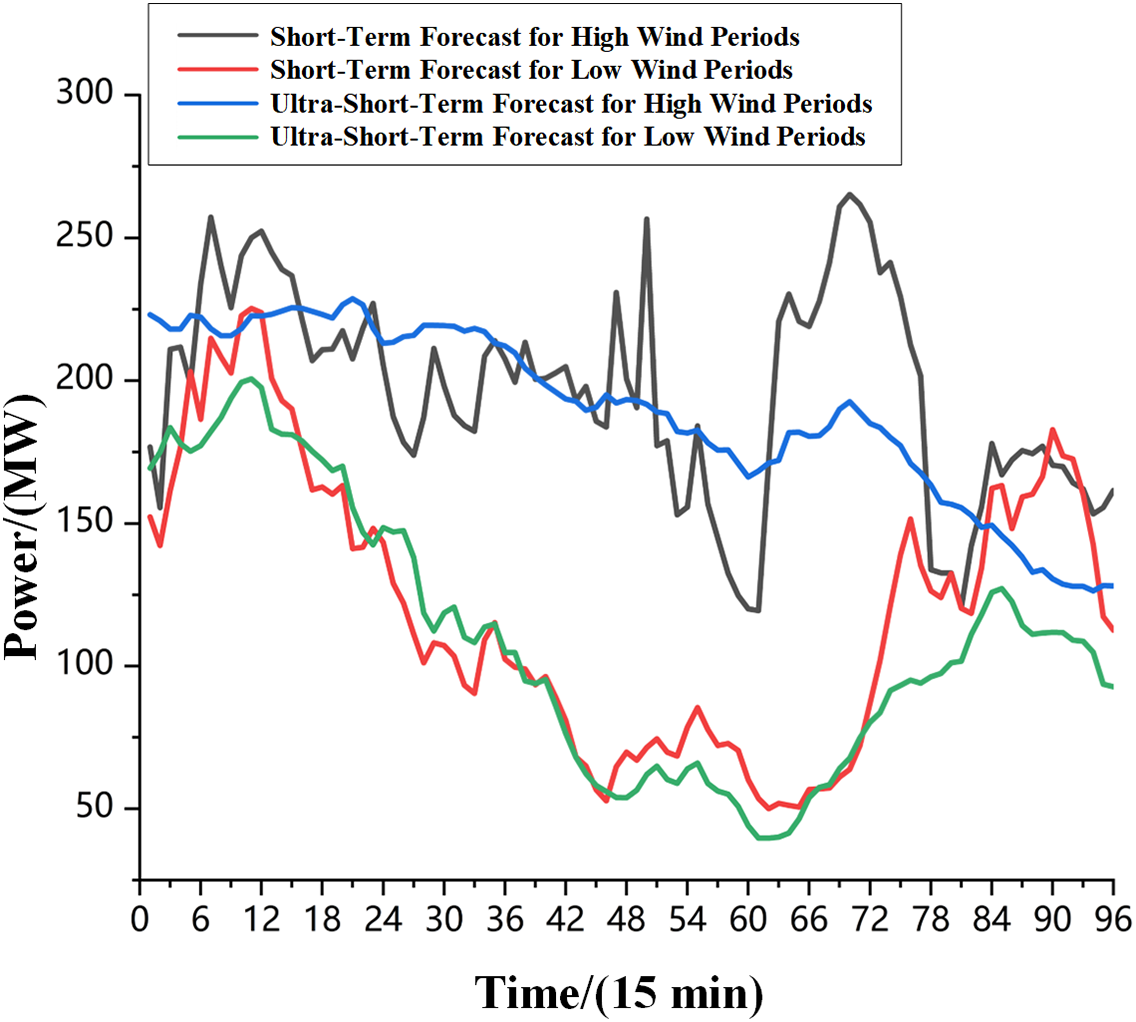
Figure 8: Wind power clustering results
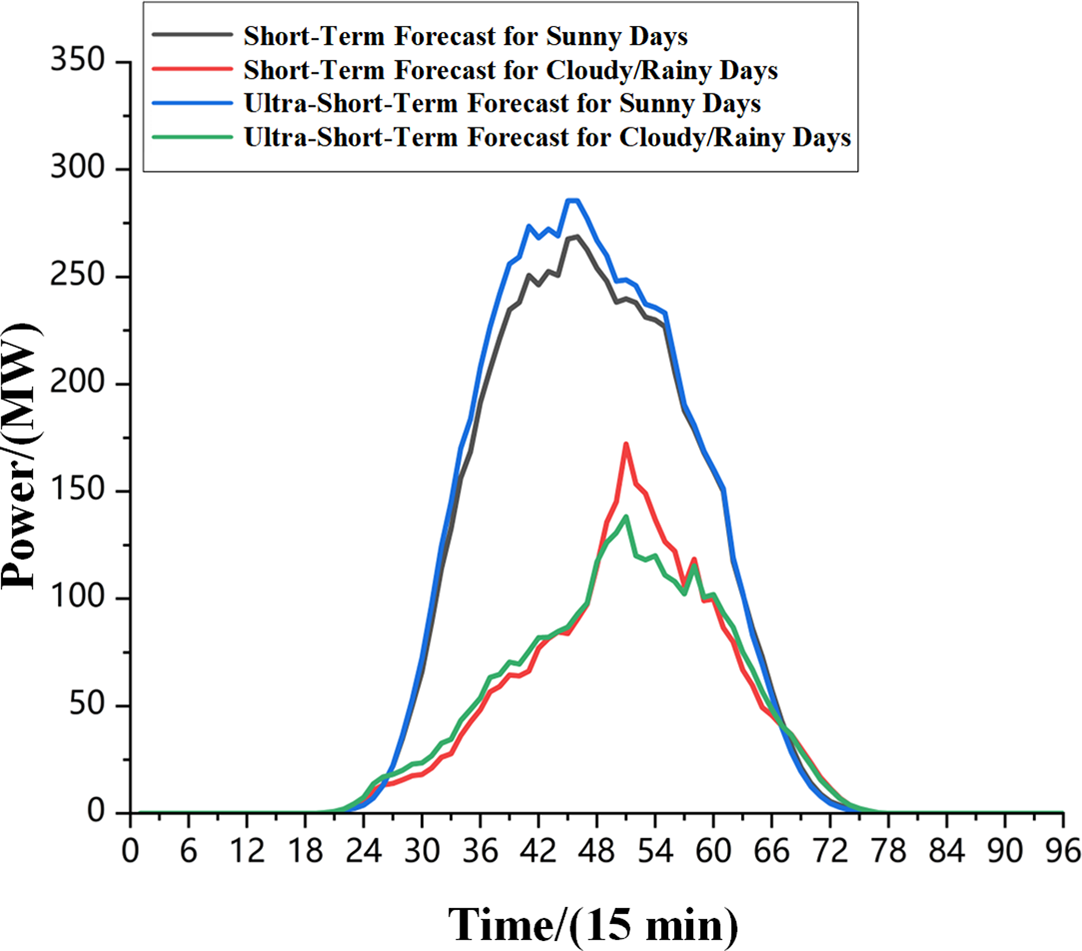
Figure 9: Photovoltaic (PV) clustering results
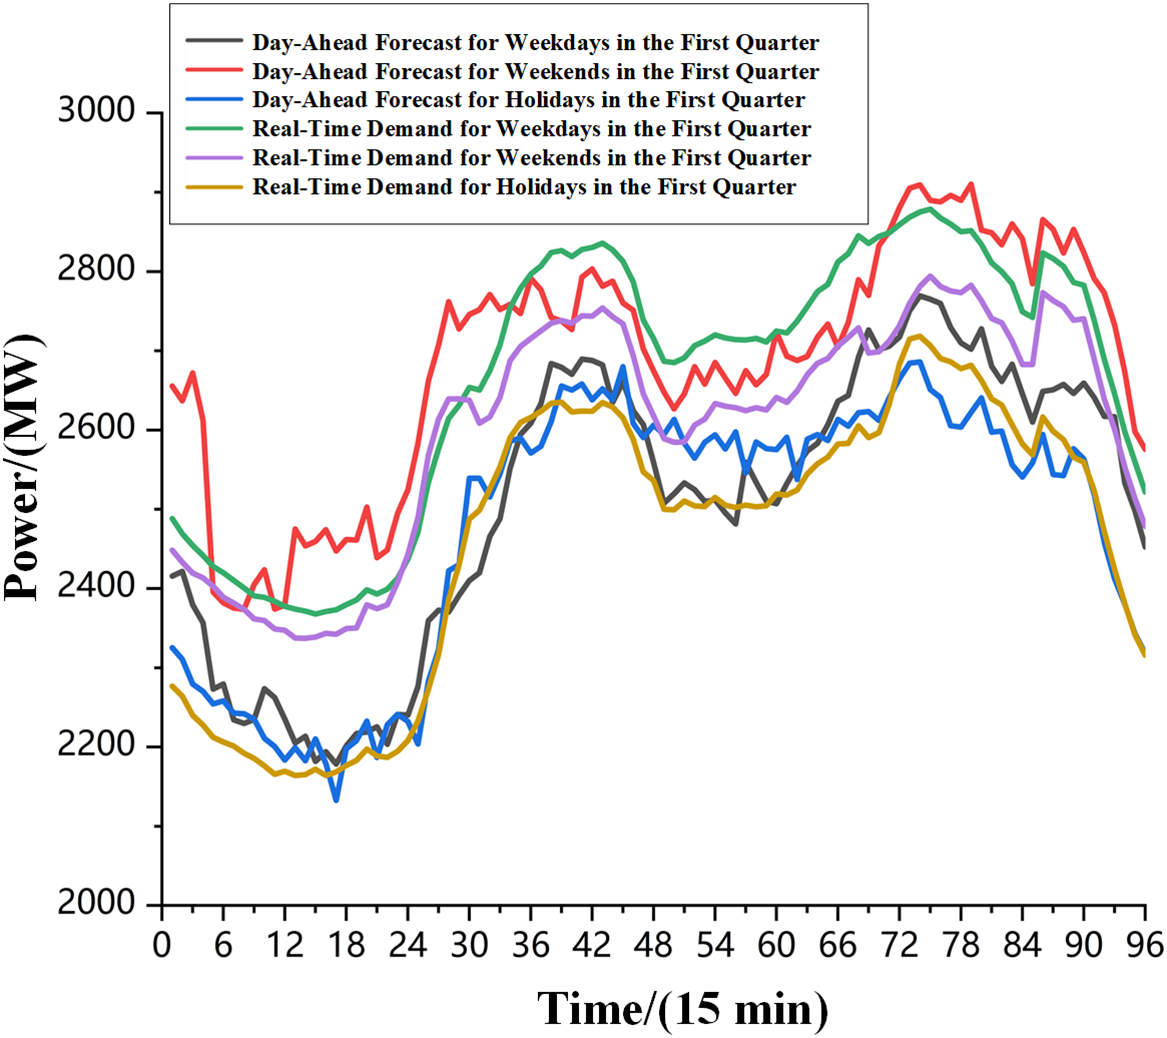
Figure 10: Load clustering results
Taking the dataset for the first quarter as an example, the historical load data is clustered into three groups, while the output data for the wind power station and photovoltaic (PV) power station are optimally clustered into two scenario sets each. The clustered scenario data are proportionally restored based on historical load forecasts, wind farm forecasts, and PV station forecasts to reflect the day-ahead short-term forecasts and real-time operational forecast errors. The scenarios with the highest occurrence and largest proportion during the month are those with strong winds and clear days.
5.3 Market Trading Results of Multi-Energy Complementary Systems and Competing Enterprises
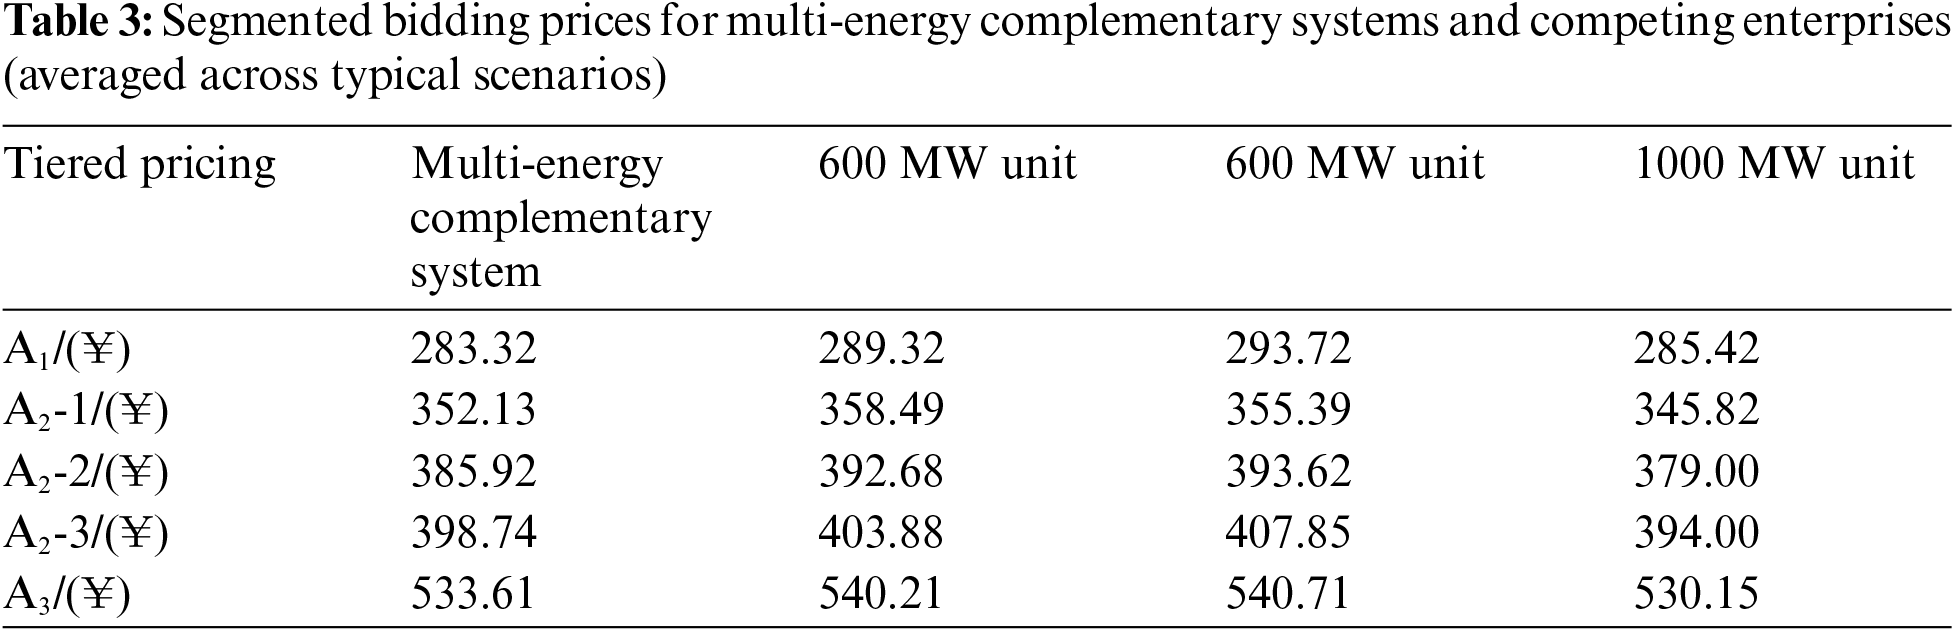
Based on comparative scenarios, this paper selects representative weekdays, weekends, and holidays as trading days for each quarter of the year. The multi-energy complementary system, along with competing thermal power enterprises and independent renewable energy enterprises, is placed in a real spot market simulation. Table 3 shows the final five-segment bidding of the multi-energy complementary system and its competing units.
As shown in Fig. 11, when a 600 MW unit is combined with renewable energy to form a multi-energy complementary system, the marginal cost at 80% output is reduced by 16.18 RMB compared to a single 600 MW unit’s marginal cost of 395.33 RMB. However, it is still slightly higher than the 1000 MW unit’s marginal cost of 270.85 RMB. The coal consumption cost of the multi-energy complementary system is significantly higher than that of the 600 and 1000 MW units. This phenomenon is mainly due to the internal load-sharing mechanism of the system, which reduces the average operational efficiency of the units, leading to increased coal consumption intensity. Therefore, although the multi-energy complementary system has an advantage in marginal costs compared to a single 600 MW unit, its overall costs are still higher than those of the 1000 MW unit. This is reflected in the market bids, where the multi-energy complementary system’s bids are slightly higher than those of the 1000 MW unit.
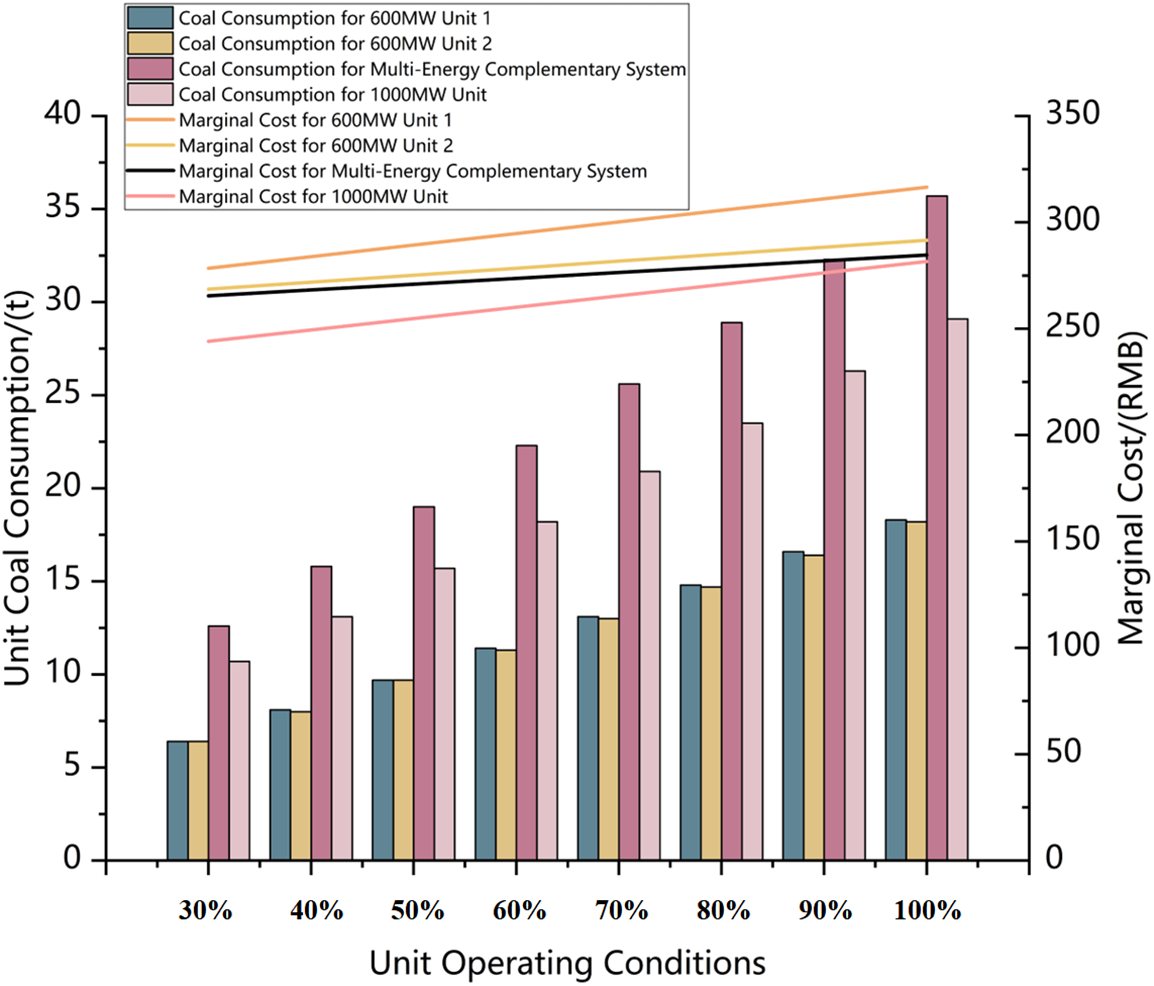
Figure 11: Marginal costs of multi-energy complementary systems and competing enterprises
As seen in Table 4, the overall revenue of the multi-energy complementary system in the spot market is higher compared to enterprises competing independently. This increase is primarily due to the effective utilization of internal renewable energy components and overall cost efficiency. The renewable energy within the multi-energy complementary system can secure significant electricity revenues through priority grid access and near-zero marginal costs. Additionally, the design of the multi-energy complementary system helps maintain its overall marginal costs at relatively low levels, which not only reduces operational costs but also enhances its price competitiveness in the highly competitive market.
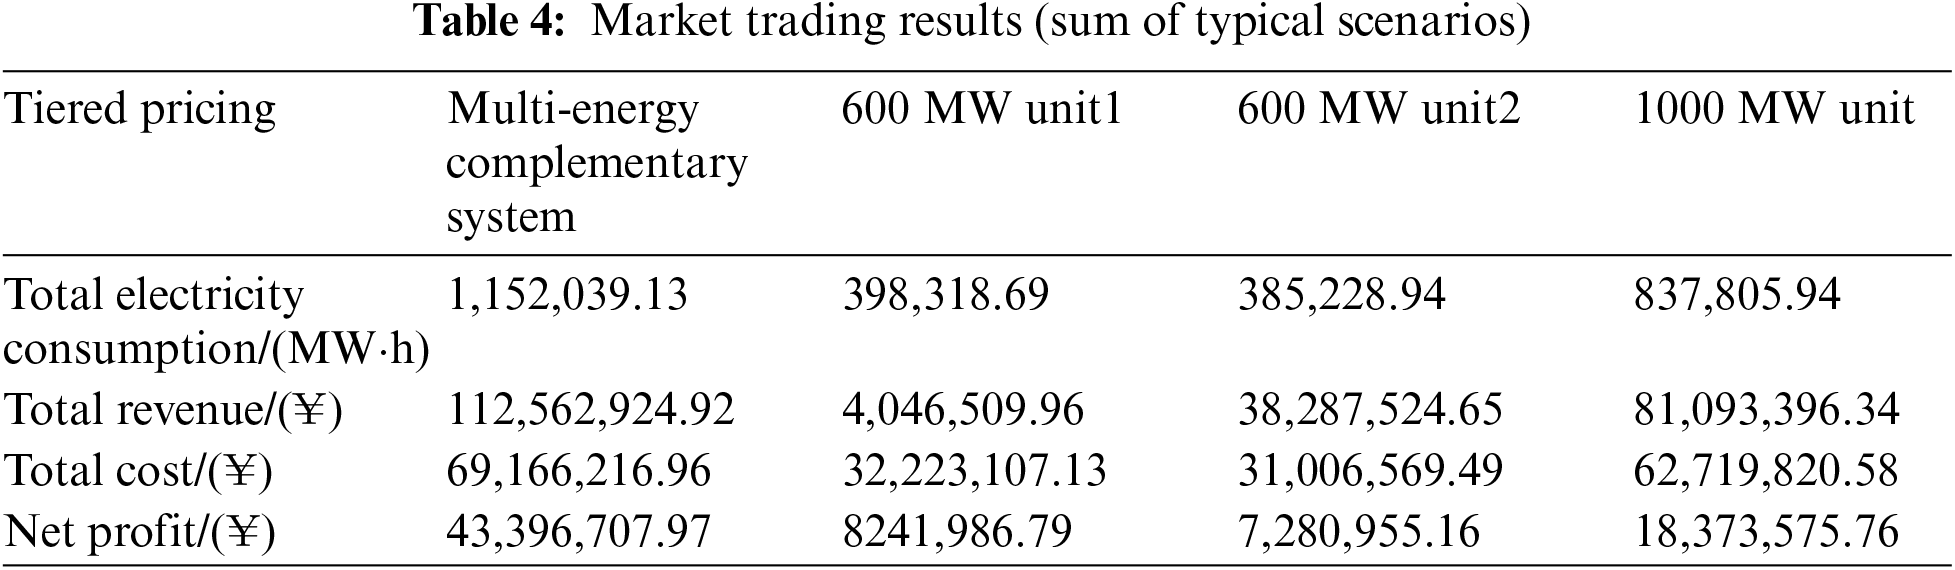
Table 5 and Fig. 12 present the nodal price distribution for each typical day scenario under the marginal nodal pricing. The nodal prices reflect the system’s power supply and demand situation and line congestion conditions.
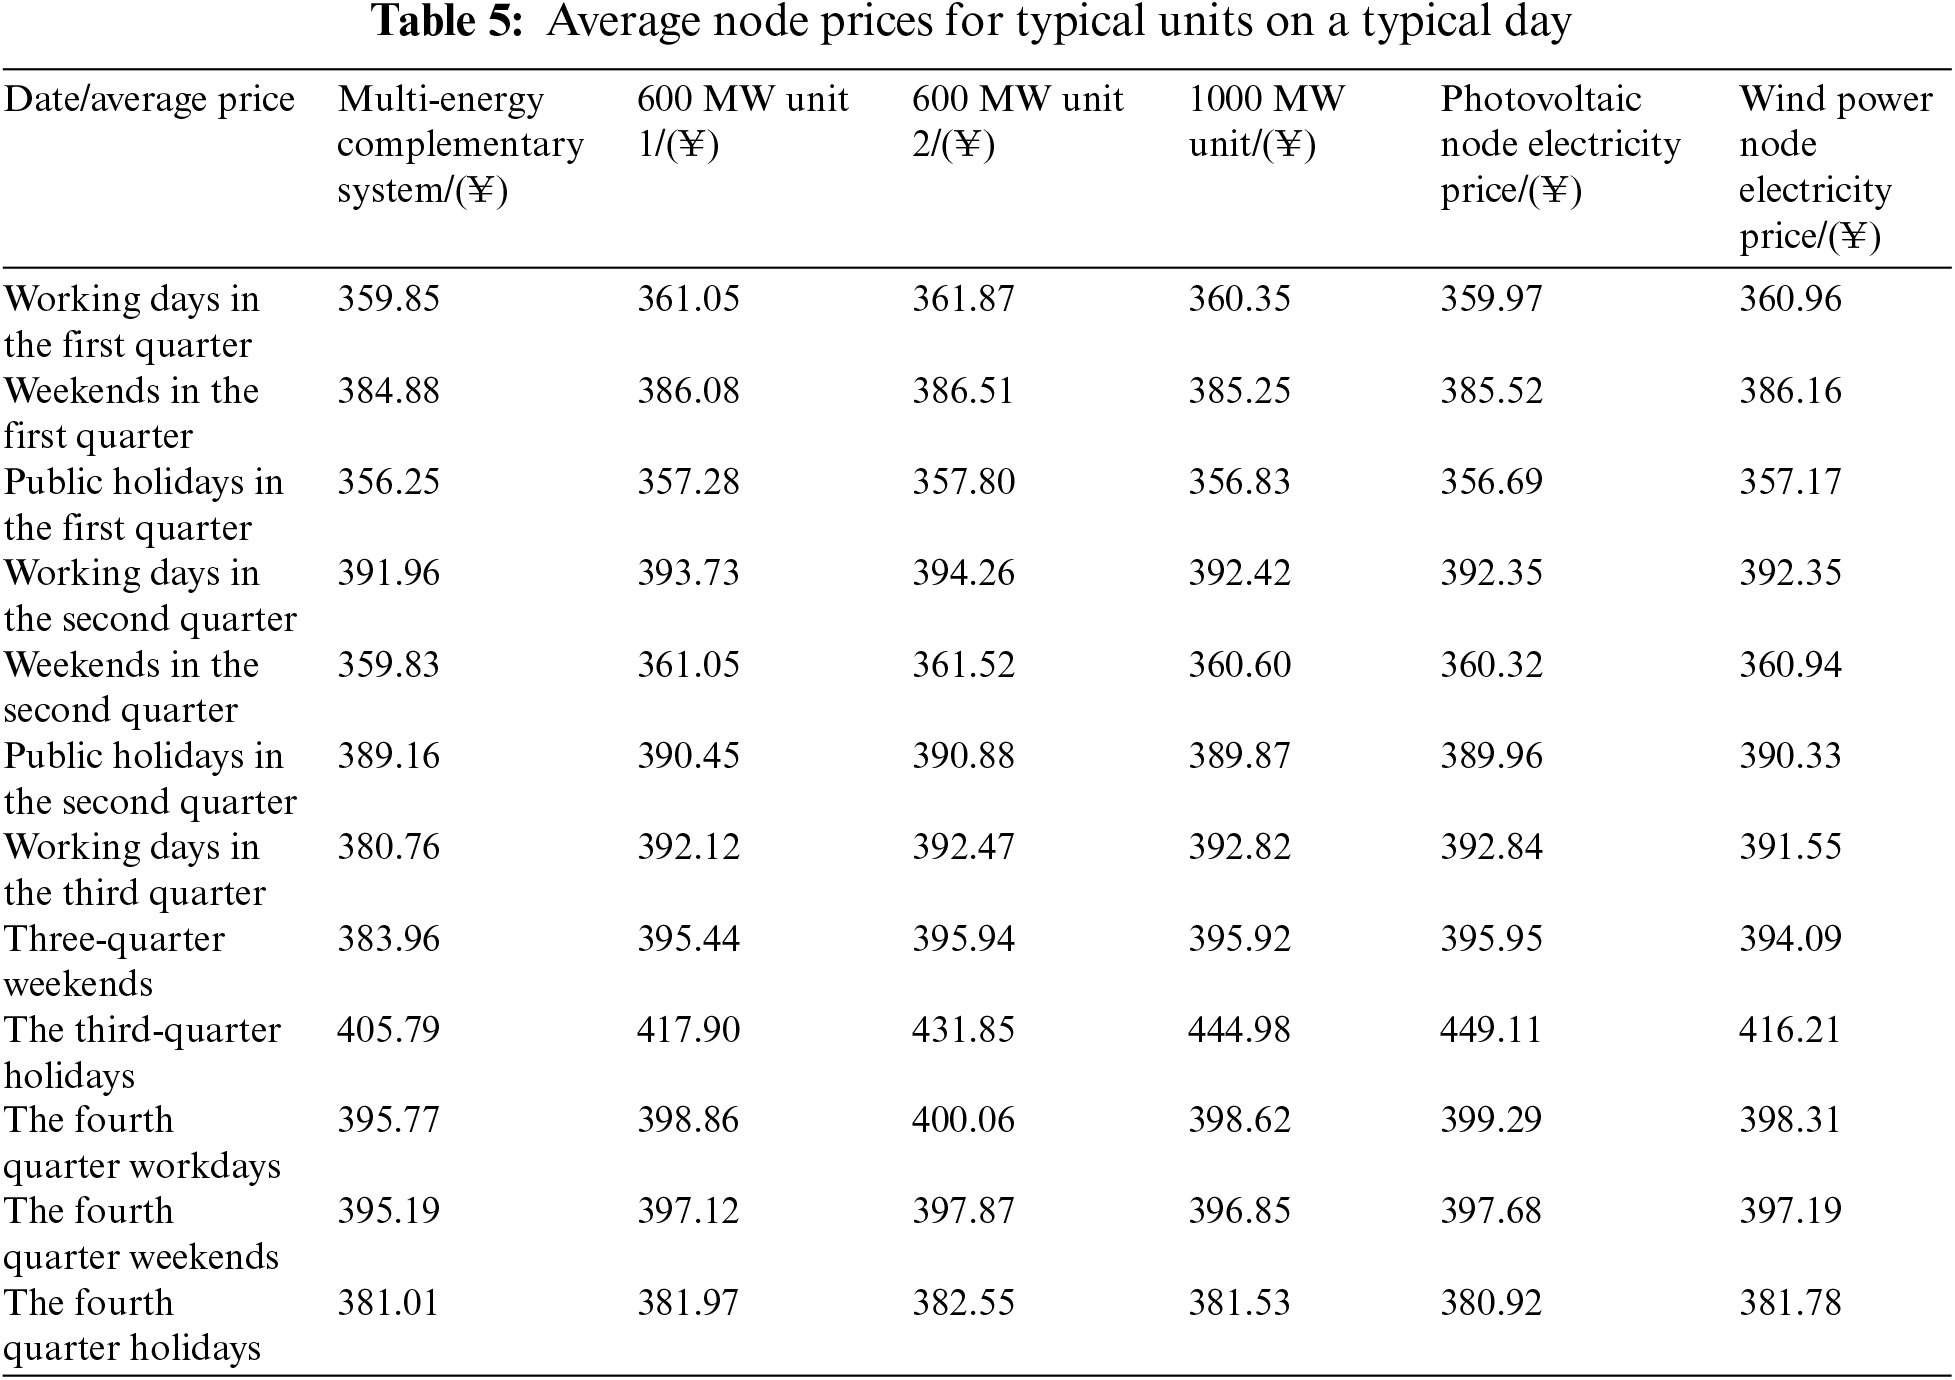
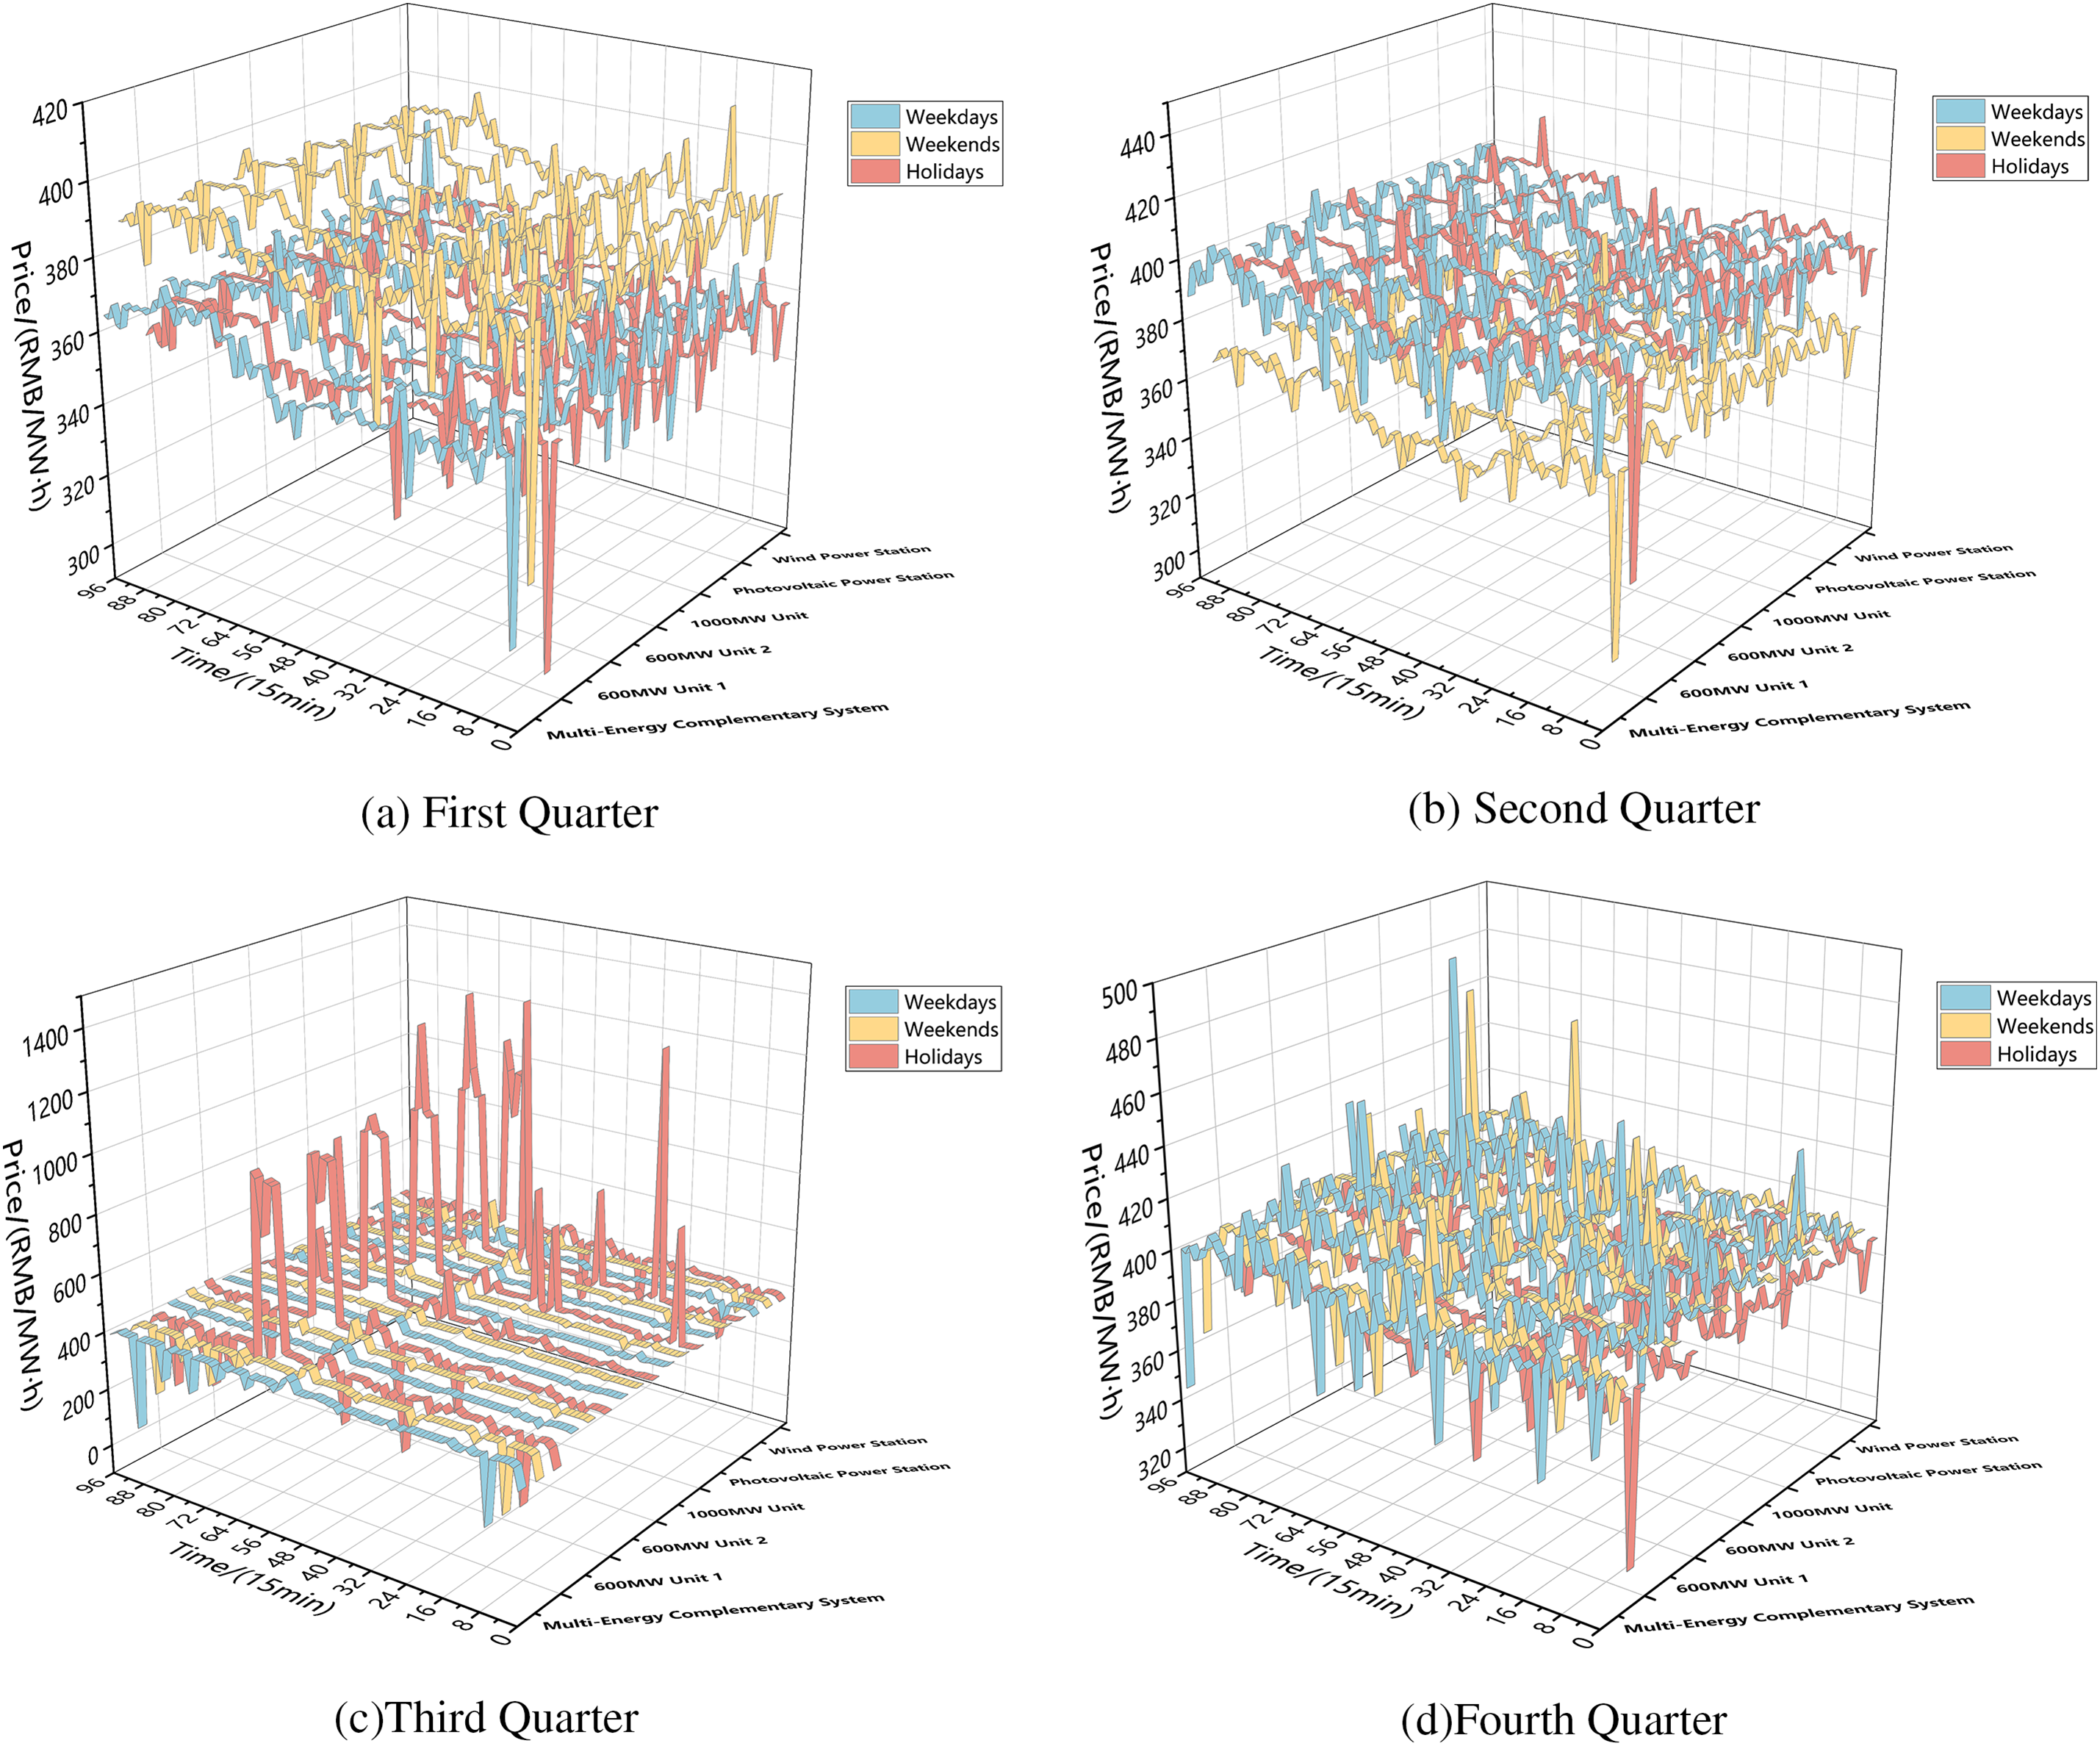
Figure 12: Spatiotemporal distribution of node prices for power generation entities
As shown in Fig. 12, the nodal prices on typical days such as weekdays in the first quarter, holidays in the first quarter, and weekends in the second quarter are relatively low compared to other typical day nodes. This is due to lower load levels and the occurrence of strong wind scenarios during these periods, which result in high renewable energy output. Consequently, thermal power units engage in competitive pricing by offering lower bid prices. In contrast, during the third quarter, the load demand is high, and it coincides with the low wind period of the year, leading to reduced renewable energy output. This situation causes severe congestion at the nodes in the third quarter holiday scenario, with the nodal price at the photovoltaic station’s node reaching as high as 1295.7 RMB/MW·h during the 16:30–16:45 period.
5.4 Internal Allocation Results within Multi-Energy Complementary Systems
This paper provides a comparative analysis of the real-time output curves and the imbalance between the day-ahead declared values for each participant in the multi-energy complementary system under both independent and joint operation. The comparison results are shown in Figs. 13–16.
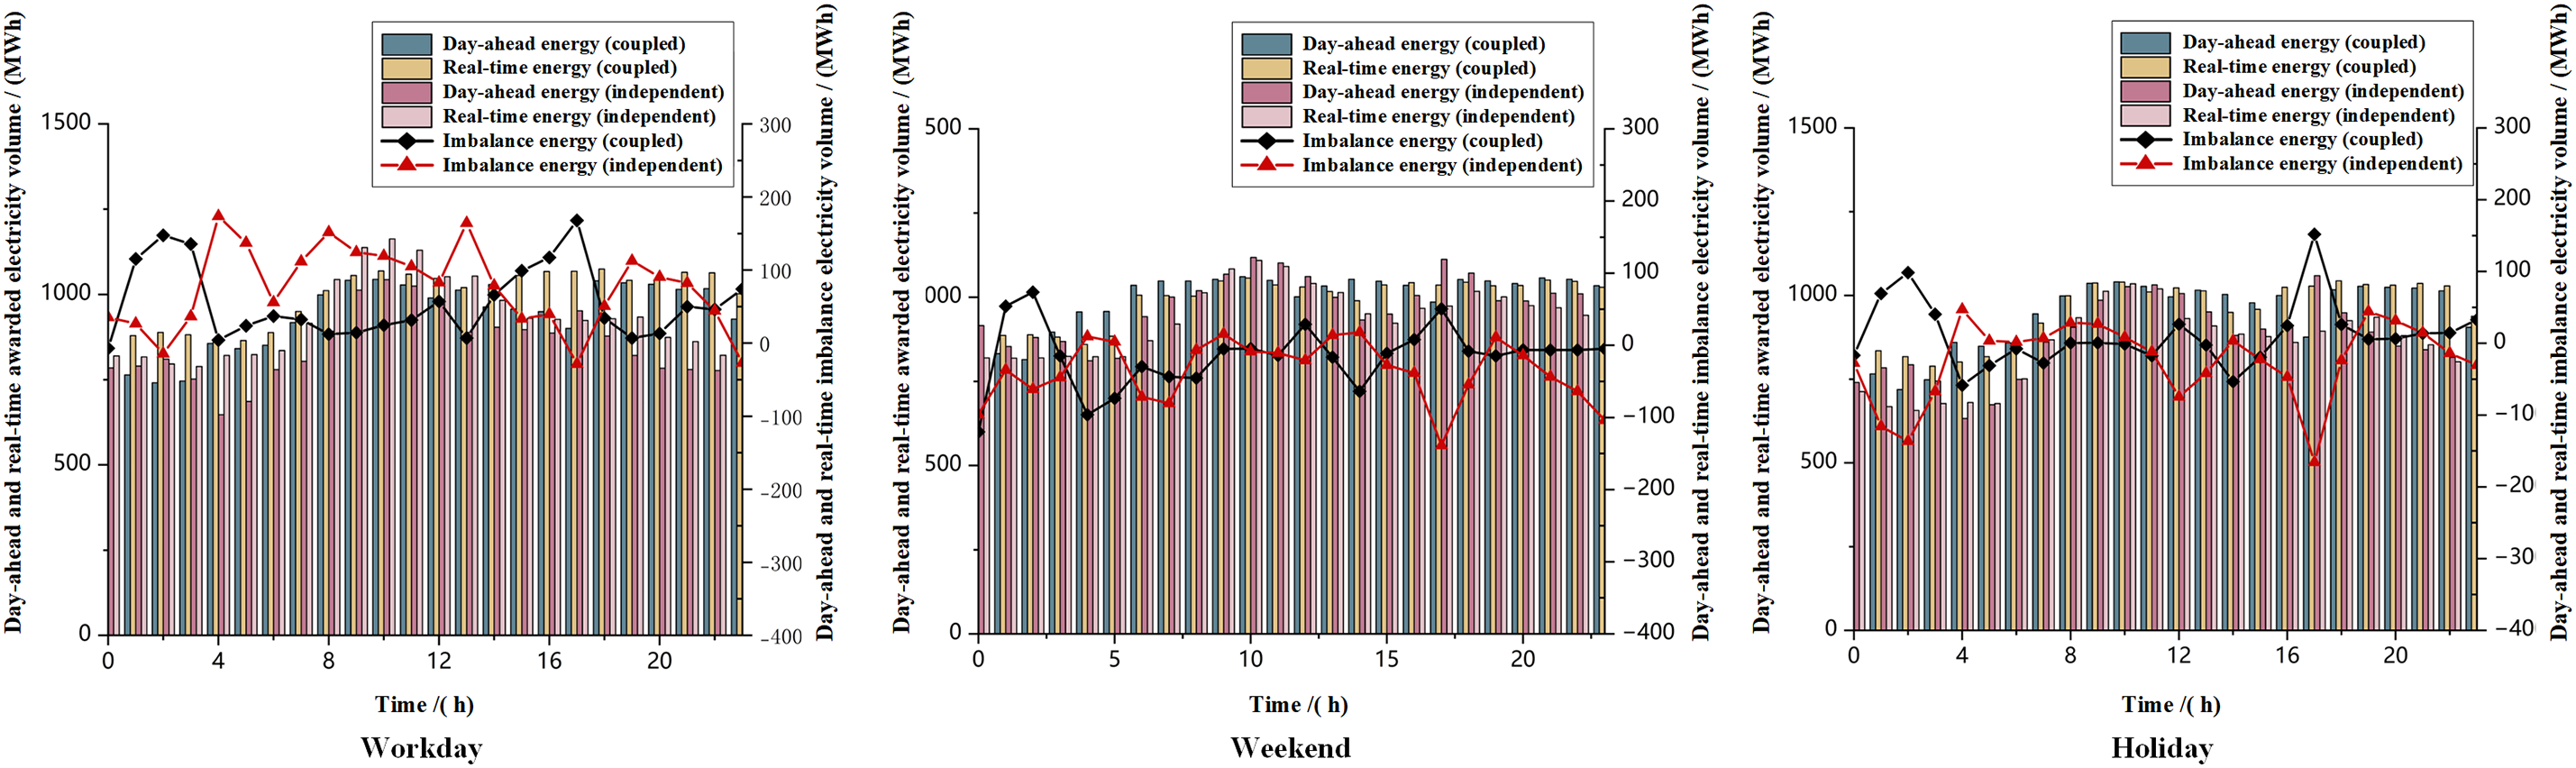
Figure 13: Comparison of generation power and imbalance energy for coupled vs. independent operation in the first quarter
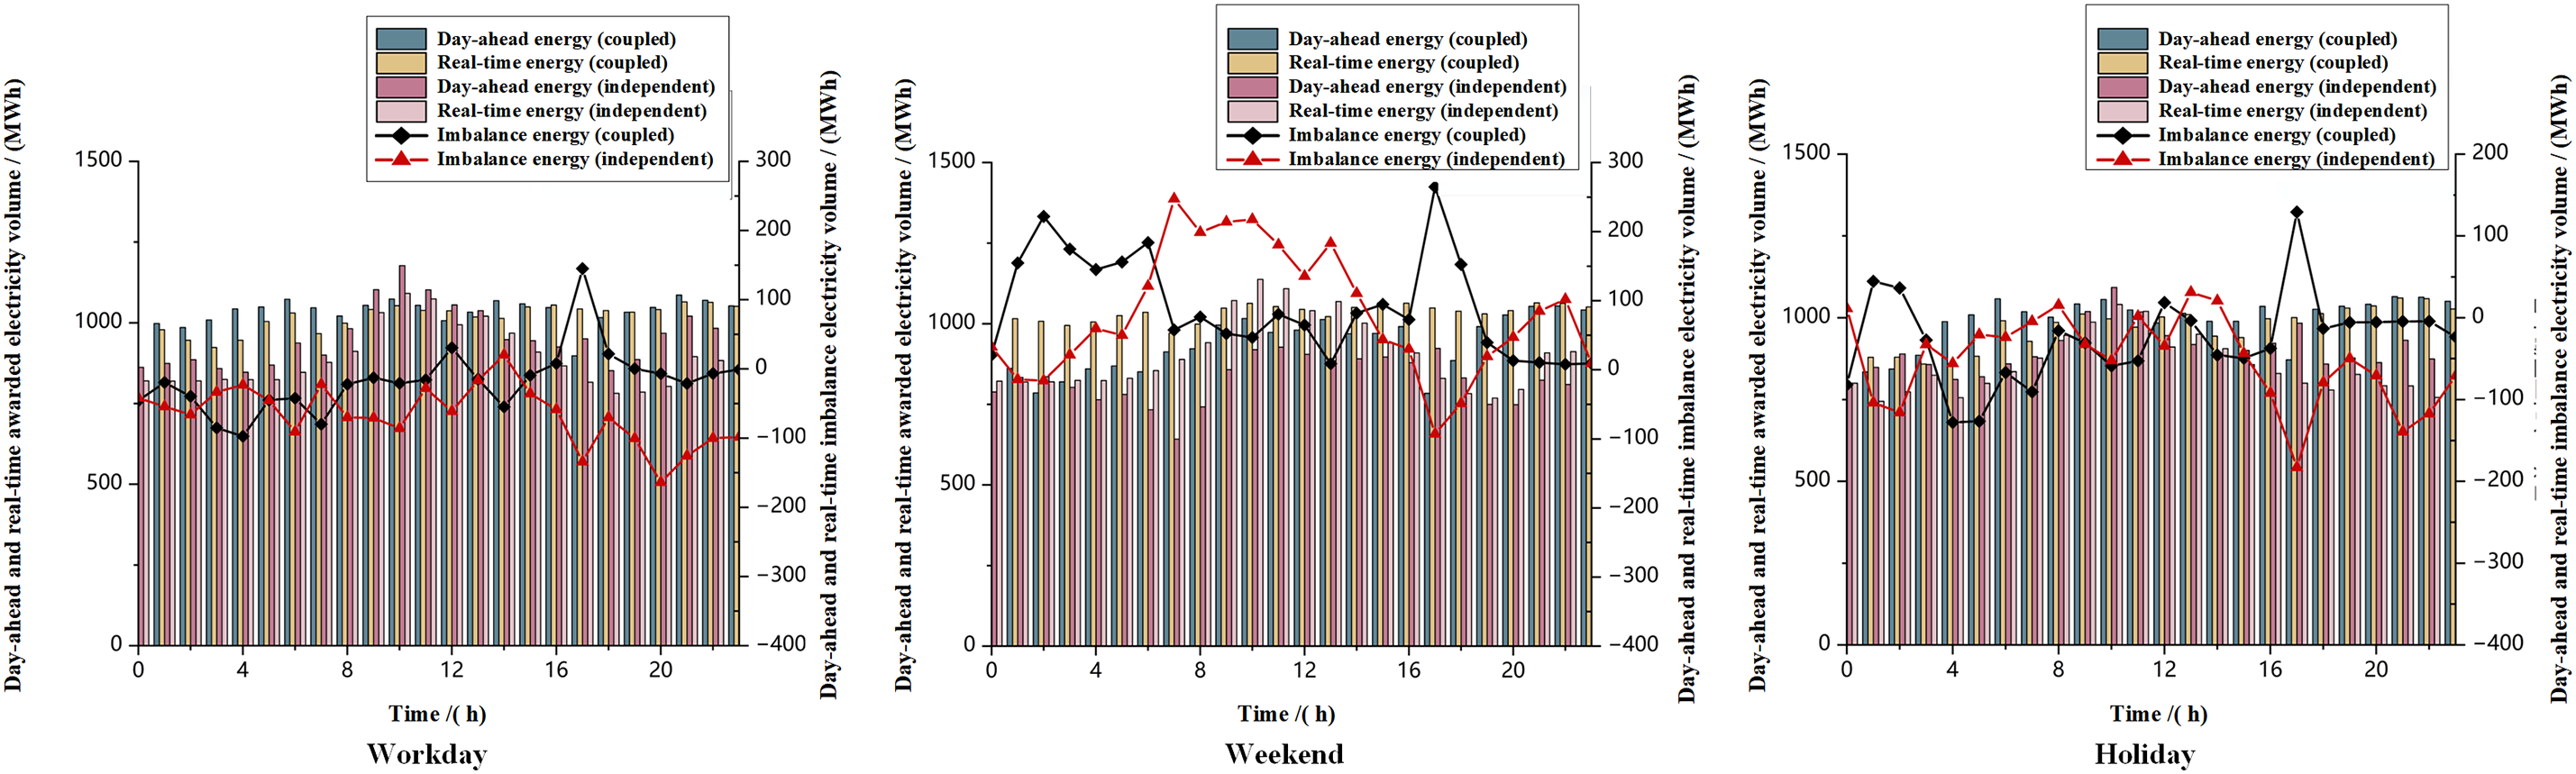
Figure 14: Comparison of generation power and imbalance energy for coupled vs. independent operation in the second quarter
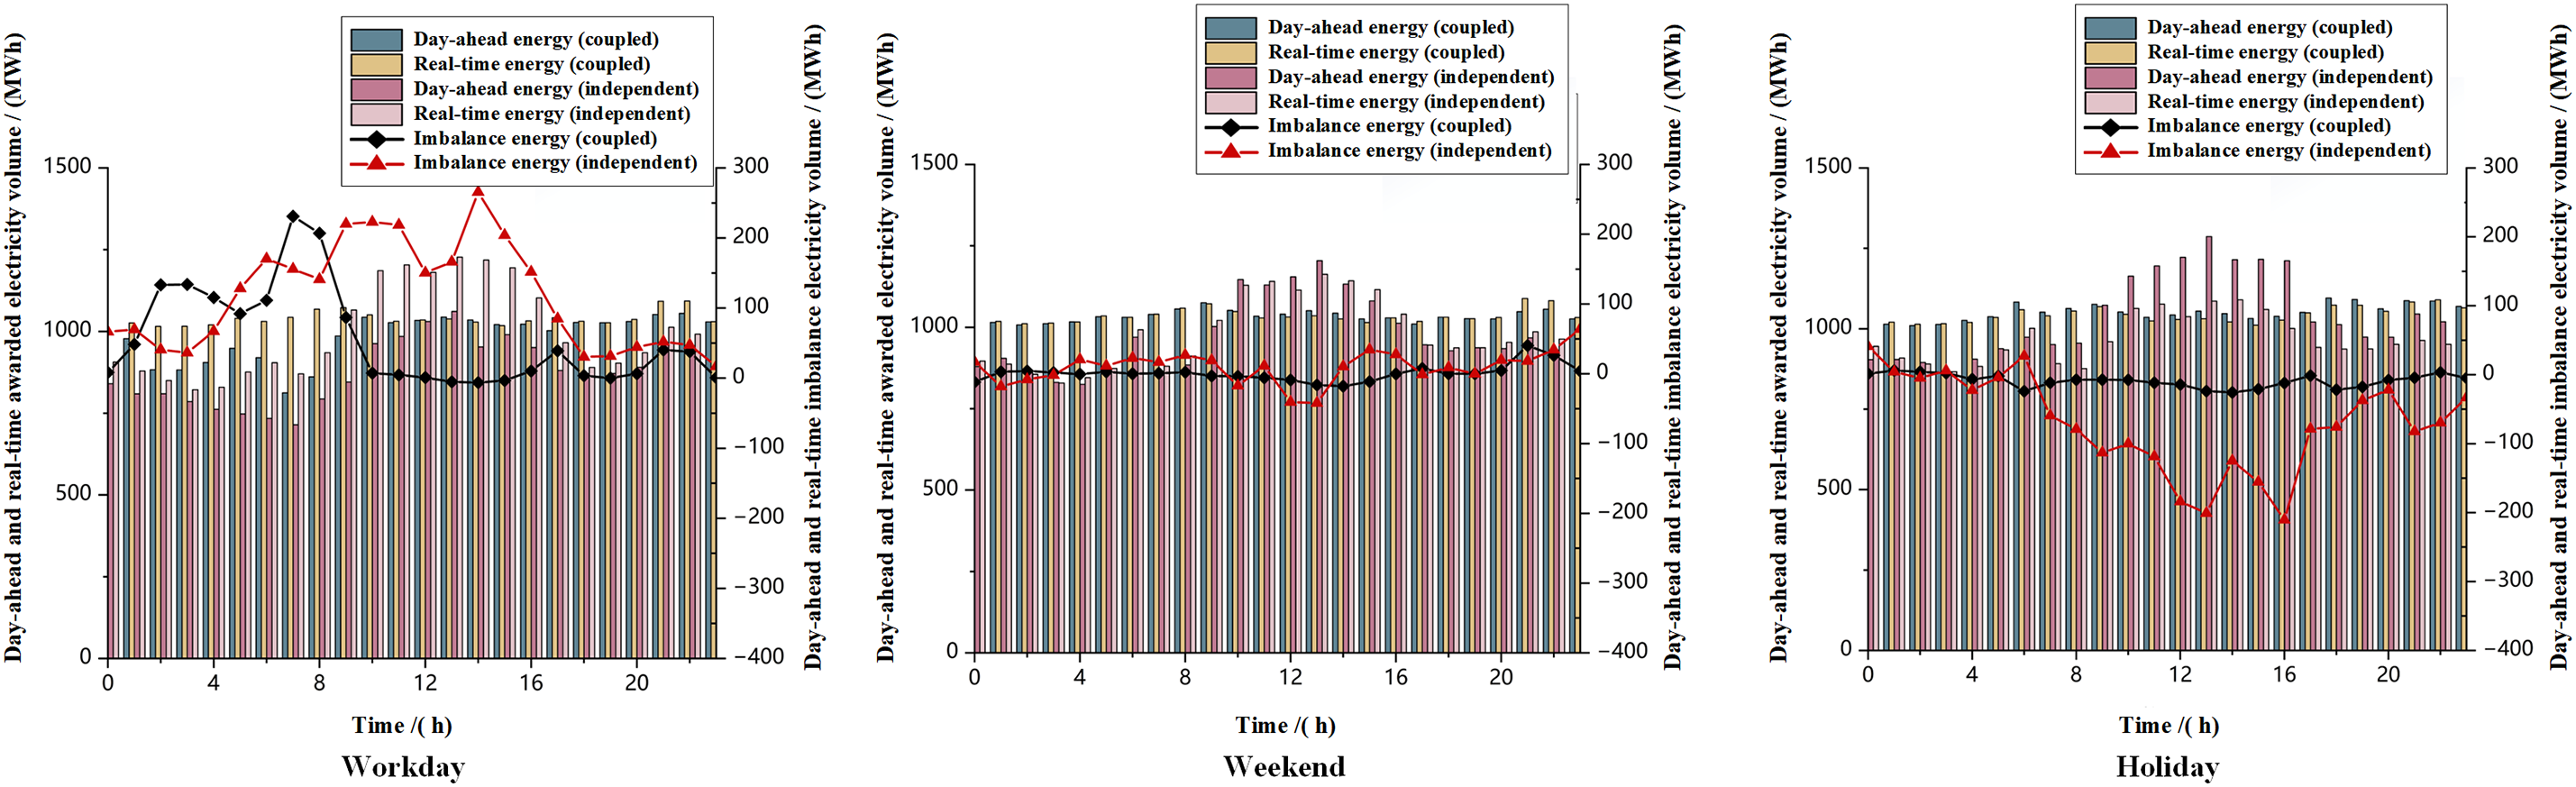
Figure 15: Comparison of generation power and imbalance energy for coupled vs. independent operation in the third quarter
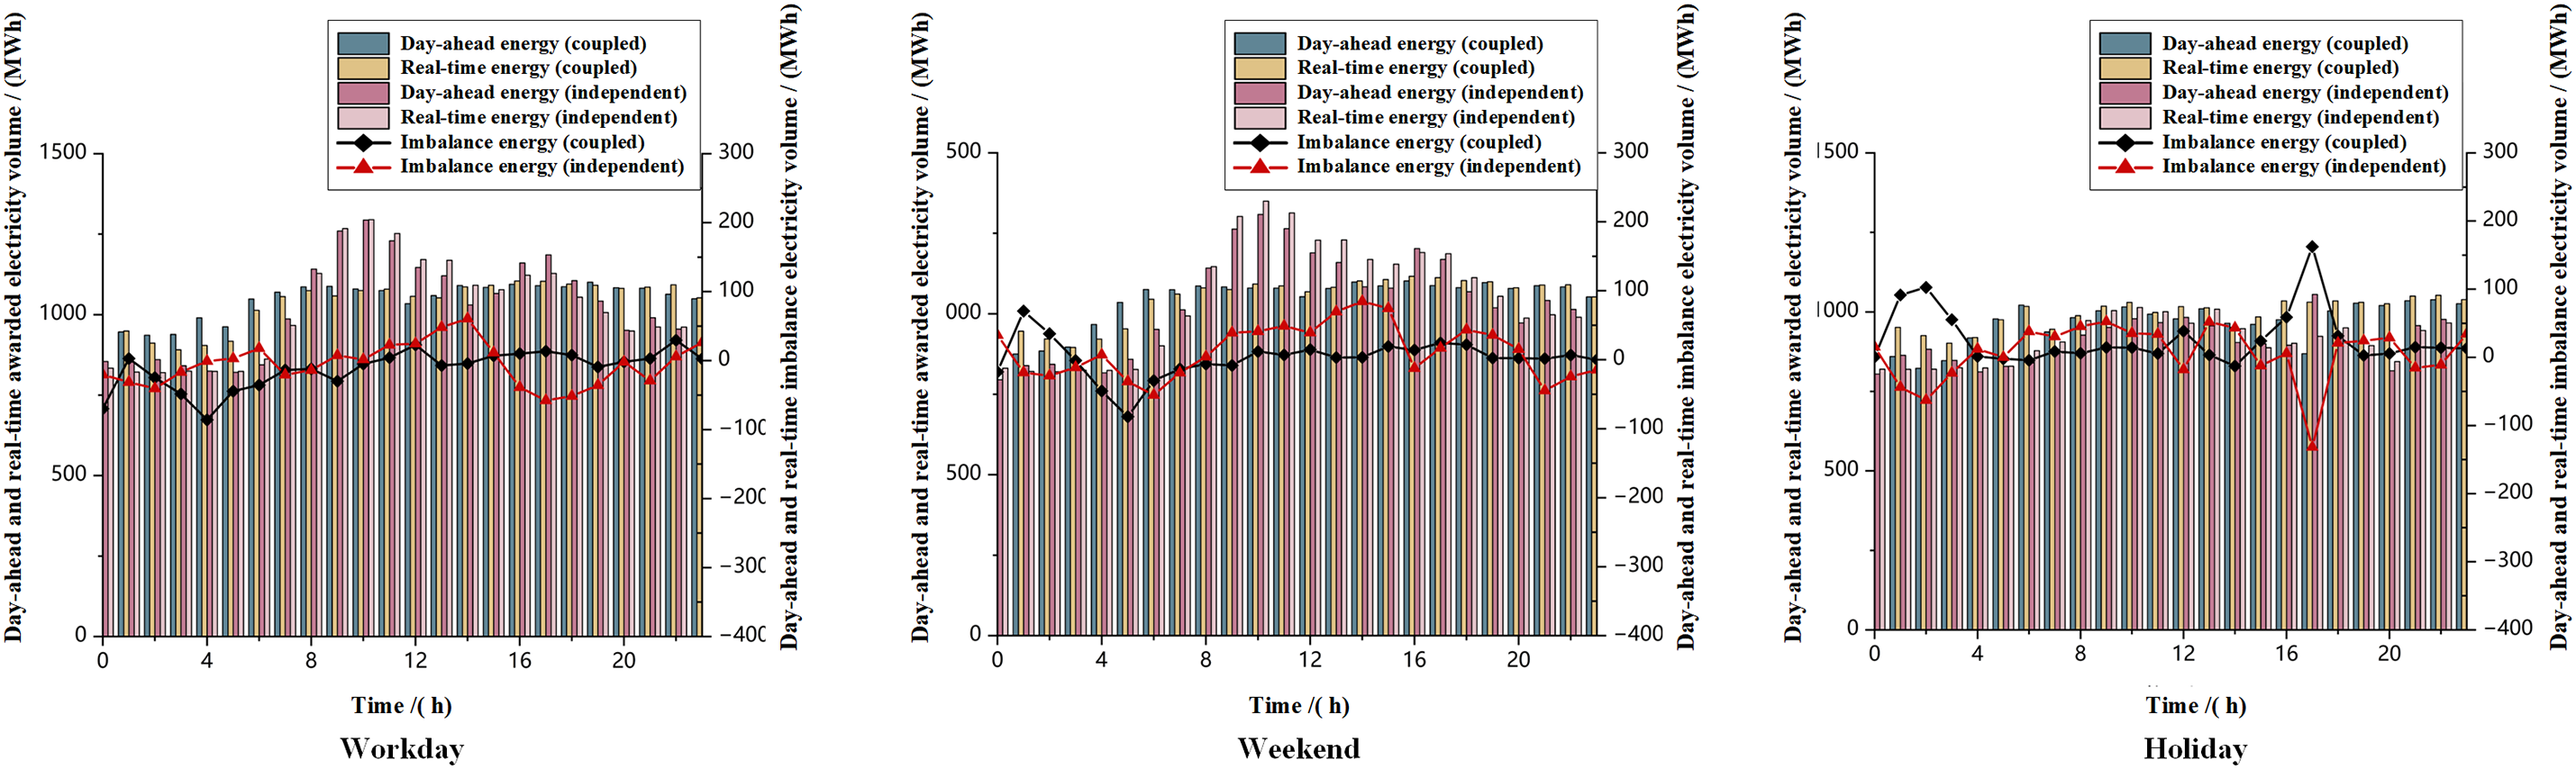
Figure 16: Comparison of generation power and imbalance energy for coupled vs. independent operation in the fourth quarter
In most periods, the imbalance energy associated with coupled operation is relatively low. This is primarily because the multi-energy complementary system, consisting of renewable energy and thermal power, can fully utilize the flexibility regulation capability of thermal power units. The flexibility services provided by thermal power effectively mitigate the uncertainties associated with renewable energy, compensating for the negative imbalance energy caused by the underperformance of renewable energy. This reduces the overall deviation degree of the multi-energy complementary system, leading to improved overall operational efficiency. Through this mechanism, compared to independent operation, the overall revenue of the multi-energy complementary system is enhanced. The overall revenue of the multi-energy complementary system and the revenues from uncoupled independent operation are shown in Figs. 17–20. The detailed contribution and expected revenues of each market participant within the multi-energy complementary system are shown in Figs. 21–24 and Table 6.
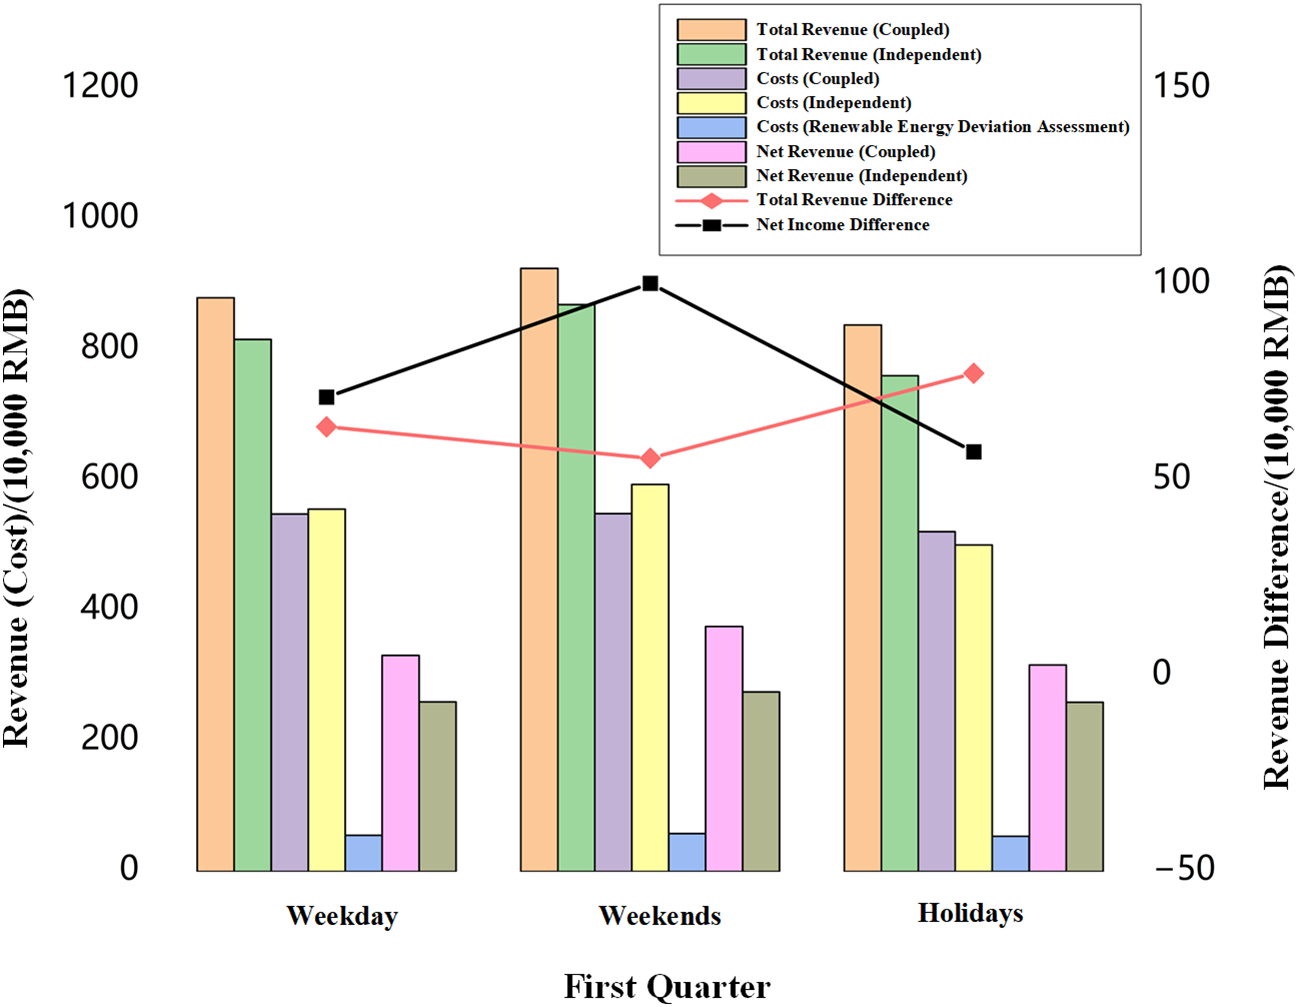
Figure 17: Cost and revenue comparison for coupled vs. independent operation in the first quarter
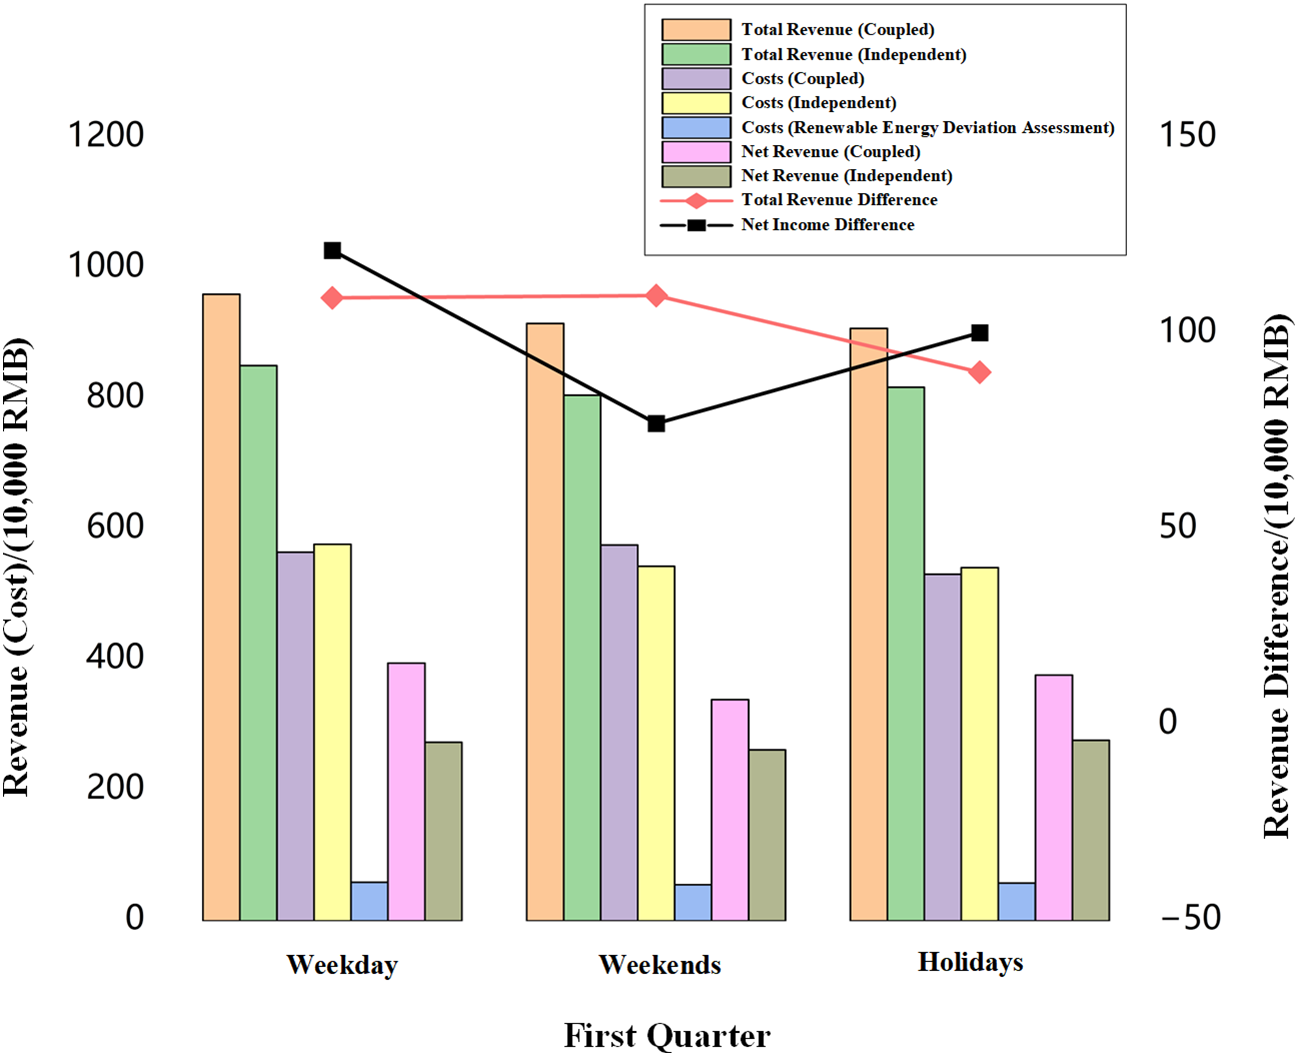
Figure 18: Cost and revenue comparison for coupled vs. independent operation in the second quarter
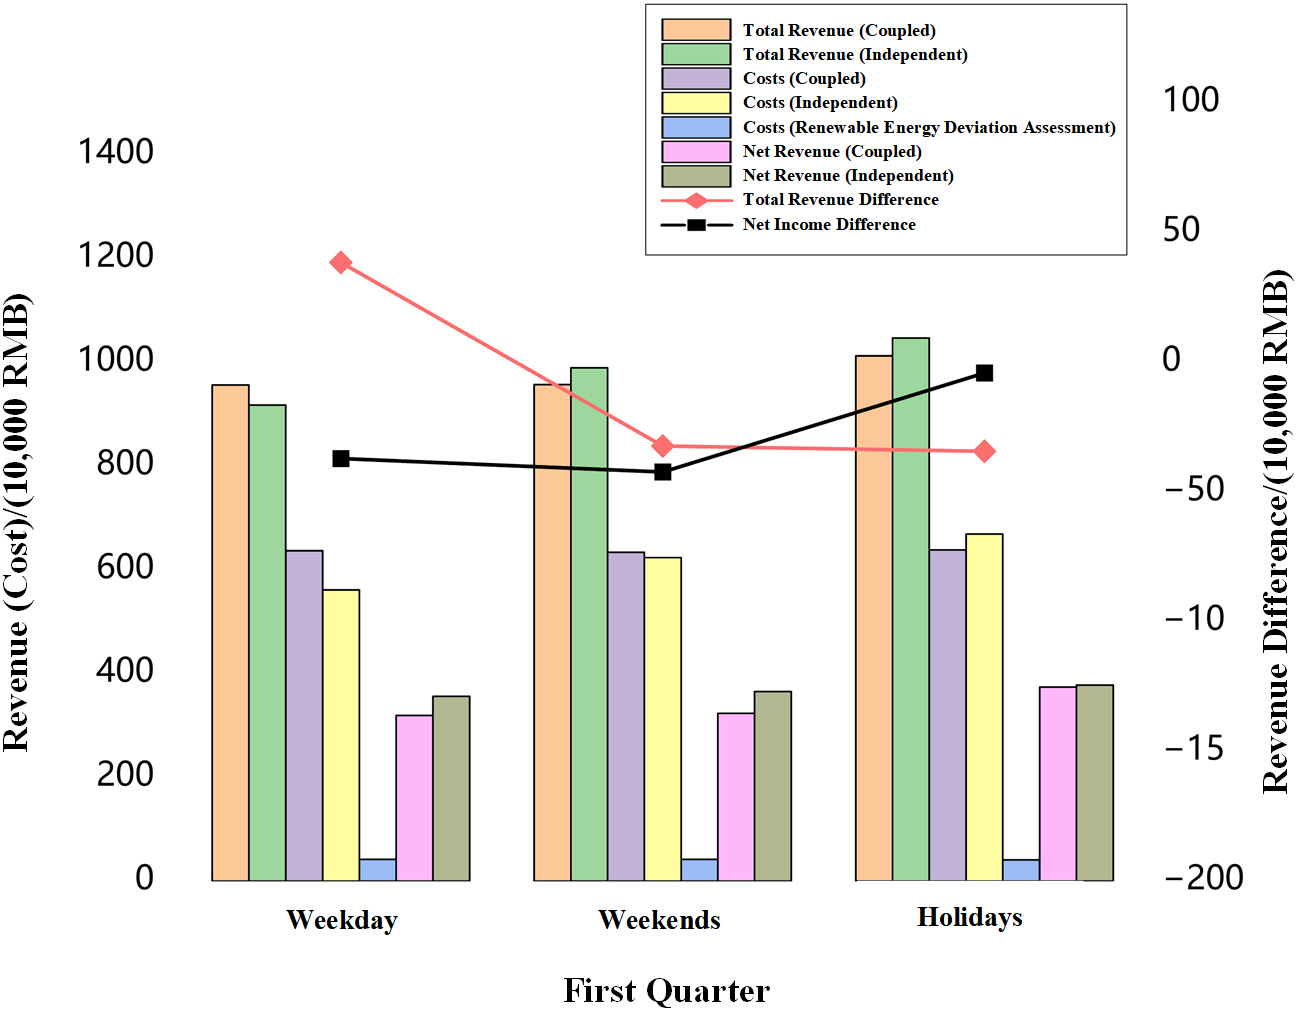
Figure 19: Cost and revenue comparison for coupled vs. independent operation in the third quarter
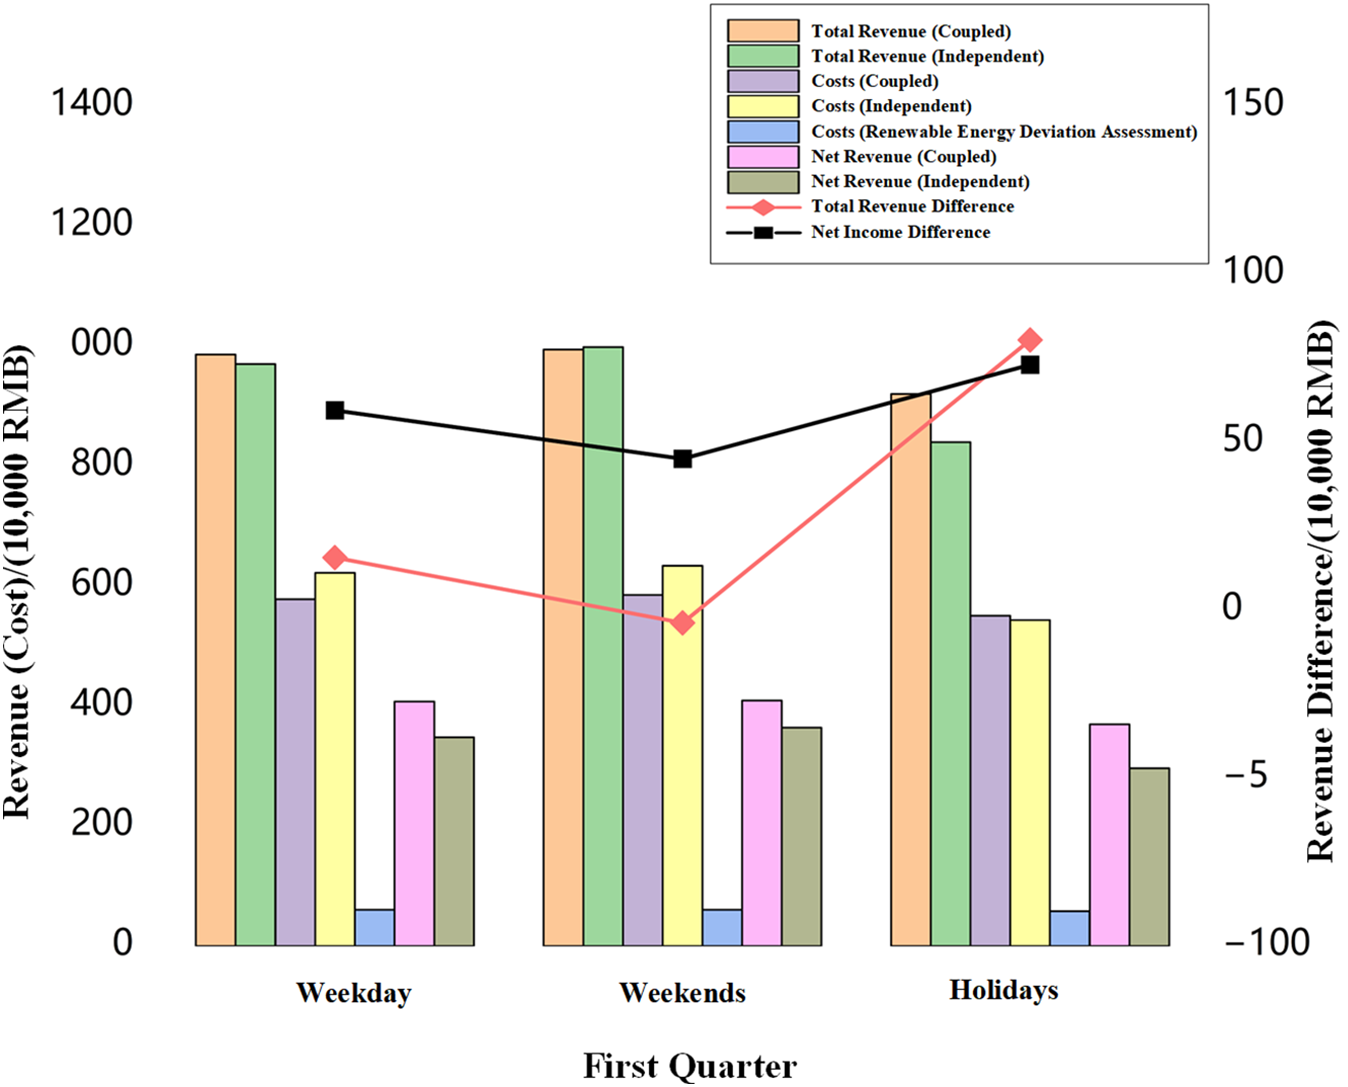
Figure 20: Cost and revenue comparison for coupled vs. independent operation in the fourth quarter
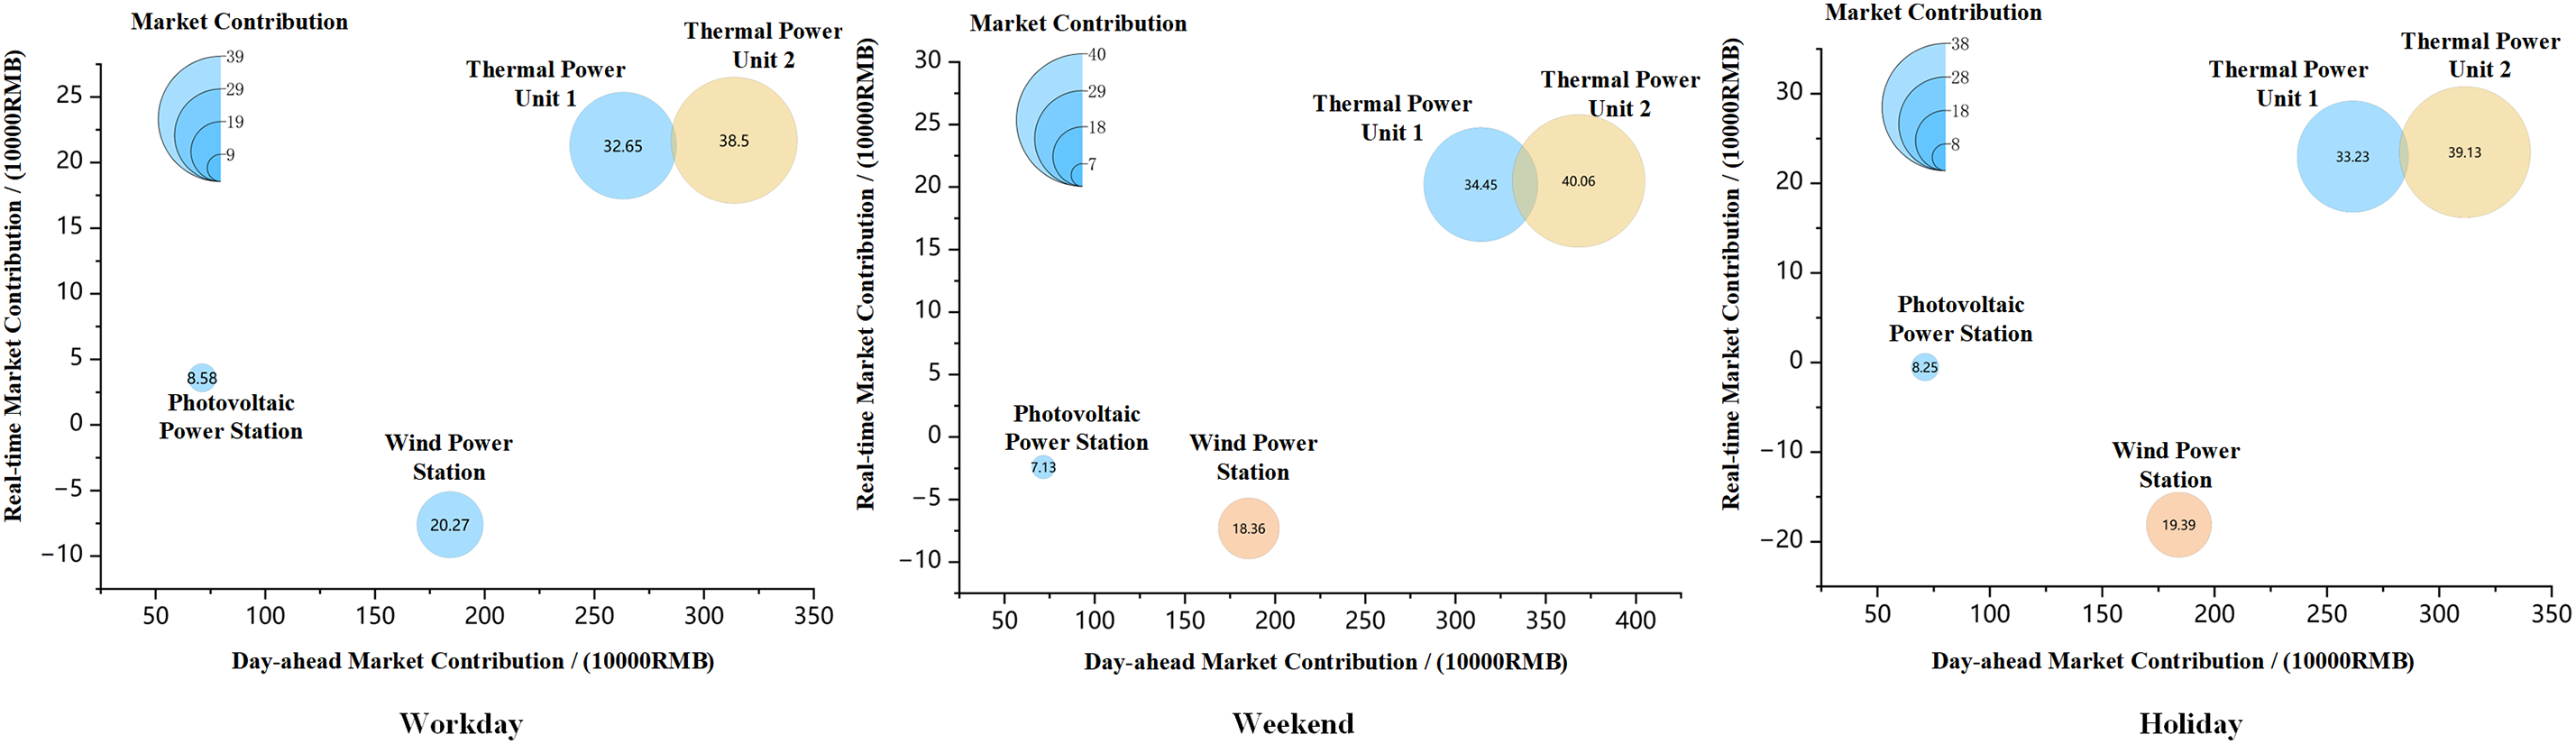
Figure 21: Day-ahead and real-time balance market contributions and contribution rates of each participant in the multi-energy complementary system for the first quarter
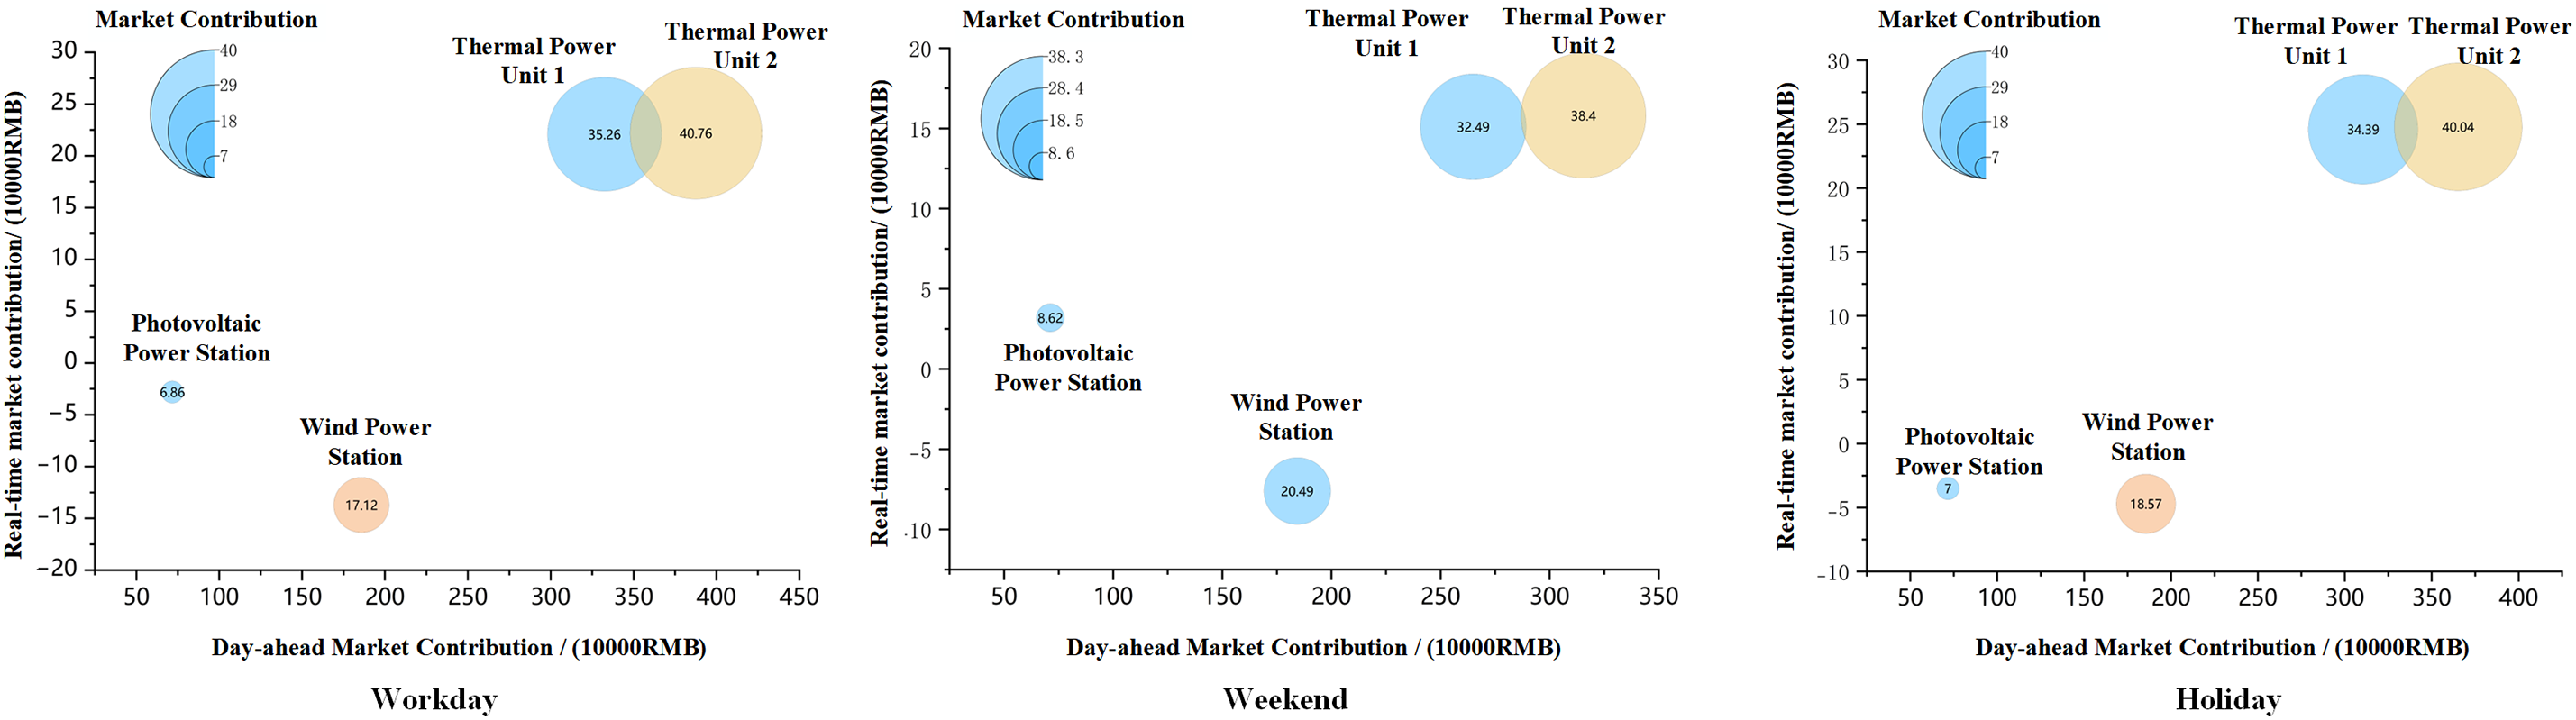
Figure 22: Day-ahead and real-time balance market contributions and contribution rates of each participant in the multi-energy complementary system for the second quarter
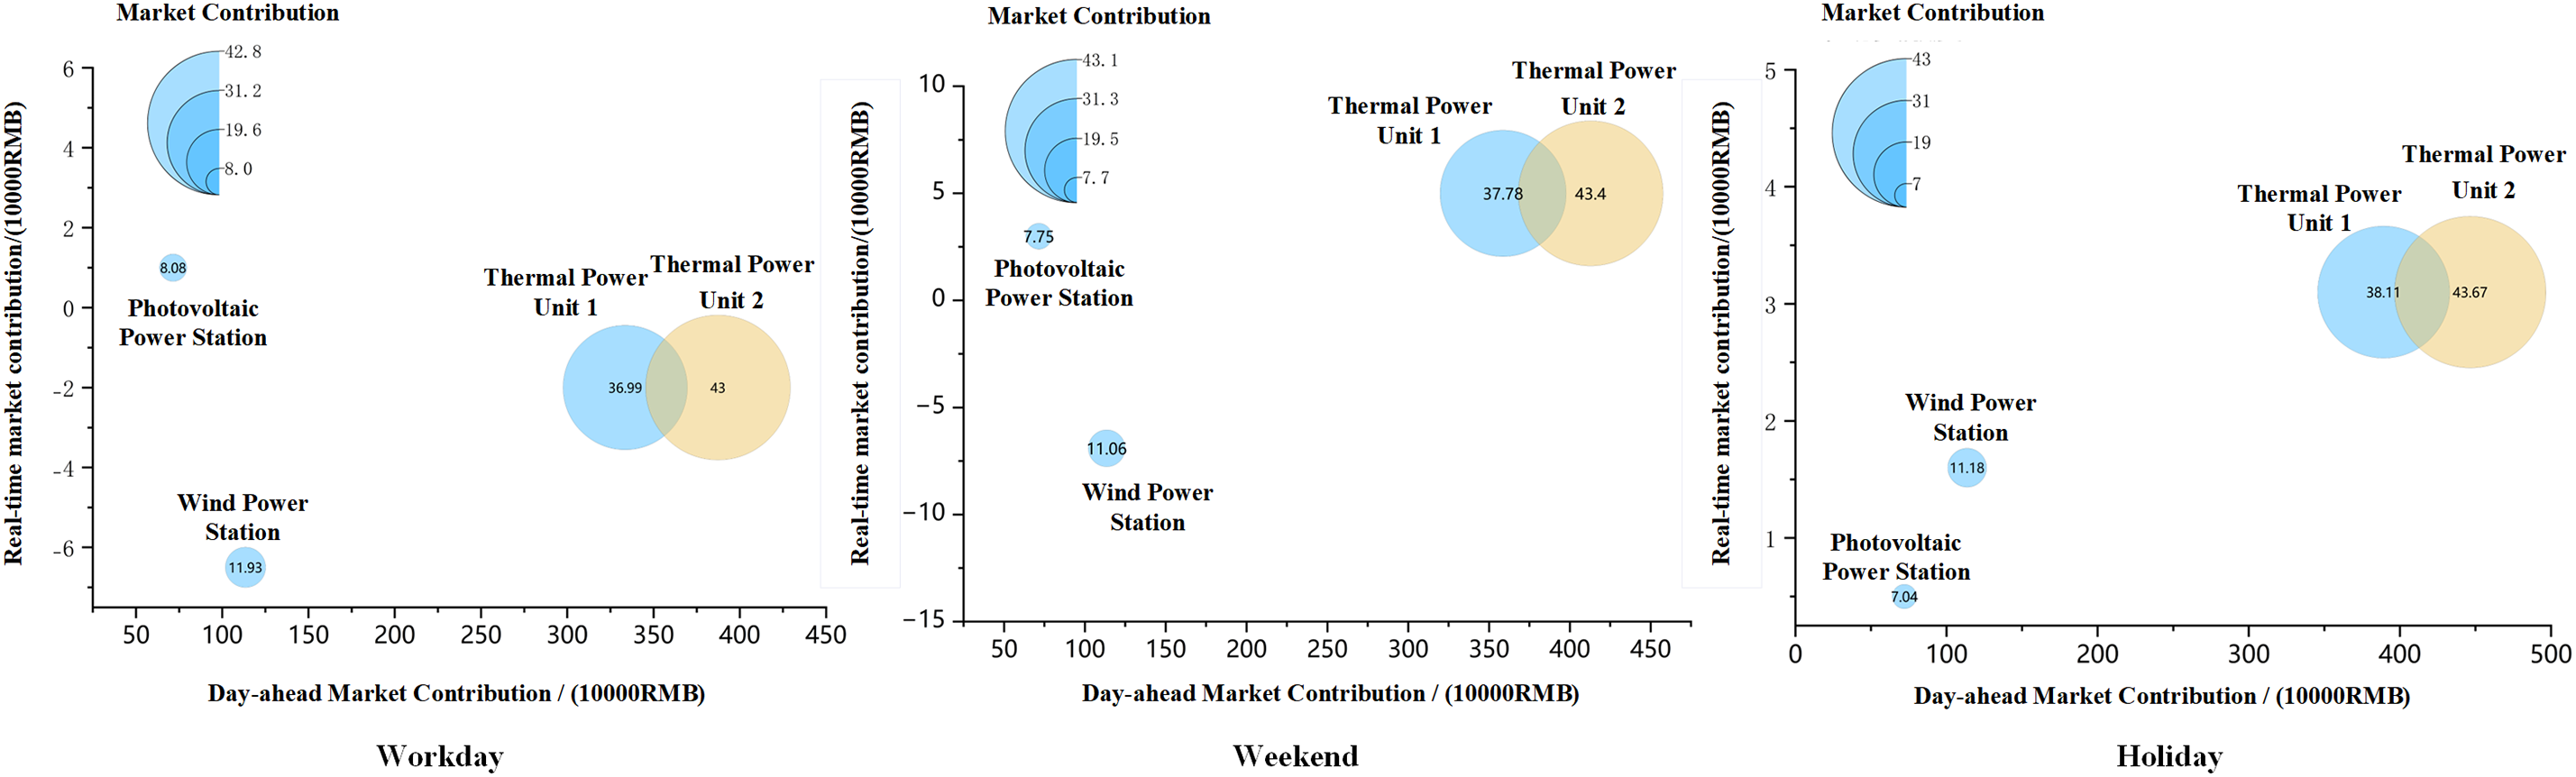
Figure 23: Day-ahead and real-time balance market contributions and contribution rates of each participant in the multi-energy complementary system for the third quarter
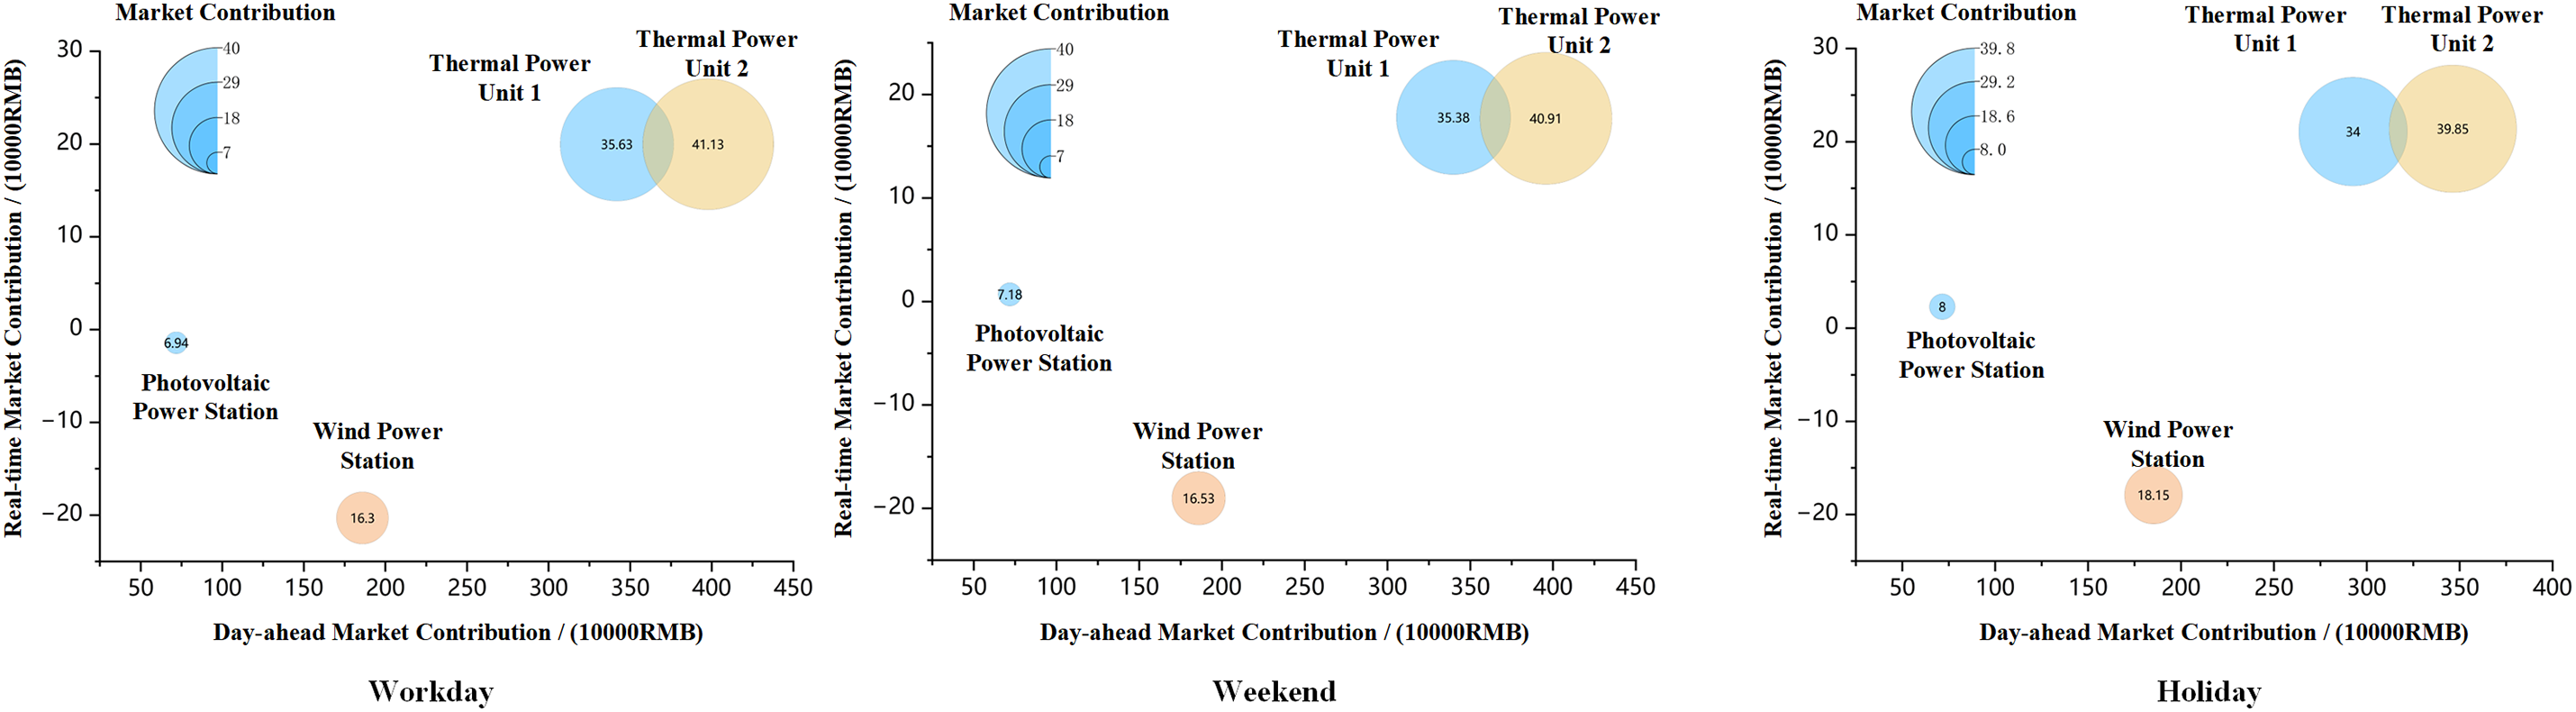
Figure 24: Day-ahead and real-time balance market contributions and contribution rates of each participant in the multi-energy complementary system for the fourth quarter
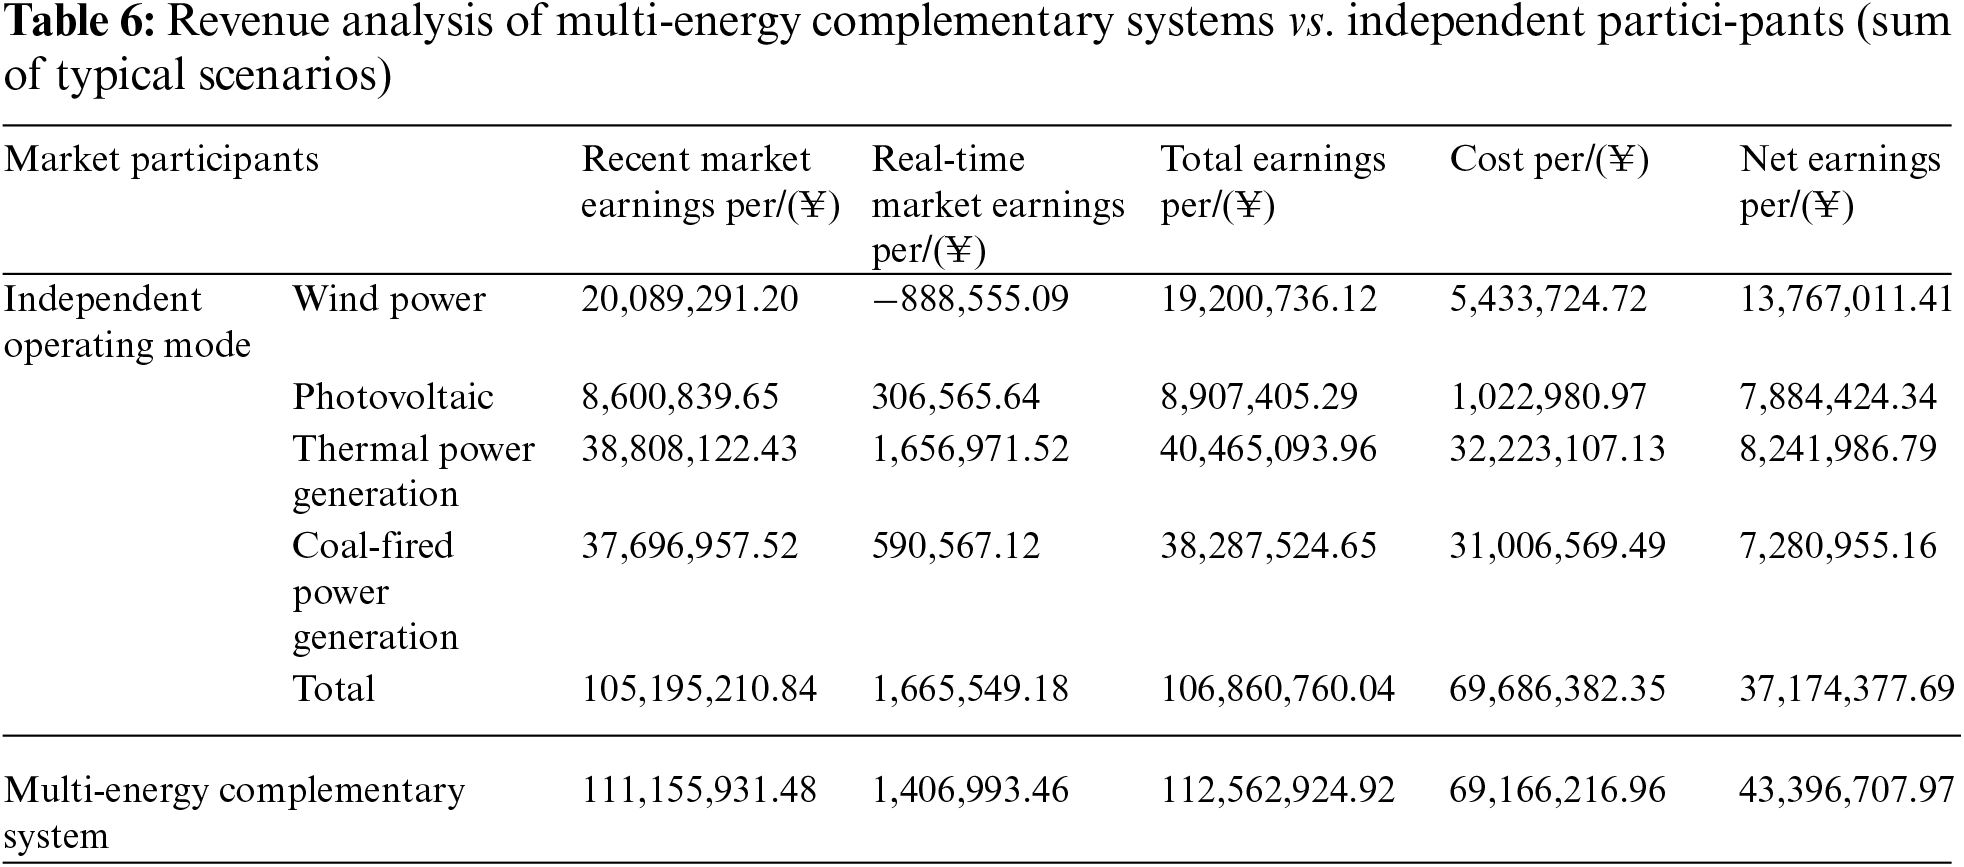
The results indicate that when wind power participates in the market independently, its profitability in the real-time balancing market is negative (−888,555.09 RMB) due to its output uncertainty and volatility, negatively impacting overall revenues. In contrast, although thermal power does not have a cost advantage over wind and photovoltaic power in the day-ahead market, it incurs significant imbalance settlement costs of 1,656,971.52 and 590,567.12 RMB in the real-time balancing market. This demonstrates a strong capability for flexible regulation, contributing to the stability and balance of the power system.
Under the joint operation mode, the multi-energy complementary system increased the total revenue of market participants by 5,702,164.88 RMB across 12 typical scenario days. This gain is attributed to the synergy between renewable energy and thermal power. The proposed revenue distribution mechanism effectively identifies and allocates revenue based on market contribution from both the day-ahead and balancing market dimensions. Figs. 21–24 show a positive correlation between market contribution and the energy value in the day-ahead market, as well as the flexibility value in the real-time balancing market. This indicates that participants can reduce imbalance costs and enhance market contribution by increasing energy transactions in the day-ahead market or providing more flexibility in the real-time market.
The final revenue distribution for each participant, according to the allocation method proposed in this paper, is shown in Table 7. After forming a multi-energy complementary system with thermal power and participating in the spot market, the revenue for wind power increased by 5.7% compared to participating independently in the market. Photovoltaic (PV) revenue increased by 5%, and thermal power revenue increased by 5.3%.
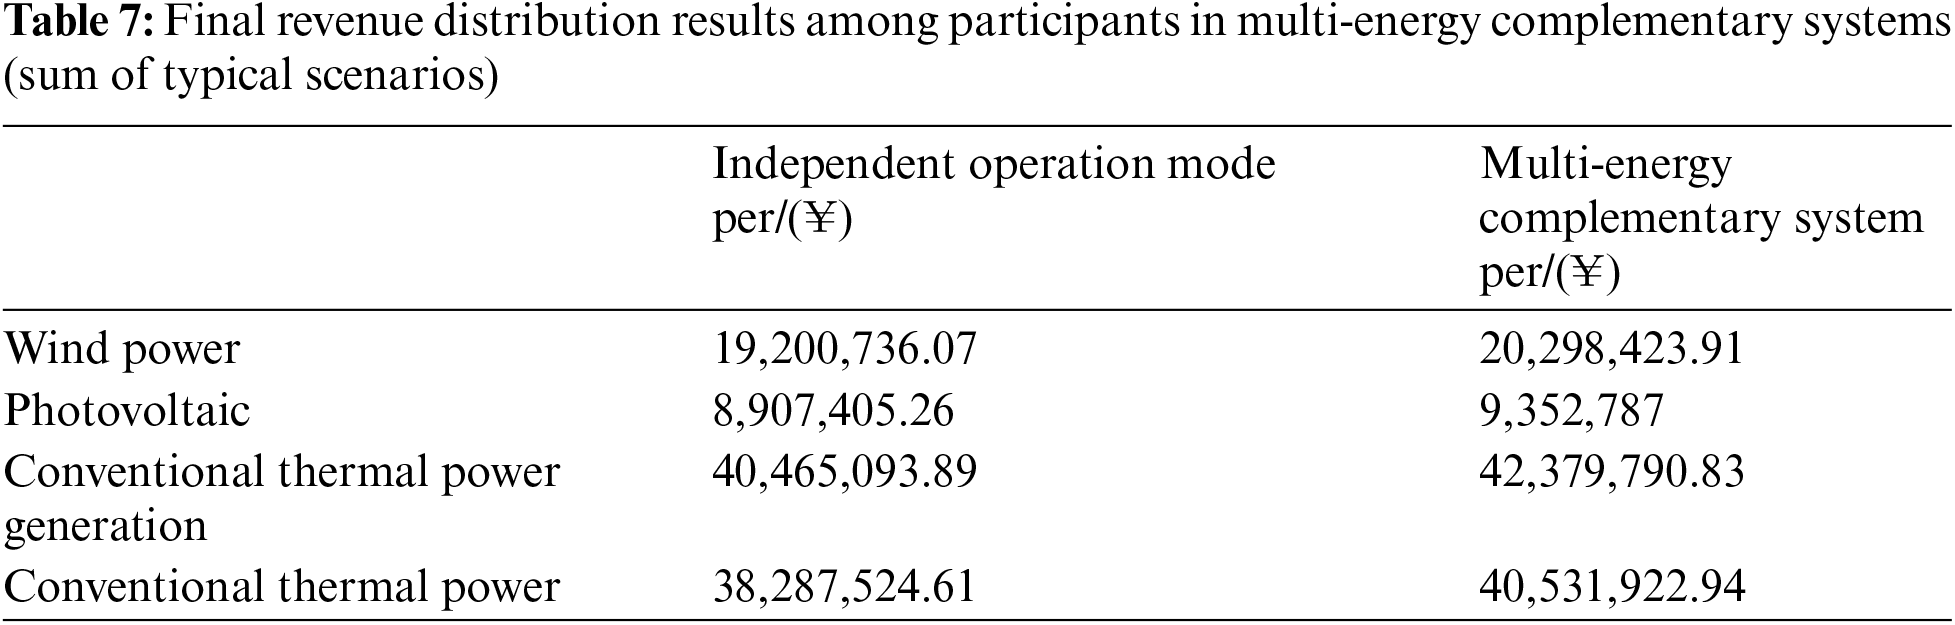
The flexibility contributions of various generation entities to the overall system are illustrated in Fig. 25. Multi-energy complementarity not only stabilizes the fluctuations of renewable energy within the system but also provides significant flexibility contributions to system load and external renewable energy variations. It enhances the responsiveness of thermal power units to renewable energy fluctuations, which is crucial for the development of renewable energy. Additionally, Figs. 13–16 show that the multi-energy complementarity system effectively reduces output imbalances at nodes through internal flexibility adjustments, greatly stabilizing node outputs compared to independent operation, thereby improving the overall stability of the power system. Tables 6 and 7 compare the benefits of each generation entity in a multi-energy complementarity system vs. independent operation, showing significant performance improvements when operating jointly. This greatly motivates generation entities to participate in multi-energy complementarity systems. Consequently, this model not only improves economic benefits but also promotes the widespread adoption and construction of multi-energy complementarity systems, demonstrating its application potential and strategic value in modern energy systems.
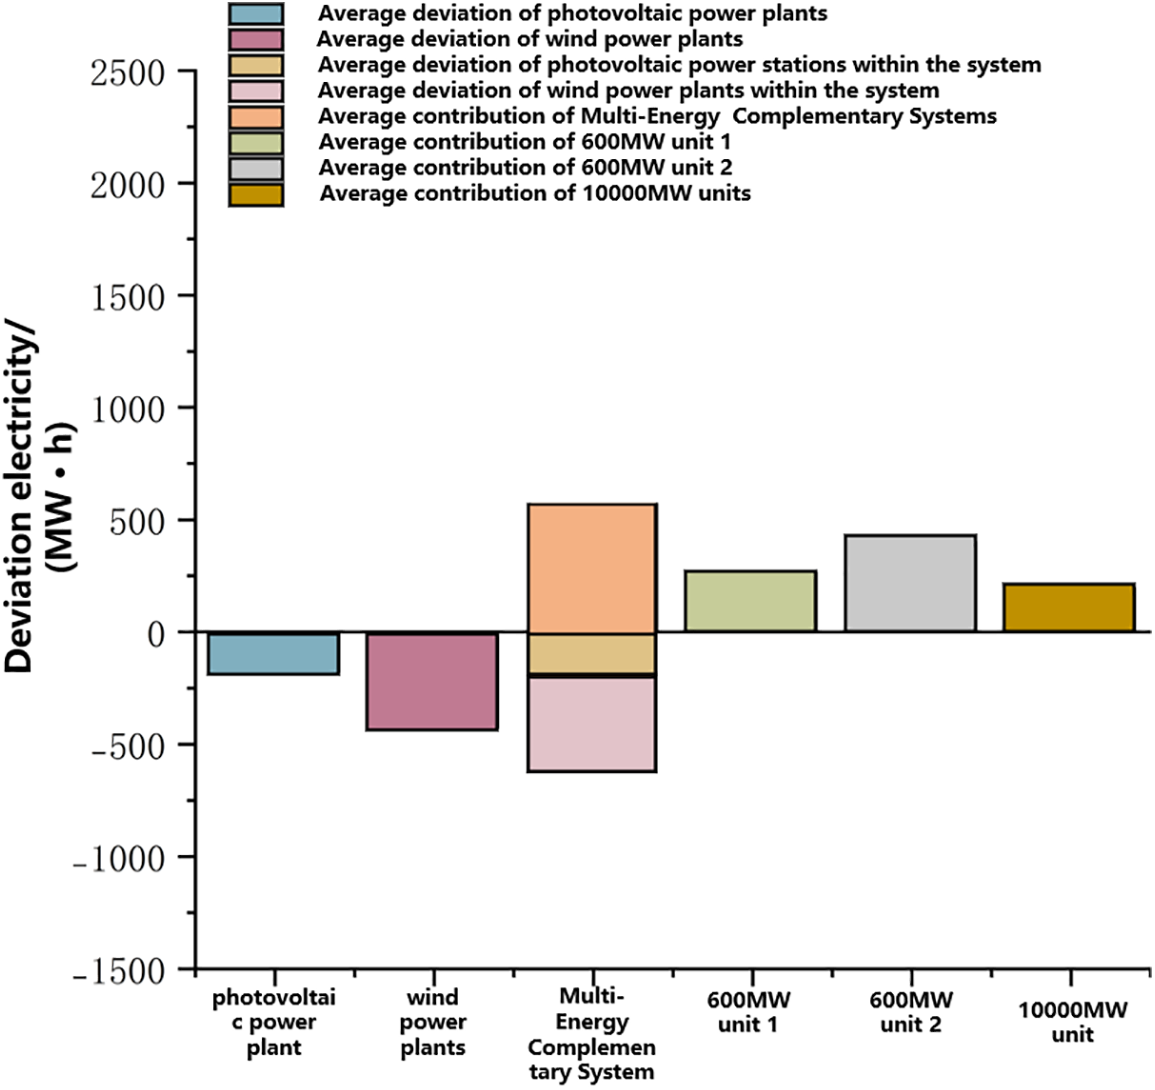
Figure 25: Average deviation of renewable energy generation and flexibility contribution of conventional units
5.5 Market-Based Integration Capacity of Renewable Energy in Multi-Energy Complementary Systems
Renewable energy companies participating independently in the market will incur high deviation penalty costs in the real-time balancing market, as shown in Fig. 25.
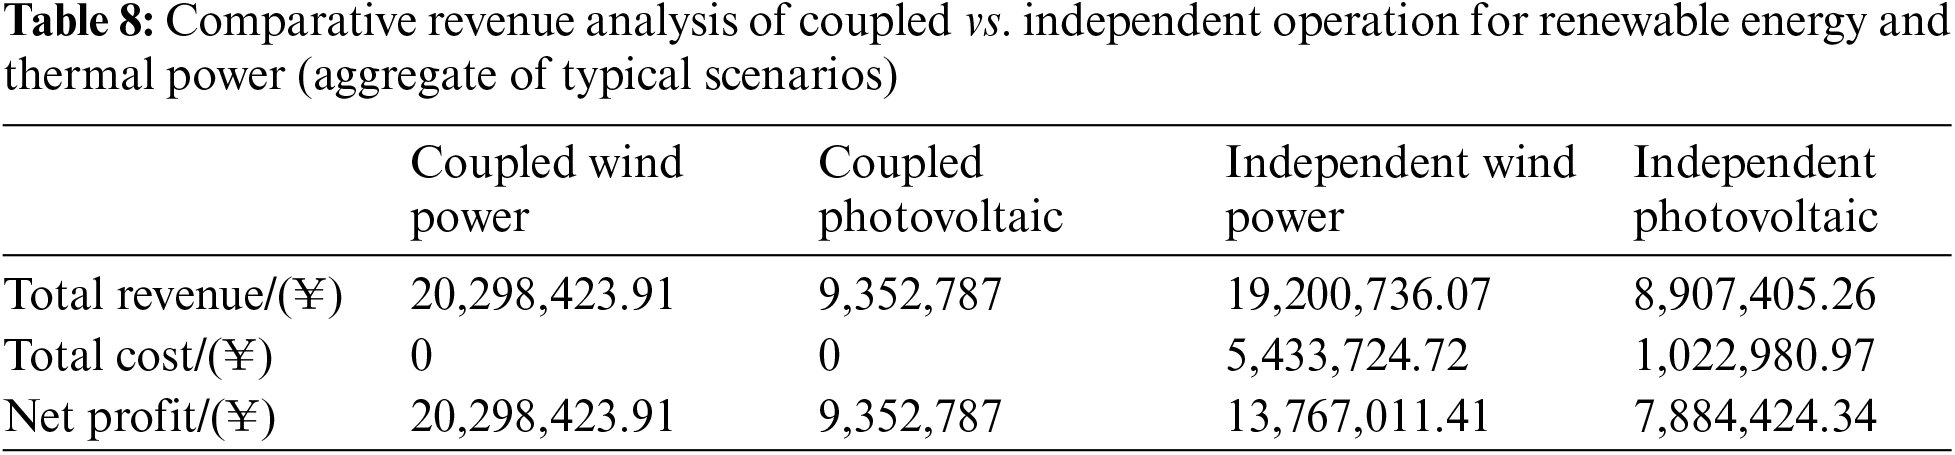
As shown in Fig. 26 and Table 8, after renewable energy participates in the multi-energy complementary system, the deviation penalty costs are reduced by 6,456,705.69 RMB compared to independent participation by equivalent capacity units. This reduction is due to the internal thermal power providing mandatory peak shaving ancillary services for the fluctuation in renewable energy output and the overall output stability of the multi-energy complementary system at the grid connection point. After internal revenue distribution, the net profits for internal renewable energy from wind power and photovoltaic are 20,298,424, 9,352,787, and 42,379,791 RMB, respectively. These figures are higher than those for renewable energy units with equivalent capacity participating independently in market competition. This indicates that the multi-energy complementary system, comprising renewable energy and thermal power, as an independently operating entity subject to unified grid regulation, not only reduces the grid’s regulatory burden but also exhibits characteristics of mutual benefit. It can maximize overall benefits while effectively integrating renewable energy through market-based transactions.
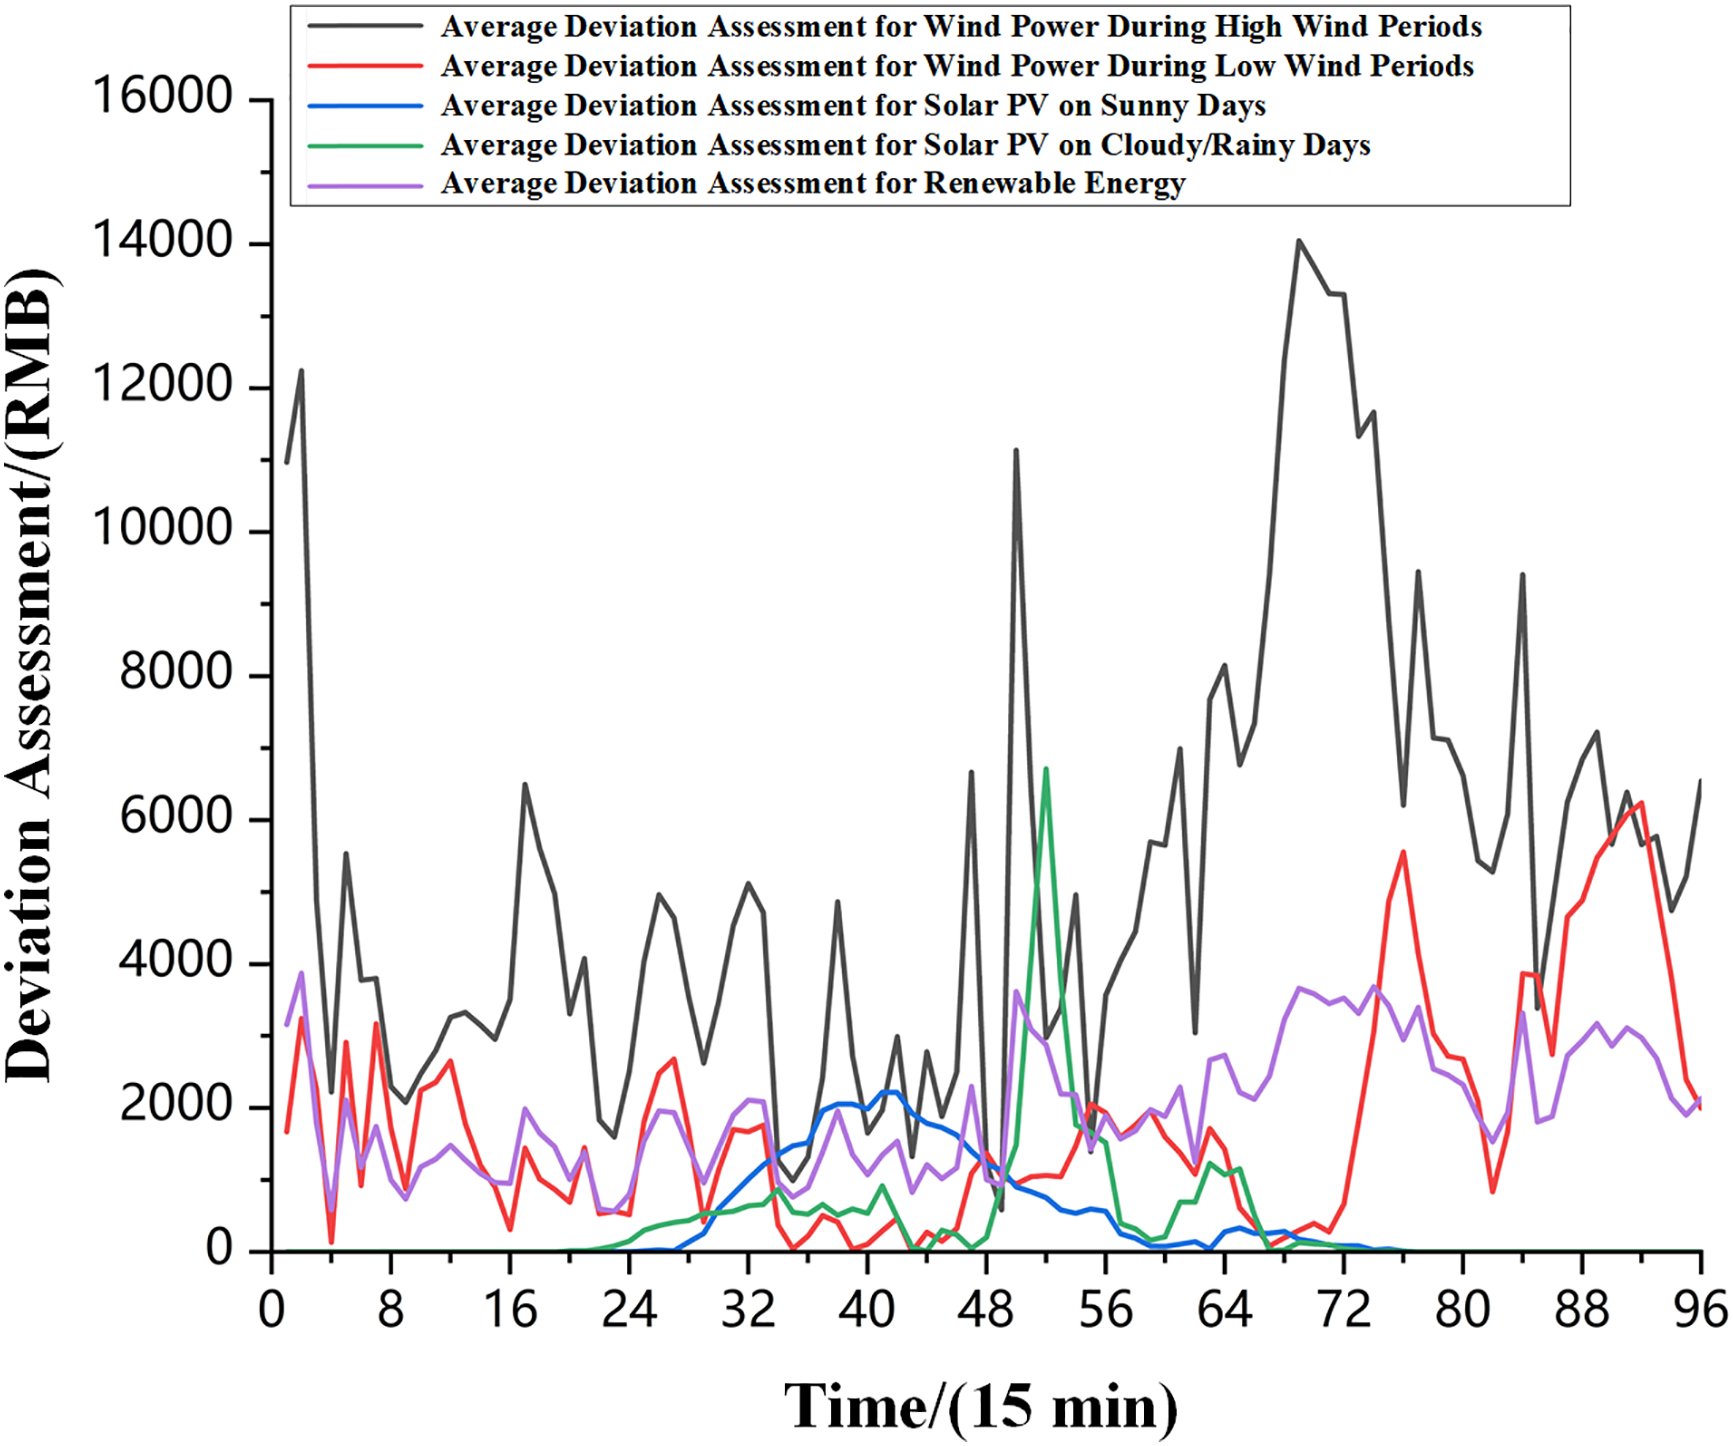
Figure 26: Assessment fees for renewable energy deviations
This paper focuses on the complementary relationship between renewable energy and thermal power within a multi-energy complementary system. It delves into the optimization strategies for operating such a system in the spot market and, considering the day-ahead to real-time balancing contributions of each market participant, establishes an evaluation index system for internal revenue distribution among the participants in the multi-energy complementary system. Finally, simulations based on the IEEE 30-bus system demonstrate that:
(1) Integrating renewable energy and thermal power into a multi-energy complementary system can further explore the potential for coordinated development between renewable energy and thermal power. Renewable energy can help reduce the marginal cost of the multi-energy complementary system, while thermal power can provide flexible resources to ensure stable overall output.
(2) The internal revenue distribution index system, which fully considers the day-ahead energy to real-time balancing contribution, can reasonably quantify the energy value of renewable energy in the day-ahead market and the flexibility value provided by thermal power in the real-time balancing market. The results indicate that the revenue allocated to cooperative participants is significantly higher than when participating in the market independently, effectively incentivizing different flexible resources to participate in the multi-energy complementary system.
(3) The total revenue of renewable energy within the multi-energy complementary system, after external competition and internal revenue distribution, is significantly higher compared to renewable energy stations with the same capacity participating independently in the market. This improvement is attributed to the flexibility capacity provided by thermal power within the multi-energy complementary system, which helps renewable energy avoid penalties associated with output instability. Additionally, the reasonable internal revenue distribution mechanism fully accounts for the energy contribution of renewable energy, ensuring the profitability of renewable energy market participants and significantly enhancing the market-based integration of renewable energy.
(4) Although this paper explores the optimization strategies for multi-energy complementarity systems in spot markets and evaluates internal benefit distribution metrics, we observed significant congestion in the system when renewable energy output levels were low during the case study analysis. This suggests that there is room for further optimization of resource and structural configurations within the system. Additionally, effective coordination between different energy sources within the multi-energy complementarity system is crucial for maximizing overall benefits. Future research should focus on the capacity allocation between renewable and thermal power within the system to achieve higher operational efficiency and economic benefits.
Acknowledgement: This paper was completed with the hard help of every author.
Funding Statement: This research was funded by the National Key R&D Program of China, grant number 2019YFB1505400.
Author Contributions: Study conception and design: Zipeng Zhang and Guoliang Bian; data collection: Chuang Liu; analysis and interpretation of results: Zipeng Zhang and Xiuyun Wang; draft manuscript preparation: Zipeng Zhang; article editing and translation: Zipeng Zhang and Guoliang Bian. All authors reviewed the results and approved the final version of the manuscript.
Availability of Data and Materials: Load data, wind power data, photovoltaic data, unit coal consumption data and other data used in this paper have been given in the paper.
Ethics Approval: Not applicable.
Conflicts of Interest: The authors declare no conflicts of interest to report regarding the present study.
References
1. R. Ge, L. Chen, Y. Wang, and D. Liu, “Optimal path selection and design for the construction of the electricity market in china,” Autom. Electr. Power Syst., vol. 41, pp. 10–15, 2017. [Google Scholar]
2. M. Bao, Y. Ding, C. Shao, and Y. Song, “Review of the nordic electricity market and its lessons for China,” Proc. CSEE, vol. 37, pp. 4881–4892+5207, 2017. doi: 10.13334/j.0258-8013.pcsee.170320. [Google Scholar] [CrossRef]
3. L. Guan, L. Zhou, B. Liu, H. Tao, Z. Luo and G. Zhang, “Analysis and implications of long-term negative electricity prices in the Shandong electricity spot market during the “May Day holiday,” Autom. Electr. Power Syst., vol. 48, pp. 1–7, 2024. [Google Scholar]
4. Y. H. Song et al., “Overview of key points and related suggestions for the construction of China’s electricity spot market under the new electricity reform,” Proc. Chin. Soc. Electr. Eng., vol. 40, no. 10, pp. 3172–3187, 2020. doi: 10.13334/j.0258-8013.pcsee.191251. [Google Scholar] [CrossRef]
5. Y. J. Lin, “Bidding strategy of coal-fired power plants in the electricity spot market based on marginal cost analysis,” Guangdong Electr. Power, vol. 32, no. 10, pp. 133–138, 2019. [Google Scholar]
6. C. Batlle and J. Barquin, “A strategic production costing model for electricity market price analysis,” IEEE Trans. Power Syst., vol. 20, no. 1, pp. 67–74, 2005. doi: 10.1109/TPWRS.2004.831266. [Google Scholar] [CrossRef]
7. P. I. Panapakidis and S. A. Dagoumas, “Day-ahead electricity price forecasting via the application of artificial neural network-based models,” Appl. Energy, vol. 172, pp. 132–151, 2016. doi: 10.1016/j.apenergy.2016.03.089. [Google Scholar] [CrossRef]
8. O. Abedinia, N. Amjady, M. Shafie-khah, and J. P. S. Catalão, “Electricity price forecast using combinatorial neural network trained by a new stochastic search method,” Energy Convers. Manag., vol. 105, pp. 642–654, 2015. doi: 10.1016/j.enconman.2015.08.025. [Google Scholar] [CrossRef]
9. S. H. Sandhu, L. Fang, and L. Guan, “Forecasting day-ahead price spikes for the Ontario electricity market,” Elect. Power Syst. Res., vol. 141, pp. 450–459, 2016. doi: 10.1016/j.epsr.2016.08.005. [Google Scholar] [CrossRef]
10. S. Nojavan, K. Zare, and R. M. Feyzi, “Optimal bidding strategy of generation station in power market using information gap decision theory (IGDT),” Elect. Power Syst. Res., vol. 96, pp. 56–63, 2013. doi: 10.1016/j.epsr.2012.10.006. [Google Scholar] [CrossRef]
11. Z. Yang, L. Ce, and L. Lian, “Electricity price forecasting by a hybrid model, combining wavelet transform, ARMA and kernel-based extreme learning machine methods,” Appl. Energy, vol. 190, pp. 291–305, 2017. doi: 10.1016/j.apenergy.2016.12.130. [Google Scholar] [CrossRef]
12. N. Ziogos and A. Tellidou, “An agent-based FTR auction simulator,” Elect. Power Syst. Res., vol. 81, no. 7, pp. 1239–1246, 2011. doi: 10.1016/j.epsr.2011.03.004. [Google Scholar] [CrossRef]
13. C. Xue et al., “Limited rationality agent bidding model for generators in the spot market simulation,” Power Syst. Technol., vol. 46, no. 12, pp. 4800–4810, 2022. doi: 10.13335/j.1000-3673.pst.2022.0632. [Google Scholar] [CrossRef]
14. V. J. Kumar, V. D. Kumar, and K. Edukondalu, “Strategic bidding using fuzzy adaptive gravitational search algorithm in a pool-based electricity market,” Appl. Soft Comput. J., vol. 13, no. 5, pp. 2445–2455, 2013. doi: 10.1016/j.asoc.2012.12.003. [Google Scholar] [CrossRef]
15. Y. S. Al-Agtash, “Supply curve bidding of electricity in constrained power networks,” Energy, vol. 35, no. 7, pp. 2886–2892, 2010. doi: 10.1016/j.energy.2010.03.019. [Google Scholar] [CrossRef]
16. L. Yin, S. Li, and F. Gao, “Equilibrium stability of asymmetric evolutionary games of multi-agent systems with multiple groups in open electricity market,” IEEE Access, vol. 8, pp. 28970–28978, 2020. doi: 10.1109/ACCESS.2020.2972387. [Google Scholar] [CrossRef]
17. Y. Wang, K. Zhang, and S. H. Zhang, “Joint equilibrium analysis of day-ahead power market and demand response trading market for wind power participation,” Proc. Chin. Soc. Electr. Eng., vol. 38, no. 19, pp. 5738–5750+5930, 2018. doi: 10.13334/j.0258-8013.pcsee.171914. [Google Scholar] [CrossRef]
18. F. Ueckerdt, R. Brecha, and G. Luderer, “Analyzing major challenges of wind and solar variability in power systems,” Renew. Energy, vol. 81, pp. 1–10, 2015. doi: 10.1016/j.renene.2015.03.002. [Google Scholar] [CrossRef]
19. T. Wang, Y. Gong, and C. Jiang, “A review on promoting share of renewable energy by green-trading mechanisms in power system,” Renew. Sustain. Energ. Rev., vol. 40, pp. 923–929, 2014. doi: 10.1016/j.rser.2014.08.011. [Google Scholar] [CrossRef]
20. T. K. Tavana, T. M. Hagh, S. Nojavan, M. Yasinzadeh, and M. Ghanbari-Ghalehjoughi, “Operation of smart distribution networks by considering the spatial-temporal flexibility of data centers and battery energy storage systems,” Sustain. Cities Soc., vol. 114, no. 1, 2024, Art. no. 105746. doi: 10.1016/j.scs.2024.105746. [Google Scholar] [CrossRef]
21. D. P. Lund, J. Lindgren, J. Mikkola, and J. Salpakari, “Review of energy system flexibility measures to enable high levels of variable renewable electricity,” Renew. Sustain. Energ. Rev., vol. 45, pp. 785–807, 2015. doi: 10.1016/j.rser.2015.01.057. [Google Scholar] [CrossRef]
22. F. Hvelplund and S. Djørup, “Multilevel policies for radical transition: Governance for a 100% renewable energy system,” Environ. Plan. C: Politics Space, vol. 35, pp. 1218–1241, 2017. doi: 10.1177/2399654417710024. [Google Scholar] [CrossRef]
23. I. L. R. Gomes, H. M. I. Pousinho, R. Melício, and V. M. F. Mendes, “Stochastic coordination of joint wind and photovoltaic systems with energy storage in day-ahead market,” Energy, vol. 124, pp. 310–320, 2017. doi: 10.1016/j.energy.2017.02.080. [Google Scholar] [CrossRef]
24. W. Yunna and Z. Ting, “Risk assessment of offshore wave-wind-solar-compressed air energy storage power plant through fuzzy comprehensive evaluation model,” Energy, vol. 223, no. 5, 2021, Art. no. 120057. doi: 10.1016/j.energy.2021.120057. [Google Scholar] [CrossRef]
25. S. Wenjuan, G. Hua, and L. Peng, “Cooperative game theory based coordinated scheduling of two-machine flow-shop and transportation,” J. Syst. Sci. Complex., vol. 36, pp. 2415–2433, 2023. doi: 10.1007/s11424-023-2491-3. [Google Scholar] [CrossRef]
26. L. H. Li et al., “Risk aversion model and benefit distribution method for virtual power plants in the electricity market,” Electr. Power Constr., vol. 42, no. 1, pp. 67–75, 2021. [Google Scholar]
27. C. Weidong, W. Junnan, Y. Guanyi, C. Jiajia, and H. Yumeng, “Research on day-ahead transactions between multi-microgrid based on cooperative game model,” Appl. Energy, vol. 316, 2022, Art. no. 119106. doi: 10.1016/j.apenergy.2022.119106. [Google Scholar] [CrossRef]
28. W. Xuejie, L. Bingkang, and W. Yuwei, “A bargaining game-based profit allocation method for the wind-hydrogen-storage combined system,” Appl. Energy, vol. 310, 2022, Art. no. 118472. doi: 10.1016/j.apenergy.2021.118472. [Google Scholar] [CrossRef]
29. J. Liwei et al., “Nearly-zero carbon optimal operation model and benefit allocation strategy for a novel virtual power plant using carbon capture, power-to-gas, and waste incineration power in rural areas,” Appl. Energy, vol. 310, 2022, Art. no. 118618. doi: 10.1016/j.apenergy.2022.118618. [Google Scholar] [CrossRef]
30. T. Qin et al., “Benefit distribution model for distributed energy cooperation based on bargaining game theory,” Electr. Power Autom. Equip., vol. 39, no. 1, pp. 134–140, 2019. [Google Scholar]
31. J. Jurasz and B. Ciapała, “Solar-hydro hybrid power station as a way to smooth power output and increase water retention,” Solar Energy, vol. 174, no. 2, pp. 675–690, 2018. doi: 10.1016/j.solener.2018.07.087. [Google Scholar] [CrossRef]
32. H. Guo, Q. Chen, Y. Gu, M. Shahidehpour, Q. Xia and C. Kang, “A data-driven pattern extraction method for analyzing bidding behaviors in power markets,” IEEE Trans. Smart Grid, vol. 11, no. 4, pp. 3509–3521, Jul. 2020. doi: 10.1109/TSG.2019.2962842. [Google Scholar] [CrossRef]
Appendix A
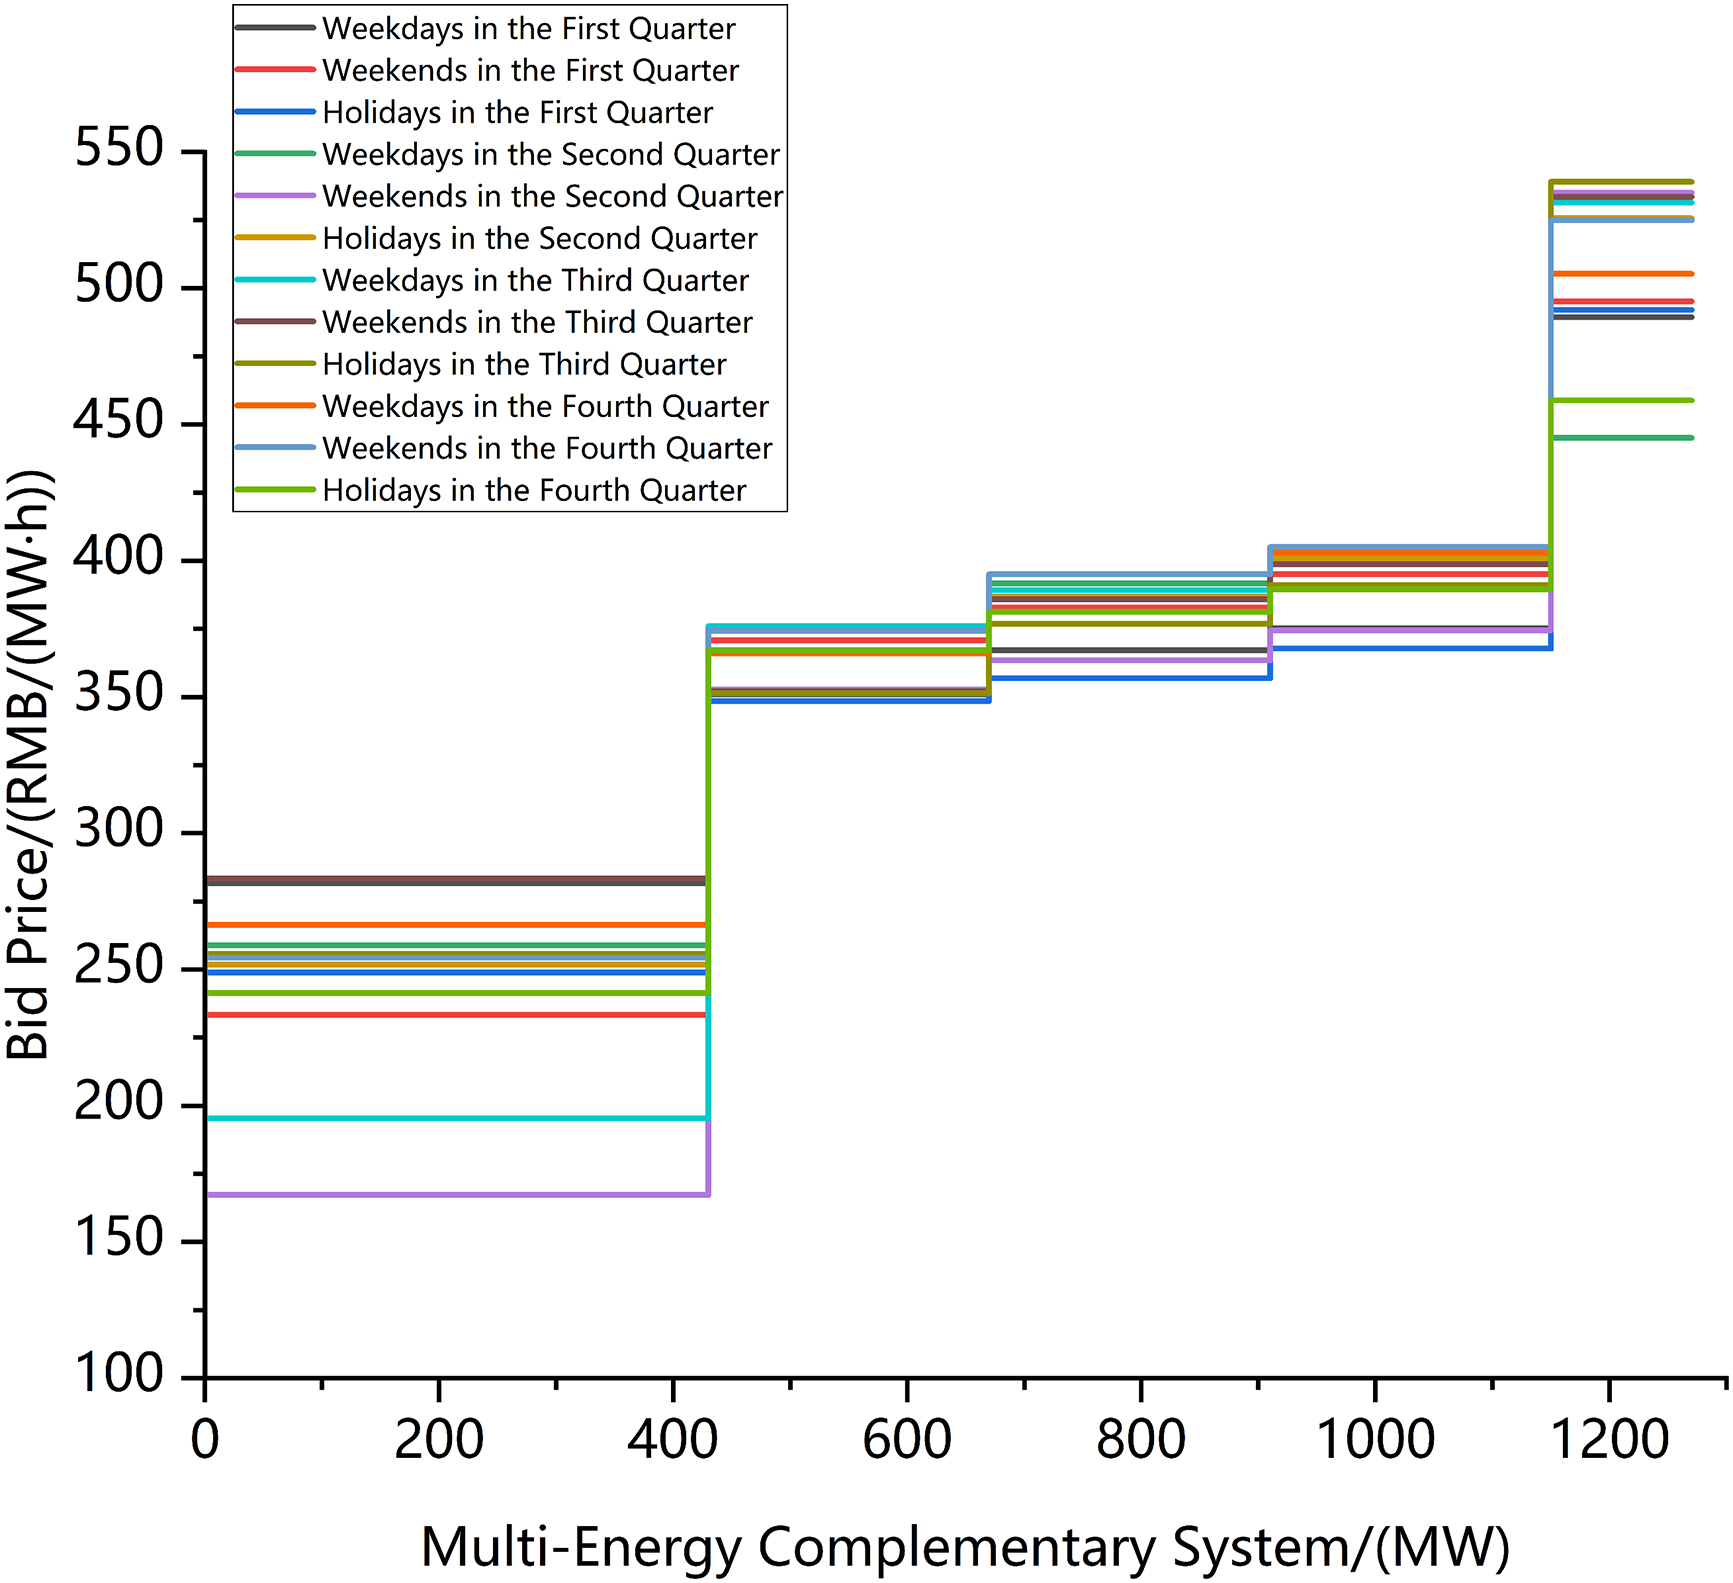
Figure A1: Multi-energy complementary system bid prices
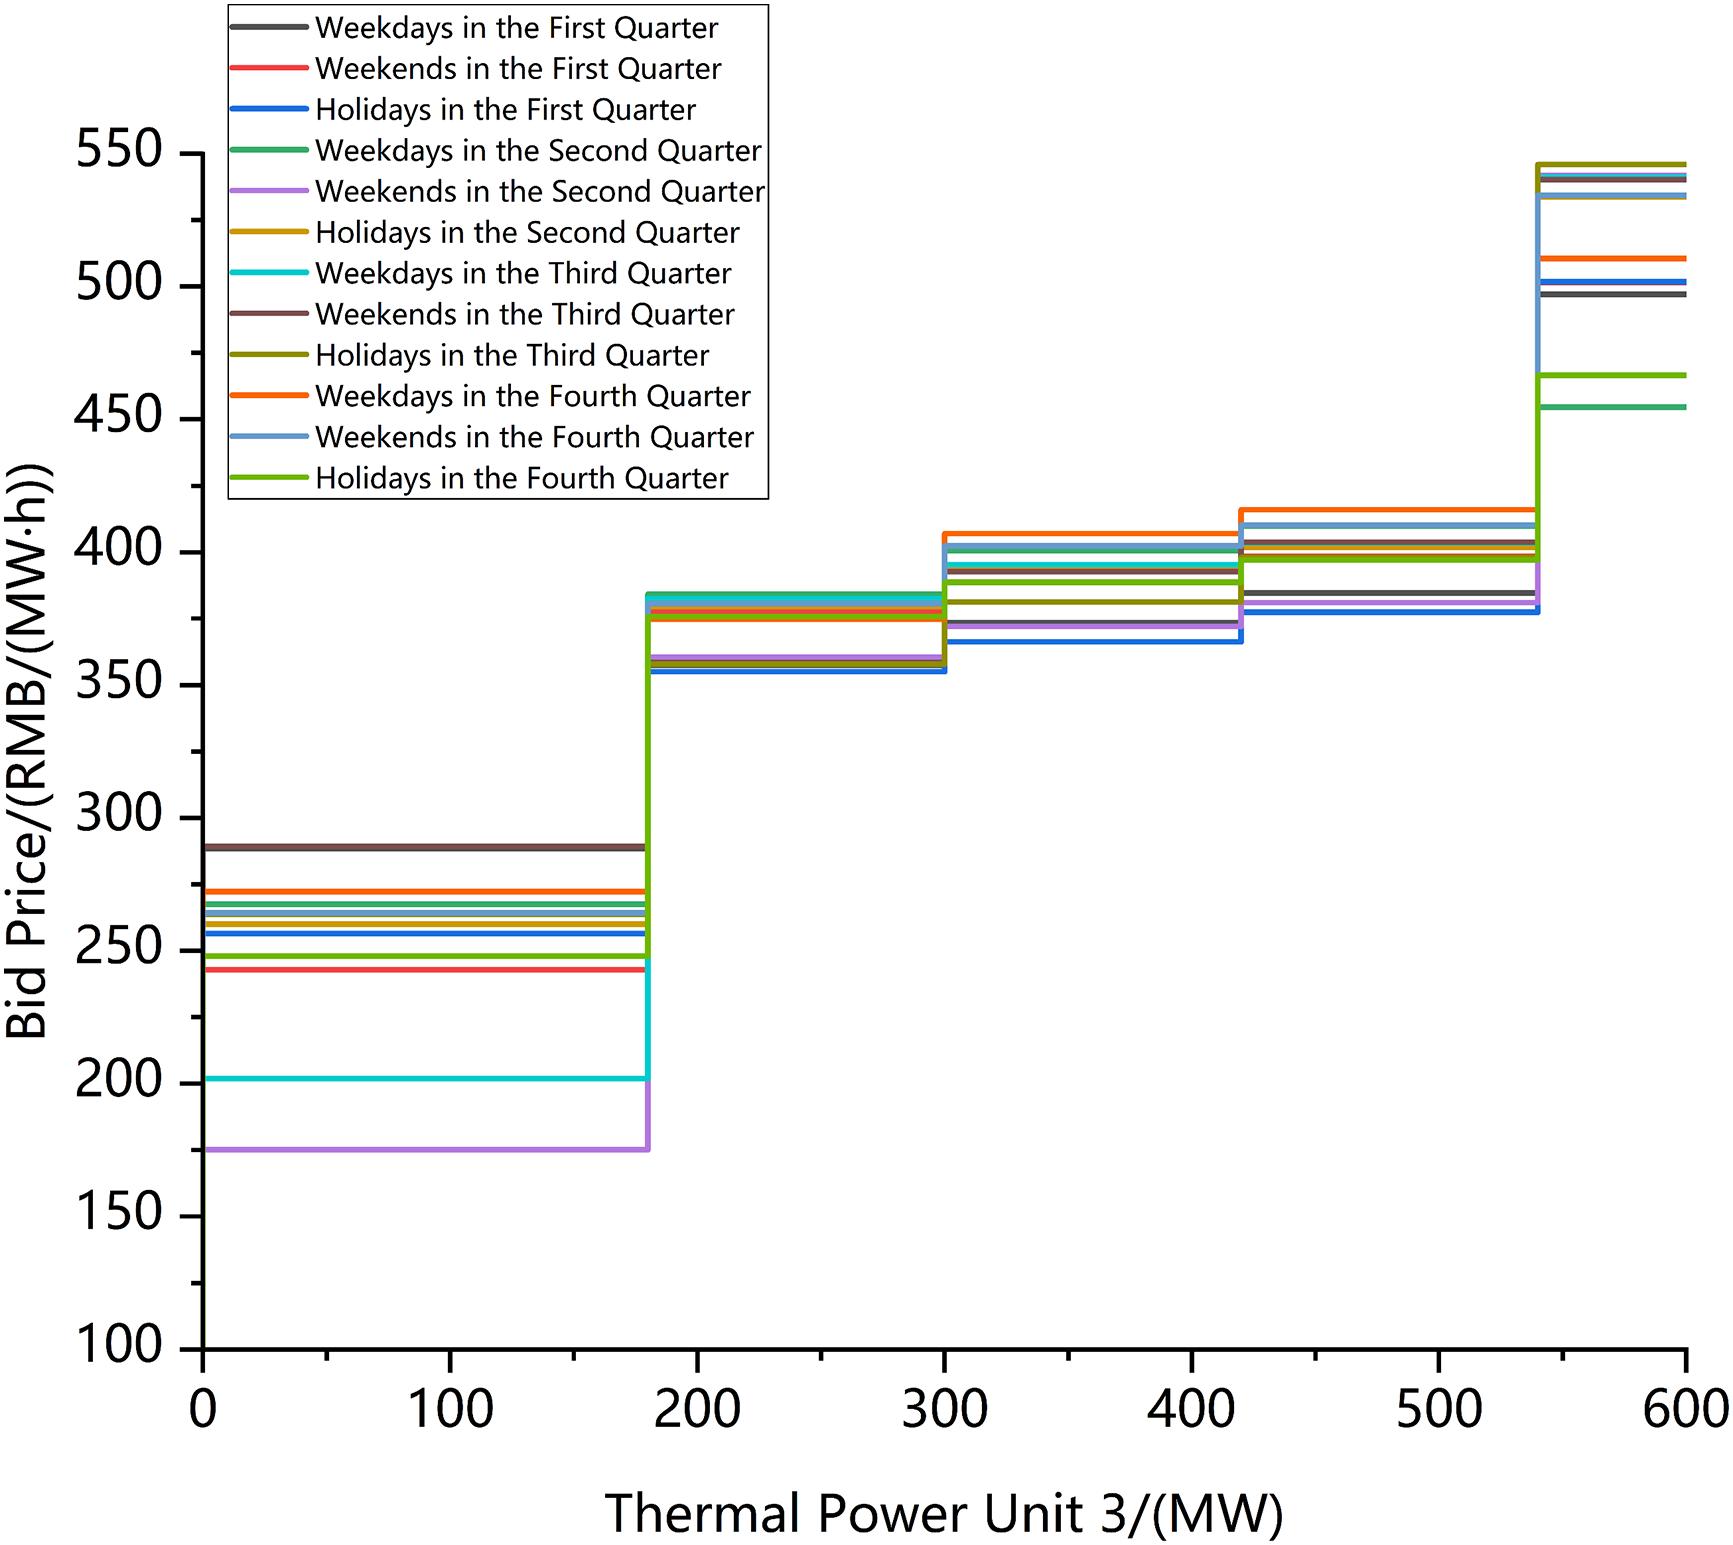
Figure A2: 600 MW unit 1 bid prices
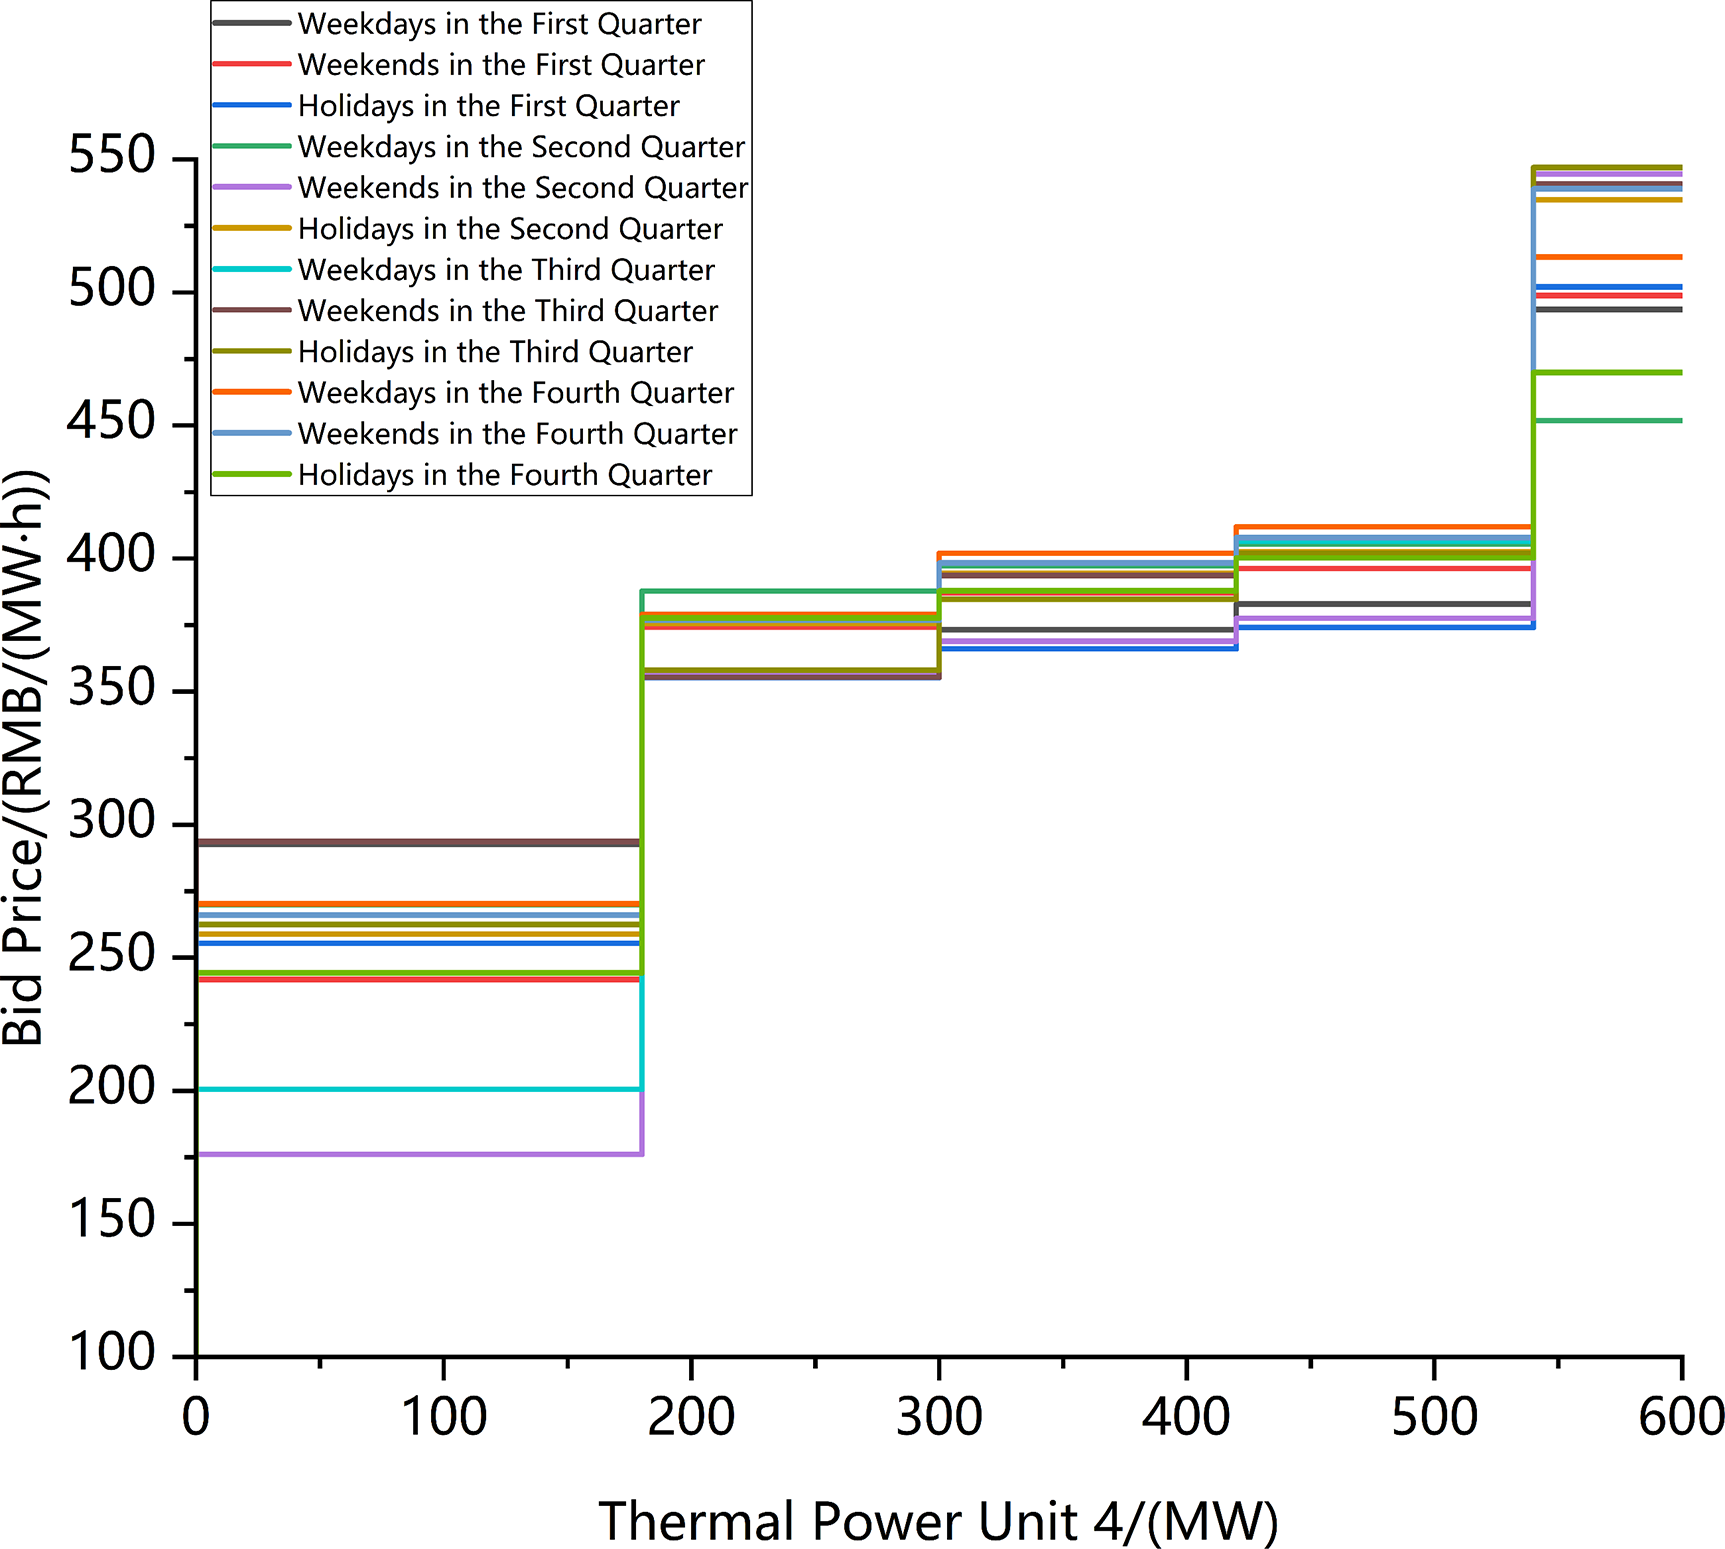
Figure A3: 600 MW unit 2 bid prices
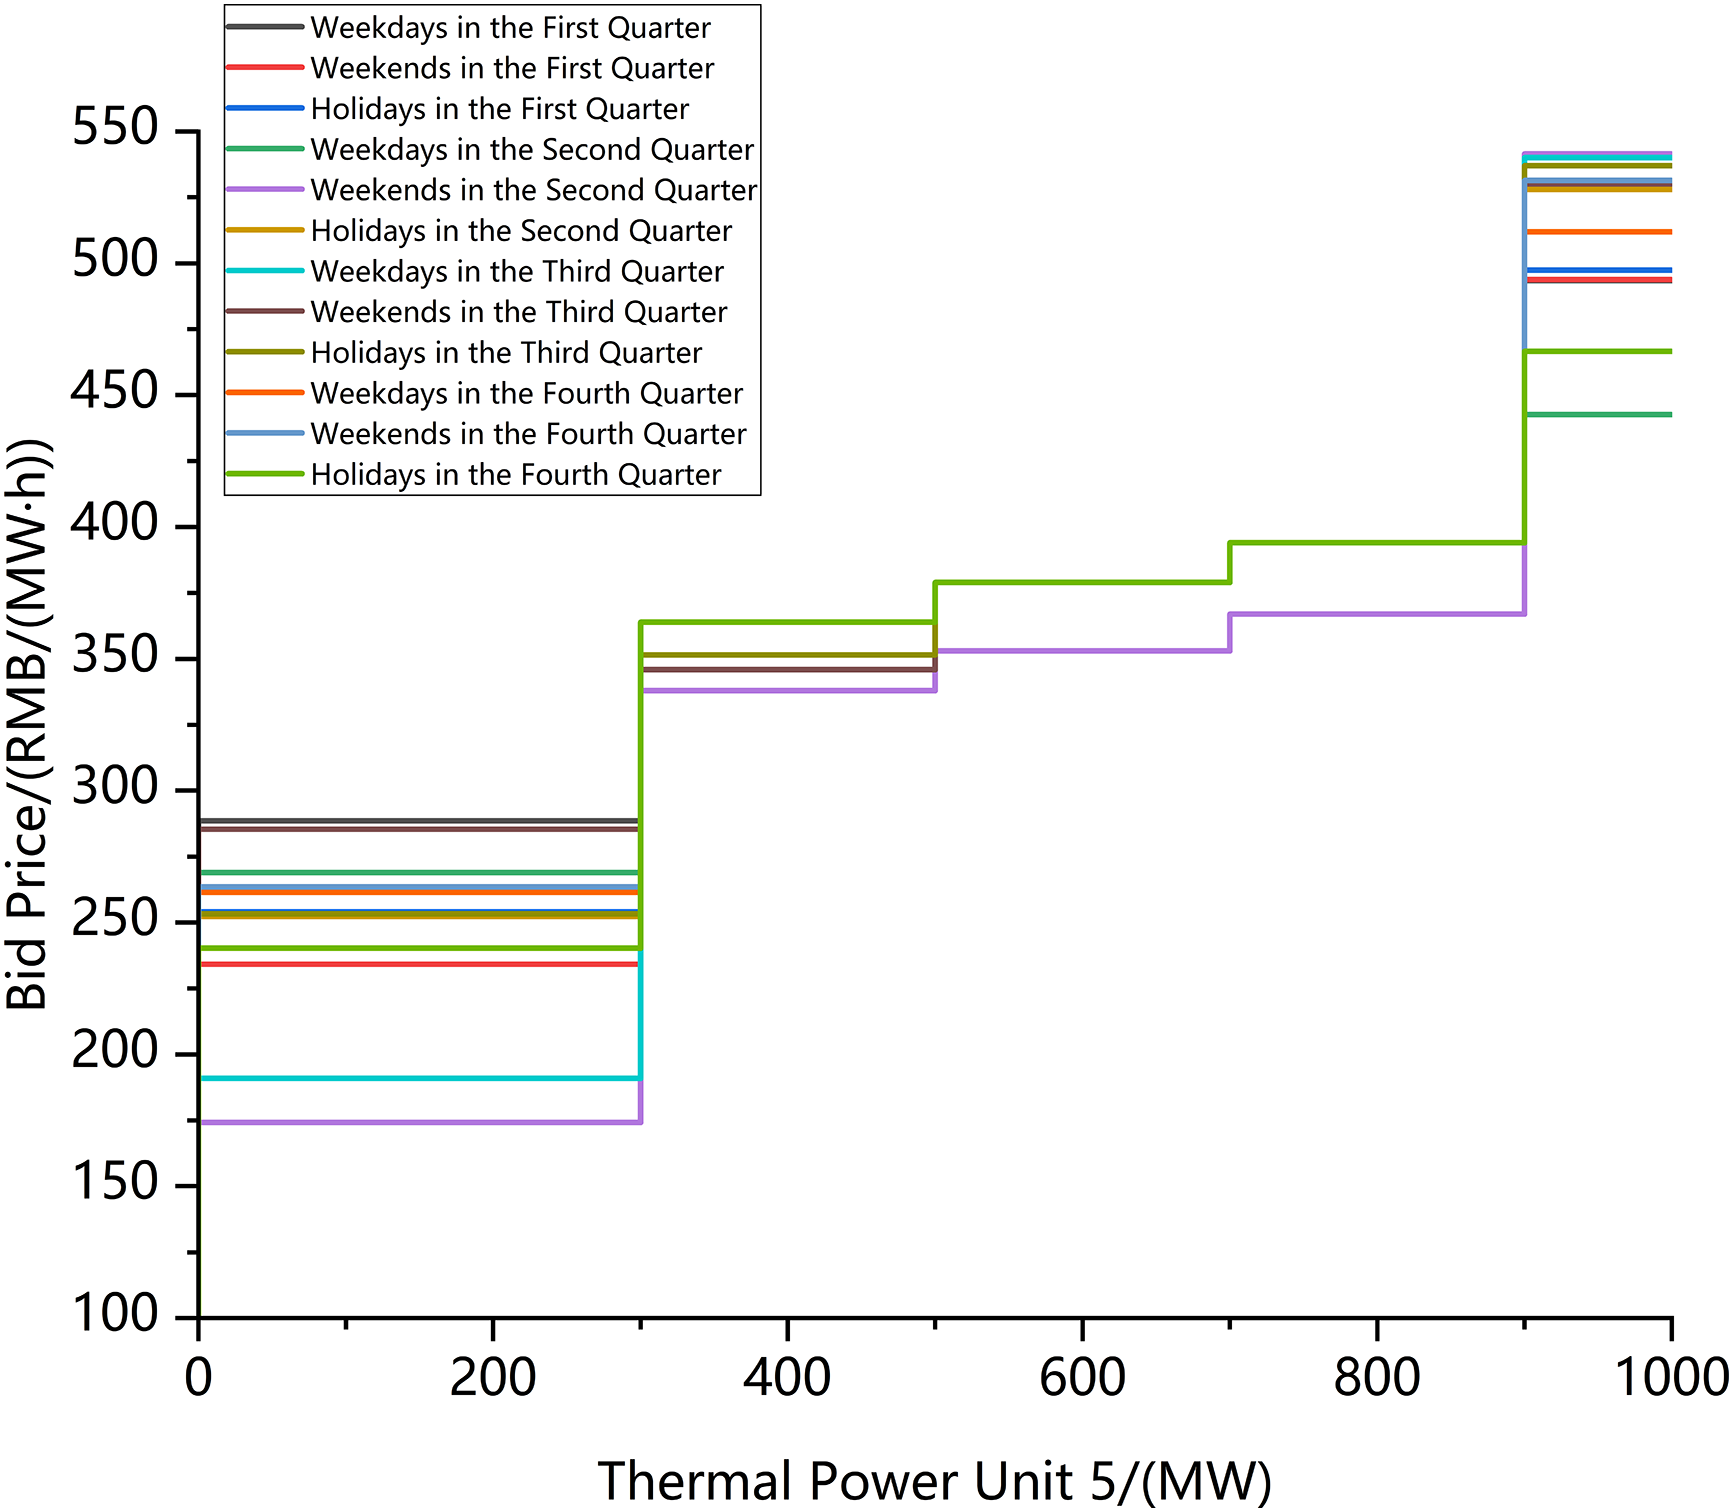
Figure A4: 1000 MW unit bid prices
Appendix B
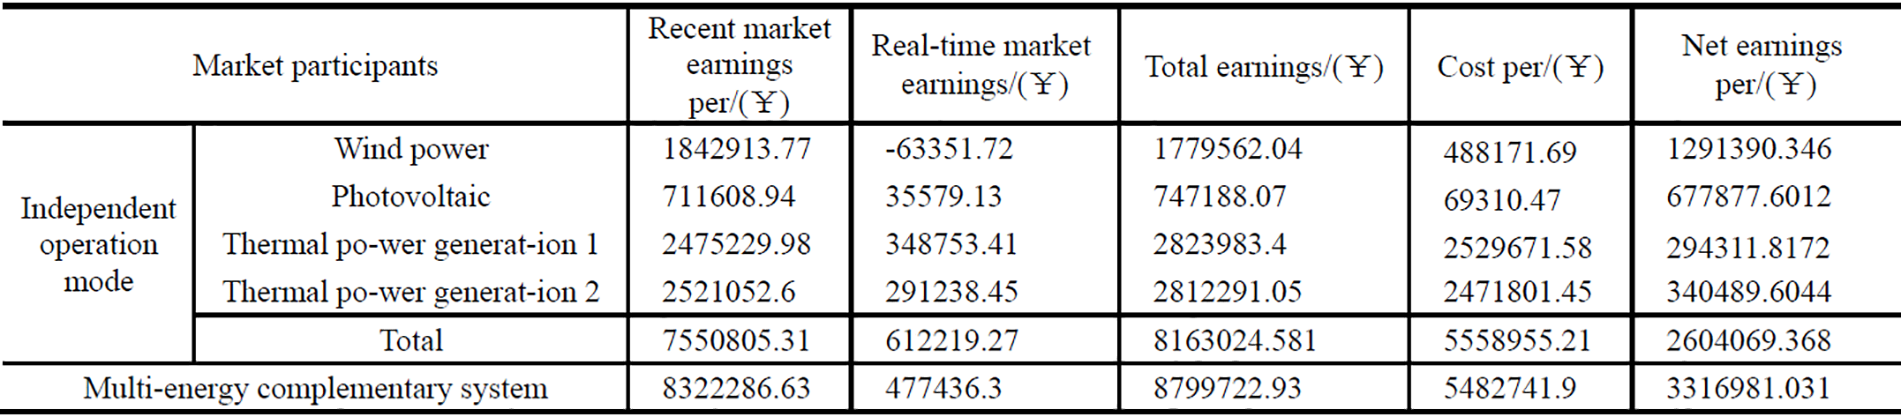
Figure A5: Revenue analysis of multi-energy complementary systems vs. independent participants on weekdays in the first quarter
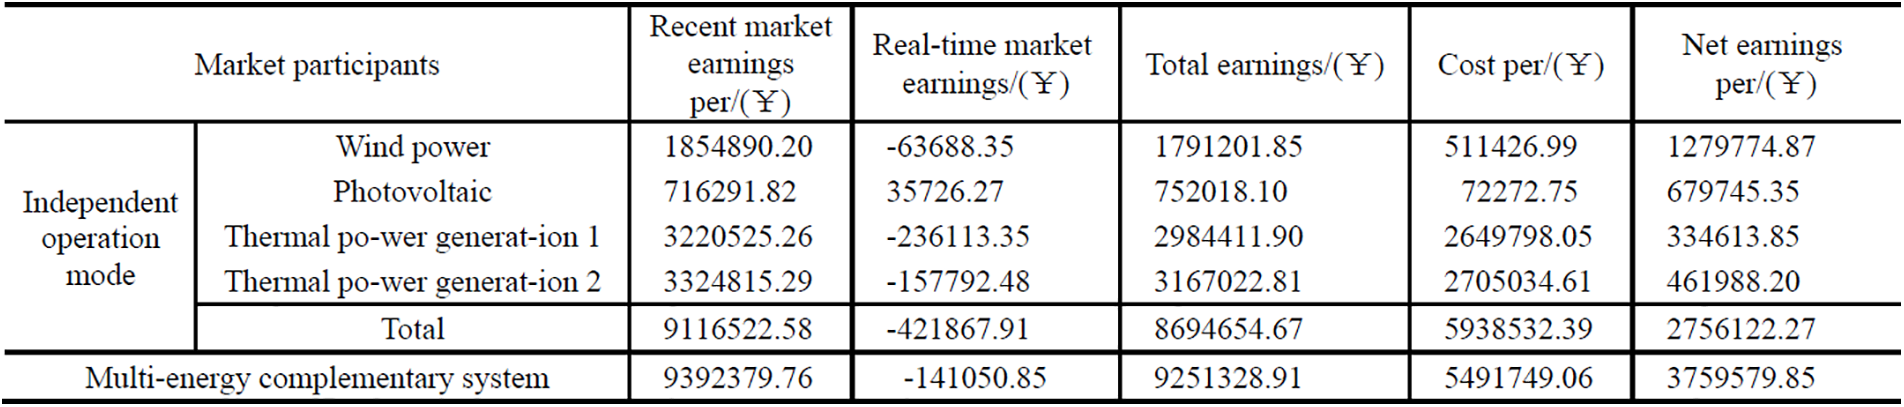
Figure A6: Revenue analysis of multi-energy complementary systems vs. independent participants on weekends in the first quarter
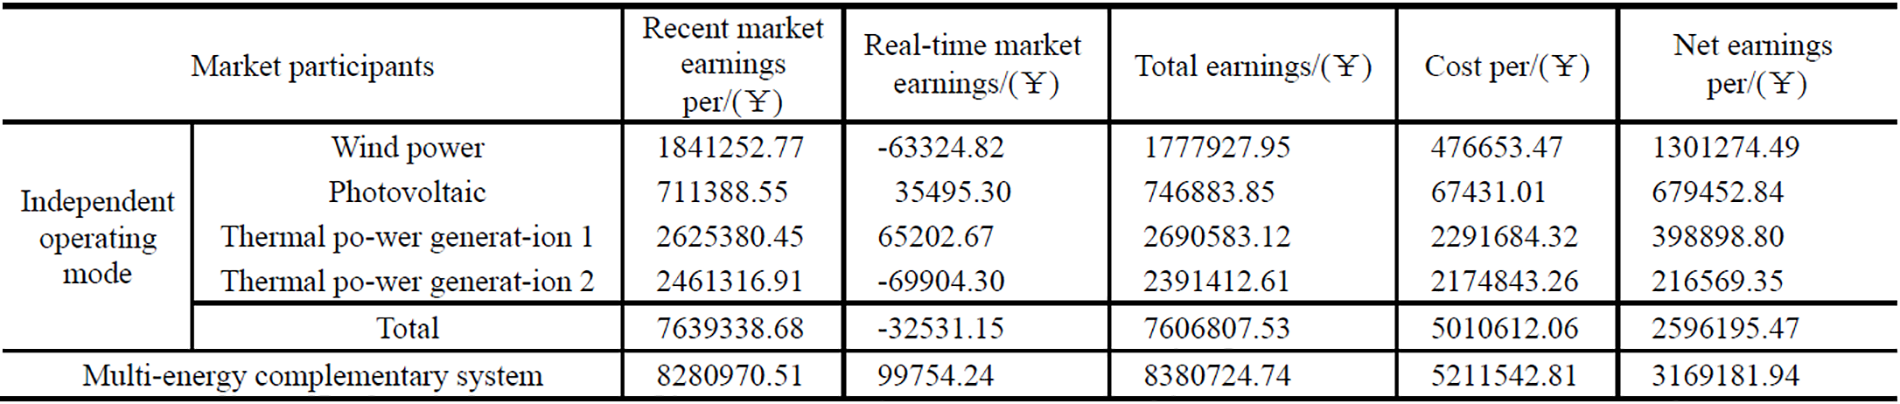
Figure A7: Revenue analysis of multi-energy complementary systems vs. independent participants on holidays in the first quarter
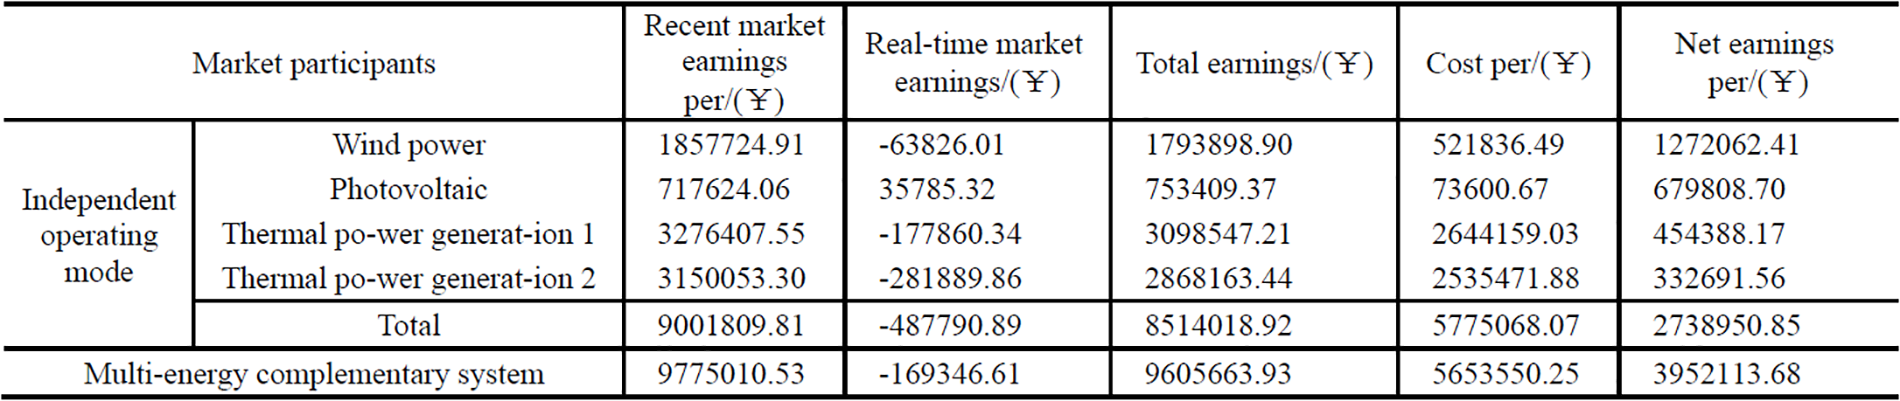
Figure A8: Revenue analysis of multi-energy complementary systems vs. independent participants on weekdays in the second quarter
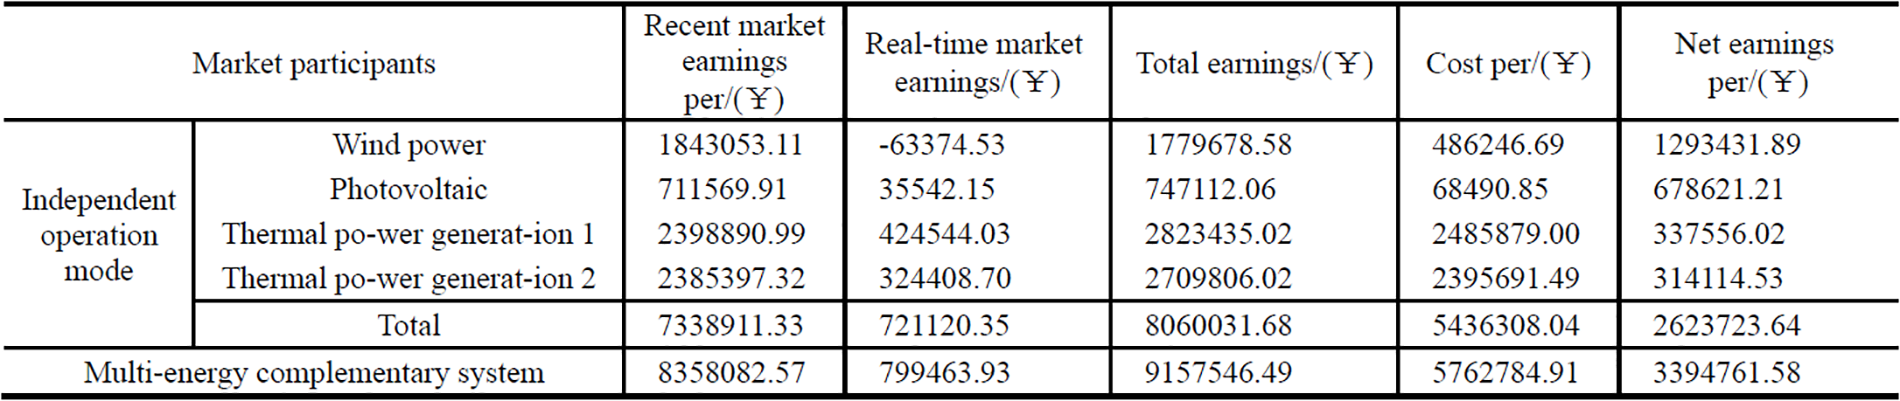
Figure A9: Revenue analysis of multi-energy complementary systems vs. independent participants on weekends in the second quarter
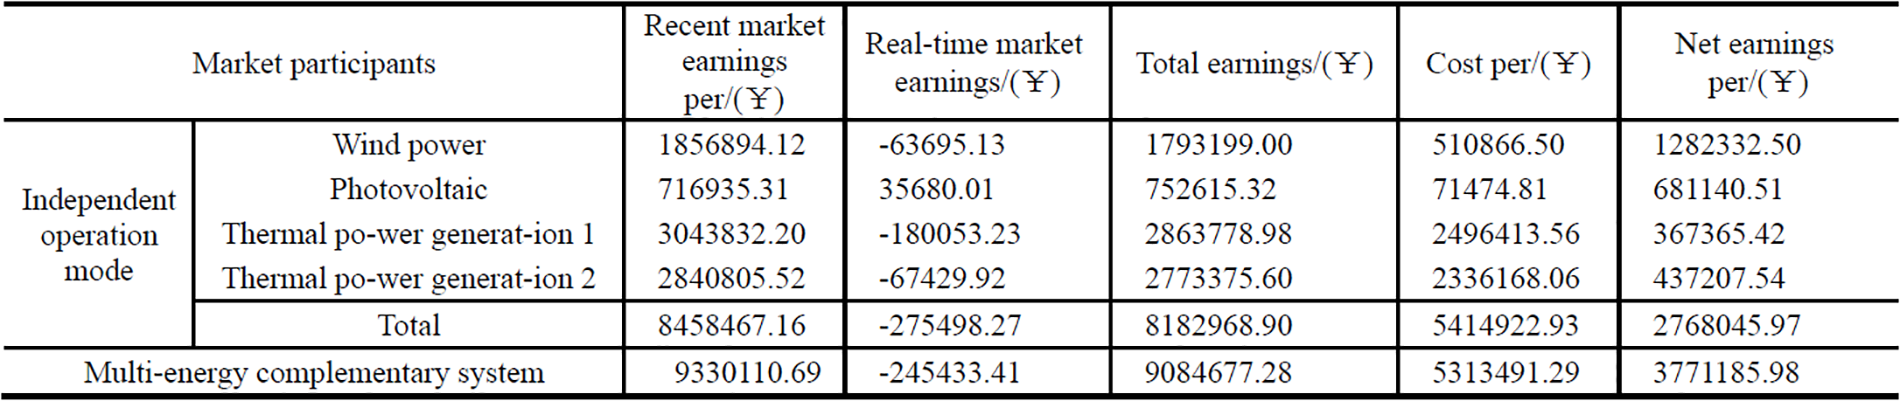
Figure A10: Revenue analysis of multi-energy complementary systems vs. independent participants on holidays in the second quarter
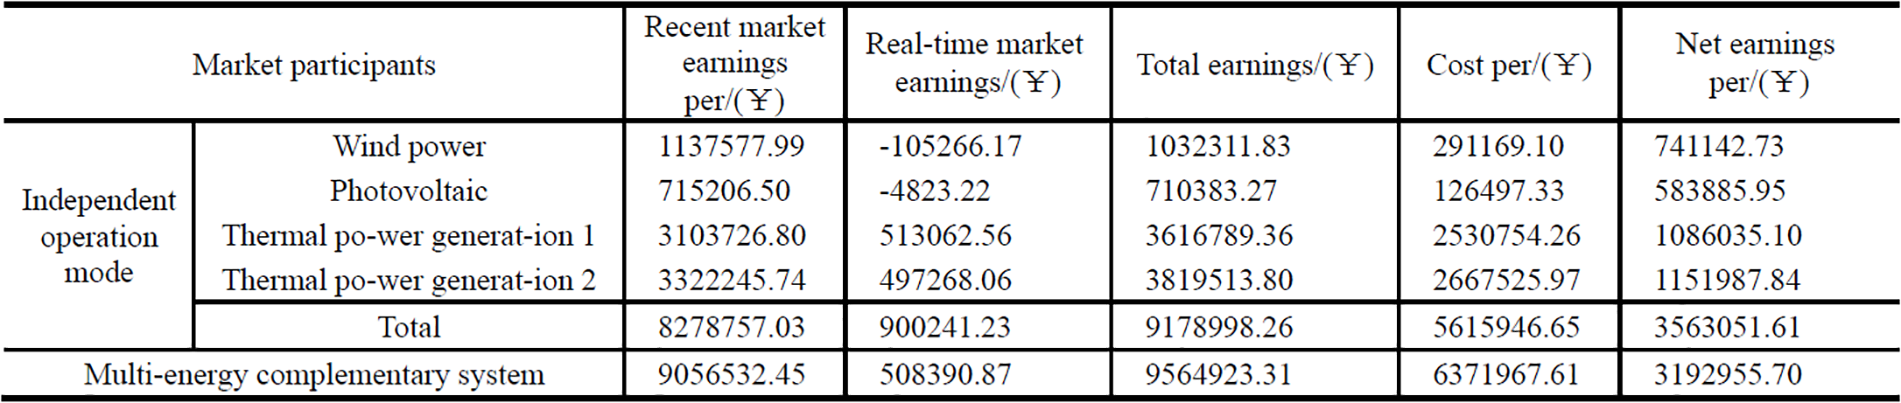
Figure A11: Revenue analysis of multi-energy complementary systems vs. independent participants on weekdays in the third quarter
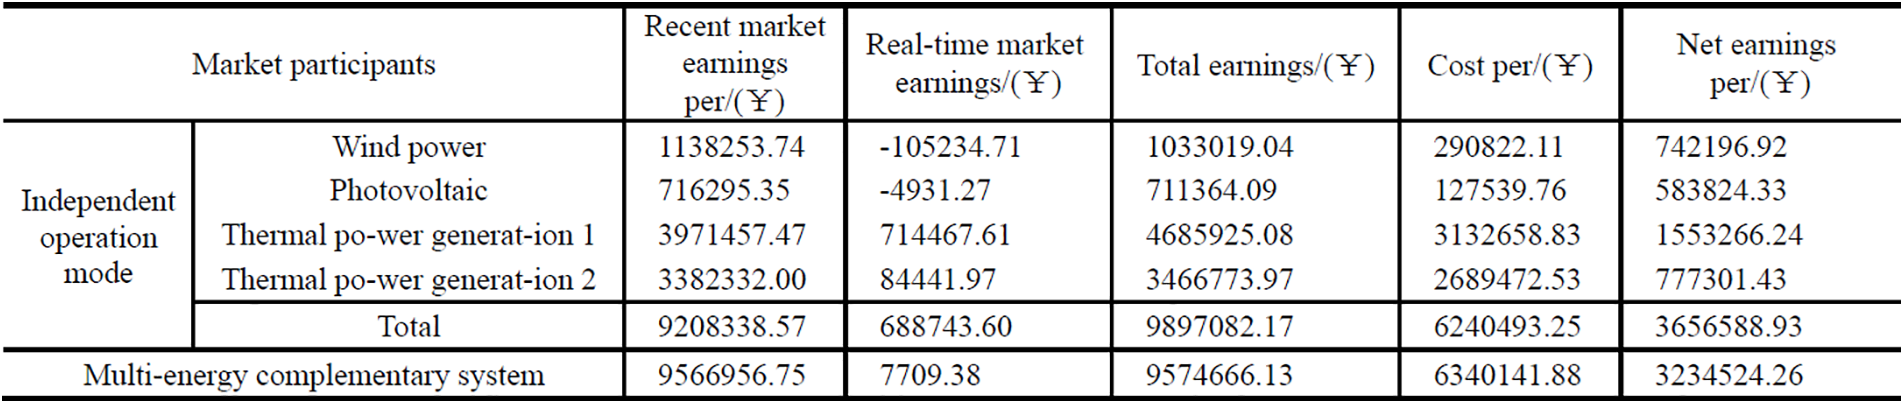
Figure A12: Revenue analysis of multi-energy complementary systems vs. independent participants on weekends in the third quarter
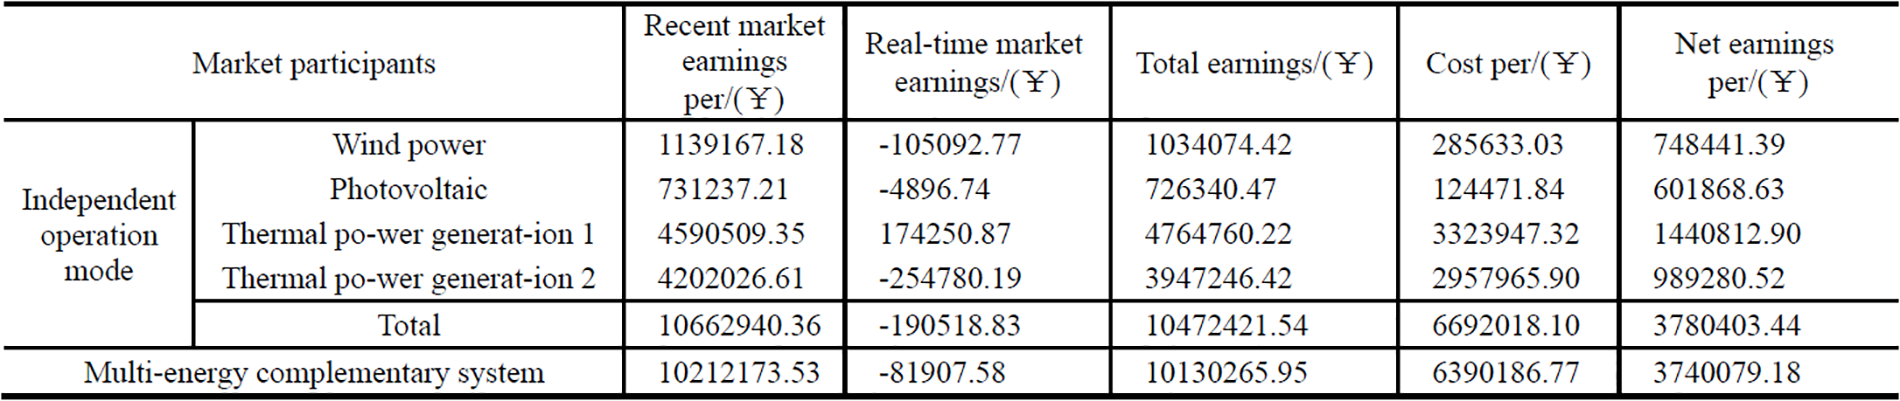
Figure A13: Revenue analysis of multi-energy complementary systems vs. independent participants on holidays in the third quarter
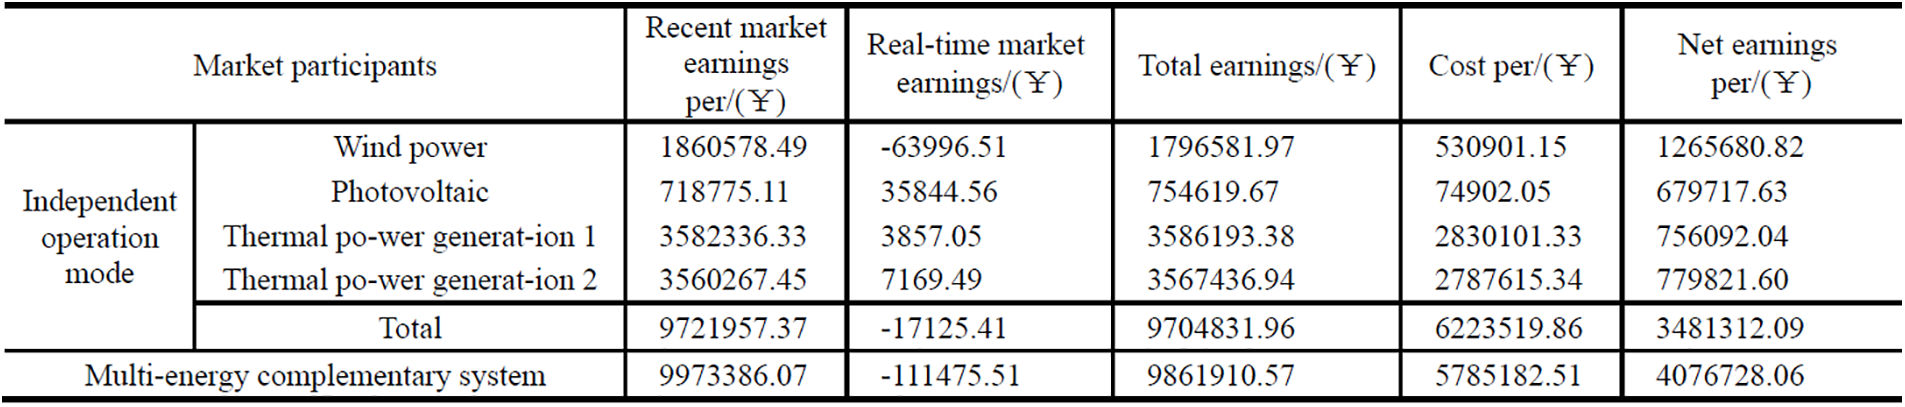
Figure A14: Revenue analysis of multi-energy complementary systems vs. independent participants on weekdays in the fourth quarter

Figure A15: Revenue analysis of multi-energy complementary systems vs. independent participants on weekends in the fourth quarter
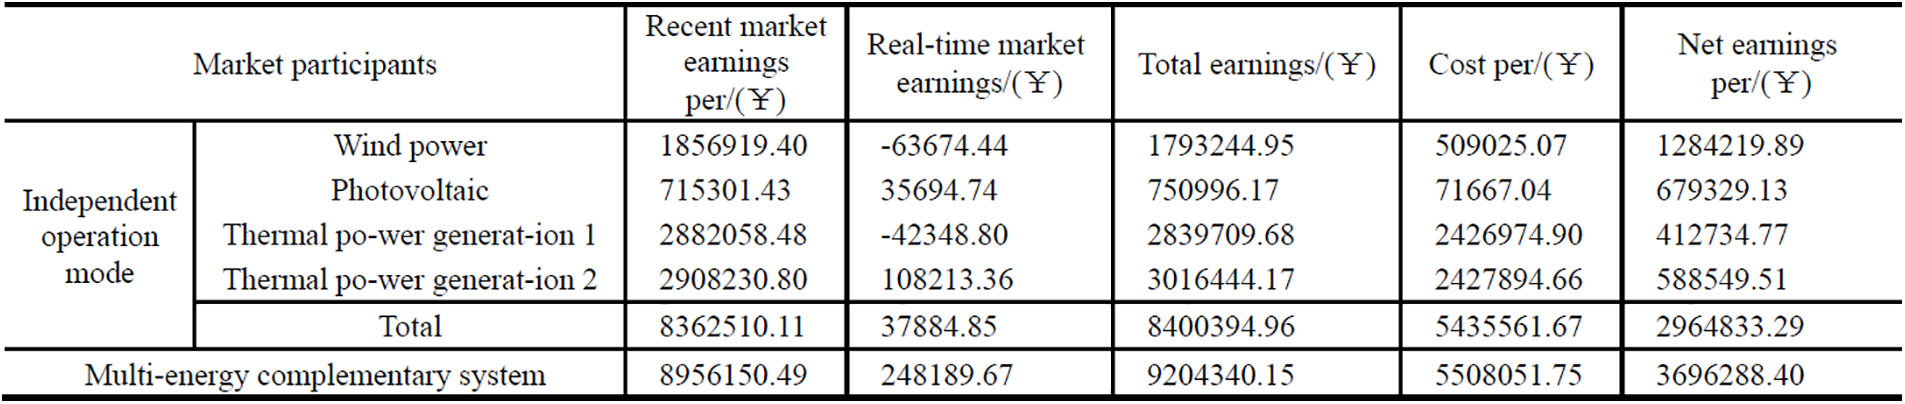
Figure A16: Revenue analysis of multi-energy complementary systems vs. independent participants on holidays in the fourth quarter
Appendix C
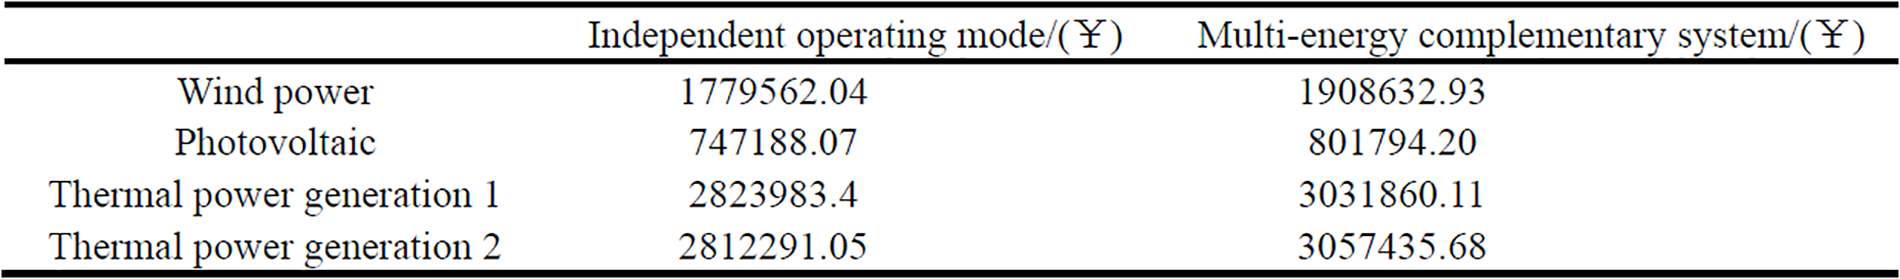
Figure A17: Final revenue distribution results among participants in multi-energy complementary systems on weekdays in the first quarter
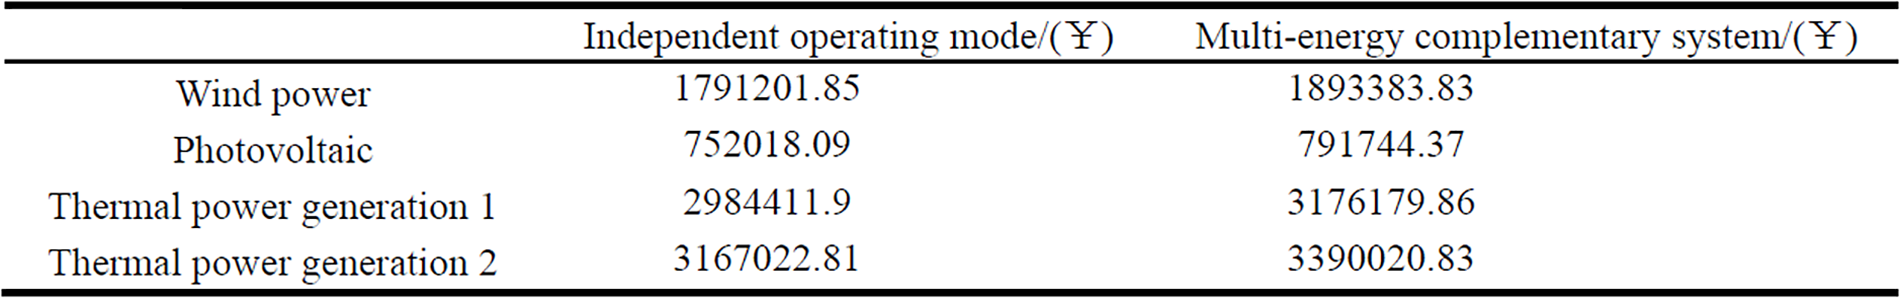
Figure A18: Final revenue distribution results among participants in multi-energy complementary systems on weekends in the first quarter
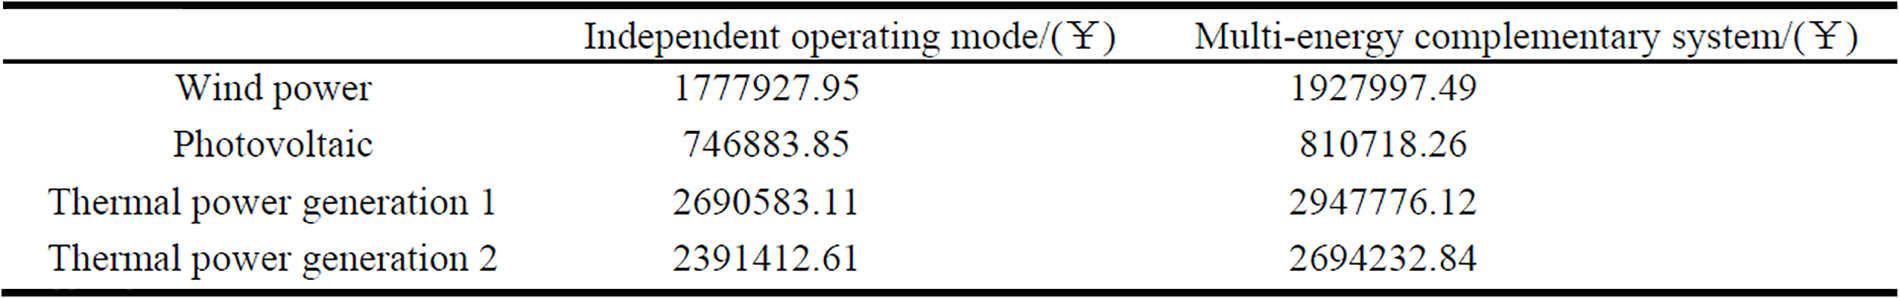
Figure A19: Final revenue distribution results among participants in multi-energy complementary systems on holidays in the first quarter
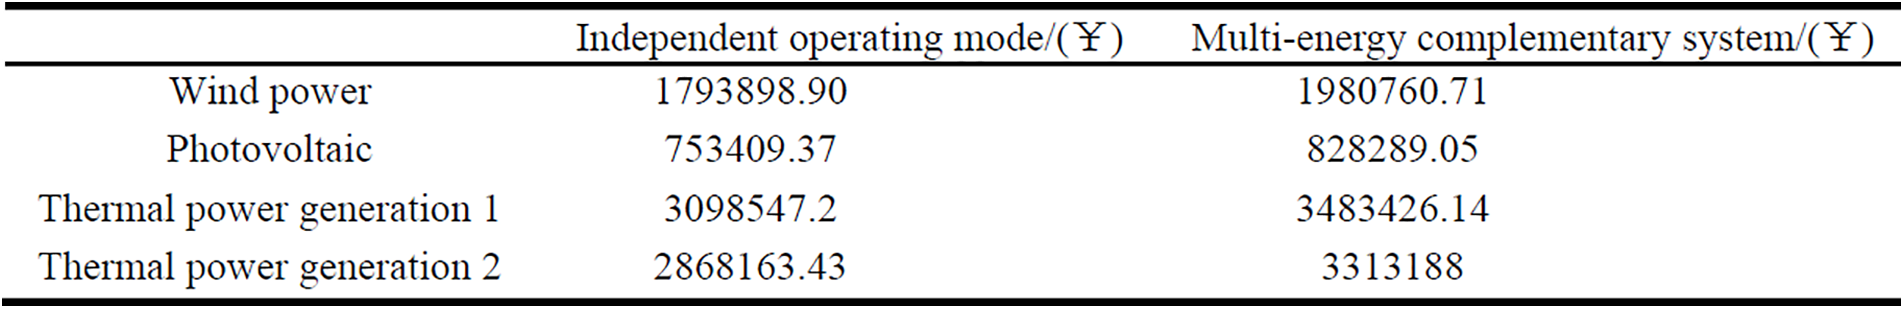
Figure A20: Final revenue distribution results among participants in multi-energy complementary systems on weekdays in the second quarter
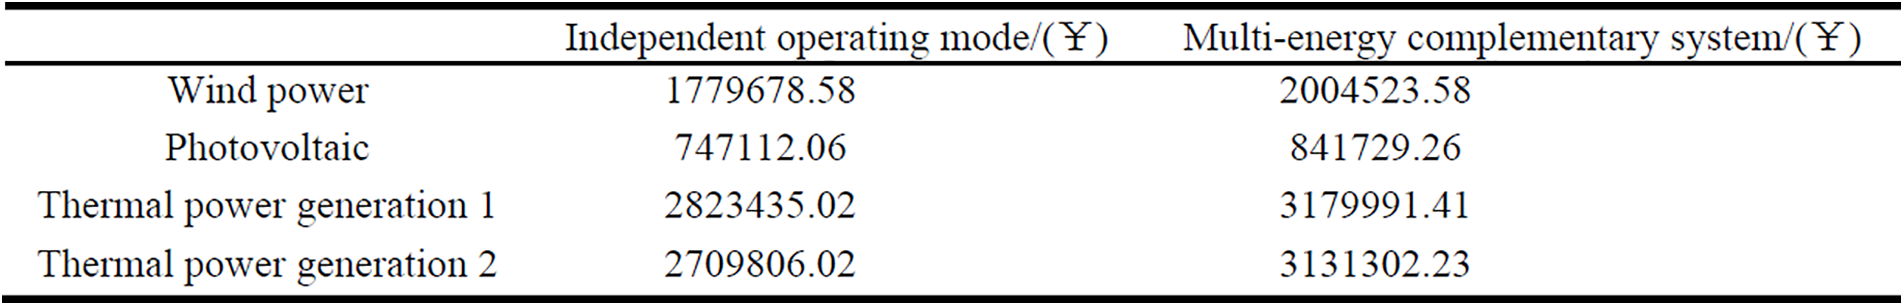
Figure A21: Final revenue distribution results among participants in multi-energy complementary systems on weekends in the second quarter
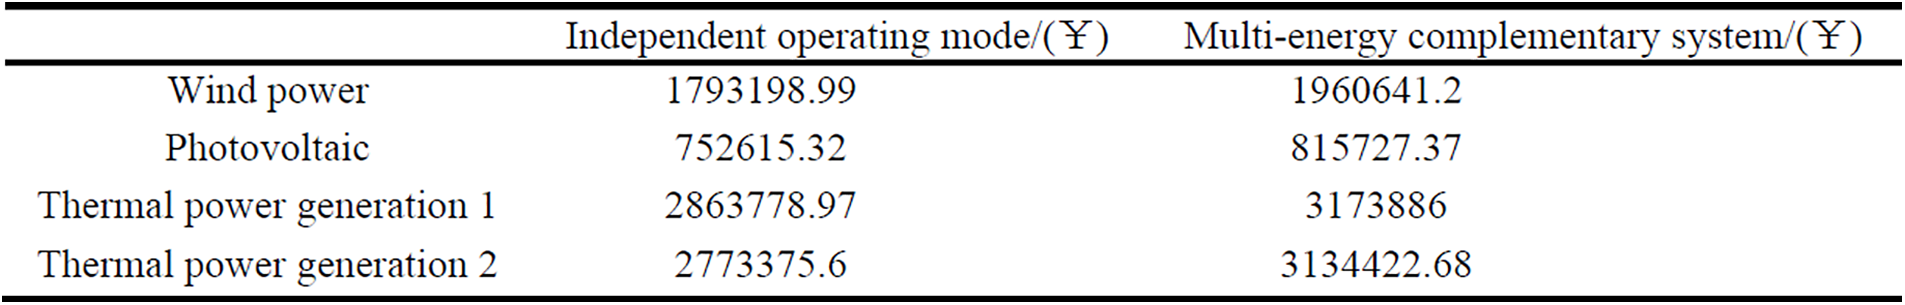
Figure A22: Final revenue distribution results among participants in multi-energy complementary systems on holidays in the second quarter
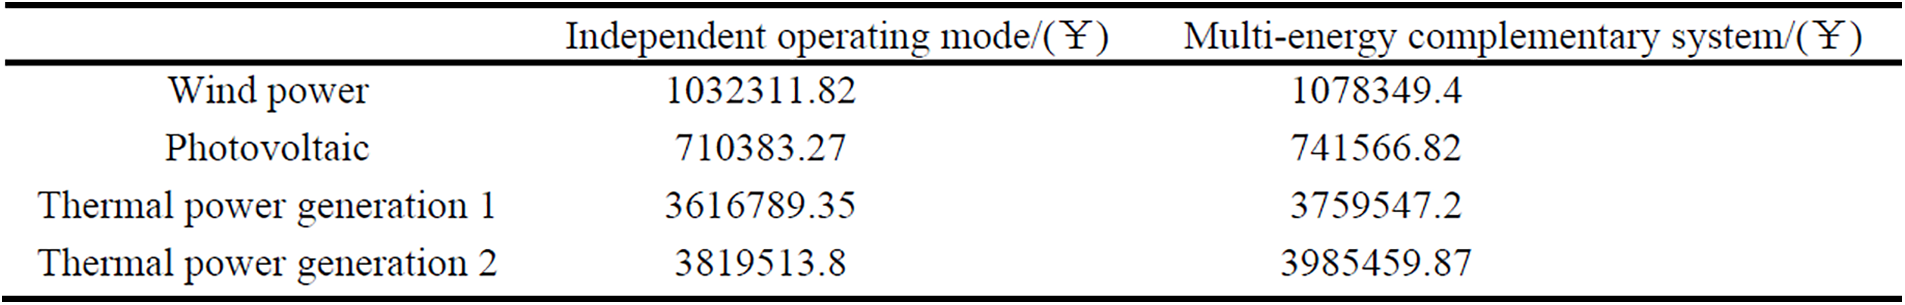
Figure A23: Final revenue distribution results among participants in multi-energy complementary systems on weekdays in the third quarter
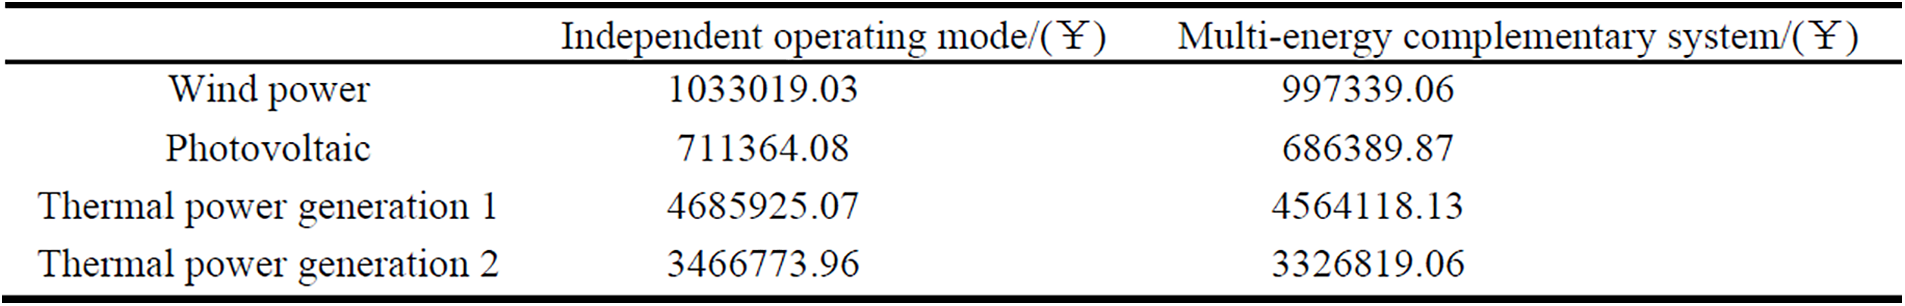
Figure A24: Final revenue distribution results among participants in multi-energy complementary systems on weekends in the third quarter
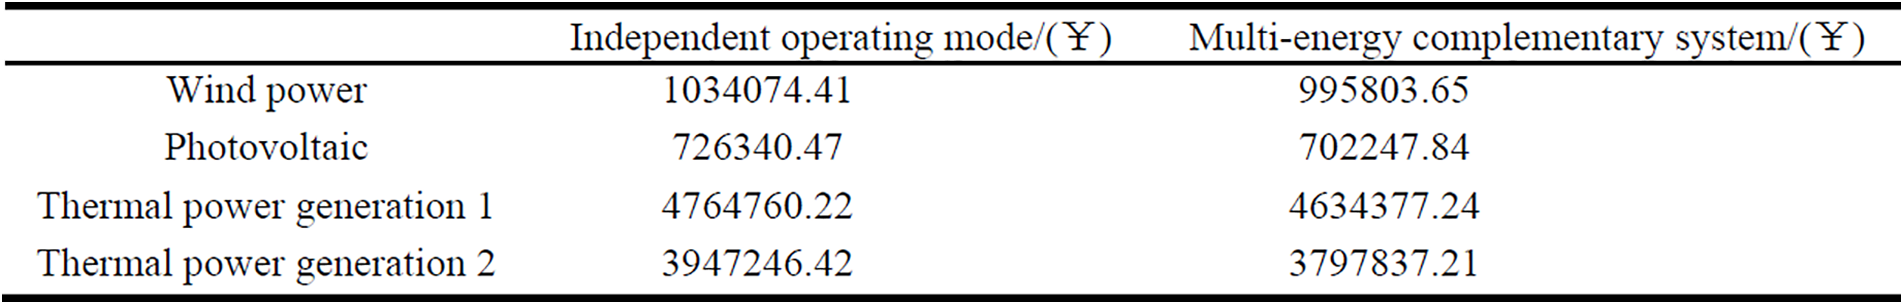
Figure A25: Final revenue distribution results among participants in multi-energy complementary systems on holidays in the third quarter
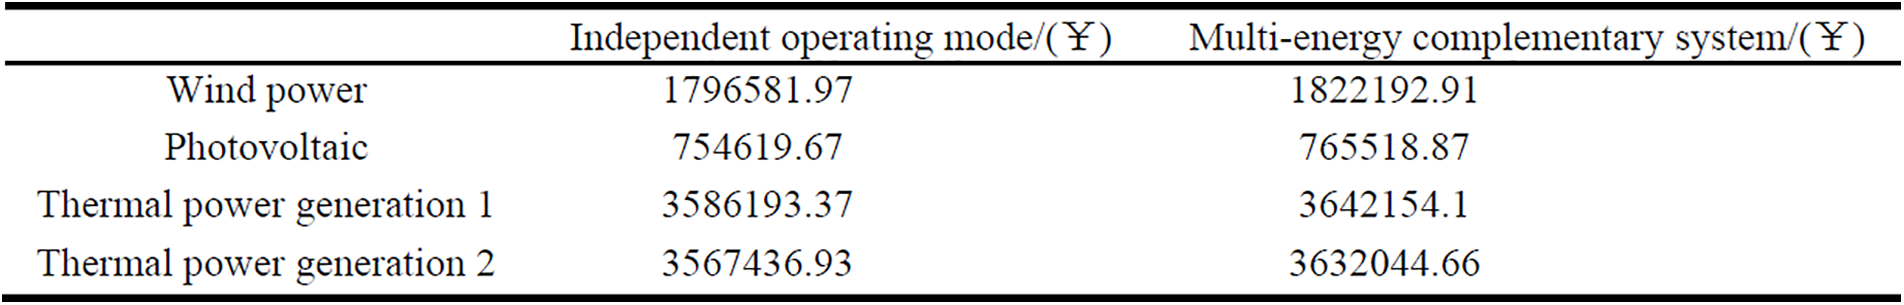
Figure A26: Final revenue distribution results among participants in multi-energy complementary systems on weekdays in the fourth quarter
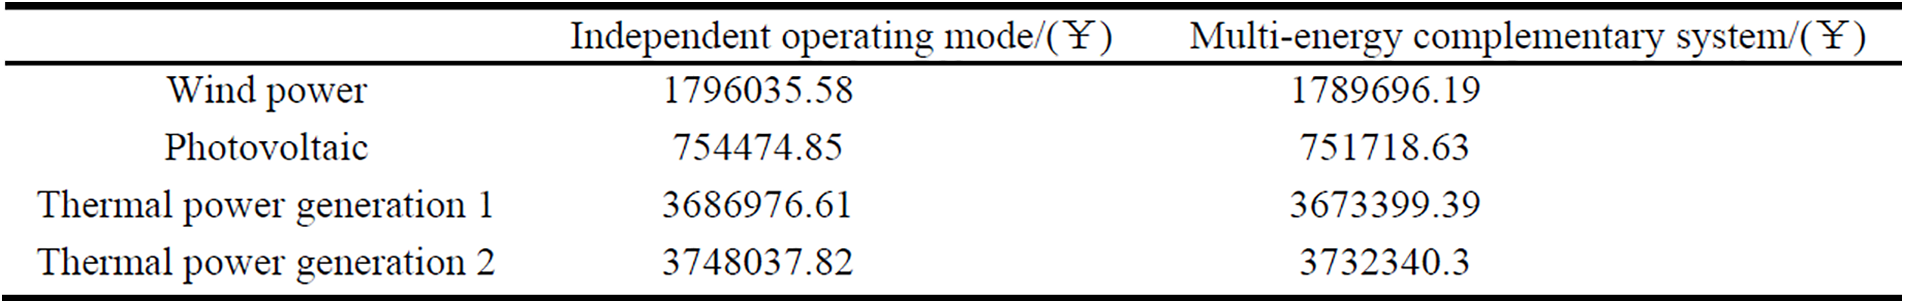
Figure A27: Final revenue distribution results among participants in multi-energy complementary systems on weekends in the fourth quarter
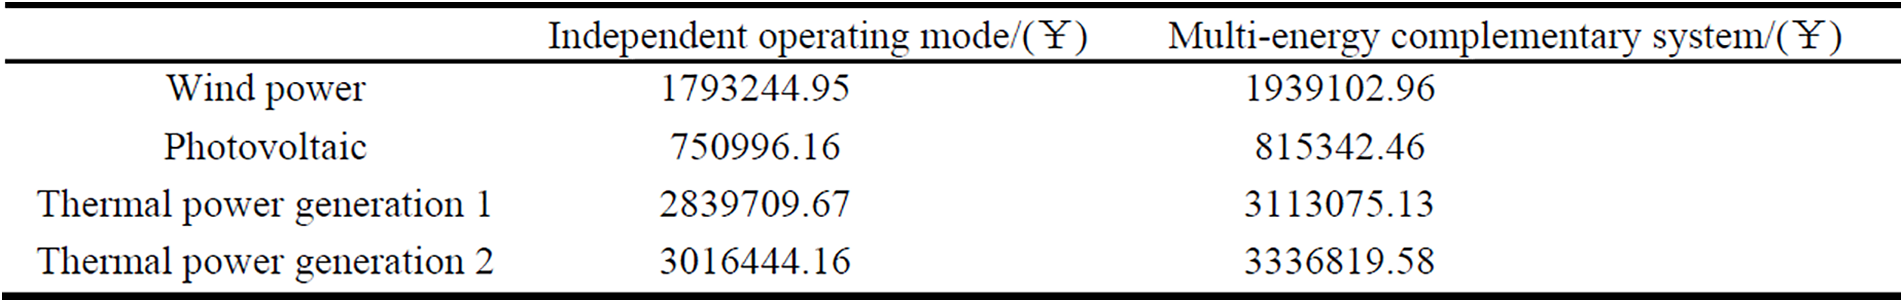
Figure A28: Final revenue distribution results among participants in multi-energy complementary systems on holidays in the fourth quarter
Cite This Article
 Copyright © 2025 The Author(s). Published by Tech Science Press.
This work is licensed under a Creative Commons Attribution 4.0 International License , which permits unrestricted use, distribution, and reproduction in any medium, provided the original work is properly cited.
 Downloads
 Citation Tools