 Open Access
ARTICLE
Bilevel Optimal Scheduling of Island Integrated Energy System Considering Multifactor Pricing
School of Automation and Electrical Engineering, Inner Mongolia University of Science and Technology, Baotou, 014010, China
* Corresponding Author: Xin Zhang. Email:
Energy Engineering 2025, 122(1), 349-378. https://doi.org/10.32604/ee.2024.057676
Received 24 August 2024; Accepted 16 October 2024; Issue published 27 December 2024
Abstract
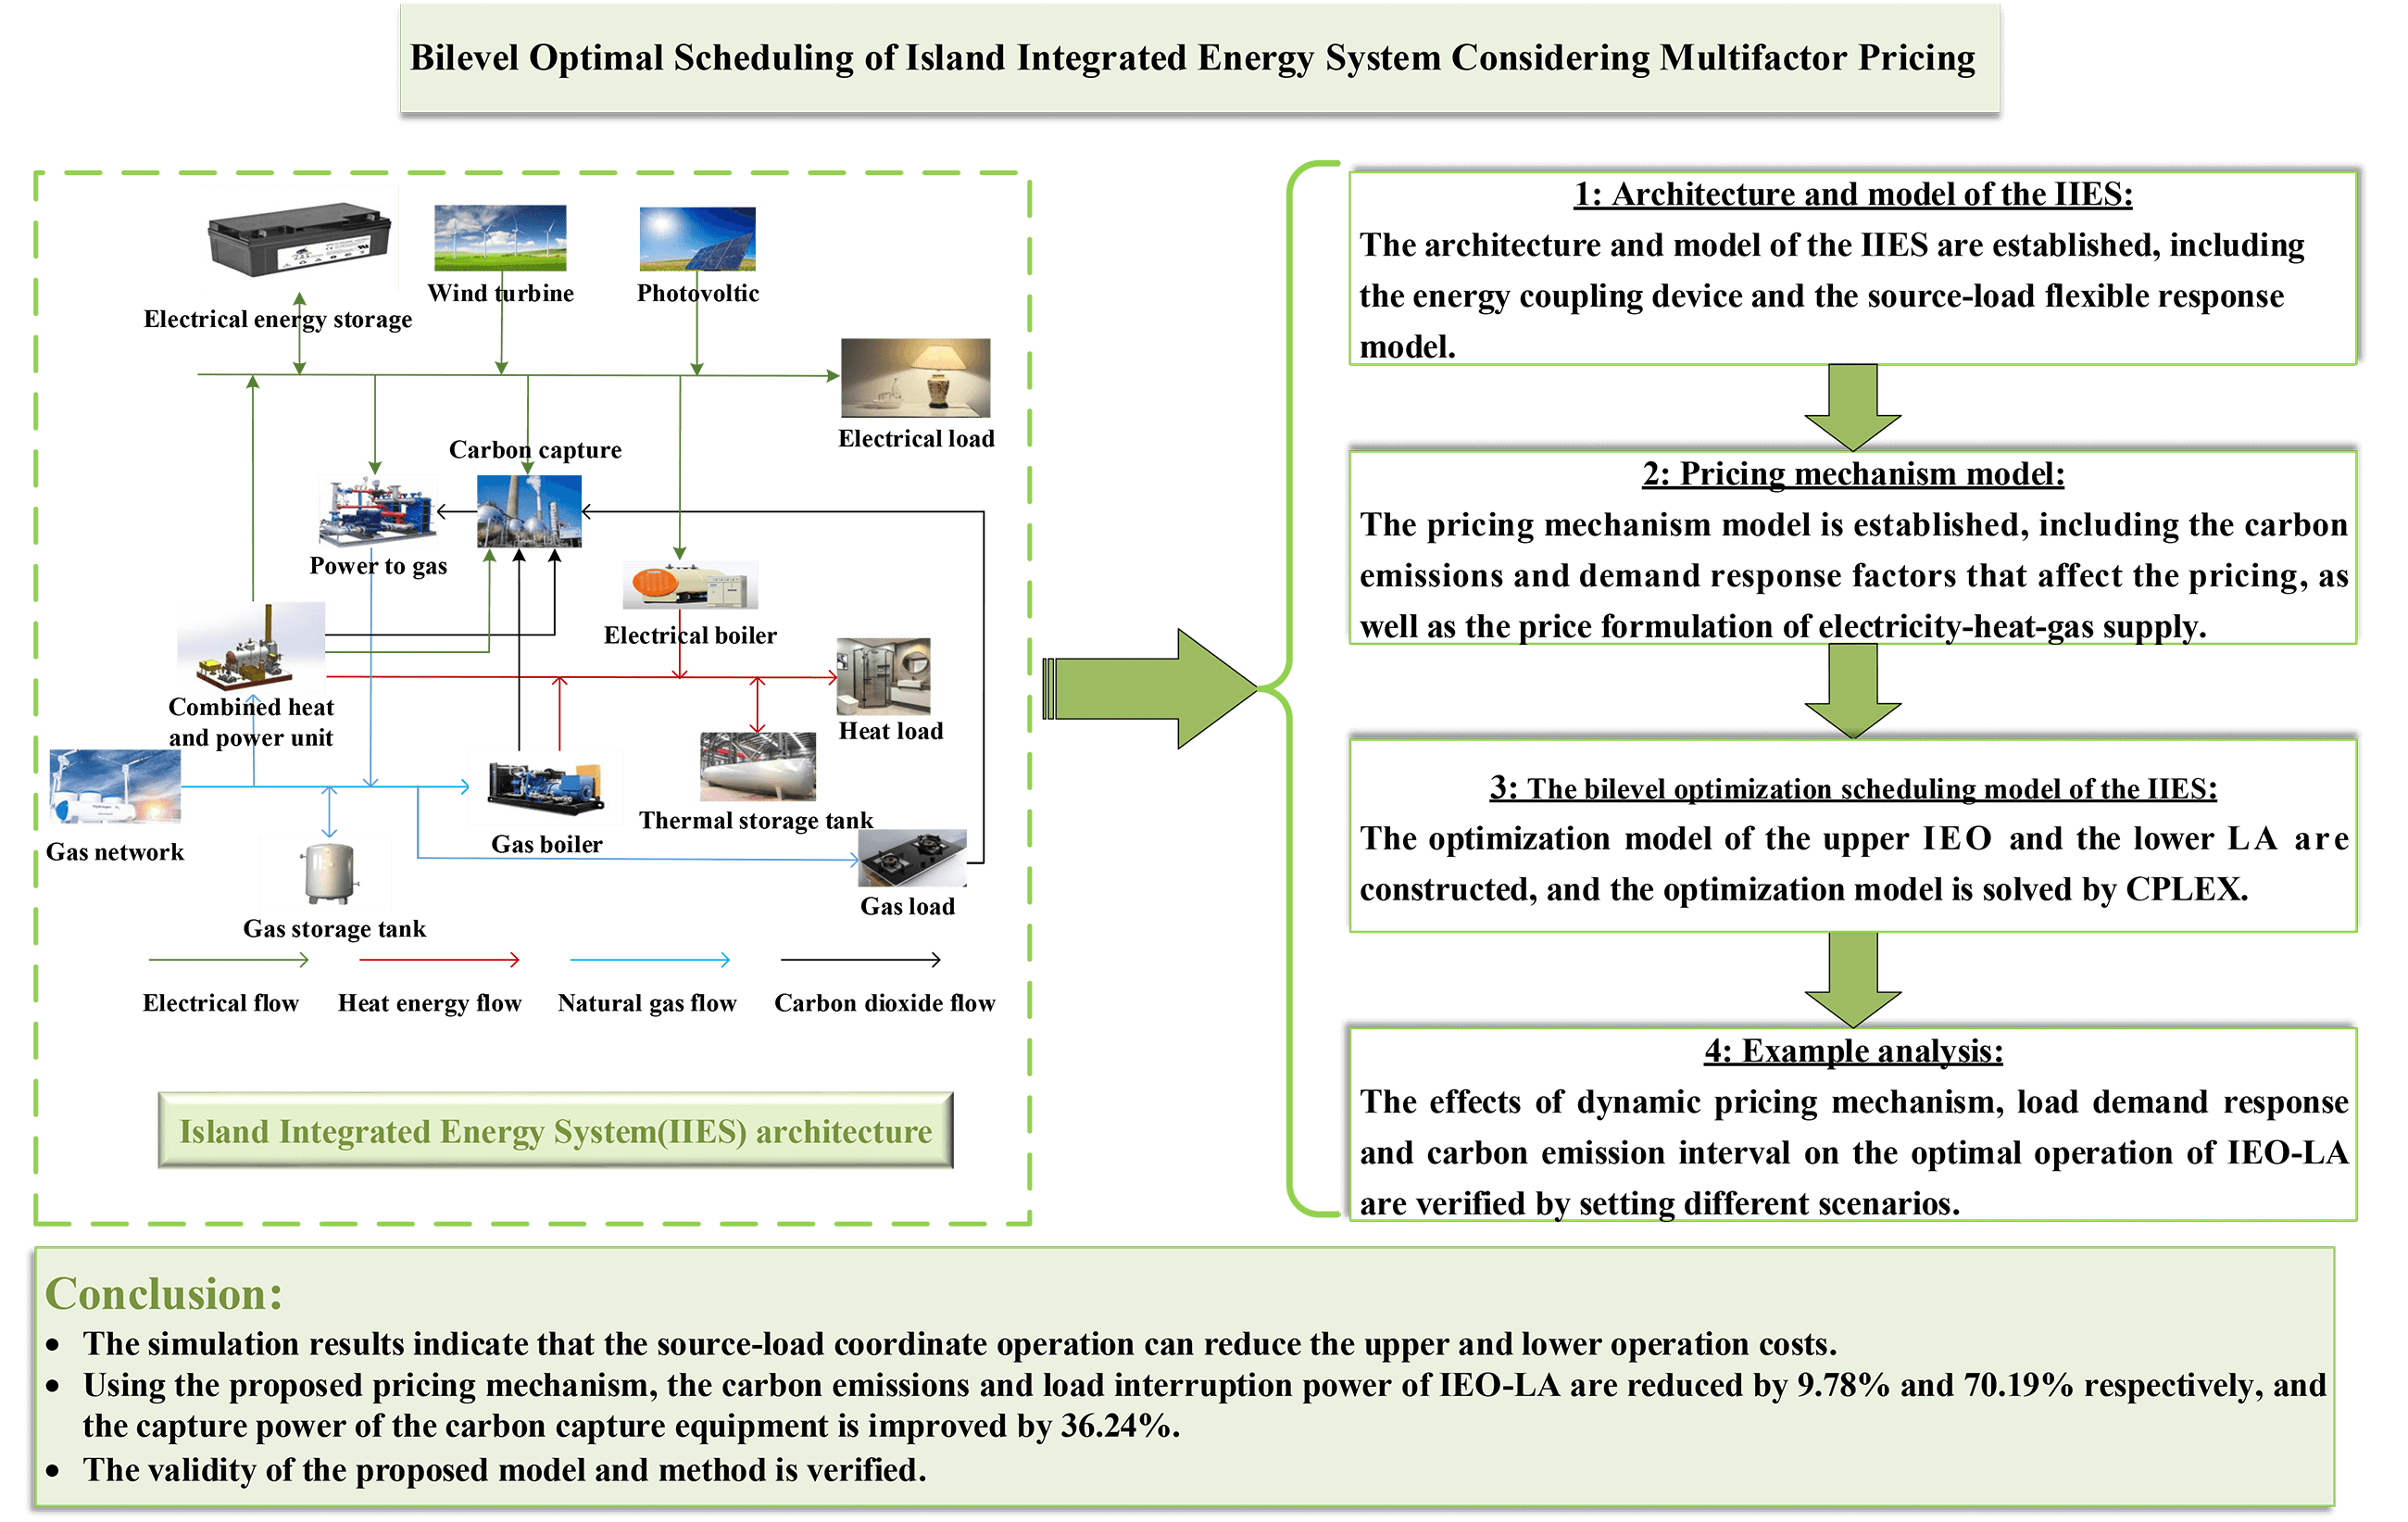
In this paper, a bilevel optimization model of an integrated energy operator (IEO)–load aggregator (LA) is constructed to address the coordinate optimization challenge of multiple stakeholder island integrated energy system (IIES). The upper level represents the integrated energy operator, and the lower level is the electricity-heat-gas load aggregator. Owing to the benefit conflict between the upper and lower levels of the IIES, a dynamic pricing mechanism for coordinating the interests of the upper and lower levels is proposed, combined with factors such as the carbon emissions of the IIES, as well as the lower load interruption power. The price of selling energy can be dynamically adjusted to the lower LA in the mechanism, according to the information on carbon emissions and load interruption power. Mutual benefits and win-win situations are achieved between the upper and lower multistakeholders. Finally, CPLEX is used to iteratively solve the bilevel optimization model. The optimal solution is selected according to the joint optimal discrimination mechanism. The simulation results indicate that the source-load coordinate operation can reduce the upper and lower operation costs. Using the proposed pricing mechanism, the carbon emissions and load interruption power of IEO-LA are reduced by 9.78% and 70.19%, respectively, and the capture power of the carbon capture equipment is improved by 36.24%. The validity of the proposed model and method is verified.Graphic Abstract
Keywords
Nomenclature
| Abbreviations | |
| IIES | Island integrated energy system |
| IEO | Integrated energy operator |
| LA | Load aggregator |
| IEO-LA | Integrated energy operator-load aggregator |
| IES | Integrated energy system |
| CHP | Combined heat and power |
| GB | Gas boiler |
| WHB | Waste heat boiler |
| EB | Electrical boiler |
| GT | Gas turbine |
| WHP | Waste heat power generation |
| Parameters | |
| The power generation efficiency of the GT | |
| The heat loss efficiency of the GT | |
| The recovery and utilization rate of waste heat resources | |
| The utilization efficiency of waste heat resources | |
| The heat efficiency of the GB | |
| The energy transformation efficiency of the EB | |
| The heat distribution coefficient of the GT to WHP | |
| The conversion coefficient of the WHP | |
| The energy conversion efficiency | |
| The maximum power output of the WHP | |
| The transfer-in of the | |
| The transfer-out of the | |
| The maximum transfer-in power of the | |
| The minimum transfer-in power of the | |
| The transfer-out beginning time of the | |
| The transfer-out end time of the | |
| The maximum interruptible power of the | |
| The minimum interruptible power of the | |
| The state variable of the | |
| the maximum interruption time of | |
| The minimum interruption time of | |
| The interruption beginning time of the | |
| The interruption end time of the | |
| The spacing length of carbon emissions | |
| The price adjustment coefficient of the carbon emission factor | |
| The price discount ratio of the carbon emission factor | |
| The discount base price of the electrical load | |
| The discount base price of the gas load | |
| The discount base price of the heat load | |
| The price adjustment coefficient of renewable energy generation | |
| The price adjustment coefficient of the WHP | |
| The maximum power output of renewable energy | |
| The maximum heat power output of the GB | |
| The up limit of heat energy for WHP | |
| The heat price adjustment coefficient of the GB | |
| The heat price adjustment coefficient of the WHB | |
| The maximum heat price constraint of the WHB | |
| The minimum heat price constraint of the WHB | |
| The maximum heat price constraint of the GB | |
| The minimum heat price constraint of the GB | |
| The price adjustment coefficient of the P2G | |
| The maximum gas price constraint of the P2G | |
| The minimum gas price constraint of the P2G | |
| The price adjustment coefficient of the WHP | |
| The operation cost of the upper IEO | |
| The gas purchase cost | |
| The energy abandonment cost | |
| The carbon trading cost | |
| The compensation cost of the interruptible load | |
| The sale revenue of the electricity-heat-gas in the upper level | |
| The penalty cost coefficient | |
| The compensation factor of the electrical interruption load | |
| The compensation factor of the heat interruption load | |
| The compensation factor of the gas interruption load | |
| The carbon base price | |
| The price growth rate | |
| The length of the carbon emission interval | |
| The operation efficiency of the electrical storage device | |
| The operation efficiency of the heat storage device | |
| The operation efficiency of the gas storage device | |
| The price adjustment coefficient of the GT | |
| The maximum price constraint of renewable energy power generation | |
| The minimum price constraint of renewable energy power generation | |
| The maximum price constraint of the WHP | |
| The minimum price constraint of the WHP | |
| The maximum output power of the EB | |
| The down limit of heat energy for WHP | |
| The maximum power output of the P2G | |
| Variables | |
| The waste heat power of the GT | |
| The power generation of the GT | |
| The heat power output of the WHB | |
| The heat power output of the GB | |
| The natural gas power consumption of the GB | |
| The electrical power consumption of the EB | |
| The demand response discount price of the gas load | |
| The demand response discount price of the heat load | |
| The power output of the EB | |
| The demand response discount price of the electricity load | |
| The steam heat value generated by WHB | |
| The initial power of the gas load in the lower LA | |
| The interruption power of gas load in the lower LA | |
| The generated natural gas power | |
| The interruption power of heat load in the lower LA | |
| The electrical power output of the P2G | |
| The transfer-in power of the | |
| The transfer-out power of the | |
| The initial power of the electrical load in the lower LA | |
| The interruption power of electricity load in the lower LA | |
| The total power of all interruptible load | |
| The interruptible power of the | |
| The carbon production of the upper IEO | |
| The carbon quota of the upper IEO | |
| The quantity of carbon dioxide captured by the carbon capture equipment | |
| The initial powers of the heat load of the lower LA | |
| The interruption powers of electricity load of the lower LA | |
| The interruption powers of the gas load of the lower LA | |
| The interruption powers of the heat load of the lower LA | |
| The price of renewable energy generation | |
| The basic electricity price of renewable energy | |
| The power output of renewable energy | |
| The price of the WHP | |
| The basic electricity price of the WHP | |
| The power output of the WHP | |
| The power generation price of the GT | |
| The basic electricity price of the GT | |
| The heat price of the GB | |
| The heating price of the WHB | |
| The basic heat price of the WHB | |
| The basic heat price of the GB | |
| The gas price of the P2G | |
| The basic gas price of the P2G | |
| The gas price | |
| The residual power of renewable energy | |
| The power of the carbon capture equipment | |
| The discharging power of the electricity storage device | |
| The discharging power of the heat storage device | |
| The discharging power of the gas storage device | |
| The initial powers of the heat load in the lower LA | |
With economic development, global energy is being shown a growing trend. Under the dual pressures of rapid economic development and an increasingly harsh environment, the transformation and reform of the energy system are crucial. Shifting from traditional fossil fuel structures to environmentally friendly new energy and renewable energy structures is an inevitable outcome for the development of the energy future [1]. Integrated energy system (IES) is developed from the traditional power system. IES takes the power network as the core, and carries out unified resource scheduling of different energy sources through cooperation with the natural gas network and the heat network. IES can reduce energy losses during the production and conversion process. IES is one of the important solutions for the energy industry to address low-carbon challenges [2].
Thus far, researchers worldwide have engaged in discussions regarding the economic issue of optimization operations for IES. Yu et al. [3] propose the IES low-carbon economic scheduling strategy based on a master-slave game considering adaptive ladder carbon potential-carbon price and supply-demand dual response, to address the problem of insufficient carbon emission responsibility on the energy-using side of IES in terms of carbon flow. Ma et al. [4] consider node-based integrated energy-carbon pricing and linearized energy hub models. Moreover, node-based integrated energy-carbon pricing strategies are proposed and computed via backward tracking and carbon emission flow methods. Finally, the bilevel optimization model and solution procedures yield optimal operational states for energy hubs. Wang et al. [5] propose a low-carbon dispatching model for IES in the park considering the shared energy storage characteristics of electric vehicle clusters. By building a microgrid operator model incorporating users and a carbon emission rights trading mechanism, this study fully explores the dispatch potential of diverse electric vehicle (EV) clusters and devises operation strategies that utilize EVs as storage units. To maximize the interests of all stakeholders in the park, a master-slave model involving multiple users and microgrid operators is established. Ye et al. [6] take the comprehensive energy system of an urban park serves as the focal point. The relationship between the use and supply side using the master-slave game to derive rational and effective incentive schemes. Hou et al. [7] establish a “green carbon” offset mechanism to convert tradable green certificates into carbon allowances. The low-carbon market mechanism and optimization method for the IES is proposed. Xiong et al. [8] construct an optimal scheduling framework for IES considering multi-energy sharing and integrated demand response, establish a synergistic operation model based on the Nash bargaining theory, and solve the energy sharing problem through the alternating direction multiplier method. Example analysis shows that compared with independent operation, this strategy can save the cost by 21.45%, and effectively promote the use of clean energy despite the fluctuation of renewable energy sources. Wang et al. [9] propose a bi-level optimization method for rural IES, considering multi-energy coupling and local conditions. A multi-objective algorithm is used in the model to plan equipment capacity, ensuring economic, low-carbon, and reliable operation of the system. Luo et al. [10] address issues in optimization scheduling models for integrated electricity-gas energy systems. An accurate approximation of the linearized model of the Weymouth equation and an improved alternating direction method of multipliers (ADMM) algorithm for multiparameter programming is proposed. Liang et al. [11] analyze a hybrid renewable energy system that integrates hydropower stations and hydrogen storage, demonstrating its potential to reduce costs and improve energy storage efficiency. By comparing different systems, the study identifies key parameters and highlights the importance of policy support and seasonal optimization to provide a pathway to a sustainable and economical energy future. Samy et al. [12] propose an optimization strategy for a hybrid off-grid photovoltaics (PV) wind power system based on NiFe battery storage and solve it by using various optimization algorithms. The performance of different algorithms is compared. The results show that the artificial neural network (ANN)-based meta-heuristic optimization technique outperforms the other methods in terms of efficiency, while the particle swarm optimization (PSO) algorithm performs best in the statistical evaluation with an R-squared of 99.7%. Duan et al. [13] propose an optimization model for a regional IES combining a ground source heat pump and a hydrogen storage system. The experimental analysis shows that the proposed model effectively reduces the operation cost by $1884.16 per day compared with the original model, which improves the economy and operation efficiency of the system. Wang et al. [14] provide a system for the coordinated operation to address the issue of privacy leakage resulting from the centralized solution of IES. To facilitate the solution, the non-convex nonlinear Nash bargaining model is equivalent to a sub-problem of alliance economic optimization and the sub-problem of dynamic pricing of energy transactions. Li et al. [15] define the set of uncertainty probability distributions of renewable energy generation based on the integrated paradigm constraints, then process the proposed model based on the strong dyadic theory, and solve it by using the algorithms of Column & Constraints Generation and Alternating Direction Method of Multipliers algorithms to obtain the optimal scheduling scheme for IES and EV energy management, as well as the trading strategy for multiple IES. Barakat et al. [16] evaluate five different energy storage battery technologies in a hybrid PV/battery grid-connected system by using HOMER software. The study compares metrics such as investment costs, renewable energy friction, and excess power, and finds that the duration of the investment program had no significant effect on system size, renewable energy share, carbon dioxide emissions, or unmet power load. Chen et al. [17] propose a robust optimization-based coordinate network and source planning method for IES that takes into account the uncertainty of renewable energy sources. The coordinate network and energy planning model are established and a robust optimization algorithm is applied to solve the planning problem. Through simulation analysis under four uncertainty scenarios, the results show that the total cost of the proposed method is at least 20.73% lower than that of the deterministic method under different robust parameters. Lin et al. [18] propose a comprehensive energy system integrating wind, photovoltaic, energy storage, hydrogen production, and utilization to solve the problem of intermittent renewable energy supply for Chinese islands. Through Simulink simulation and analysis, the results show that the wind and photovoltaic power generation in this system meets more than 70% of the load demand, the energy storage system maintains an efficient charging and discharging rate, and the hydrogen system improves the energy utilization rate, which achieves a stable supply and demand of the system. Jia et al. [19] construct a regional IES integrating renewable energy, energy storage, and power/heat sharing among power stations, and establish a multi-objective optimization model to target economic efficiency, carbon reduction, and reliability. By analyzing the system benefits, energy sharing, and energy storage, the results show that the system performs well in terms of energy efficiency and carbon reduction. Theoretical support is provided for the application of regional IES. Li et al. [20] propose an integrated scheduling framework based on model-free deep reinforcement learning (DRL), and introduce a ‘hydrothermal synchronous transmission’ (HST) structure to solve the problem of freshwater shortage. Through the interaction between the agent and the environment, the framework can adapt to various changes and adjust the strategy in time, effectively deal with the uncertainty of power supply and load, and realize a stable supply of resources. Li et al. [21] propose a two-phase optimal dispatch model for community IES, which optimizes dispatch in the day-ahead and intraday phases by integrating controllable load information to reduce operation costs and suppress random fluctuations. Simulation results show that the model effectively reduces the operation cost of the IES and achieves economic smooth operation. According to the above-mentioned literature analysis, in the study of IES-optimized operation, scholars worldwide predominantly concentrate on the economic operation of IES and the formulation of pertinent optimization scheduling models, but they rarely consider the interaction between the IES and its external environment. With the continuous development of carbon technology, the participation of carbon trading in the IES can not only improve the system’s ability to absorb renewable energy [22] but also reduce carbon emissions [23]. Therefore, more scholars are inclined to integrate IES with carbon technologies to achieve economically low-carbon operation.
Traditional researches on electricity pricing strategy primarily aim to mitigate the disparity between peak and off-peak loads or to maximize user benefits [24]. Gao et al. [25] outline the organizational structure and operational methodology of shared storage on the user-side and microgrid alliance, and establish an operation framework for shared storage-microgrid alliance. Based on the operation optimization model, the Stackelberg game multi-bill pricing model with the microgrid alliance as the follower was built, with user-side shared energy storage as the main focus. Li et al. [26] propose a framework that presents multiple service providers to participate in the optimization operation of the comprehensive energy market based on Nash bargaining. A new trading mechanism and an external dynamic pricing scheme are designed to improve the carbon trading model. Zhang et al. [27] formulate a pricing model for pumped storage participation in the ancillary and spot markets sequentially. Kariman et al. [28] analyze the energy consumption, economic, and environmental impacts of multi-effect desalination (MED) and mechanical vapor recompression (MVR) systems. Liu et al. [29] introduce an optimization scheduling method for a hierarchical carbon trading mechanism and demand response within a district-level IES. Zhang et al. [30] propose a data mining-based demand response potential feature extraction and prediction model, and an adjustable load demand response potential assessment model that combines subjective and objective weight analysis. The demand response features are predicted by feature extraction, clustering, and time series decomposition, and the response potentials are evaluated under different scenarios. The examples verify the validity of the proposed models and provide a reference for load aggregators to develop demand response scenarios. Zhong et al. [31] propose a strategy to optimize electric vehicle (EV) charging by using a dynamic time-sharing tariff mechanism, which redefines the peak and valley hours and dynamically adjusts the tariff through a fuzzy C-mean clustering algorithm. However, current research on the cooperative game of IIES service providers mainly adopted fixed-time prices, focusing on the internal transaction price of each cooperative subject. The carbon emissions and load interruption power are less considered. It is not possible to dynamically adjust the electricity sale price to the lower load. In the complex integrated energy market, ensuring the economy and initiative of each service provider involved in the market is difficult. The formation of energy prices is beyond the control scope of a single service provider and results from the interactive game of many market participants. Therefore, compared with the internal transaction of various stakeholders, the problem of interest conflict and external dynamic pricing caused by multiagent interactions must be further studied under the market mechanism.
The above research has contributed to the optimal operation of the IES and the pricing strategy of electricity price, but there are still some problems to be improved:
(1) Concerning the optimal operation of IES, the full potential for low-carbon economic operation is not adequately explored when carbon trading is incorporated into the IES.
(2) The current research on cooperative game of island integrated energy system (IIES) service providers mainly adopted fixed-time prices. Most of the research literature is limited to quotation optimization and pricing strategy improvement at the individual level. There are few discussions on the integration of IIES and multifactor pricing strategy. As an integrated energy operator (IEO) who actively shapes price, the research in the field of collaborative optimization of quotation and pricing strategy is not comprehensive.
In summary, a bilevel optimal scheduling method for IIES considering multifactor pricing is proposed in this paper. The contribution of the paper is as follows:
(1) In order to deal with the conflicts between different stakeholders, a bilevel optimization model of IEO-LA is constructed in this paper. Among them, the upper level is IEO, and the lower level is electricity-heat-gas load aggregator (LA).
(2) A dynamic pricing mechanism is proposed to coordinate the interests of the upper and lower levels. The mechanism can dynamically adjust the energy sale price to the lower LA. The carbon emissions and load interruption power are reduced. The capture power of carbon capture equipment is improved. The mutual benefit and win-win situation between upper and lower levels are achieved.
The organizational structure of the study is as follows. In Section 2, the IIES model is established, including the energy coupling device and the source-load flexible response model. In Section 3, the pricing mechanism model is established, including the carbon emission and demand response factors that affect the pricing, as well as the price formulation of electricity-heat-gas supply. The bilevel optimization scheduling model of IIES is established in Section 4. The optimization model of the upper IEO and the lower LA are constructed, and the upper and lower levels are solved by CPLEX. In Section 5, the effects of the dynamic pricing mechanism, load demand response, and carbon emission interval on the optimal operation of IEO-LA are verified by setting different scenarios. In Section 6, the full paper is summarized, and the research plan is proposed in the next step. The general workflow of the study is shown in Fig. 1.
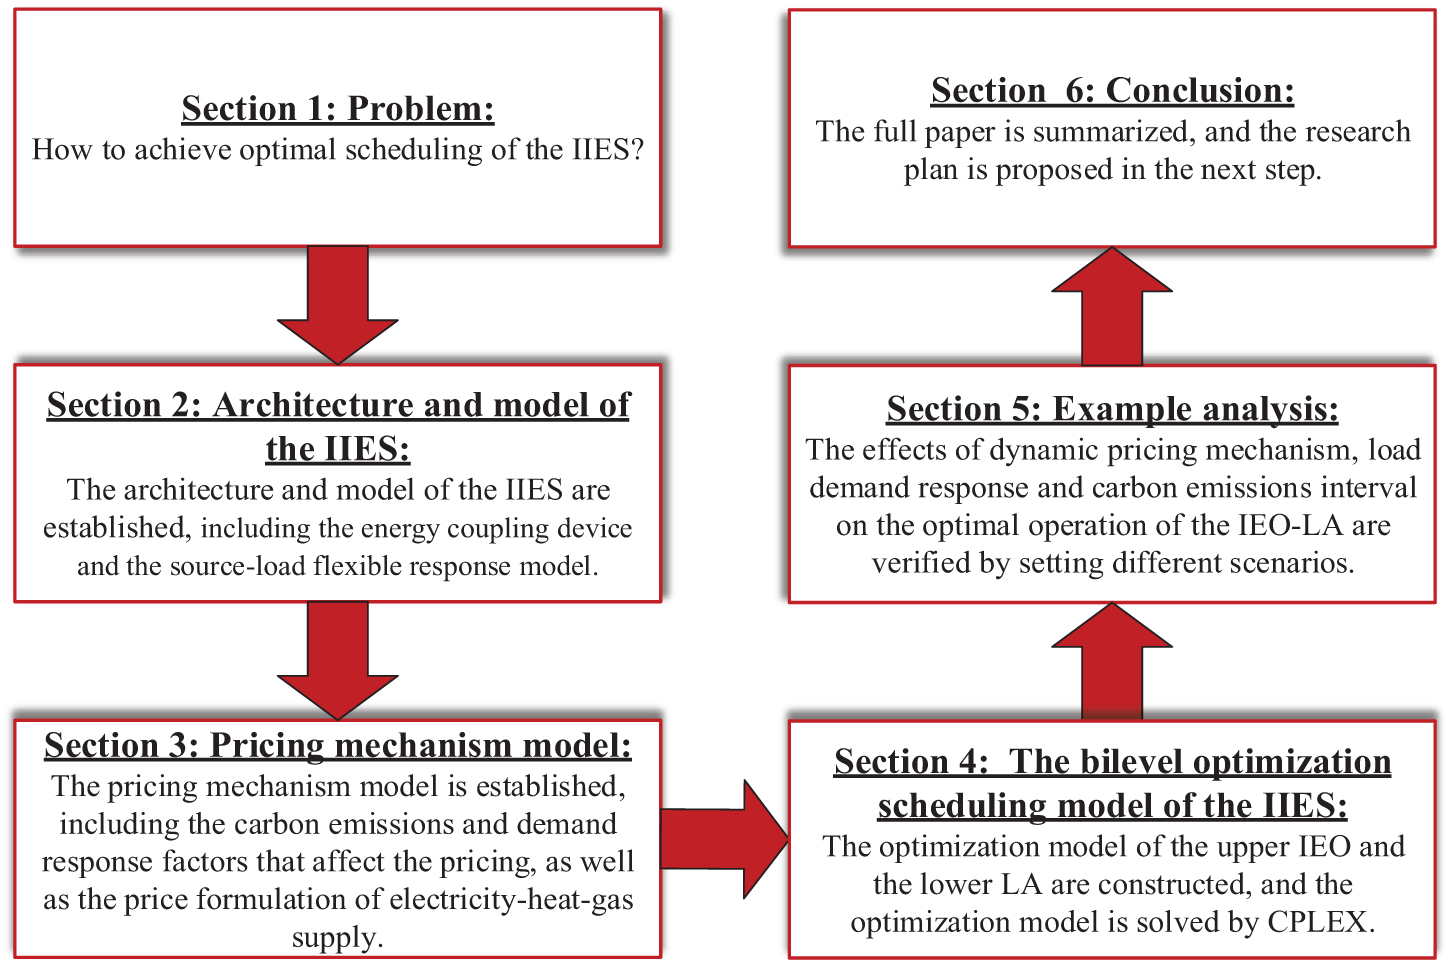
Figure 1: General workflow of the study
The IIES architecture is shown in Fig. 2.
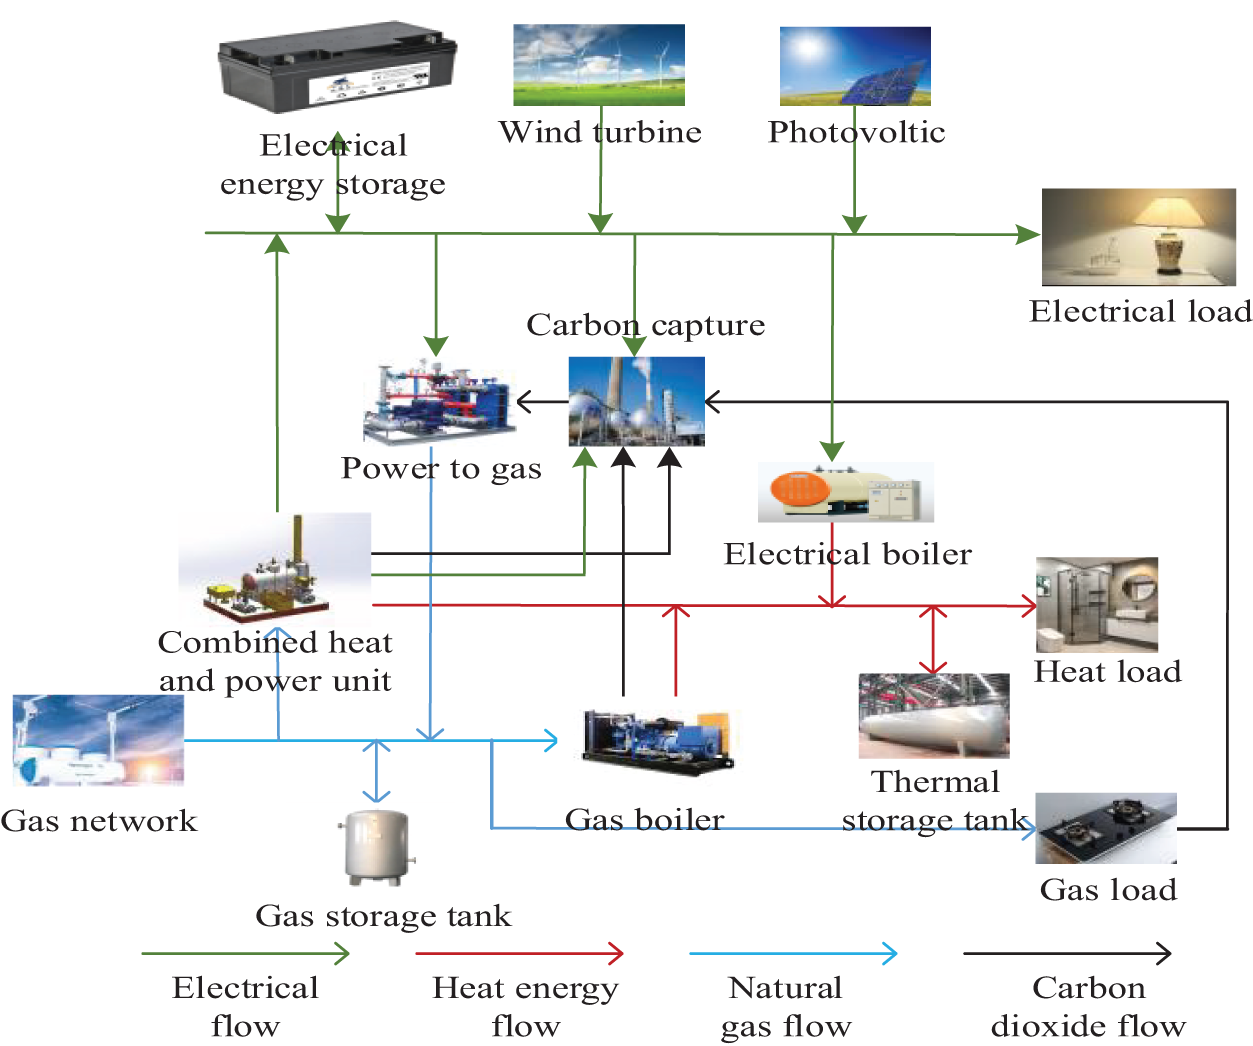
Figure 2: IIES architecture
There are wind turbines, photovoltaic devices, and electrical energy storage devices in Fig. 2, as well as power-to-gas (P2G), combined heat and power (CHP) units, heat storage tanks, carbon capture devices, gas boiler (GB), electric boiler (EB), waste heat boiler (WHB), gas storage tank. The CHP unit comprises a gas turbine (GT) and WHB.
2.2 Energy Coupling Equipment Model
(1) CHP model
Compared with heat and power separate supplies, CHP is more economical because of its energy cascade utilization characteristic. The CHP model is as follows:
where
(2) GB model
The GB serves as a backup heating device. When the capacities of the WHB and EB are insufficient, the GB supplements the heat supply. The model is as follows:
where
(3) EB model
The heating devices are included GB, WHB, and EB in the study. The EB is an electrothermal coupling device that converts electrical power into heat power. Its advantages include high efficiency, environmental protection, safety, and flexibility. It is an important heating device in modern life. The model is as follows:
where
2.3 Source-Side Flexible Response Model
Due to the presence of WHB and P2G facilities, and other equipment in the IIES, multiple energy sources can be coupled on the source side. The objective of flexible response on the source side is to achieve optimal energy distribution by reasonably allocating supply sources. The operation costs of IIES are reduced. The source-side flexible response model developed in this study is primarily realized through the coordinated operation of WHB and P2G devices.
(1) WHB model
As an important waste heat recovery device in IES, the WHB works in coordination with GT to form a cogeneration system. The working principle of the WHB is to reclaim waste heat from the high-temperature gasses generated by the GT, which can generate high-temperature water vapor as a heat source. The model is as follows:
where
(2) P2G model
In periods of low demand for the electrical load, P2G technology converts the new energy power of wind and solar energy that the system cannot absorb in time into methane for storage or gas load. When the electrical load demand is at a peak, the natural gas generated can be used as the fuel for GT power generation. When the gas load demand is at a peak, the methane can be supplied to the gas load, keeping the system power balance. The P2G model is as follows:
where
2.4 Load-Side Flexible Response Model
In the IIES, the electricity-heat-gas load is categorized into fixed and flexible loads based on their participation in demand response. The flexible loads encompass the time-shifting loads and the interruptible loads. A fixed load cannot respond to demand. It is an uncontrollable load, and its energy consumption time and energy consumption mode do not change. It is mainly the necessary electrical demand of the users in daily life. The time-shiftable load can respond to demand and is controllable. It can transfer part of the load to the load demand valley or peacetime when the load demand period is at a peak. The total load remains unchanged before and after transfer during a scheduling cycle, such as washing machines, electric vehicles, and sweeping robots. The interruptible loads have the capability for demand response and are classified as controllable loads. They can relieve the system’s power supply pressure by curtailing non-critical loads during periods of peak load, such as the number and intensity of lights used.
Since the electrical-heat-gas load considered in this paper can be time-shifted and interrupted, they are uniformly modeled. The time-shifting load model is as follows:
where
where
3.1 Model of Factors Affecting Pricing
This paper considers the carbon emissions and the load demand response as the factors affecting the pricing of the IIES. However, since carbon emission factors and the load demand response cannot be added to the price of each device, these factors must be converted into corresponding price coefficients. The price discount coefficient of the carbon emission factors and load demand response is as follows:
(1) Carbon emission factors
The price discount formula for carbon emission factors is as follows:
where
(2) Demand response factors
The price discount formula of demand response factors is as follows:
where
3.2 Power Supply Price Formulation
In the bilevel optimization of the IIES, the price of the upper energy is set to guide the lower load to take part in the optimization operation of the upper level, which improves the economic and steady operation of the IIES. The power supply equipment of the upper IEO includes renewable energy, GT, and WHP. Among them, renewable energy generation and WHP do not consider carbon emission factors, but the impact of demand response on their pricing must be taken into account. The GT needs to consider the impacts of carbon emissions and demand response factors on pricing at the same time. The model of the power supply price is:
where
In this paper, the upper limit of the price of each device is constrained. The specific description is as follows:
where
3.3 Heat Supply Price Formulation
The heating devices of the upper IEO include the GB and WHB. The EB is located on the load side, it is not priced. In the upper heating devices, the WHB pricing ignores the carbon emission factor and considers only the demand response factor. The impact of carbon emissions and demand response factors on pricing should be considered simultaneously for the GB. The model is as follows:
where
In addition, to ensure that the heating price is in a reasonable range, this paper sets an upper limit on the price of heating device, which is described as follows:
where
3.4 Gas Supply Price Formulation
The gas supply device of the upper IEO is P2G. It does not produce carbon emissions, so only the influence of the lower gas load demand response on the gas supply price of this equipment is considered. The model is as follows:
where
The dynamic pricing mechanism proposed can dynamically coordinate the supply and demand relationships between the upper and lower levels. The process is as follows:
(1) The upper IEO transfers the established electricity-heat-gas price to the lower LA;
(2) The optimal energy consumption plan in the lower LA is transmitted to the upper IEO;
(3) The upper level updates the electricity-heat-gas price of the IEO based on the load power feedback from the lower level. The electricity-heat-gas price of the IEO is transmitted to the lower level. The iteration is continued until the end of the iteration.
4.1 The Optimization Model of the Upper IEO
The operation costs of the upper IEO include the gas purchase cost, energy abandonment cost, carbon trading cost, interruptible load compensation cost, and sale revenue of the electricity-heat-gas to the lower level. The operation cost is as follows:
where
The electrical-heat balance constraints are:
where
4.2 Optimization Model of the Lower LA
The operation costs of the lower LA comprise two parts: 1) the energy purchase cost of the lower electricity-heat-gas load from the upper IEO; and 2) the lower load demand response revenue. The model is as follows:
where
In this paper, the joint optimal formula is used as the condition for judging the termination of the iteration, and then the bilevel joint best result of the IIES is obtained. The joint optimal formula can be expressed as follows:
where
In the background of multiple stakeholders, the solution process of the bilevel optimization model is as follows:
Step 1: The operation model of the IIES is constructed. The initial cost coefficient of each energy supply equipment is input.
Step 2: CPLEX is used to solve the model of the upper level, and the best power information for each equipment is obtained.
Step 3: The prices of electricity-heat-gas for each equipment are obtained based on the pricing mechanism.
Step 4: The prices of electricity-heat-gas for each equipment are transferred to the lower level.
Step 5: CPLEX is used to solve the lower-level model to obtain the load curve after the demand response.
Step 6: The operation costs of the upper and lower levels are saved. According to the joint optimal index, the joint optimal solution is determined.
Step 7: The load curve after the demand response is returned to the upper level for the next iteration.
Step 8: If the termination conditions are satisfied, the optimal operation strategy of the bilevel optimization model for IIES is output.
The specific solution flow chart of IEO-LA is shown in Fig. 3.
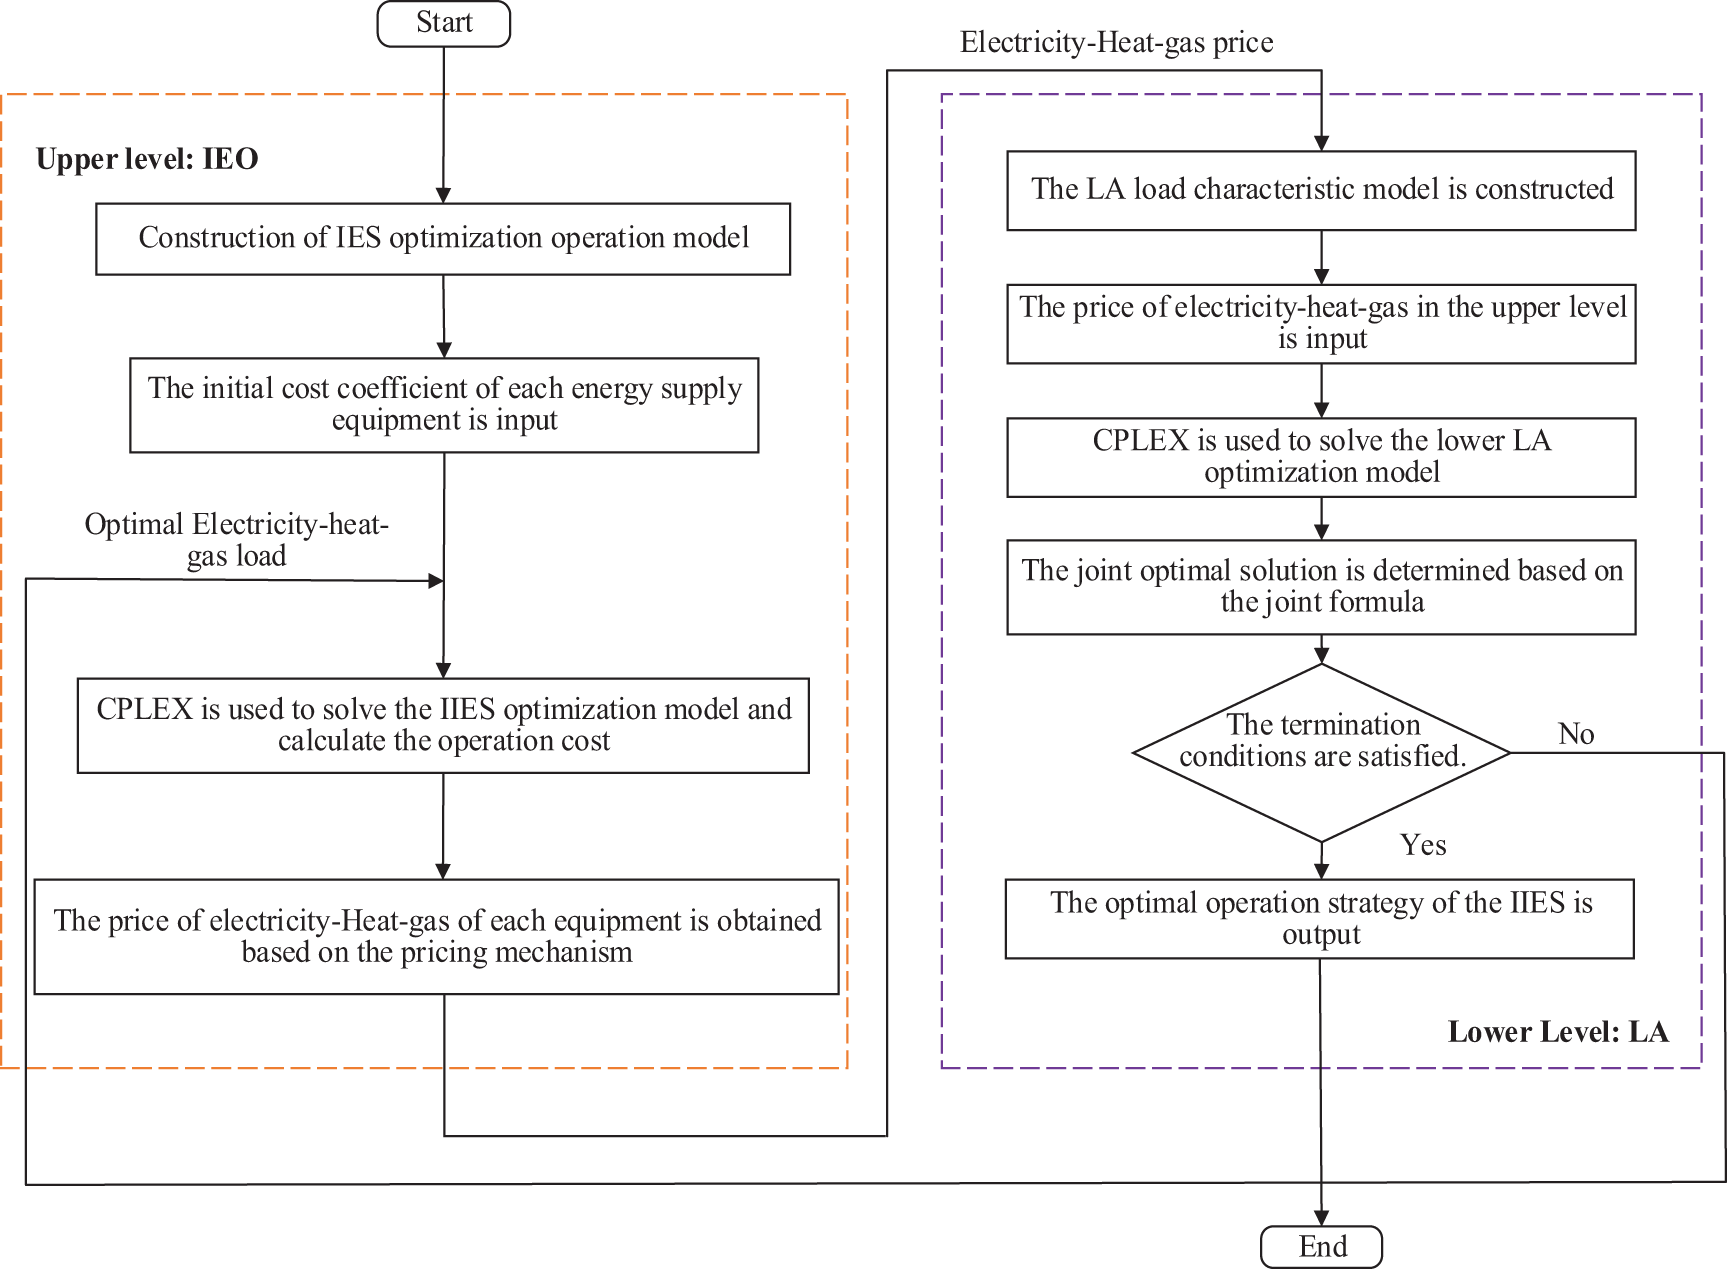
Figure 3: The solution flow chart of the IEO-LA
A simulation example is constructed in the paper. The simulation calculations involved are performed in MATLAB R2018b. CPLEX is used to solve the proposed bilevel optimization model. The basic data of the paper are shown in Fig. 4, which shows the data of wind-photovoltaic power and electricity-heat-gas load in the IIES. The basic data used in the paper can be found in Reference [32]. According to the Fig. 4, the PV power value is maximum at noon. Wind power fluctuates between 50–150 kW throughout the day. The peak demand for heat load is concentrated at 00:00–07:00, and the valley demand for heat load is at 12:00–18:00. The power maximum of electricity load is around 12:00 and 17:00. The power minimum of electricity load is concentrated at 00:00–06:00. The gas load fluctuates in the range of 150–250 kW throughout the day. The interaction price between the IIES and superior gas network is adopted as a time-of-use gas price [33], which is shown in Table 1. The flexible load includes the electrical-heat-gas load. The electrical load has time-shifting and interruptible characteristics, accounting for 15% and 10% of its load demand, respectively. The system equipment parameters are shown in Table 2.
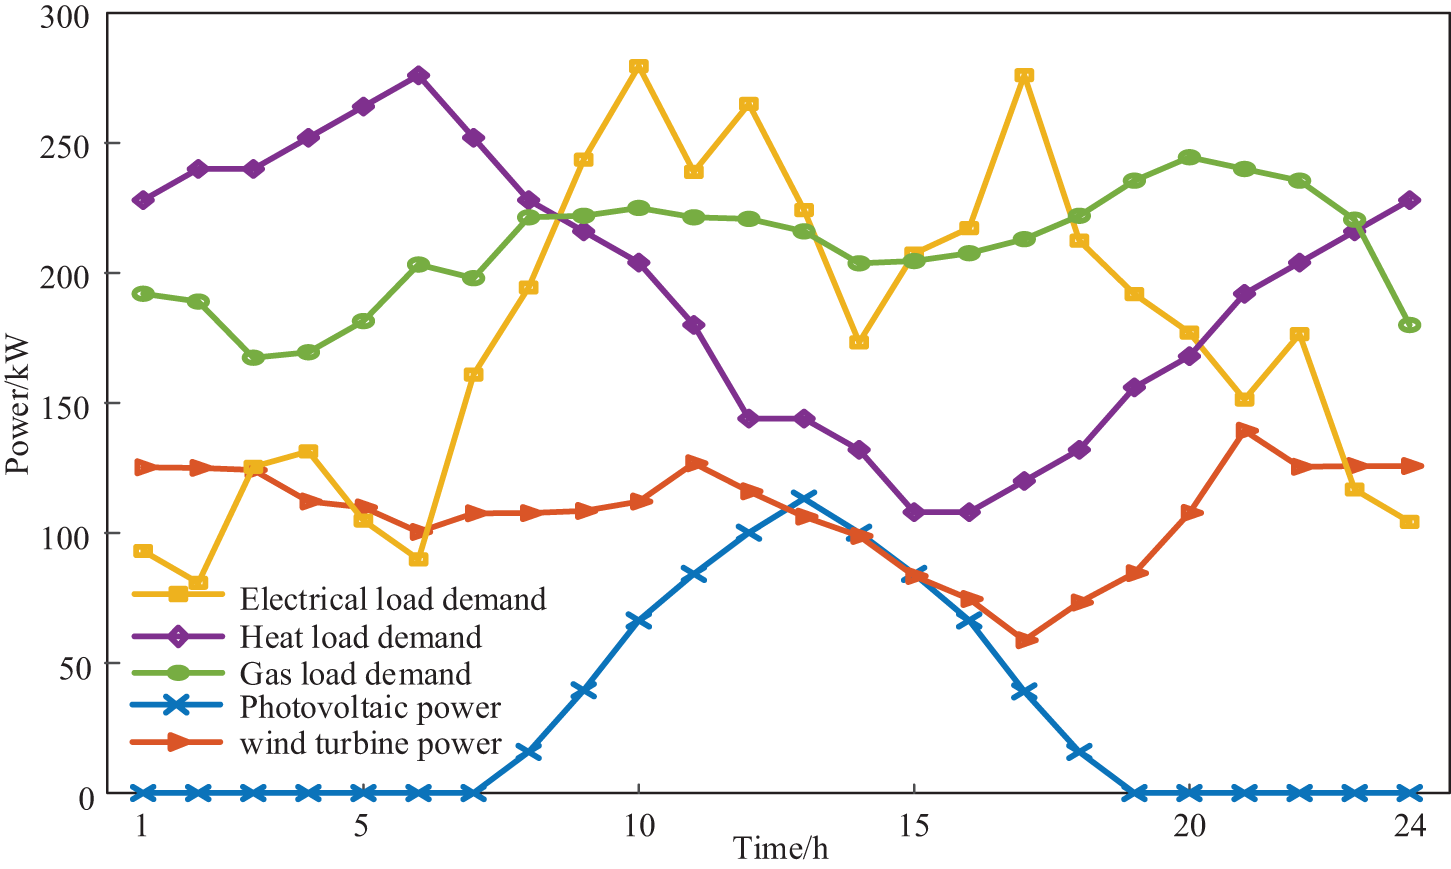
Figure 4: Wind-Photovoltaic power and electrical-heat-gas load


5.2 The Optimal Operation Plan of the IEO-LA
In the paper, the energy price and unit output of the upper IEO are related to the load response plan of the lower LA. The complementarity and correlation between different energy sources and the intrinsic relationship between loads are studied in depth, and the specific analysis is as follows.
The optimal electrical supply price and the optimal electrical operation plan of the IEO-LA are depicted in Figs. 5 and 6, respectively. According to the Fig. 5, the power generation price of renewable energy is the lowest. The power generation price of the WHP is in the middle. The power generation price of the GT is the most expensive. According to Fig. 6, during the operation of the IEO-LA, renewable energy and WHP are used as priorities. The GT is started to supply power to the lower-level load only when the power from renewable energy and WHP is insufficient. The supply-demand balance of the IIES is maintained. For instance, during the 7:00–10:00, the electrical load is at a peak. Renewable energy and WHP are insufficient to satisfy the electrical load demand. Despite the higher price of the power supply for the GT, the lower-level LA must purchase electricity from the upper-level GT to maintain the power balance. Moreover, during the dawn period (1:00–6:00), the electrical load demand solely is satisfied by renewable energy. Meanwhile, the electrical energy storage is charged, and the P2G equipment is started to produce natural gas.
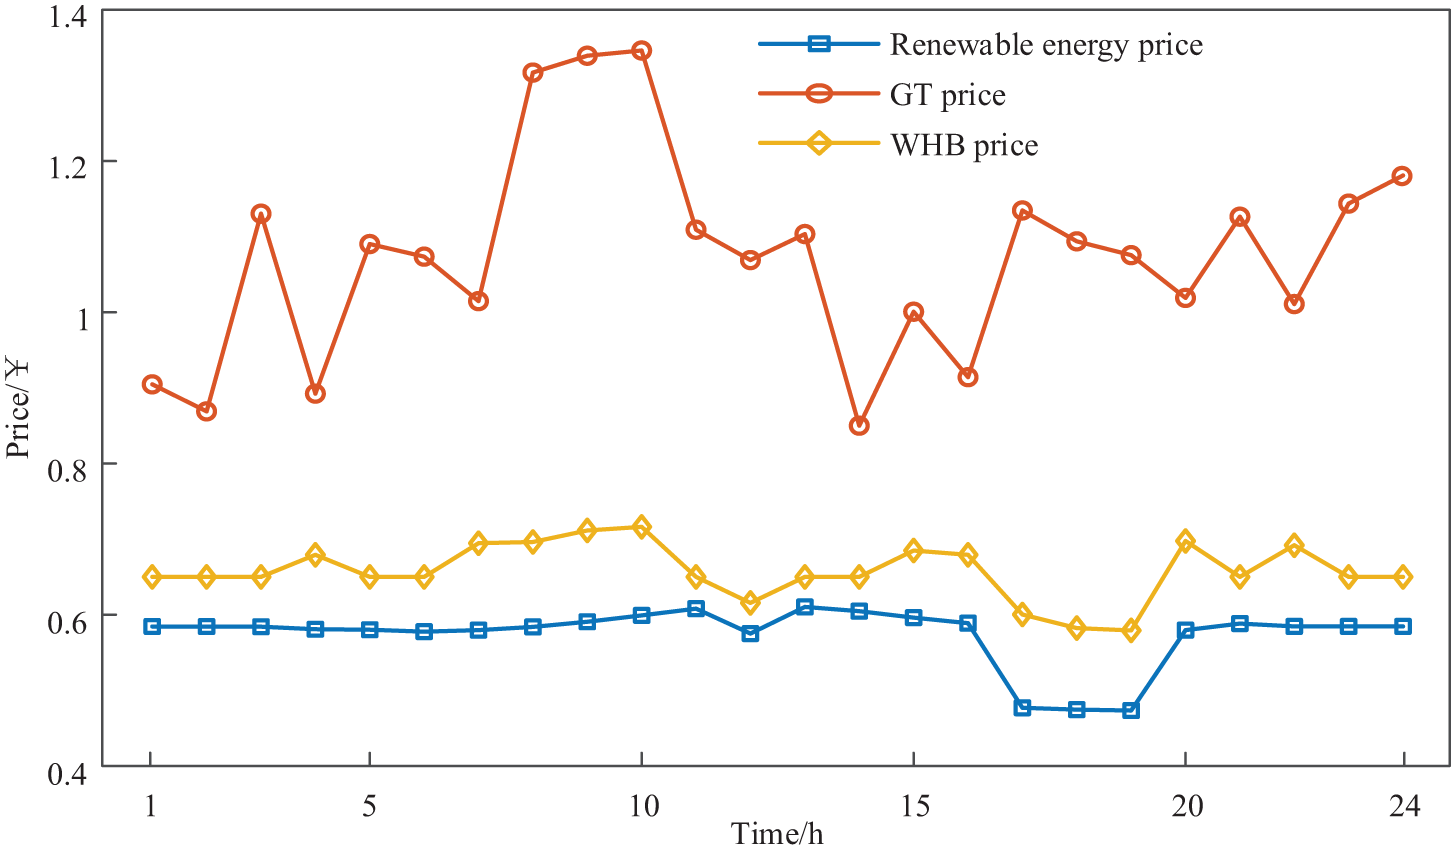
Figure 5: Optimal electrical supply price of the IEO-LA
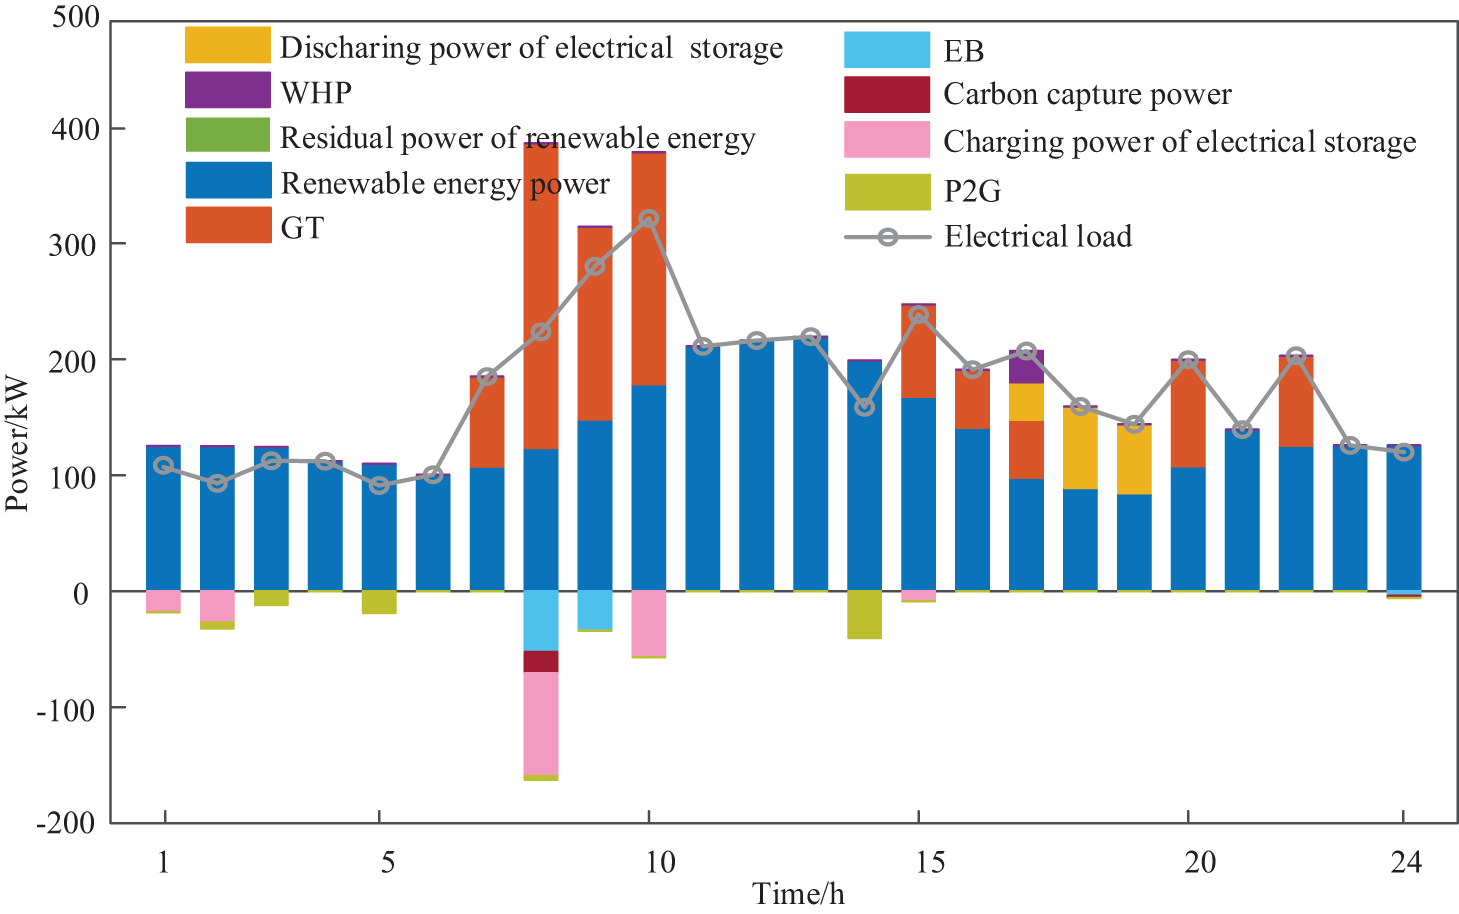
Figure 6: Optimal electrical operation plan of the IEO-LA
The optimal heat supply price and the optimal heat operation plan of the IEO-LA are depicted in Figs. 7 and 8, respectively. According to Fig. 7, the heating price of the WHB is the lowest. The heat price of the GB is the most expensive. According to Fig. 8, at 1:00–6:00, although the heating price of the WHB is lower than that of the GB, the GT has no power output. The WHB cannot supply heat to the heat load, so the lower heat load can only buy heat from the GB to maintain the heat power balance. In addition, during the periods of 7:00–10:00 and 15:00–16:00, the GT has power output, the WHB can generate heat to supply the heat load, and the lower heat load is priority heated by the WHB.
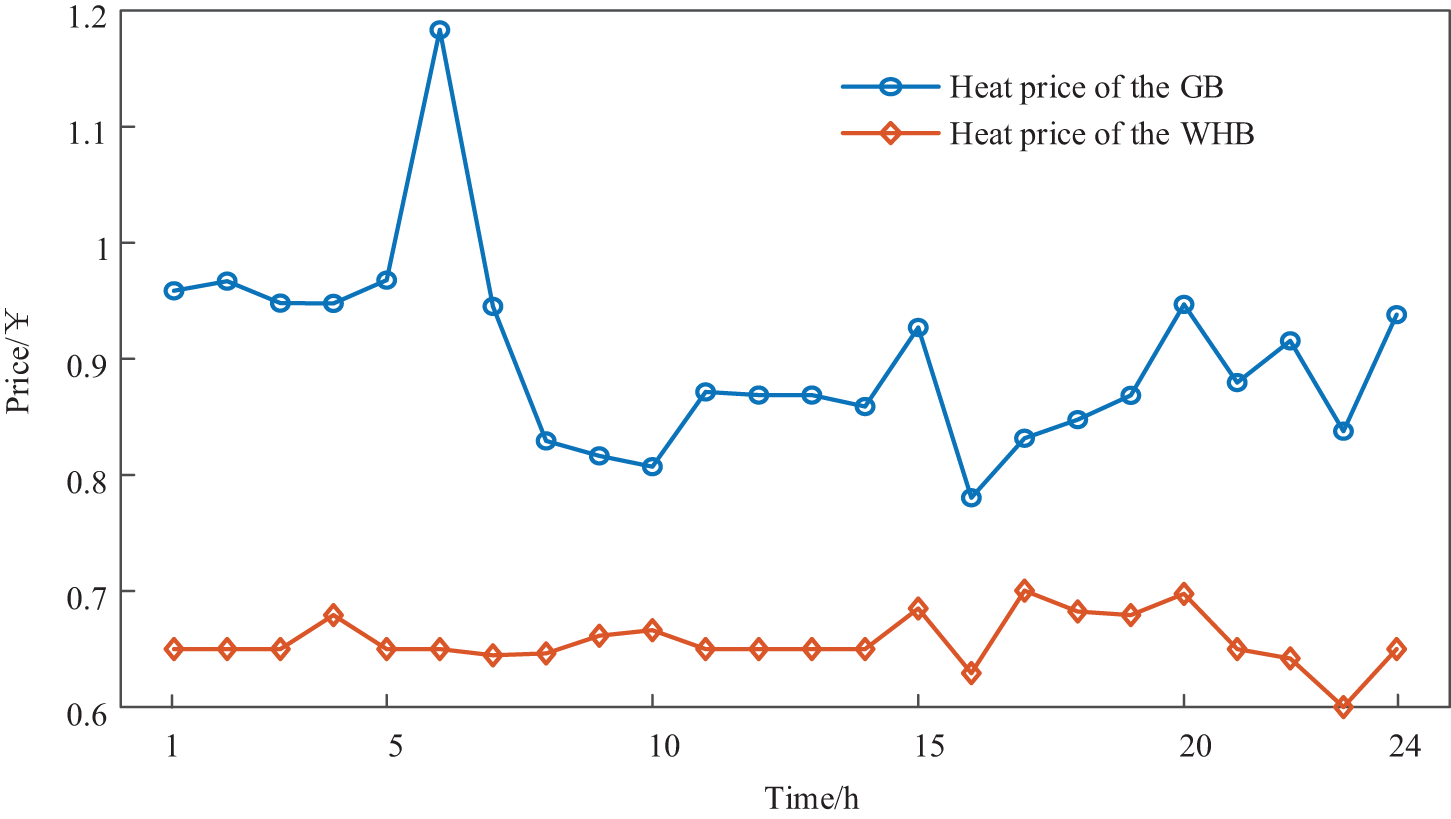
Figure 7: Optimal heat price of the IEO-LA
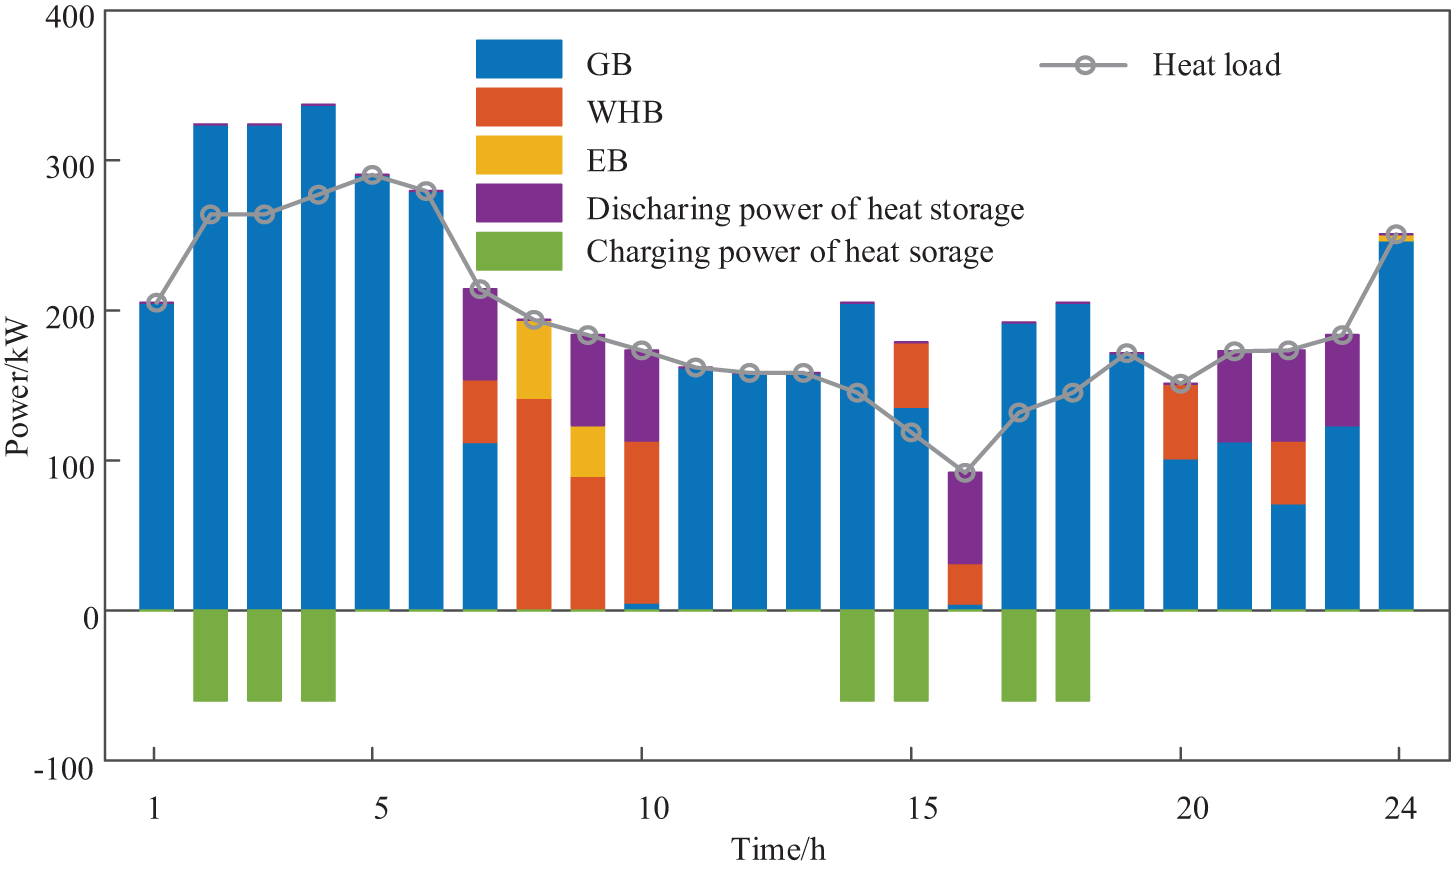
Figure 8: Optimal heat operation plan of the IEO-LA
The optimal gas supply price and the optimal gas operation plan of the IEO-LA are depicted in Figs. 9 and 10, respectively. According to the Fig. 9, the P2G equipment is only provided pricing in the paper. At 4:00 and 14:00, the gas price is highest. According to Fig. 10, the lower gas load only purchases gas from the P2G equipment at 2:00–3:00, 4:00–5:00, and 13:00–14:00. The gas supply price of the P2G equipment is lower than that of the gas network.
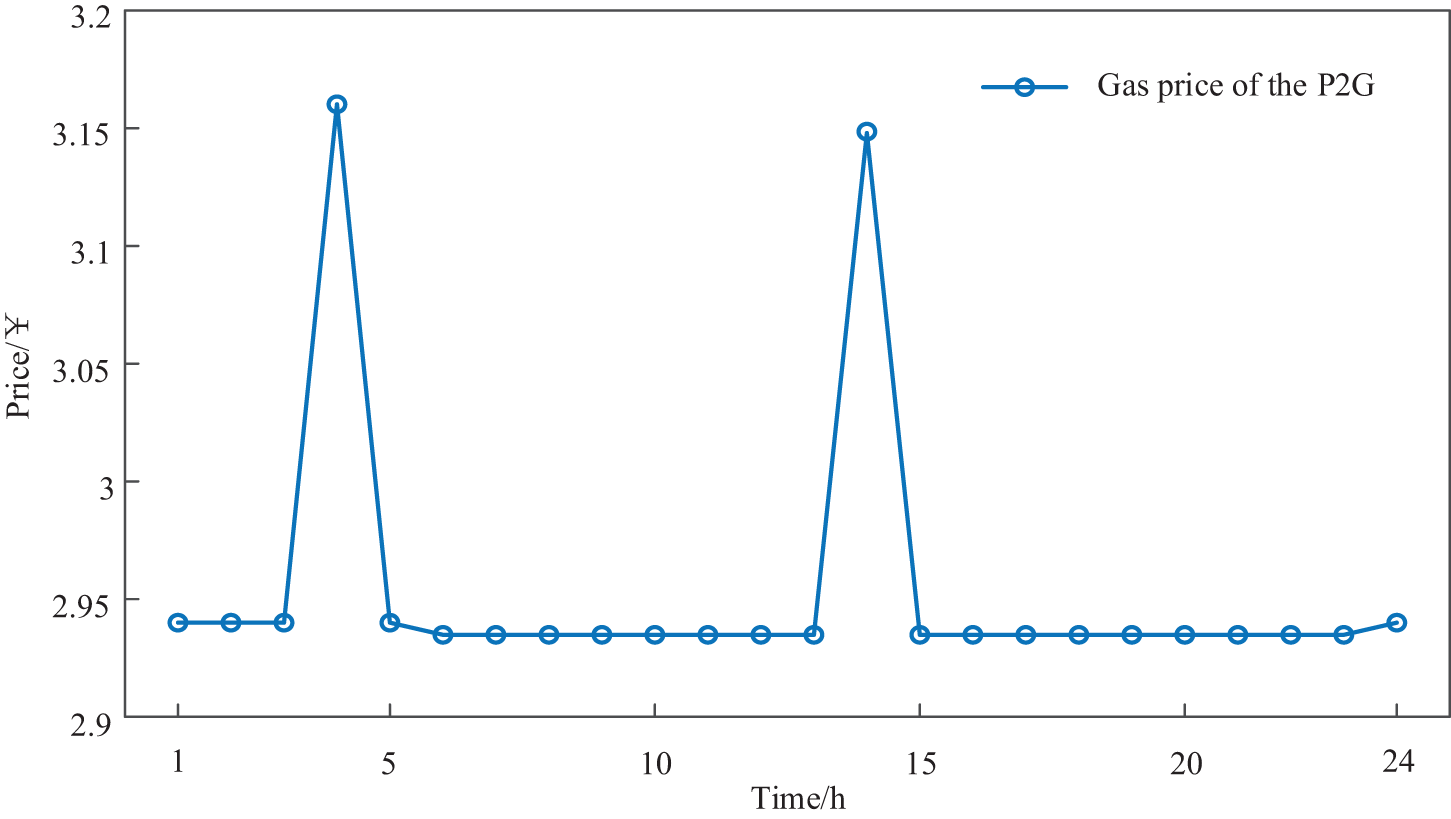
Figure 9: Optimal gas supply price of the IEO-LA
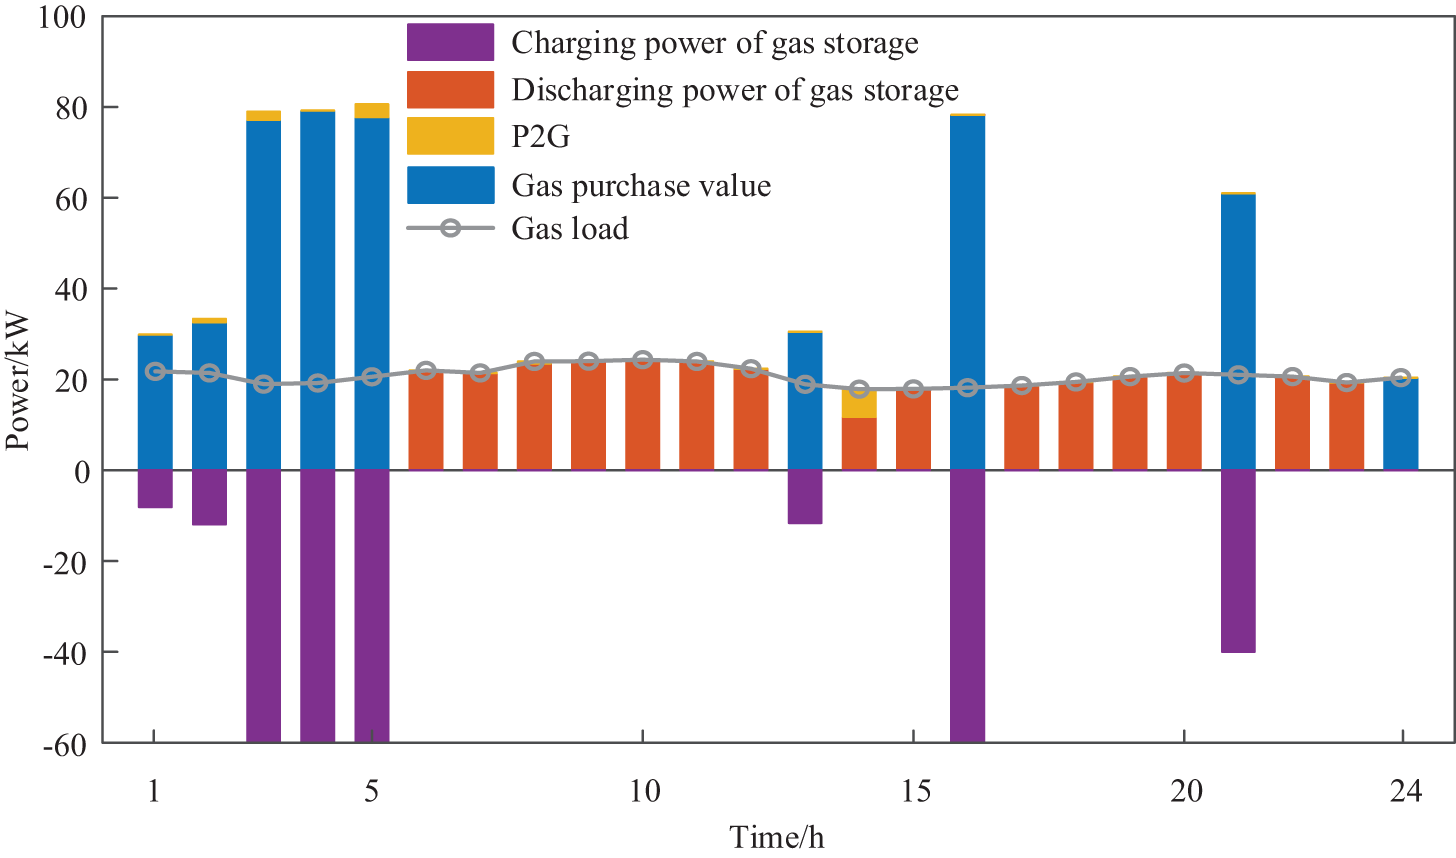
Figure 10: Optimal gas operation plan of the IEO-LA
5.3 Analysis of the Dynamic Pricing Mechanism
To clarify the validity of the dynamic pricing mechanism in the economic and low-carbon aspects of the IEO-LA, three comparative scenarios of pricing mechanisms are set up as follows:
Scenario 1: The dynamic pricing mechanism proposed in this paper is adopted, and only the impact of carbon emission factors on the pricing mechanism is considered.
Scenario 2: The dynamic pricing mechanism proposed in this paper is adopted, and only the impact of load demand response on the pricing mechanism is considered.
Scenario 3: Based on Scenario 2, the impact of carbon emission on the pricing mechanism is considered.
The analysis of the influence of the dynamic pricing mechanism for the IEO-LA is presented in Table 3. Compared with Scenario 1, the proposed pricing mechanism in Scenario 3 is used to reduce IEO-LA by 9.78% in carbon emission and 70.19% in load interruption power. Moreover, the capture power of the carbon capture equipment increased by 36.24%. In addition, compared with Scenario 2, the operation cost of the upper IEO in Scenario 3 is decreased by 4.56%, the carbon emissions are decreased by 21.20%, and the load interruption power is decreased by 48.99%. Meanwhile, the capture power of carbon capture is increased by 60.60% in Scenario 3. The data analysis shows that the proposed pricing mechanism contributes to reducing upper IEO carbon emissions and improving the lower LA load satisfaction level. By coordinating the source-load relationship between the upper and lower levels, the capture capacity of the carbon capture equipment is increased.

The influence of the LA response on the pricing mechanism is considered in Scenario 2. When the energy sale price of IEO equipment is reduced by load interruption, the operation expense of the lower LA is decreased, the operation cost of the upper IEO is added, and there is a favorable effect on the lower operation. In contrast, the impact of the carbon emissions of the upper IEO is considered in Scenario 1. The energy sale price of the IEO to the lower LA is increased, thereby the operation cost of the upper IEO is reduced, and the operation cost of the lower LA is increased. The data analysis shows that these factors are beneficial to the upper and lower levels, respectively. Only one factor is considered to lead to a biased operation on one side or the other.
The load with demand response ability mentioned includes the electrical-heat-gas load. Demand response relieves the pressure on the energy supply of the system by changing the load energy consumption curve, and improves the economy of IEO-LA operation at the same time. The specific analysis is as follows.
The electricity-heat-gas load curves are compared before and after the demand response in Figs. 11 and 12, respectively. According to Fig. 10, the load peak occurs after the demand response of the lower electrical load. Because the upper IEO energy is sufficient at this time, and the price of power supply equipment is low, which leads the lower electrical load to move into this period, and then the load peak occurs. In addition, the heat load is moved into the dawn period (2:00–5:00) to reduce the heat load power in other periods. While assuring the equilibrium of demand-supply, the heat purchase expense of the LA is decreased, and the economic efficiency of the lower LA operation is improved. According to Fig. 11, the gas load demand response moves part of the gas load into the dawn period (1:00–7:00). Because the dawn period is in the low gas price period of the gas network, by increasing the gas purchase power in this period, the amount of gas purchased in other periods is reduced, and the gas purchase cost of the lower LA is reduced.
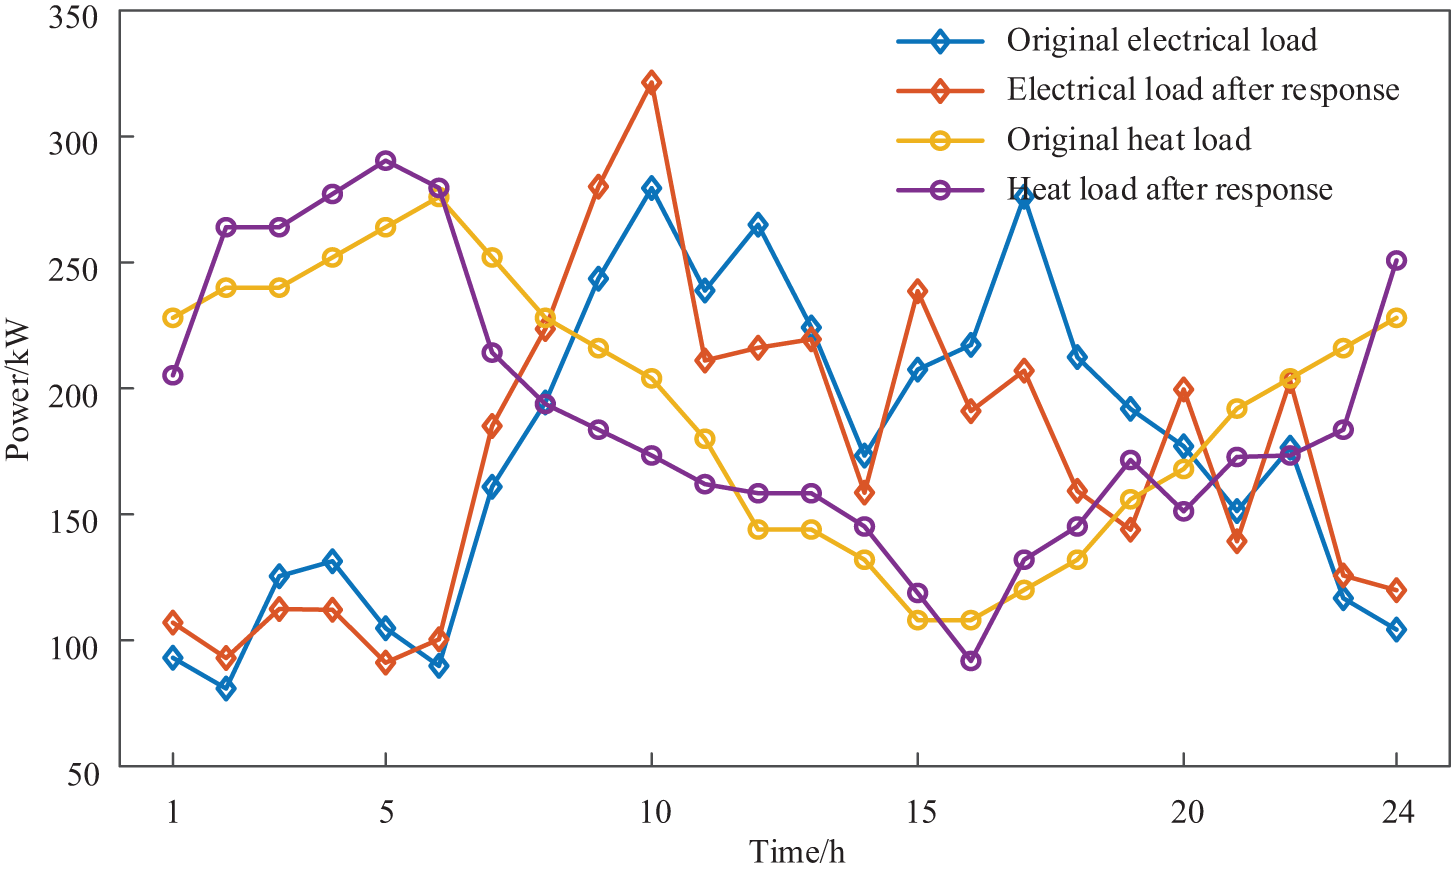
Figure 11: Comparison of electricity-heat load curves before and after the demand response
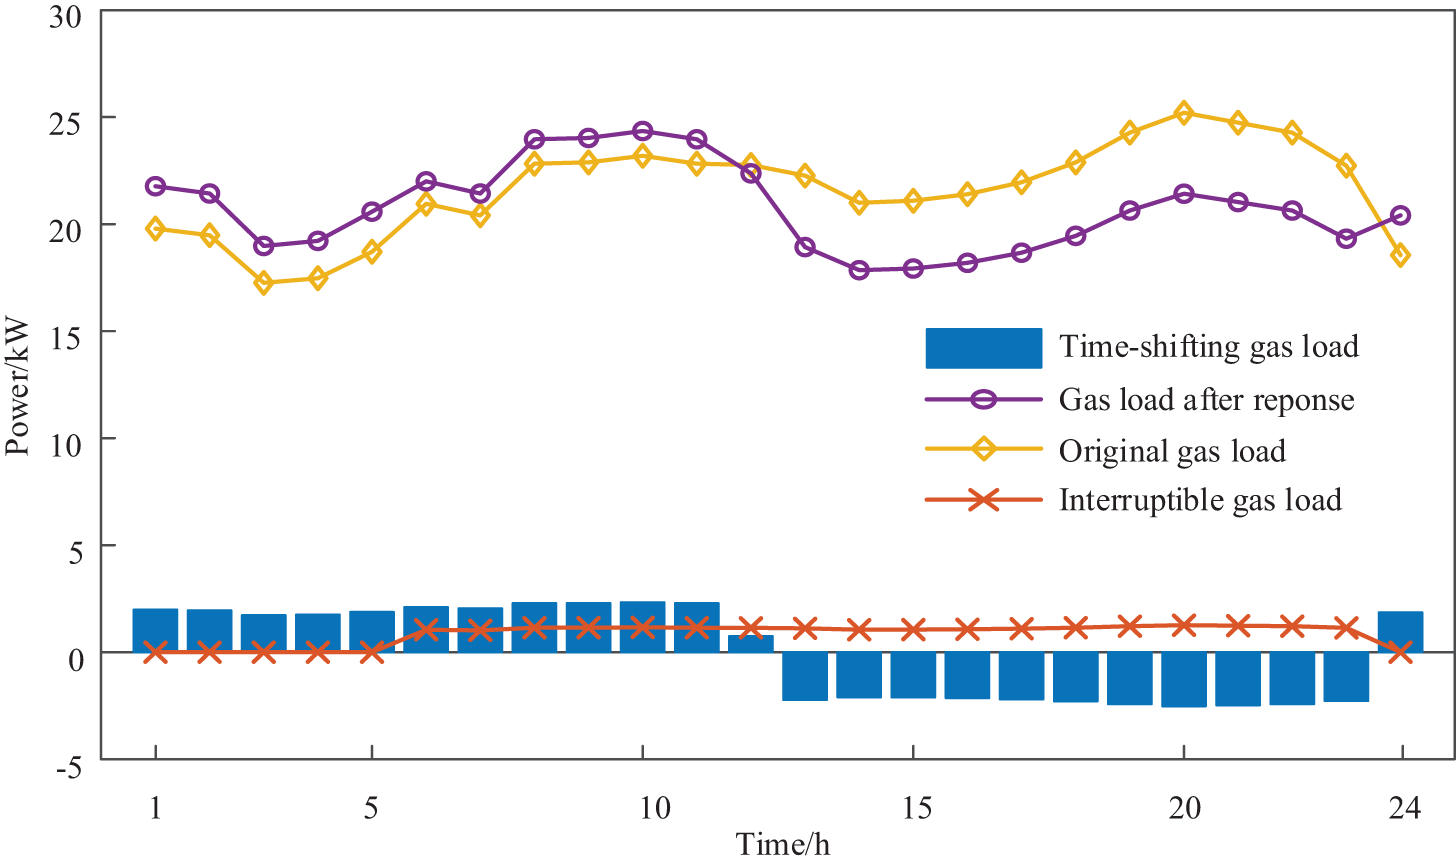
Figure 12: Comparison of the gas load curves before and after the demand response
In order to compare and analyze the impact of the supply-demand coordinated response on IEO-LA operation costs, load interruption power, and carbon emissions, four scenarios are set up for comparative analysis as follows. The impact analysis of the source-load response on IEO-LA is shown in Table 4.

Scenario 1: The source side of P2G, WHB, and WHP are ignored. The demand response of the electricity-heat-gas load is ignored on the load side.
Scenario 2: The source side of P2G, WHB, and WHP are ignored. The demand response of the electricity-heat-gas load is considered on the load side.
Scenario 3: The source side of P2G, WHB, and WHP are considered. The demand response of the electricity-heat-gas load is ignored on the load side.
Scenario 4: The source side of P2G, WHB, and WHP are considered. The demand response of the electricity-heat-gas load is considered on the load side at the same time.
Only the load demand response is considered in Scenario 2. Compared with Scenario 2, the operation cost of the upper IEO is reduced by 15.75%, the carbon emissions are reduced by 6.54%, and the load interruption power is reduced by 15.54% in Scenario 4. Moreover, the capture power of carbon capture is increased by 25.93% in Scenario 4. Only the source side devices are considered in Scenario 3. Compared with Scenario 3, the operation expense and carbon emissions of the lower LA are reduced by 11.13% and 3.05% in Scenario 4, respectively. The analysis shows that only considering the load demand response reduces the operation cost of the lower level. Only considering the source side devices decreases the operation cost of the upper level. Considering the source-load coordinate operation in Scenario 4 can decrease the operation cost of the upper and lower levels, and simultaneously reduce the carbon emissions and load interruption power, which can comprehensively coordinate the operation economy of the upper and lower levels.
The influence of different scenarios on the power output of the GT is shown in Fig. 13. The power output of the GT in Scenario 2 is greater than that in Scenario 1, due to the demand response moving part of the load into the period of low natural gas price to consume GT power. In addition, with the addition of waste heat equipment on the source side in Scenario 3, the energy utilization rate of the IIES is added by increasing the power output of the GT. The power output of the GT in Scenario 4 is larger only at 7:00–11:00 and lower than those of the other scenarios in other periods.
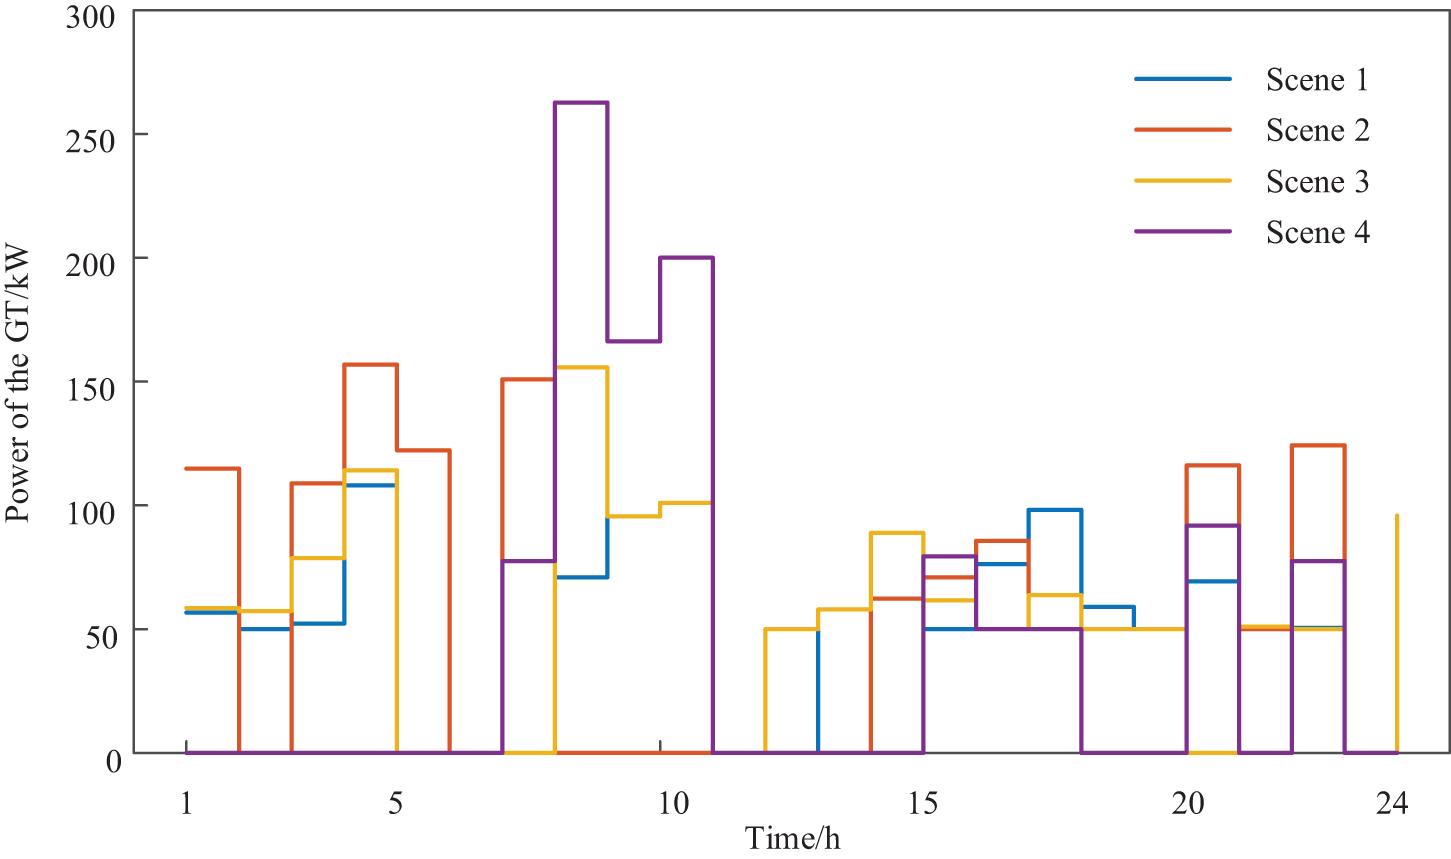
Figure 13: Influence of the demand response ratio on the economic operation of the IEO-LA
5.5 Parameter Sensitivity Analysis
The operation impact of the IEO-LA is analyzed by the parameter sensitivity of the demand response proportion and carbon emission interval. The impact of the operation economy and indicators in the IEO-LA is shown by demand response in Figs. 14 and 15, respectively. According to Fig. 14, with the increase in the proportion of load demand response, the operation cost of the lower level for IEO-LA gradually decreases, and the operation cost of the upper level shows a trend of first increasing and then decreasing. According to Fig. 15, the carbon emissions of the IEO-LA show a gradual downward trend, and the load interruption power shows a trend of first rising, then decreasing, and then rising. The analysis reveals that an increase in the demand response ratio enhances the operation flexibility of the load. The increase in load interruption power decreases the energy price set by the upper IEO, thereby reducing the operation expense of the lower LA and increasing the operation expense of the upper level. Simultaneously, as the demand response ratio continues to rise, the load flexibility is further enhanced. As a result, the lower LA reduces the energy purchase power from the gas unit of the upper IEO. The carbon emissions of the upper level are decreased in turn, and ultimately the operation cost of the upper IEO is reduced.
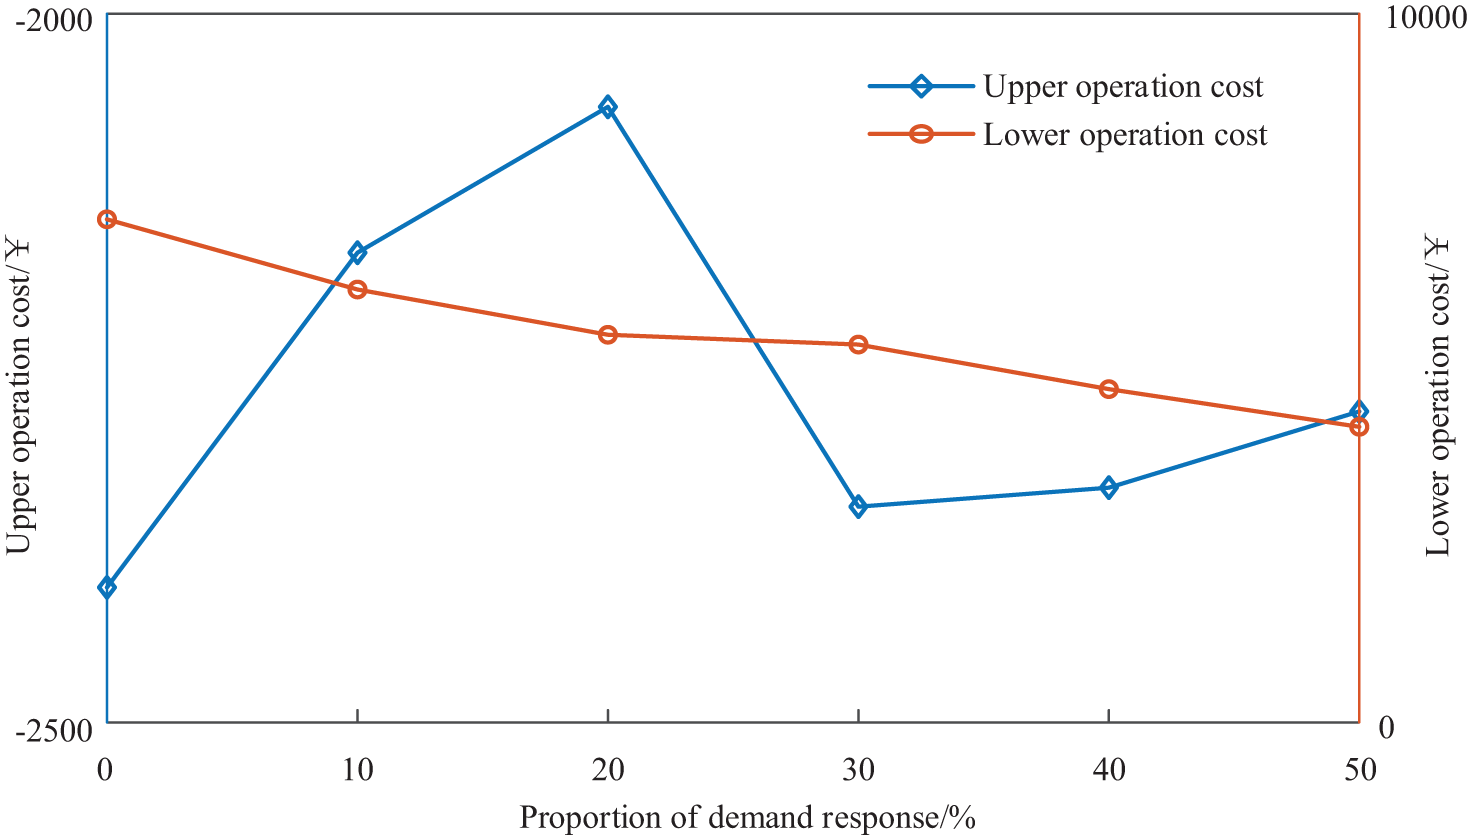
Figure 14: Impact of the operation economy in the IEO-LA is shown by demand response
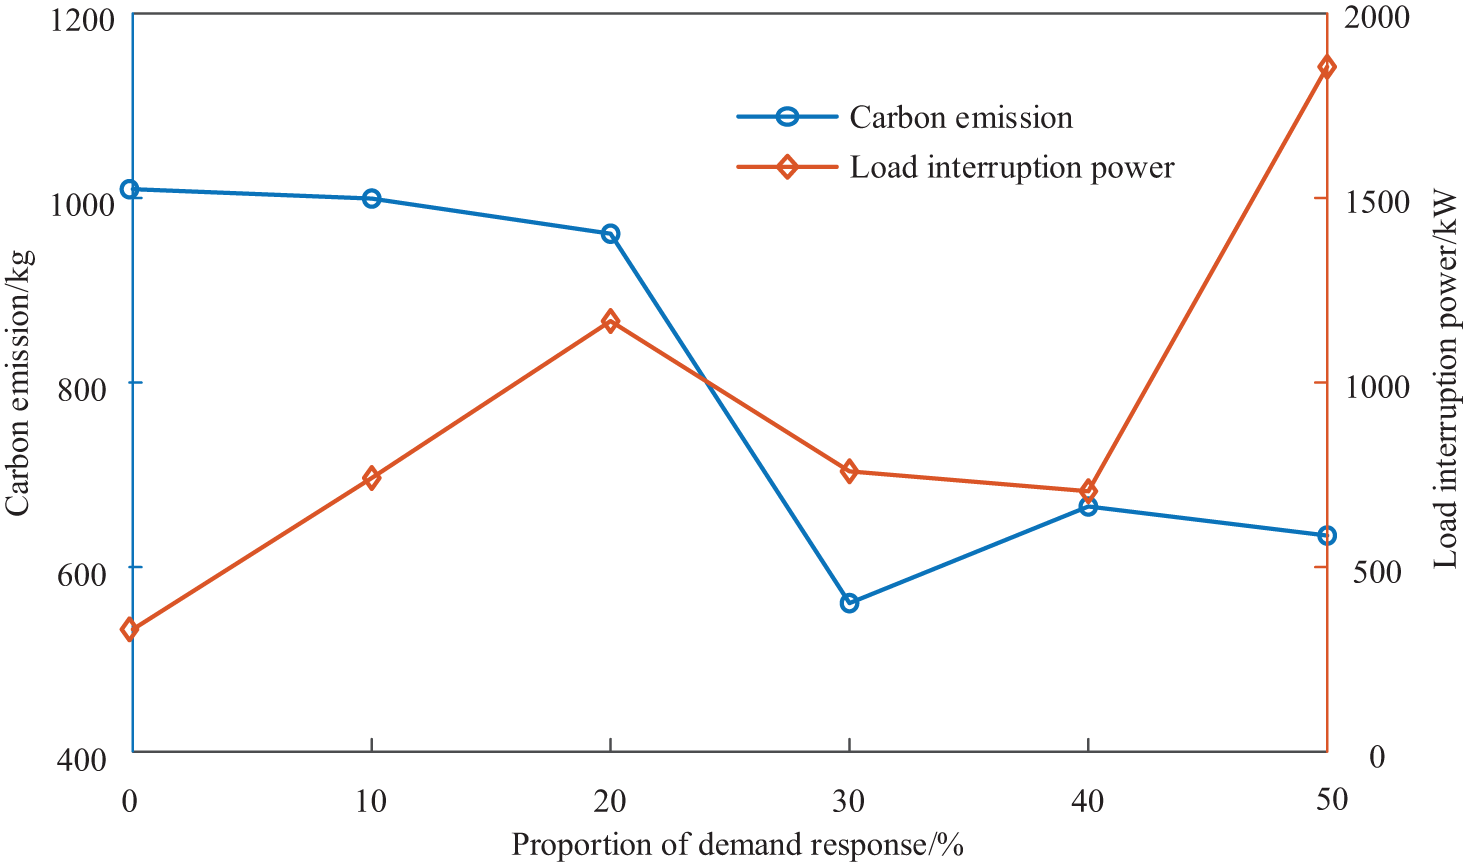
Figure 15: Impact of the operation indicators in the IEO-LA is shown by demand response
The impact of the operation economy and indicators in the IEO-LA is shown in the carbon emission interval parameters in Figs. 16 and 17, respectively. According to Fig. 16, with the continuous increase of the carbon emission interval of the upper IEO, the operation cost of the lower level shows a fluctuating upward trend, and the upper operation cost shows a fluctuating and decreasing trend. According to Fig. 17, the carbon emissions of the upper level show a fluctuating and rising trend, and the load interruption power of the lower LA shows a fluctuating and decreasing trend. The analysis shows that the increase of the carbon emission interval increases the carbon emissions of the upper IEO, increases the energy price of the upper level, and increases the operation cost of the lower level, then reduces the operation cost of the upper level. In addition, to reduce the energy purchase cost, the lower LA increases its load interruption power.
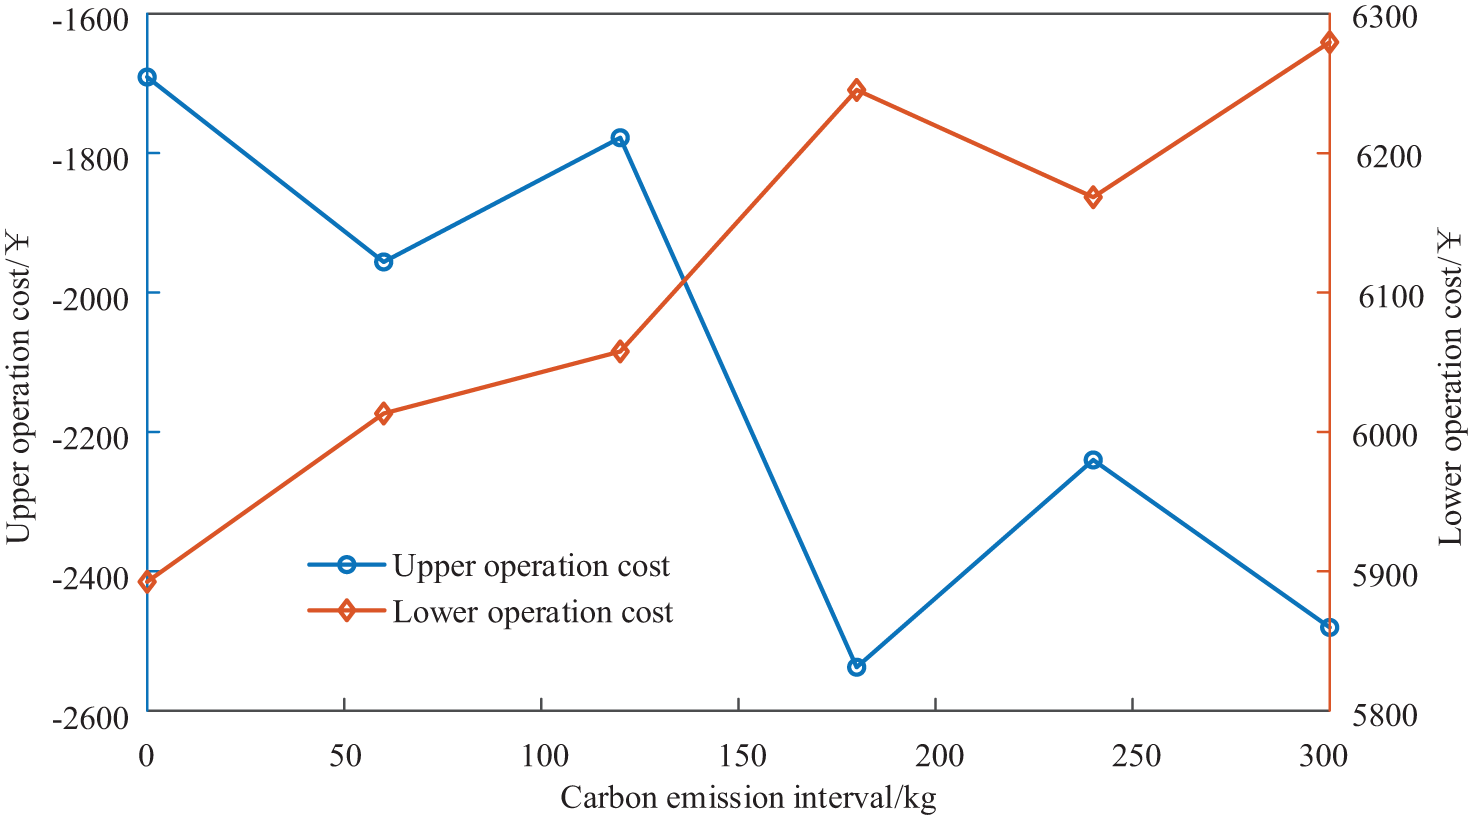
Figure 16: Impact of the operation economy in the IEO-LA is shown the carbon emission interval
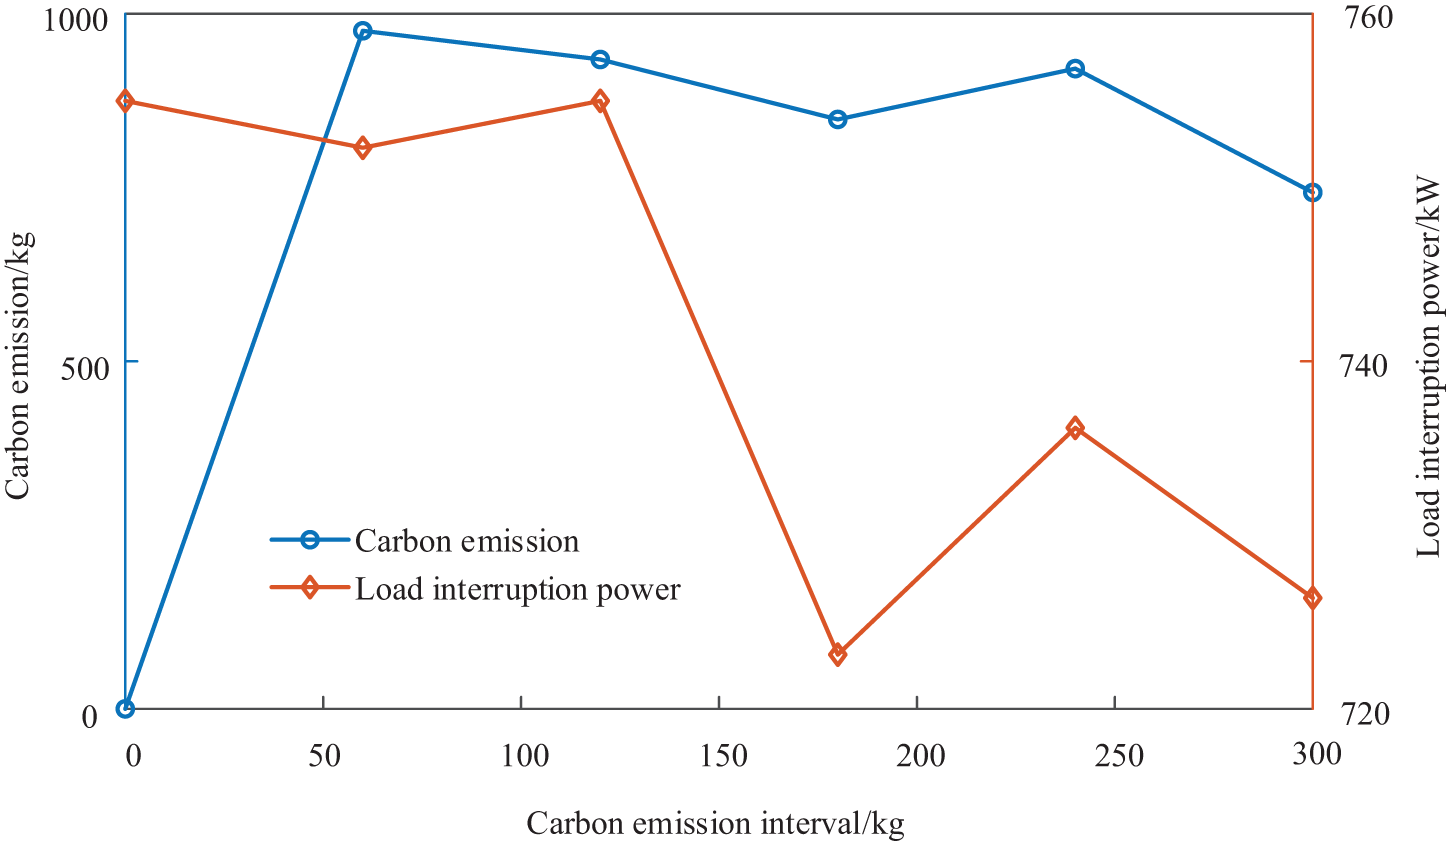
Figure 17: Impact of the operation indicators in the IEO-LA is shown the carbon emission interval
Under the dual-carbon background of ‘carbon peak, carbon neutrality’, to solve the interesting relationship between the upper IEO and the lower LA, a bilevel model is used to describe the master-slave relationship between the IEO-LA. Moreover, to coordinate the interests between the upper and lower levels, a dynamic pricing mechanism considering carbon emissions and load demand response factors is proposed. CPLEX solves the bilevel optimization model of the IEO-LA. The conclusions are as follows:
(1) In terms of the dynamic pricing mechanism, compared with other pricing methods, the proposed pricing mechanism reduces carbon emissions by 9.78% and load interruption power by 70.19%. Moreover, the capture power of carbon capture equipment is increased by 36.24%. By analyzing the impact of the load demand response and the carbon emissions on the pricing mechanism, these factors benefit the upper and lower levels, respectively. Only one factor is considered to lead to a biased operation on one side or the other. The proposed pricing mechanism contributes to reducing upper IEO carbon emissions and improving the lower LA load satisfaction level. By coordinating the source-load relationship between the upper and lower levels, the capture capacity of the carbon capture equipment is increased.
(2) In terms of the source-load coordinate operation, with the coordinate operation of the source-load, the operation cost of the lower LA is decreased by 14.88%, and the carbon emissions of the upper IEO are reduced by 22.87%. Furthermore, the output power of the carbon capture equipment is increased by 56.54%. Considering the P2G, WHB, on the source side and electricity-heat-gas load demand response on the load side simultaneously, the operation cost of the upper IEO and the lower LA can be reduced, and the carbon emissions and load interruption power of the IEO-LA can be effectively reduced. Using the above methods, the energy efficiency is improved, the cost is reduced, the flexibility and reliability of the system is enhanced, and the application of clean energy is promoted.
(3) In terms of parameter sensitivity, the proportion of the load demand response has a positive effect on reducing the operation cost of the lower LA and reducing the carbon emissions of the upper IEO. Moreover, the carbon emission interval has a certain promoting effect on increasing the operation cost of the lower level, decreasing the operation cost of the upper level, and increasing the interruption power of its load. The load demand response and carbon emission interval benefit the lower and upper levels of IEO-LA, respectively. The coordinate operation between the upper and lower levels can be achieved by reasonably setting the two parameters.
The paper studies the day-ahead scheduling of the IIES. In the next step, the day-ahead intraday real-time coordinate scheduling of the IIES is studied deeply. The scheduling results are closer to the actual value. The above methods can accelerate the clean transformation of the energy structure and promote the realization of low-carbon development goals.
Acknowledgement: The authors acknowledge the reviewers for providing valuable comments and helpful suggestions to improve the manuscript.
Funding Statement: This work is supported by the Central Government Guides Local Science and Technology Development Fund Project (2023ZY0020), Key R&D and Achievement Transformation Project in Inner Mongolia Autonomous Region (2022YFHH0019), the Fundamental Research Funds for Inner Mongolia University of Science & Technology (2022053), Natural Science Foundation of Inner Mongolia (2022LHQN05002), National Natural Science Foundation of China (52067018), Metallurgical Engineering First-Class Discipline Construction Project in Inner Mongolia University of Science and Technology, Control Science and Engineering Quality Improvement and Cultivation Discipline Project in Inner Mongolia University of Science and Technology.
Author Contributions: The authors confirm their contribution to the paper as follows: study conception and design: Xin Zhang; data collection: Jihong Zhang; analysis and interpretation of results: Peihong Yang, Daiwen He, Xiaoming Zhang; draft manuscript preparation: Mingming Yao. All authors reviewed the results and approved the final version of the manuscript.
Availability of Data and Materials: Data supporting this study are included within the article.
Ethics Approval: Not applicable.
Conflicts of Interest: The authors declare that they have no conflicts of interest to report regarding the present study.
References
1. Q. X. Zhou, H. Wang, and S. H. Ouyang, “Beautiful China construction based on carbon neutralization new technology,” (in Chinese), China Environ. Sci., vol. 44, no. 4, pp. 1777–1787, Apr. 2024. doi: 10.3969/j.issn.1000-6923.2024.04.001.CES. [Google Scholar] [CrossRef]
2. Y. Cui et al., “Source-load coordinated carbon reduction optimal scheduling of integrated energy system considering ultra-carbon demand response,” (in Chinese), Power Syst. Technol., vol. 48, no. 5, pp. 1863–1872, May 2024. doi: 10.13335/j.1000-3673.pst.2023.2278. [Google Scholar] [CrossRef]
3. Y. Yu, Q. Wu, Y. H. Huo, S. X. Gao, Y. X. Xia and X. L. Cai, “Low-carbon economic dispatch for integrated energy system based on Stackelberg game considering adaptive stepped carbon potential-carbon price and dual response of supply and demand,” (in Chinese), Power Syst. Technol., vol. 48, no. 7, pp. 2702–2714, Jul. 2024. doi: 10.13335/j.1000-3673.pst.2023.2287. [Google Scholar] [CrossRef]
4. S. Y. Ma, Y. Mi, S. Shi, D. D. Li, H. J. Xing and P. Wang, “Low-carbon economic operation of energy hub integrated with linearization model and nodal energy-carbon price,” Energy, vol. 294, no. 9, pp. 130754–130767, May 2024. doi: 10.1016/j.energy.2024.130754. [Google Scholar] [CrossRef]
5. Y. Wang, Z. K. Jin, Y. Q. Wang, M. Y. Liu, and J. Liang, “Low-carbon operation of park-level integrated energy system considering shared energy storage features of electric vehicles,” (in Chinese), Autom. Electr. Power Syst., vol. 48, no. 5, pp. 21–29, Mar. 2024. doi: 10.7500/AEPS20230424003. [Google Scholar] [CrossRef]
6. Y. J. Ye, H. J. Xing, Y. Mi, Z. Yan, and J. Dong, “Low-carbon optimal dispatching of integrated energy system considering low-carbon demand response and Stackelberg game,” (in Chinese), Autom. Electr. Power Syst., vol. 48, no. 9, pp. 34–43, May 2024. doi: 10.7500/AEPS20230419002. [Google Scholar] [CrossRef]
7. H. Hou, X. D. Ge, Y. L. Yan, Y. C. Lu, J. Zhang and Z. Y. Dong, “An integrated energy system “green-carbon offset mechanism and optimization method with Stackelberg game,” Energy, vol. 294, no. 22, pp. 130617–130633, May 2024. doi: 10.1016/j.energy.2024.130617. [Google Scholar] [CrossRef]
8. Z. J. Xiong, D. W. Zhang, and Y. F. Wang, “Optimal operation of integrated energy systems considering energy trading and integrated demand response,” Energy Rep., vol. 11, no. 4, pp. 3307–3316, Jun. 2024. doi: 10.1016/j.egyr.2024.03.010. [Google Scholar] [CrossRef]
9. Y. L. Wang et al., “Bi-level programming optimization method of rural integrated energy system based on coupling coordination degree of energy equipment,” Energy, vol. 298, no. 21, pp. 131289–131314, Jul. 2024. doi: 10.1016/j.energy.2024.131289. [Google Scholar] [CrossRef]
10. Q. J. Luo and J. Z. Zhu, “Optimal dispatch of integrated electricity and gas system based on modified alternating direction method of multipliers,” (in Chinese), Trans. China Electr. Soc., vol. 39, no. 9, pp. 2797–2809, May 2024. doi: 10.19595/j.cnki.1000-6753.tces.230292. [Google Scholar] [CrossRef]
11. H. J. Liang and S. Pirouzi, “Energy management system based on economic Flexi-reliable operation for the smart distribution network including integrated energy system of hydrogen storage and renewable sources,” Energy, vol. 293, no. 49, pp. 130745–130761, Apr. 2024. doi: 10.1016/j.energy.2024.130745. [Google Scholar] [CrossRef]
12. M. M. Samy, R. E. Almamlook, H. I. Elkhouly, and S. Barakat, “Decision-making and optimal design of green energy system based on statistical methods and artificial neural network approaches,” Sustain. Cities Soc., vol. 84, no. 1, pp. 104015–104036, Sep. 2022. doi: 10.1016/j.scs.2022.104015. [Google Scholar] [CrossRef]
13. P. F. Duan, M. D. Feng, B. X. Zhao, Q. W. Xue, K. Li and J. L. Chen, “Operational optimization of regional integrated energy systems with heat pumps and hydrogen renewable energy under integrated demand response,” Sustainability, vol. 16, no. 3, pp. 1217–1235, Jan. 2024. doi: 10.3390/su16031217. [Google Scholar] [CrossRef]
14. S. M. Wang, S. X. Wang, Q. Y. Zhao, X. Wang, and Z. R. Lin, “Distributed optimization of station-network collaborative operation and alliance benefit allocation for integrated energy system,” Int. J. Electr. Power Energy Syst., vol. 157, no. 1, pp. 109866–109883, Jun. 2024. doi: 10.1016/j.ijepes.2024.109866. [Google Scholar] [CrossRef]
15. Y. M. Li, J. J. Wang, and Y. H. Cao, “Multi-objective distributed robust cooperative optimization model of multiple integrated energy systems considering uncertainty of renewable energy and participation of electric vehicles,” Sustain. Cities Soc., vol. 104, no. 2, pp. 105308–105327, May 2024. doi: 10.1016/j.scs.2024.105308. [Google Scholar] [CrossRef]
16. S. Barakat, A. Emam, and M. M. Samy, “Investigating grid-connected green power systems’ energy storage solutions in the event of frequent blackouts,” Energy Rep., vol. 8, no. 5, pp. 5177–5191, Nov. 2022. doi: 10.1016/j.egyr.2022.03.201. [Google Scholar] [CrossRef]
17. L. Chen, D. D. Yang, J. Cai, and Y. Yan, “Robust optimization based coordinated network and source planning of integrated energy systems,” Int. J. Electr. Power Energy Syst., vol. 157, no. 3, pp. 109864–109882, Jun. 2024. doi: 10.1016/j.ijepes.2024.109864. [Google Scholar] [CrossRef]
18. J. H. Lin, Y. J. Gu, Z. J. Wang, Z. L. Zhao, and P. Zhu, “Operational characteristics of an integrated island energy system based on multi-energy complementarity,” Renew. Energy, vol. 230, pp. 120890–120904, Sep. 2024. doi: 10.1016/j.renene.2024.120890. [Google Scholar] [CrossRef]
19. J. D. Jia, H. Q. Li, D. Wu, J. C. Guo, L. L. Jiang and Z. M. Fan, “Multi-objective optimization study of regional integrated energy systems coupled with renewable energy, energy storage, and inter-station energy sharing,” Renew. Energy, vol. 225, pp. 120328–120346, May 2024. doi: 10.1016/j.renene.2024.120328. [Google Scholar] [CrossRef]
20. Y. Li, F. J. Bu, Y. Z. Li, and C. Long, “Optimal scheduling of island integrated energy systems considering multi-uncertainties and hydrothermal simultaneous transmission: A deep reinforcement learning approach,” Appl. Energy., vol. 333, no. 2, pp. 120540–120553, Mar. 2023. doi: 10.1016/j.apenergy.2022.120540. [Google Scholar] [CrossRef]
21. M. Li et al., “Two-stage optimal scheduling of community integrated energy system,” Energy Eng., vol. 121, no. 2, pp. 405–424, Jan. 2024. doi: 10.32604/ee.2023.044509. [Google Scholar] [CrossRef]
22. S. Hoseinzadeh, D. A. Garcia, and L. Z. Huang, “Grid-connected renewable energy systems flexibility in Norway islands’ Decarbonization,” Renew. Sustain. Energy Rev., vol. 185, no. 3, pp. 113658–113675, Dec. 2023. doi: 10.1016/j.rser.2023.113658. [Google Scholar] [CrossRef]
23. J. R. Guo, Y. Xiang, J. J. Wu, and G. Wu, “Low-carbon optimal scheduling of integrated electricity-gas energy systems considering CCUS-P2G technology and risk of carbon market,” (in Chinese), Proc. CSEE, vol. 43, no. 4, pp. 1290–1303, Feb. 2023. doi: 10.13334/j.0258-8013.pcsee.221255. [Google Scholar] [CrossRef]
24. G. Liang, Y. Wang, B. Sun, and Z. Zhang, “An optimization method for the distributed collaborative operation of multilateral entities considering dynamic time-of-use electricity price in active distribution network,” Energies, vol. 17, no. 2, pp. 359–378, Jan. 2024. doi: 10.3390/en17020359. [Google Scholar] [CrossRef]
25. W. K. Gao, C. He, T. Q. Liu, L. Nan, M. Zhang and T. X. Wang, “Multi-package game pricing method of user-side shared energy storage considering coordinated operation of microgrid alliance,” (in Chinese), Electr. Power Autom. Equip., vol. 44, no. 9, pp. 16–23, Sep. 2024. doi: 10.16081/j.epae.202404009. [Google Scholar] [CrossRef]
26. R. Li, H. M. Lyu, X. Z. Peng, B. Q. Wang, and J. Y. Zhu, “Optimization strategy for low-carbon cooperation of multi-district integrated energy service providers considering dynamic pricing and carbon trading,” (in Chinese), Acta Energ. Sol. Sin., vol. 45, no. 3, pp. 337–346, Mar. 2024. doi: 10.16081/j.epae.202404009. [Google Scholar] [CrossRef]
27. H. J. Zhang, T. Ding, Y. H. Huang, L. S. F. Xie, Y. K. He and X. Q. Sun, “Pricing and cost allocation methods for capacity charges of pumped storage power stations in electricity market environment,” (in Chinese), Autom. Electr. Power Syst., vol. 48, no. 11, pp. 88–99, Mar. 2024. doi: 10.16081/j.epae.202404009. [Google Scholar] [CrossRef]
28. H. Kariman, M. Khiadani, S. Hoseinzadeh, S. Shoeibi, and A. Shafieian, “Evaluation of mechanical vapor recompression and easy multi-effect desalination systems in different climate conditions-sensitivity and 7E analysis,” Desalination, vol. 582, no. 5, pp. 117601–117622, Aug. 2024. doi: 10.1016/j.desal.2024.117601. [Google Scholar] [CrossRef]
29. K. C. Liu, G. T. Wang, X. Z. Bai, X. Y. Yuan, L. J. Ge and R. Y. Zhu, “Dynamic pricing and low-carbon economic dispatch of integrated energy system based on Stackelberg game,” (in Chinese), High Voltage Eng., vol. 50, no. 4, pp. 1436–1445, Apr. 2024. doi: 10.13336/j.1003-6520.hve.20230411. [Google Scholar] [CrossRef]
30. Z. S. Zhang, X. H. Du, Y. K. Shang, J. S. Zhang, W. Zhao and J. Su, “Research on demand response potential of adjustable loads in demand response scenarios,” Energ. Eng., vol. 121, no. 6, pp. 1577–1605, May 2024. doi: 10.32604/ee.2024.047706. [Google Scholar] [CrossRef]
31. S. W. Zhong, Y. B. Che, and S. Y. Zhang, “Electric vehicle charging load optimization strategy based on dynamic time-of-use tariff,” Energy Eng., vol. 121, no. 3, pp. 603–618, Feb. 2024. doi: 10.32604/ee.2023.044667. [Google Scholar] [CrossRef]
32. Y. Li, M. Han, Z. Yang, and G. Q. Li, “Coordinating flexible demand response and renewable uncertainties for scheduling of community integrated energy systems with an electric vehicle charging station: A bi-level approach,” IEEE Trans. Sustainable Energy, vol. 12, no. 4, pp. 2321–2331, Jun. 2021. doi: 10.1109/TSTE.2021.3090463. [Google Scholar] [CrossRef]
33. J. Gu, K. F. Bai, and Y. J. Shi, “Optimized operation of regional integrated energy system based on multi-agent master-slave game optimization interaction mechanism,” (in Chinese), Power Syst. Technol., vol. 43, no. 9, pp. 3119–3134, Sep. 2019. doi: 10.1109/TSTE.2021.3090463. [Google Scholar] [CrossRef]
Cite This Article
 Copyright © 2025 The Author(s). Published by Tech Science Press.
This work is licensed under a Creative Commons Attribution 4.0 International License , which permits unrestricted use, distribution, and reproduction in any medium, provided the original work is properly cited.


 Submit a Paper
 Propose a Special lssue
 View Full Text
 Download PDF
 Downloads
 Citation Tools