 Open Access
ARTICLE
Energy Efficiency of a Solar Green Building Using Bio-Sourced Materials for Indoor Temperature and Humidity Optimization
1 National School of Architecture Agadir, New Complex Ibn Zohr, Agadir, BP 20732, Morocco
2 EMDD, CERNE2D, University of Mohammed V in Rabat, Est Sale, Sale, BP 227, Morocco
3 Thermodynamics and Energetics Laboratory, Faculty of Science, Ibn Zohr University, Agadir, BP 8106, Morocco
4 Faculty of Built Environment, University Sains Islam Malaysia, Nilai, BP 71800, Malaysia
5 Architectural Engineering Department, Najran University, Najran, BP 1988, Saudi Arabia
6 The Centre of Scientific and Engineering Research, Najran University, Najran, BP 1988, Saudi Arabia
7 Euro-Mediterranean School of Architecture, Design and Urbanism, Euro-Mediterranean University of Fez, Fez, BP 51, Morocco
* Corresponding Author: Soumia Mounir. Email:
Energy Engineering 2025, 122(1), 41-62. https://doi.org/10.32604/ee.2024.057125
Received 08 August 2024; Accepted 11 November 2024; Issue published 27 December 2024
Abstract
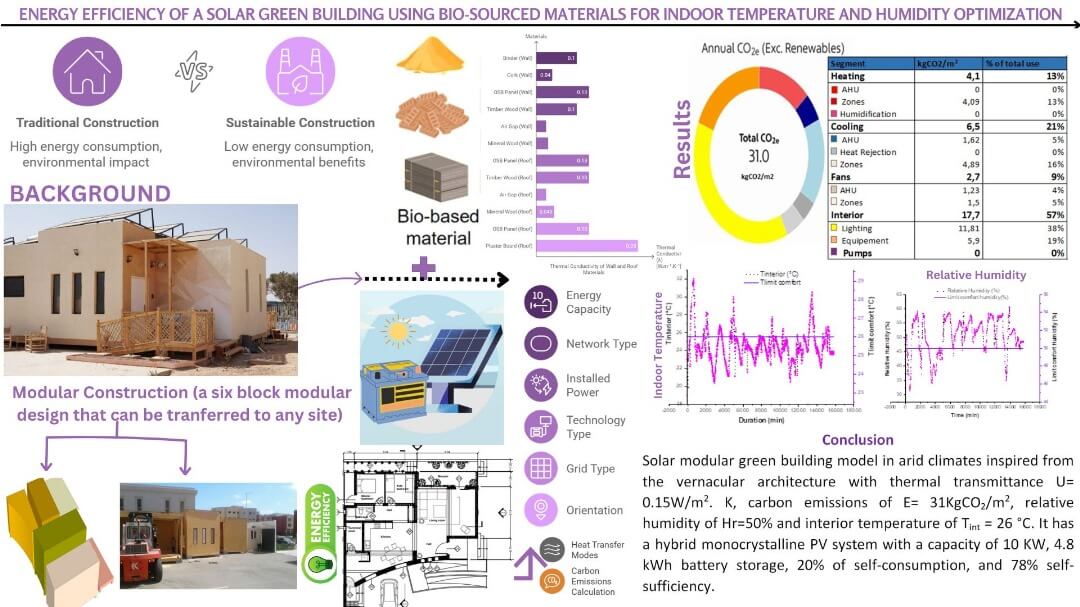
A clean environment with low carbon emissions is the goal of research on the development of green and sustainable buildings that use bio-sourced materials in conjunction with solar energy to create more sustainable cities. This is particularly true in Africa, where there aren’t many studies on the topic. The current study suggests a 90 m2 model of a sustainable building in a dry climate that is movable to address the issue of housing in remote areas, ensures comfort in harsh weather conditions, uses solar renewable resources—which are plentiful in Africa—uses bio-sourced materials, and examines how these materials relate to temperature and humidity control while emitting minimal carbon emissions. In order to solve the topic under consideration, the work is split into two sections: numerical and experimental approaches. Using TRNSYS and Revit, the suggested prototype building is examined numerically to examine the impact of orientation, envelope composition made of bio-sourced materials, and carbon emissions. Through a hygrothermal investigation, experiments are conducted to evaluate this prototype’s effectiveness. Furthermore, an examination of the photovoltaic system’s production, consumption, and several scenarios used to maximize battery life is included in the paper. Because the biosourced material achieves a thermal transmittance of 0.15 (W.m−2.K−1), the results demonstrate an intriguing finding in terms of comfort. This value satisfies the requirements of passive building, energy autonomy of the dwelling, and injection in-network with an annual value of 15,757 kWh. Additionally, compared to the literature, the heating needs ratio is 6.38 (kWh/m2.an) and the cooling needs ratio is 49 (kWh/m2.an), both of which are good values. According to international norms, the inside temperature doesn’t go above 26°C, and the humidity level is within a comfortable range.Graphic Abstract
Keywords
Nomenclature
| λ | Thermal conductivity (W.m−1.K−1) |
| e | Thickness (m) |
| ρ | Density (kg.m−3) |
| T | Temperature (°C) |
Africa suffers from severe environmental issues as a result of its high energy consumption, particularly in the building industry, where bio-sourced materials and renewable energy are not used. One potential solution to lower electricity usage and provide suitable living conditions for residents is the creation of solar towns made up of passive buildings, which will be replicated in the urbanism model. Nonetheless, one renewable energy source that can be utilized is solar electricity. The International Energy Agency (IEA) report [1] outlines the most effective ways for a hot continent to manage energy and reduce its carbon emissions, particularly for Africa. Green and sustainable construction could help lessen environmental issues in Africa, a continent renowned for its high population. In this study, the authors attempted to present a novel concept of green architecture that uses solar energy as its primary source of energy and is constructed from bio-sourced materials. The home under study was constructed for the international Solar Decathlon Africa competition in Benguerir, a city renowned for its arid climate with a moderate degree of severity [2].
Studies of the literature on green and passive homes and their effects on the environment were conducted, taking into account both passive and active solutions. The new energy building performance directive [3] states that advancements in material efficiencies and the energy demand of gas heating were taken into account when determining the best retrofit packages to be employed in Irish homes in order to attain nearly zero energy buildings. From the perspectives of households and society, the study also includes life cycle environmental and financial indicators, including energy consumption, acidification potential, eutrophication potential, ozone depletion potential, and photochemical ozone production potential (POCP). In Ireland, a building is considered almost zero-energy when it meets a performance criterion of 125 kWh/m2/yr. This report made it clear why our investigation has taken the choice of biosourced materials in the proposed prototype of passive and low-carbon buildings.
The results of implementing actual building energy efficiency in building energy labeling (BEEL) in the Shanghai case study were examined by Yu et al. [4]. They showed that while the office building has a normal ration performance of 79.14 kWh/(m2.an), there is a negative correlation between energy conservation and energy consumption for the residential building. Additionally, the writers suggest a few effective air conditioning solutions. Depending on the type of building, ground-source heat pumps and adjusting the refrigerant amount are the best choices for commercial office buildings. While solar energy harvesting, daylighting, and ground solar heat pumps (GSHP) are the greatest choices for residential buildings, the best solutions for public buildings include gadgets, building automation systems (BAS), heat recovery, and variable water systems. are more beneficial in terms of reducing energy. However, the authors assert that technical, political, and awareness constraints impede the BEEL’s application. In order to determine the annual ratio in kWh/(m2.an) and provide justification for our residential home’s split system with variable volume refrigerant, this study encourages writers to compute the energy requirements for heating and cooling.
By examining the effectiveness of photovoltaic/thermal technology (PVT) used to provide hot domestic water in Western Europe, Brottier et Bennacer’s study [5] demonstrated interest in the use of hybrid solar energy in buildings. In terms of preheating water to a maximum temperature of 45°C for five months of the year, the results showed that the PVT-Heating solar domestic water (SDWH) solar domestic hot water technology is profitable. Additionally, the outcomes showed how effective the non-overglazed PVT collector was. The adoption of the photovoltaic system utilized in our research to benefit from plentiful free energy in dry climates in African countries is justified by our study, which highlights the significance of solar energy in terms of obtaining free electricity and hot household water for five months of the year.
Rashid et al.’s work [6] evaluated a review of the use of phase change materials (PCMs) in building envelopes; they investigate the impact of PCM material in residential structures on roofs with varying inclination angles and ceilings. Additionally, an analysis of the PCM materials’ location within the envelope has been conducted. According to the results, the (PCMs) considerably lessened the intensity of summertime high temperatures, the amount of time that temperatures rose above the range of thermal comfort, and the requirement for cooling. When considering the roof’s structure time, decrement factor, melting and solidification cycle, and daily heat factor, the best results are achieved when a PCM layer is incorporated at a temperature of 2°C in the ceiling. Methyl stearate and diatomite (FSPCM) in gypsum board can reduce cooling demand by 16.2%. In comparison to asphalt roofs, thermochromic (TC), phase change material (PCM), and thermos-chromic/phase change material (TC/PCM) roofs have been found to save 13%, 15%, and 17% more energy when PCMs are used in roofs. The authors of this study demonstrate the significance of selecting materials with high thermal inertia in order to improve interior comfort in residential homes.
The work of Rashid et al. [7] studied the benefits of using the bio-based phase change materials (BPCMs) as a replacement of phase change material (PCM), which uses fossil resources (BPCMs) present several advantages, such as the reduction of the of the risk of oxidation even after an extensive number of melting and solidification cycles compared to paraffin wax. Their production may be increased by using animal fat combinations and oils, which are abundant, cheap, and sustainable materials. The selection of BPCM bio-based materials, phase change mechanisms, combinations, processing, and applications are all covered in detail in this work. Our decision to use biosourced materials in our building envelope is justified by this study, which explains the advantages of doing so in place of industrial products.
In their review of the research on green buildings in South Africa, Agbajor et al. [8] found that financing schemes, the use of cutting-edge technologies, the promotion of green and sustainable building throughout the institution, and studies on environmentally friendly safe building were all necessary. However, our work suggests a research study that starts with the idea, incorporates the new technology, and takes two years to complete. The final step is the production of an actual prototype of an energy-autonomous, green, and sustainable building.
By analyzing the life cycle cost and evaluating the environmental impact of those printed homes in the challenging context of an African urban model, Moghayed et al.’s study [9] explored the economic viability of using 3D printing technology to address the continent’s building crisis. However, our research’s model offers a mobile and sustainable home that can be moved to any location to address the housing crisis in a continent that struggles with the extension of the urbanization model outside of cities.
Feather waste provides good thermal and acoustic insulation when combined with phase change material as insulation, reducing the cooling load and electricity cost, as shown by Abdulmunem et al. [10]. The researchers created a unique bio-composite material for polyvinyl chloride panels using phase change material (PCM) and waste chicken feathers (WCF). The testing room in Baghdad city experienced improvements in acoustic insulation of 9%, a reduction in cooling load of 20.3%, and an increase in power cost savings of 22.5% after a 75% integration of waste chicken feather (WCF). These findings imply that because of the intriguing features of additions and the enhancement of the thermal efficiency, the researchers attempted to manage the use of waste sheep wool as insulation in buildings because of the intriguing features of additions and the enhancement of materials’ mechanical and thermal properties.
Rashid et al. [11] investigated the effect of phase change materials (PCMS) on radiant heating and cooling system performance. It illustrates the challenges associated with phase change material (PCM). The findings demonstrated that 10 mm phase change material (PCM) reduced heating consumption by 2.4% annually. However, a PCM range of 20 to 50 mm enables annual heating energy savings of 7.3% to 15.3%. Additionally, radiant floor systems can save energy use by up to 8%. The authors of this study are encouraged to investigate the advantages of materials in terms of energy requirements for heating and cooling as well as interior temperature control.
The two components of our study are experimental and numerical analysis. In terms of the numerical aspects, it addresses the house’s architecture and the modeling of the suggested prototype building by examining the factors that affect energy consumption, such as carbon emissions, orientation, and envelope composition. The experimental portion focuses on the prototype’s effectiveness in meeting the requirements of indoor comfort in relation to outdoor temperature and humidity behavior. The authors hope to replicate this prototype in order to create solar villages in Africa. Additionally, a research was conducted on the application of photovoltaic systems to this prototype, examining the monitoring system and discussing energy consumption and network injection. Additionally, as the primary crucial parts of the photovoltaic system, the various lifespan scenarios of the battery were examined. With regard to energy management and carbon emissions, the effort aims to provide a worldwide perspective on the benefits of implementing a passive model in African homes.
The novelty of our work is that it includes comprehensive research that includes a deep reflection on the concept of a movable house that is comfortable, integrates new technologies, presents low carbon emissions, is autonomous in terms of energy, and injects energy in the network—something that is new in Africa. This will encourage the government to amend the new building code permitting residential houses to inject energy in the network, something that will also generate income for the residents of those houses. A lot of research has been done in European, Australian, and American countries, but not much of the African context. In light of the dearth of research on passive and green building in Africa, theoretical and applied research in this area is required. This research must address the harsh environmental conditions, use biosourced materials and cutting-edge technologies, ensure the comfort of its residents, and integrate renewable energy sources like solar energy in a hot continent. This will help to solve the housing crisis and the use of fossil fuels.
Our research’s goals and research gap are to provide a mobile, environmentally friendly, and sustainable housing model for Africa that can solve the housing crisis in remote areas, run on renewable energy, be energy-independent, reduce the need for fossil fuels, use biosourced materials, ensure comfort in arid climates in accordance with international standards, and emits minimal amounts of carbon dioxide into the atmosphere.
2.1 Description of the Studied House
The house studied, which has an area of 90 m2, as described in Fig. 1, is composed of two bedrooms, a kitchen, a bathroom, a loggia, and a living area. Located in Benguerir City, known for its dry climate, the house contains three accessibility ways according to Fig. 2 (from the principal entrance, from the kitchen, and from the terrace near the logia). The concept of the house has been inspired by the old medina of Fez. The authors played on the concept of different parameters, such as a good distribution of the spaces according to the orientation, assuring the privacy of the different spaces, varying the height from one space to another, limiting openings on the south orientation, and assuring different ways’ accessibility of the house studied.
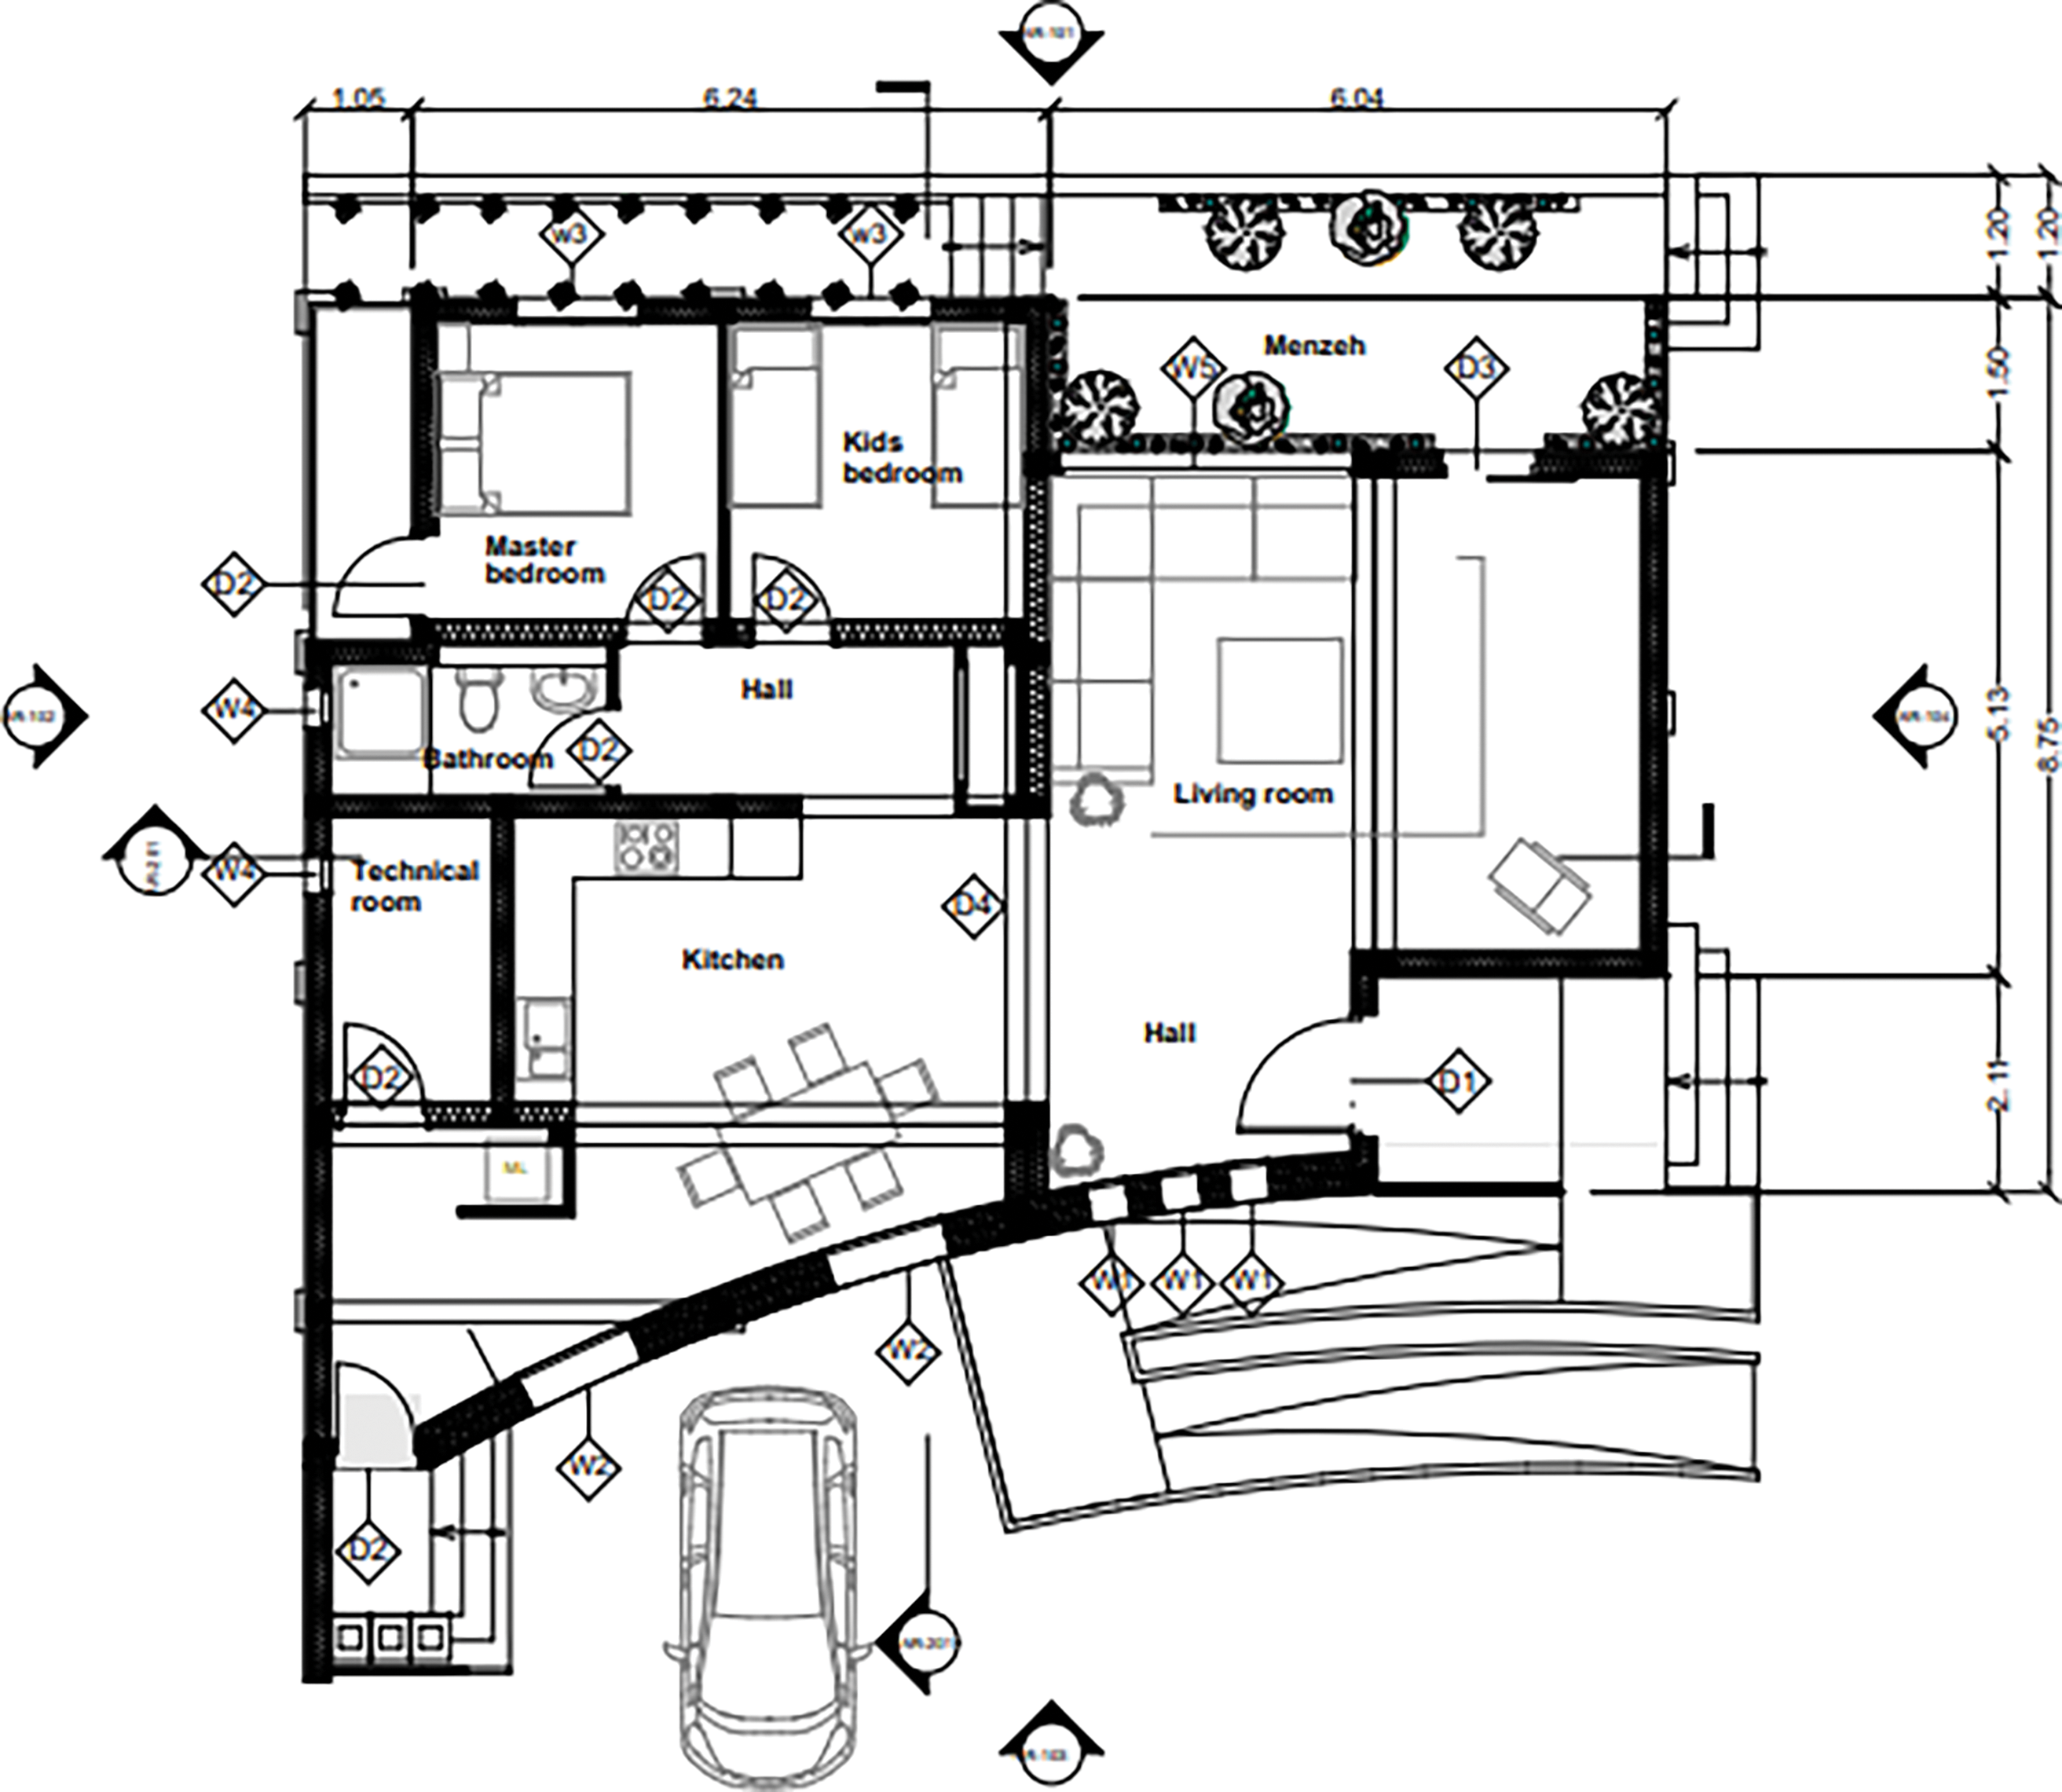
Figure 1: Floor plan of the investigated building
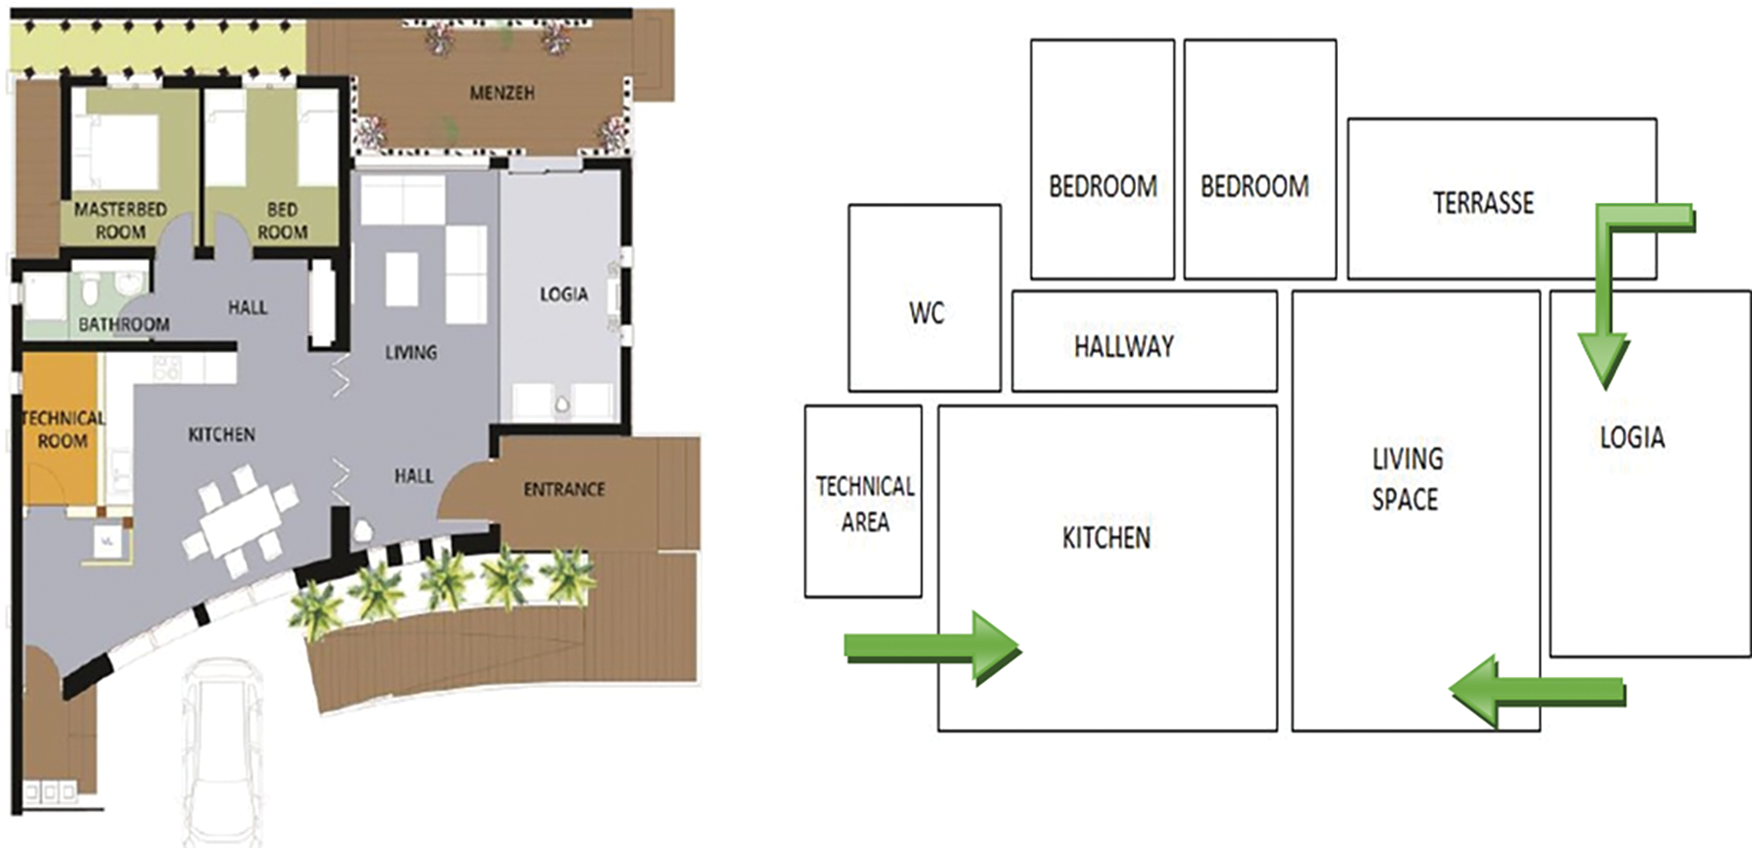
Figure 2: The accessibility and functionality building scheme
The real prototype of A’freehome is represented in Fig. 3. The house is movable and composed of six blocks, as represented in Fig. 4.
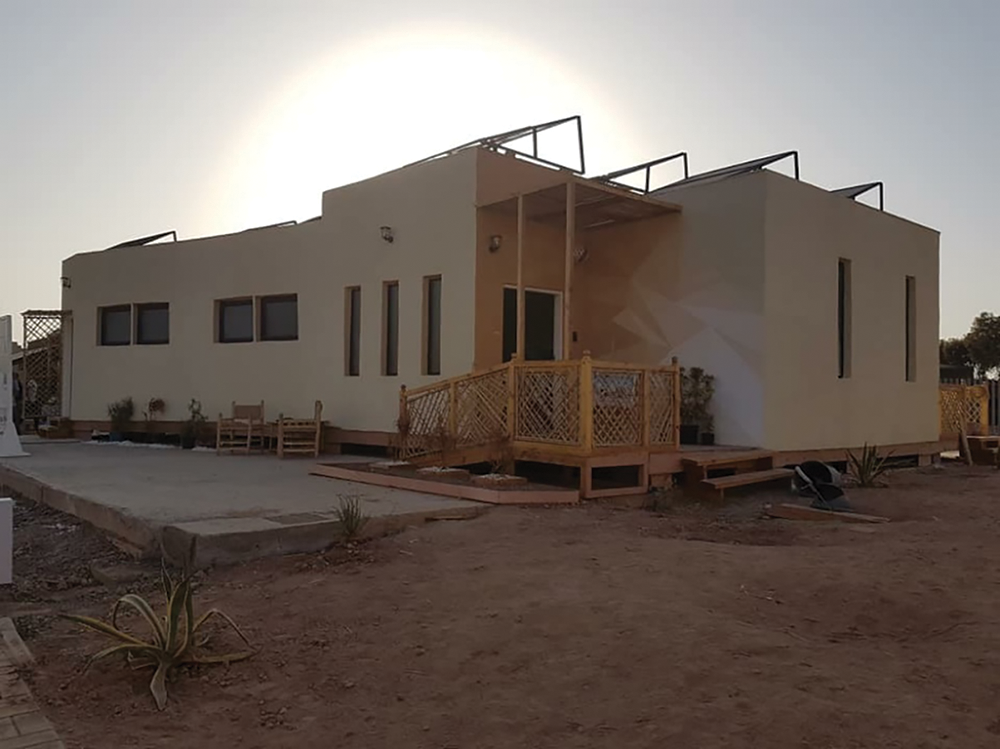
Figure 3: The real prototype of the house studied
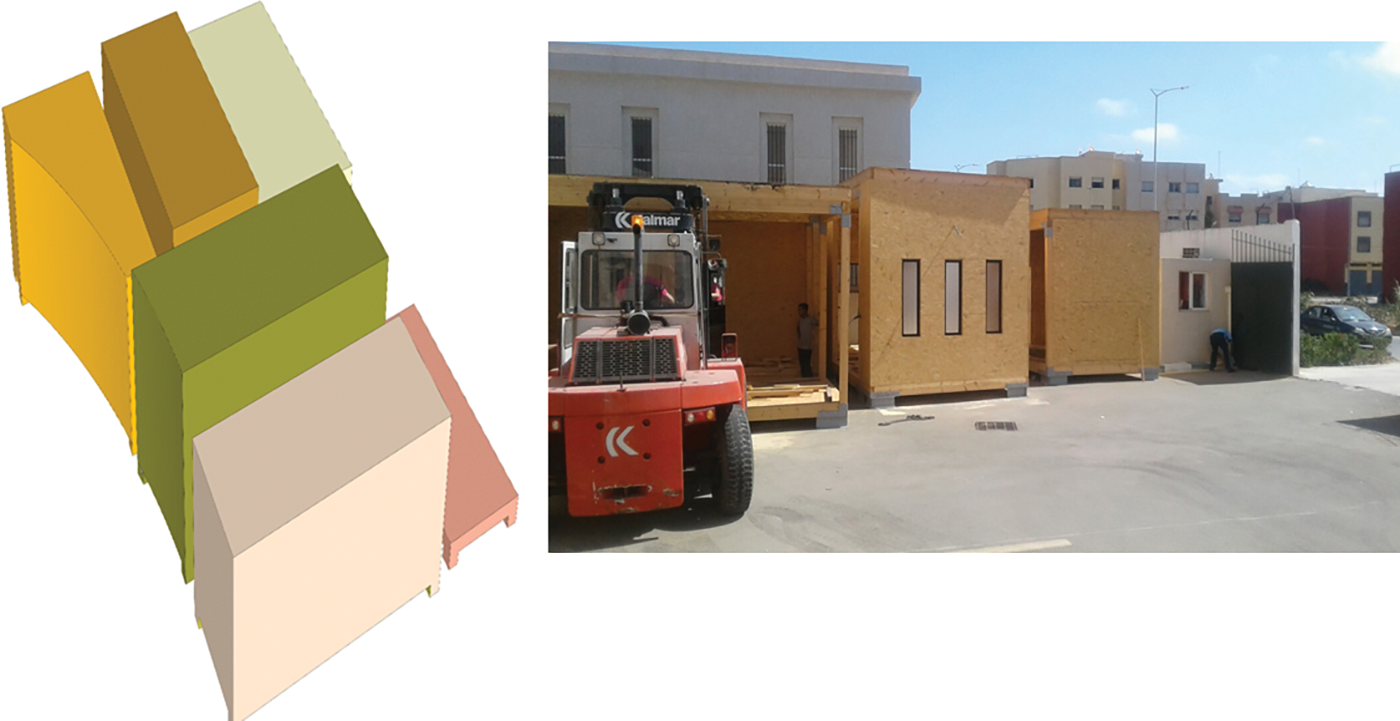
Figure 4: The different blocks of the A’freehome house
2.2 Description of Materials, Modeling Parameters and Photovoltaic System
For this design, cork, as shown in Fig. 5, is proposed as a facade material to reduce heat. The cork used is coming from the forest of Maamora, Morocco, and without losing any heat resistance, it may be cut and changed on the construction site [12]. It has a negative environmental footprint (−735 CO2/t) [13]. The employed cork has an apparent density of 160 kg.m−3; the thermal conductivity is 0.05 W. m−1.K−1.
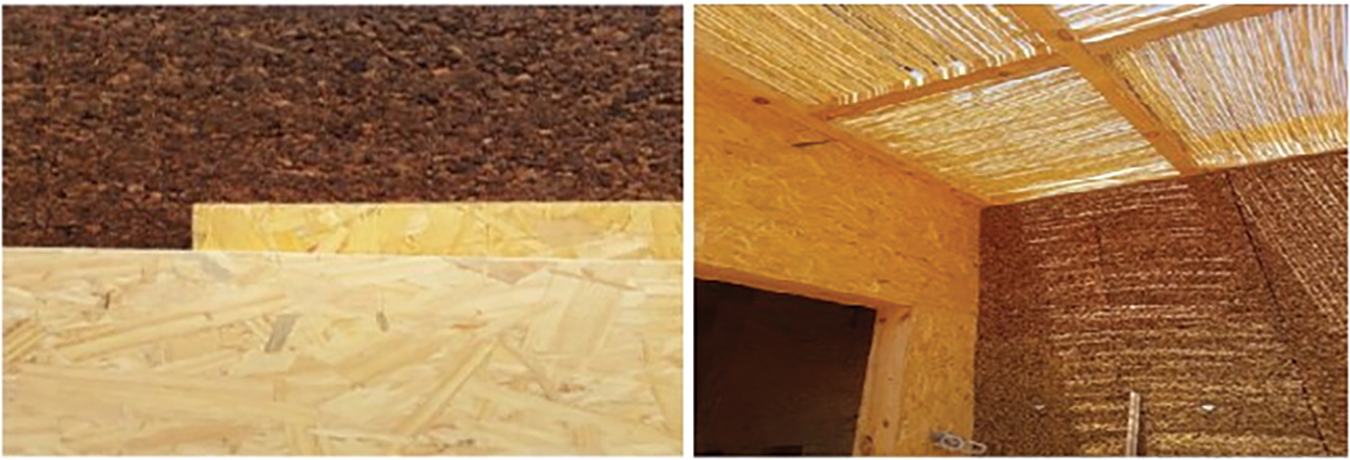
Figure 5: Oriented Strand Board (OSB) panel, Cork, and Reed used
The wood used is the kind of OSB-oriented strand board reinforced with panels of wood in the main structure, as shown in Fig. 5. The density of used cork is 600 kg.m−3; the thermal conductivity [14] is 0.13 W.m−1.K−1.
The entrance of the house was protected by the reed, as shown in Fig. 5, even if the stair railing of the terraces. The density of the used reed is 132 kg.m−3; and the thermal conductivity [15] is 0.053 W.m−1.K−1.
2.2.4 Description of Walls and Roof Compositions
The roof’s composition has been described in Fig. 6.
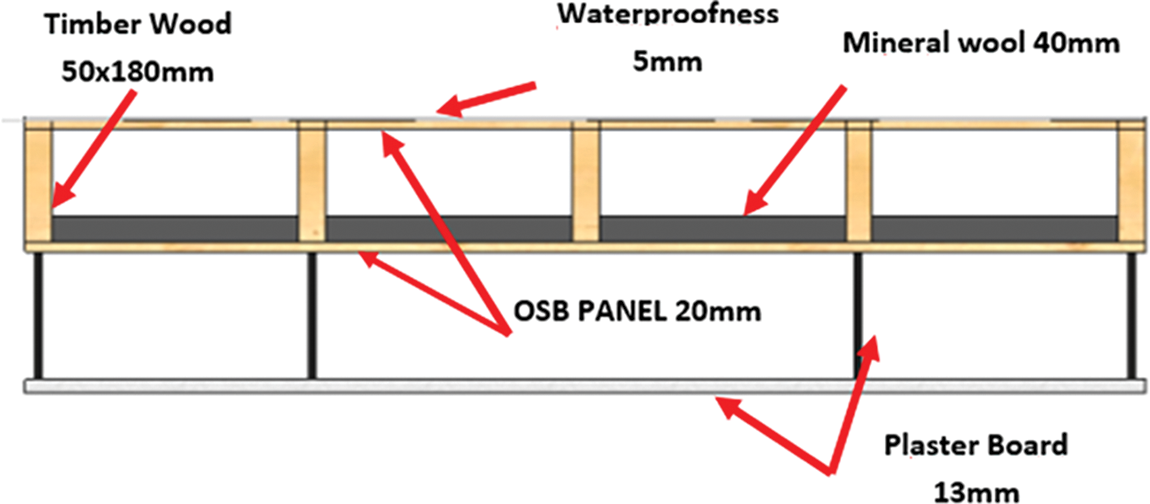
Figure 6: Roof’s composition
2.3 Description of the Air Conditioning System
The system used in this house is the variable refrigerant flow split system, containing one exterior unit which controls four interior units. The size’s air conditioning installation is 5 kW as load capacity; the house is occupied by five people, with a rate of ventilation of 5 V/h, using the double-flow fan. The summer set point of the air conditioning system is 26°C.
2.4 Description of the Photovoltaic System
The house studied is autonomous in term of energy with a capacity of 10 kW, it functions by a photovoltaic system with a storage system using batteries of 4.8 kWh as a capacity as shown in Fig. 7.
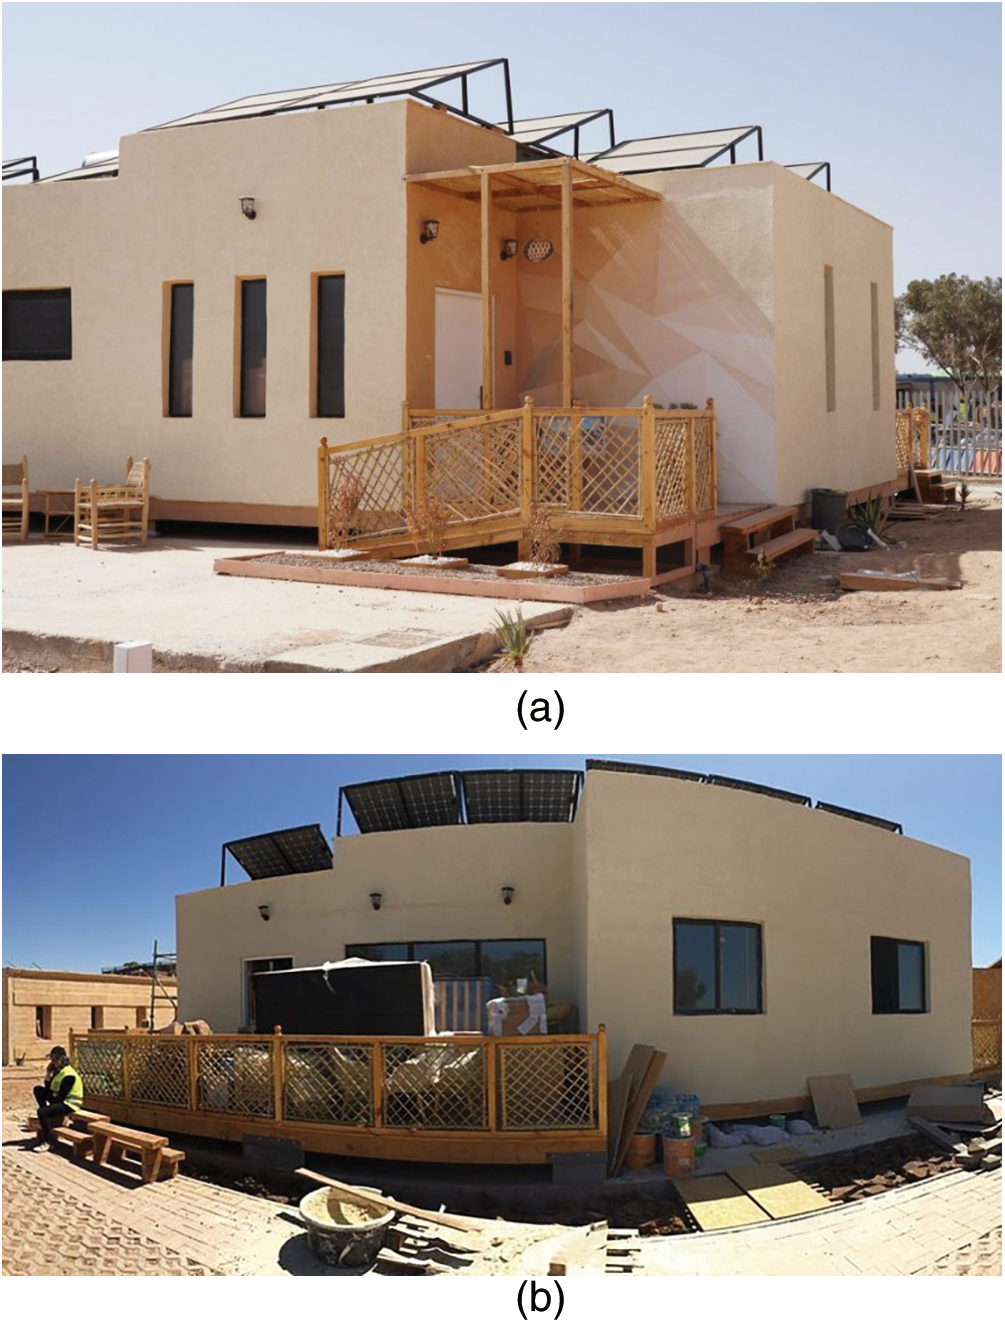
Figure 7: (a) The installation of the photovoltaic system in the roof of A’freehome in the south façade; (b) The installation of the photovoltaic system in the roof of A’freehome in the north façade
Single phase network: The object is the choice of an ecological efficient house in terms of energy. For this purpose, we choose the single-phase network instead of the three-phase networks known by its higher power.
Installed power: The number of panels had been chosen according to the solar envelope, the power of the photovoltaic system was also increased by making it not just self-sufficient but producing the electrical energy which will be injected to the network by the feeding price or just by the net metering.
Monocrystalline: This technology is the most efficient in the photovoltaic industry giving the best yield.
On grid: This technical choice was continued even through on-grid is the most expensive. The hybrid technology is not at its peak performance when injected into the network. An on-grid inverter is injected into the network in all cases; however, the hybrid one is injected approximately when the power is sufficient to cover the energy needed.
Orientation: The optimum orientation is the Azimuth south. However, the final orientation had to be compromised to the southeast due to on-site constraint.
2.5 Methodology and Assumptions Used
2.5.1 Description of the Modelling Equations Using the Software TRNSYS
Exchanges in a wall are made by conduction, convection and radiation. For each TRNSYS wall of 1 m2 surface area, the coefficient of thermal transmission U is calculated by electrical analogy taking into account three transfer modes:
Therefore, we use the equation of heat in steady state to model the conductive transfers through glass.
Regarding radiative exchanges, TRNSYS distinguishes between short-wavelength (CLO) exchanges corresponding to wavelengths below 2.5 μm and those of long-wavelength (GLO) above 2.5 μm.
For an outer wall, the radiative exchanges are considered according to the following equation:
With Ss,o the solar radiation absorbed by the surface.
The flows, inlet and outlet temperatures are shown in Fig. 8.
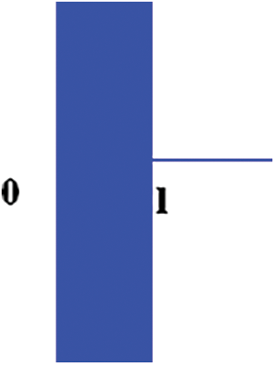
Figure 8: A wall with the input and output conditions of heat flow and temperature
Laplace Transform method
The energy gains at all nodes due to infiltration and ventilation are established by the following relationships:
The energy gain from convection coupling is the sum of all these gains for all walls or windows in the area.
With m _(coupl,s): the mass flow of air entering an i zone through its boundaries with other zones.
2.5.2 Description of the Assumptions of Calculating the Dioxide of Carbon
The Revit software calculate the carbon emissions of buildings [16] according to the formula below:
3.1.1 Building Orientation according to the BIM Model
According to Insight, calculate the effect of the annual cost per square meter per year against what is proposed in the model BIM as illustrated in the Fig. 9. The results show that the selected orientation shall provide the cheapest value for the running costs of the building, and the orientation that faces northwest for the bedrooms, living room, and for the technical room will reduce the load of cooling related to air conditioning, but those rooms will benefit from the maximum of illuminance. However, the kitchen and the hall of the entrance are in the southeast and southwest, with a limitation on opening in this orientation.
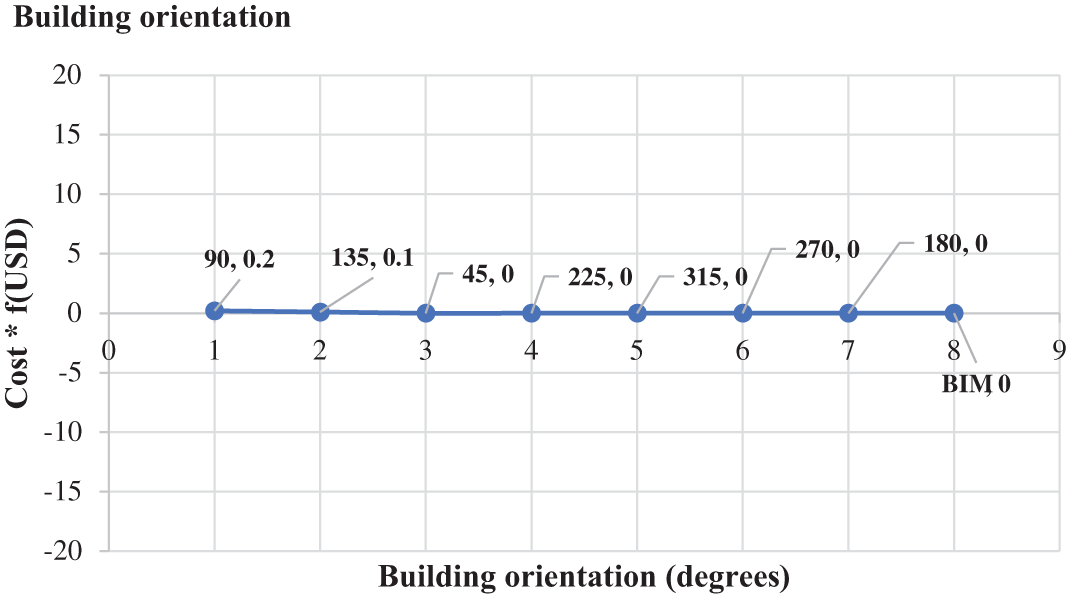
Figure 9: Analysis of the building orientation of the house studied
3.1.2 Comparison of Building Orientation with Literature
The limitation of windows in the exposed facades leads to a significant reduction in terms of cooling and heating energy needs, as the work of Zafaranchi et al. [17] assessed the impact of the percentage of openings on heating and cooling needs; also, the work of Rivera et al. [18] studied the effect of window to wall ratio and their effect to assure the best energy efficiency of residential buildings. Moreover, the work of Ahmed et al. [19] investigated the impact of window orientation, kind of glazing, and the wall window ratio on the energy efficiency of Kirkuk in Iraq on the reduction of energy consumption for heating and cooling needs and confirmed the choice of the author’s orientation in terms of the dispatching of glazing according to the orientation.
3.1.3 Building Envelope (Calculation of Thermal Transmittance)
Thermal transmittance was calculated according to the composition of walls and the roof [20], as described in Table 1. Results indicate that the value for exterior walls is 0.15 (W.m−2.K−1) and the value for the roof is 0.2 (W.m−2.K−1).

3.1.4 Comparison of Building Envelope Thermal Transmittance with Literature
The calculated values of thermal transmittance were compared to the work of Zafaranchi et al. [17], which revealed that to improve the thermal performance of the building studied, they needed to add 100 mm of the insulating material polyurethane to attend 0.16 (W.m−2.K−1) in the walls and 0.14 (W.m−2.K−1) in the roof. The value of thermal transmittance calculated meets the standard of passive building measurement with low carbon. For the purpose of justifying that the value established meets the standard of passive building, a literature comparison was conducted. The results were compared to the work of Rodrigues et al. [21], which studied the impact of thermal mass and its relation with the thermal transmittance value on the energy performance of buildings located in sixteen areas in the Mediterranean region. The work examines lightweight construction and compares it with heavyweight construction. The authors found that for the high thermal mass construction, the ideal U values for the transparent element are between 0.4 (W.m−2.K−1) for Venice and 2.6 (W.m−2.K−1) for Alexandria; however, for Casablanca, the value is equal to 0.55 (W.m−2.K−1). Nonetheless, for the opaque element, the ideal Uvalue is 0.1 (W.m−2.K−1) for Venice, 0.65 (W.m−2.K−1) for Alexandria, and 0.55 (W.m−2.K−1) for Casablanca. In this case, the authors found a value for dry climates of 0.15 (W.m−2.K−1), which is considered a very low value compared to the value of thermal transmittance of Casablanca in the transparent element, which represents a gain of 92%, even though for the opaque element it represents a gain of 71%.
Concerning the lower thermal mass, the ideal Uvalue for the transparent element is 0.4 (W. m−2.K−1) for Venice, 3.2 (W.m−2.K−1) for Alexandria, and 2 (W.m−2.K−1) for Casablanca; concerning the opaque element, the ideal U value is 0.1 (W.m−2.K−1) for Venice, 0.8 (W.m−2.K−1) for Alexandria, and 0.5 (W.m−2.K−1) for Casablanca; however, for our composition, the gain obtained compared to Casablanca is 92%; nonetheless, for the opaque element, it represents a gain of 68%.
3.1.5 Simulation Study Using TRNSYS and Meteoblue
A simulation analysis was conducted for the studied house located in the city of Benguerir with coordinates of 32°14′N, 7°57′W, and an altitude of 449 m using the software TRNSYS in order to evaluate the effect of the orientation choice and the composition of the envelope on the operative temperature, the annual cooling and heating needs. The criteria of comfort was evaluated based on the norm NF EN 16798-1 [22].
3.1.6 Discussion of Meteoblue Results
The analysis of Fig. 10 [23] shows that in January, in 4.9 days, the temperature is 10°C. To reach the comfort limit, we need to increase the temperature to 20°C. The studied house permits a gain of 50% in terms of temperature. In 13.5 days, the temperature is 15°C. To reach the comfort limit, we need to increase the temperature to 20°C. The studied house permits a gain of 25% in terms of temperature. In 11.2 days, the temperature is 20°C, which is a good value for comfort. In February, in 3.5 days, the temperature is 10°C. To reach the comfort limit, we need to increase the temperature to 20°C. The studied house permits a gain of 50% in terms of temperature. In 8.5 days, the temperature is 15°C. To reach the comfort limit, we need to increase the temperature to 20°C. The studied house permits a gain of 25% in terms of temperature. In 10.9 days, the temperature is 20°C, which is a good value for comfort.
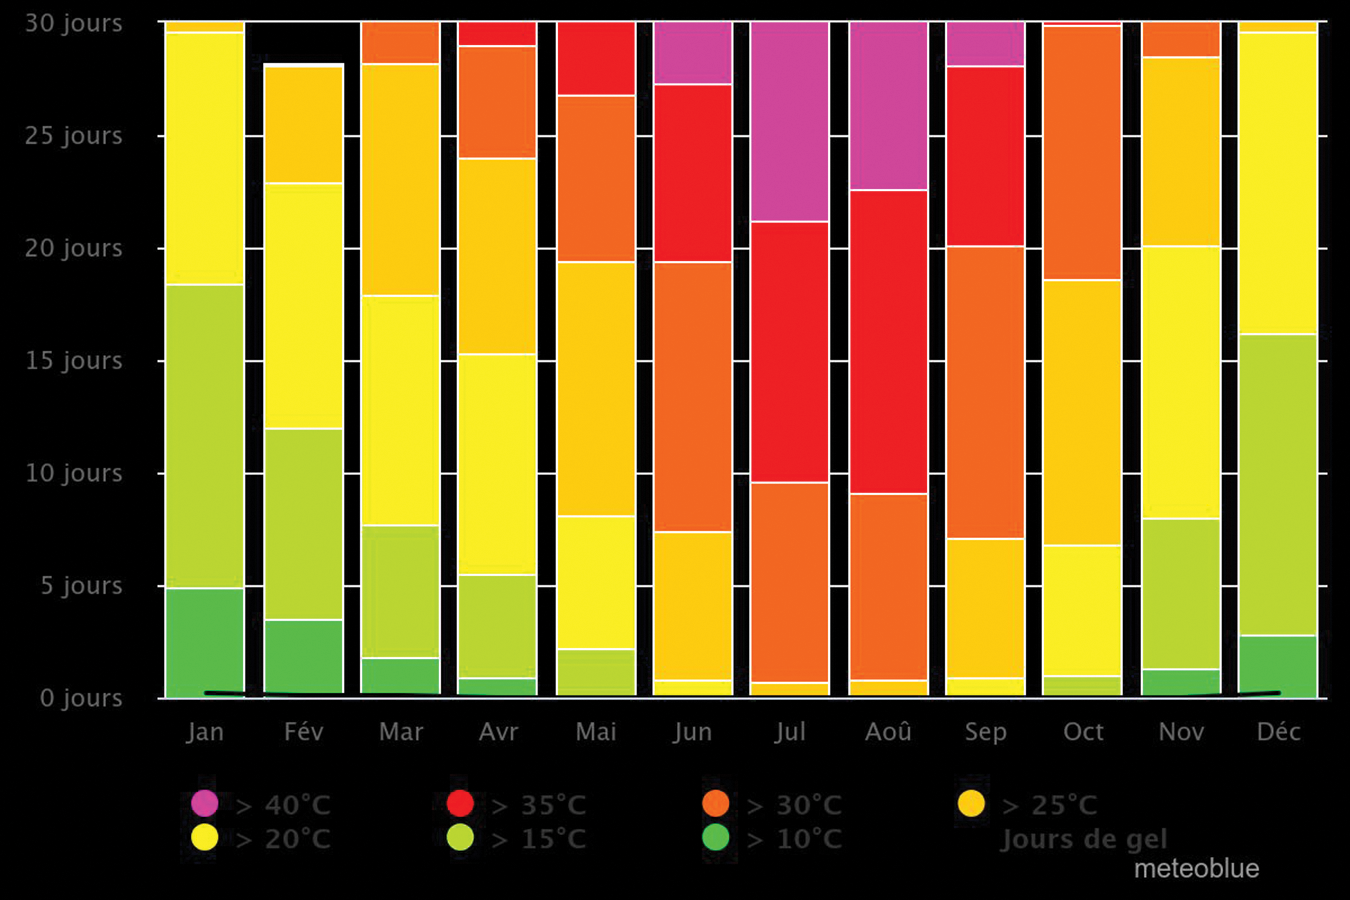
Figure 10: The exterior temperature of the site. Reprinted from the website meteoblue [23]
In March, in 1.8 days, the temperature is 10°C. To reach the comfort limit, we need to increase the temperature to 20°C. The studied house permits a gain of 50% in terms of temperature. In 5.9 days, the temperature is 15°C. To reach the comfort limit, we need to increase the temperature to 20°C. The studied house permits a gain of 25% in terms of temperature. In 10.2 days, the temperature is 20°C, which is a good value for comfort. In 10.3 days, the temperature will be 25°C. In 2.7 days, the temperature is 30°C. To reach the comfort limit, we need to decrease the temperature to 20°C. The studied house permits a gain of 50% in terms of temperature. In April, in 0.9 days, the temperature is 10°C. To reach the comfort limit, we need to increase the temperature to 20°C. The studied house permits a gain of 50% in terms of temperature. In 4.6 days, the temperature is 15°C. To reach the comfort limit, we need to increase the temperature to 20°C. The studied house permits a gain of 25% in terms of temperature. In 9.8 days, the temperature is 20°C, which is a good value for comfort. In 8.7 days, the temperature is 25°C. To reach the comfort limit, we need to decrease the temperature to 20°C. The studied house permits a gain of 25% in terms of temperature.
In the season of summer, in June, in 0.1 days, the temperature is 15°C. To reach the comfort limit, we need to increase the temperature to 26°C. The studied house permits a gain of 23% in terms of temperature. In 0.6 days, the temperature is 25°C. To reach the comfort limit, we need to increase the temperature to 26°C. The studied house permits a gain of 3% in terms of temperature. In 12 days, the temperature is 30°C. To reach the comfort limit, we need to decrease the temperature to 26°C. The studied house permits a gain of 15% in terms of temperature. In 7.9 days, the temperature is 35°C. To reach the comfort limit, we need to increase the temperature to 26°C. The studied house permits a gain of 34.6% in terms of temperature. In 2.7 days, the temperature is 40°C. To reach the comfort limit, we need to decrease the temperature to 26°C. The studied house permits a gain of above 54% in terms of temperature. In July, in 0.7 days, the temperature is 25°C. To reach the comfort limit, we need to increase the temperature to 26°C. The studied house permits a gain of 3% in terms of temperature. In 8.9 days, the temperature is 30°C. To reach the comfort limit, we need to decrease the temperature to 26°C. The studied house permits a gain of 15% in terms of temperature. In 11.6 days, the temperature is 35°C. To reach the comfort limit, we need to decrease the temperature to 26°C. The studied house permits a gain of above 35% in terms of temperature. In 8.4 days, the temperature is 40°C. To reach the comfort limit, we need to decrease the temperature to 26°C. The studied house permits a gain of above 54% in terms of temperature.
3.1.7 Discussion of TRNSYS Results and Comparison with Literature
The Fig. 11 indicates that the operative temperature in the house doesn’t exceed 26°C in the summer season. However, in the winter, it doesn’t decrease to the limit of 20°C. The obtained value is so interesting and meets the standard of comfort [22]. The work of Kristiansen et al. [24] assessed the relation between the illuminance and the operative temperature, and they consider that the operative temperature is an important parameter to control inside houses because humans spend 87% of their time inside. The work of Li et al. [25] assessed the parameters of thermal comfort for a seaweed house when they confirmed that the value founded in our work in terms of operative temperature is also confirmed by the residents of the seaweed house in Dazhuang Xujia Village, which has a thermally neutral temperature of 26.9°C.
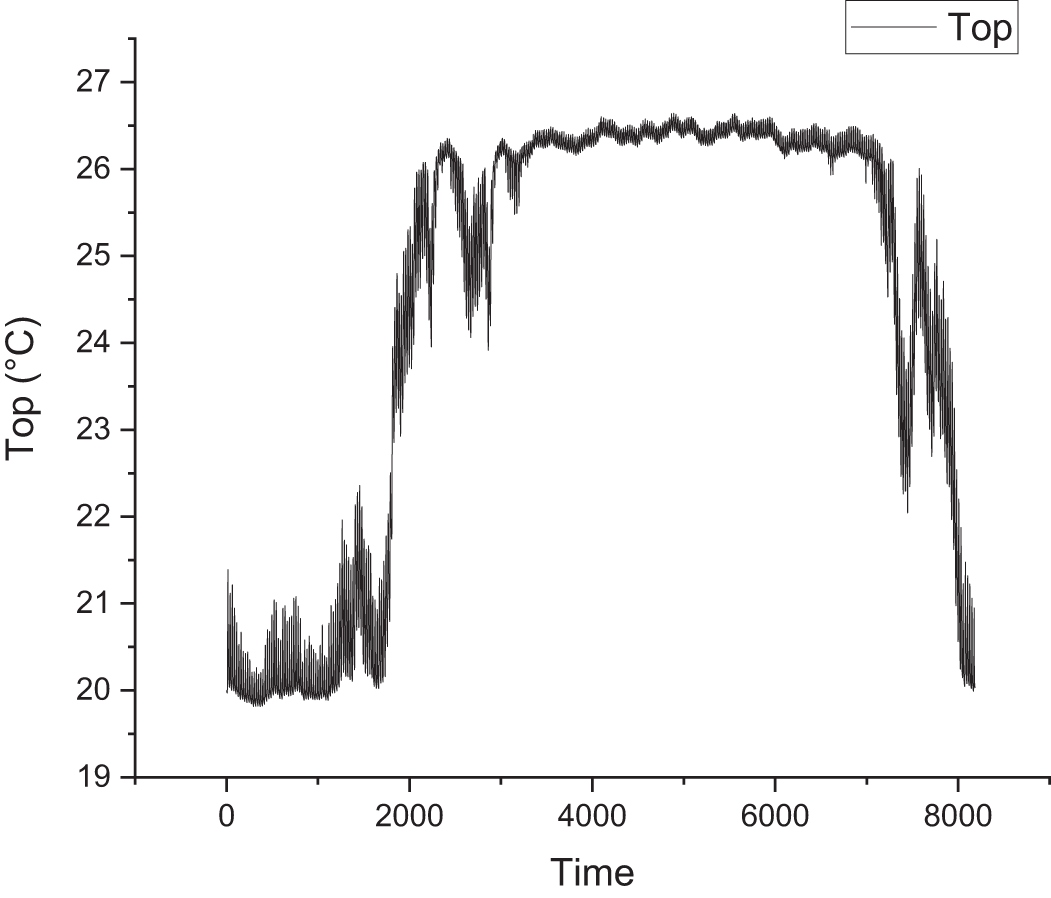
Figure 11: The operative temperature in the studied house
According to Fig. 12, the annual heating needs are 2.3 E + 06 (KJ/h), which represents a ratio of 6.38 (kWh/m2/year), which is a good value compared to literature [26], in which they found a value of 112.59 (kWh/m2/year), and these needs are observed during the seasons of winter and autumn in the interval of hours between 0 and 2000 and 8200 h. Cooling and heating energy needs leads directly to an energy consumption using gas or electricity as illustrated in the work of Elmallah et al. [27].
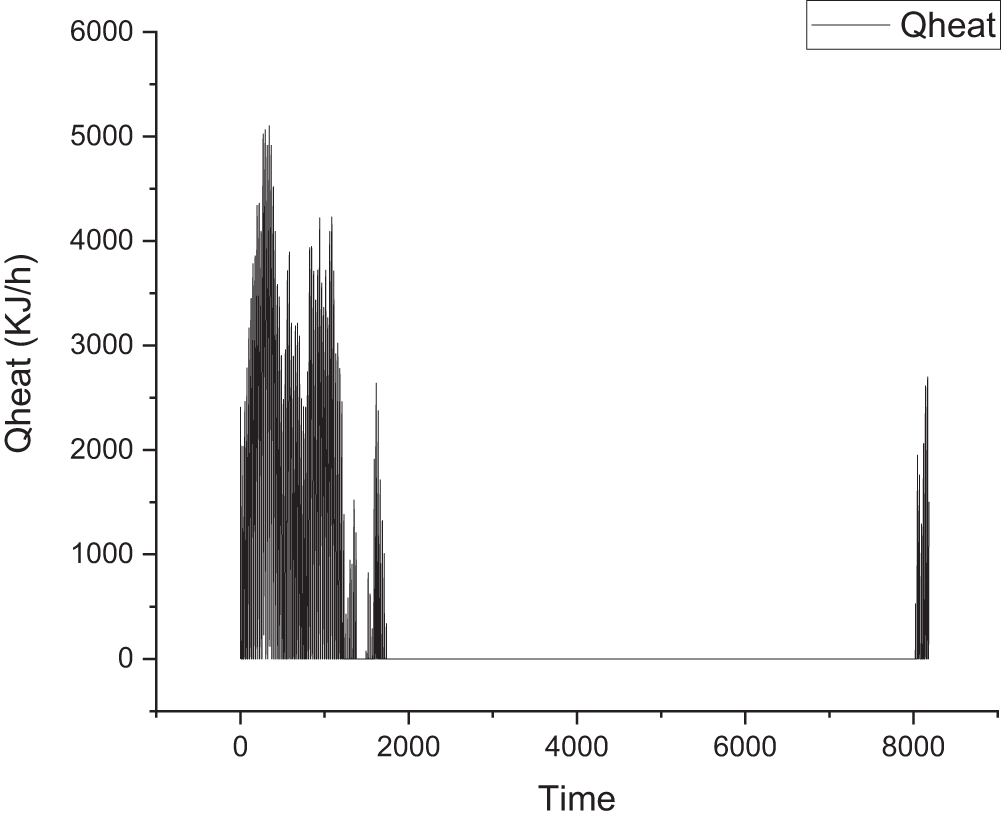
Figure 12: The heating needs during a year of the studied house
According to Fig. 13, the annual cooling needs are 1.78 E + 07 (KJ/h), which represents a ratio above 49 kWh/m2 per year, which is a good value compared to literature [26,28]. These needs are observed during the summer seasons in the interval of an hour between 2000 and 7000 h.
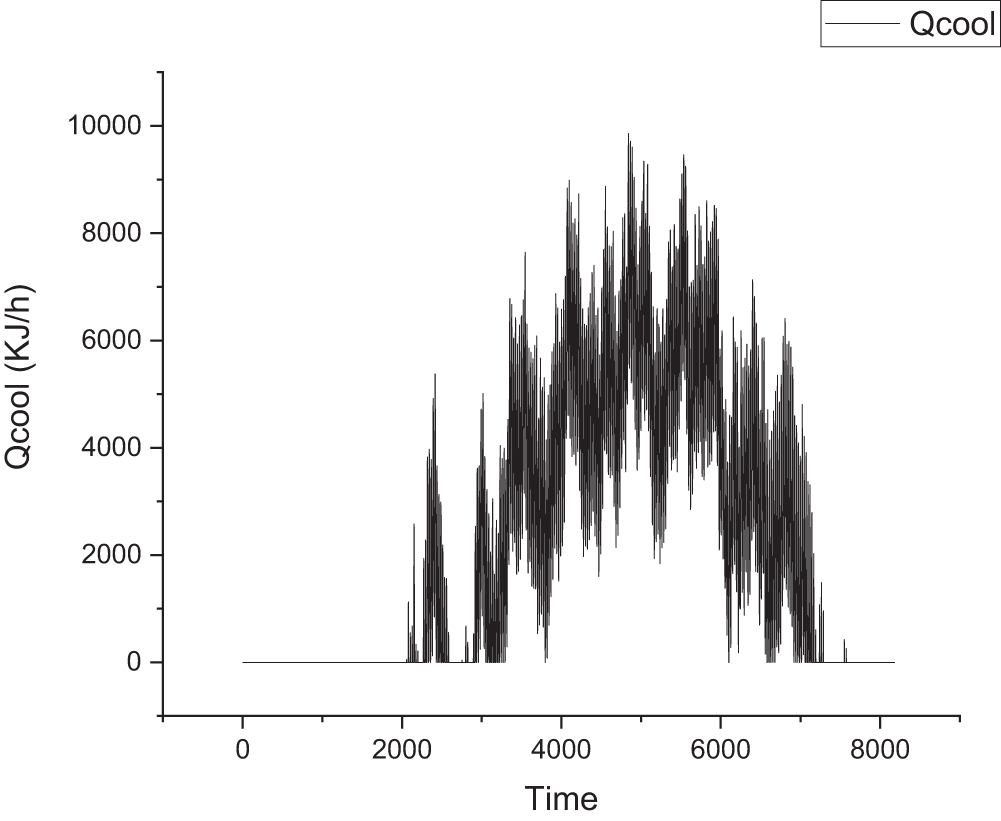
Figure 13: The cooling needs during a year of the studied house
The cooling and heating energy needs will be assured by using an air conditioning system that control temperature and humidity that function with the photovoltaic system with batteries storage as the studied house in our research is autonomous in terms of energy. This finding was also treated by Ma et al. [29] who investigated the control strategy of a new spray cooling system based on PV/T and heat recovery in sow houses. They also insisted on the role of controlling humidity in order to assure good cooling efficiency, which is the case in our house.
According to Fig. 14, the annual carbon dioxide emissions are dominated by the burdens of lighting and heating the building in the cold months. This visual shows a value of 31 kg CO2/m2 of carbon emissions which is a low value of emissions [30].
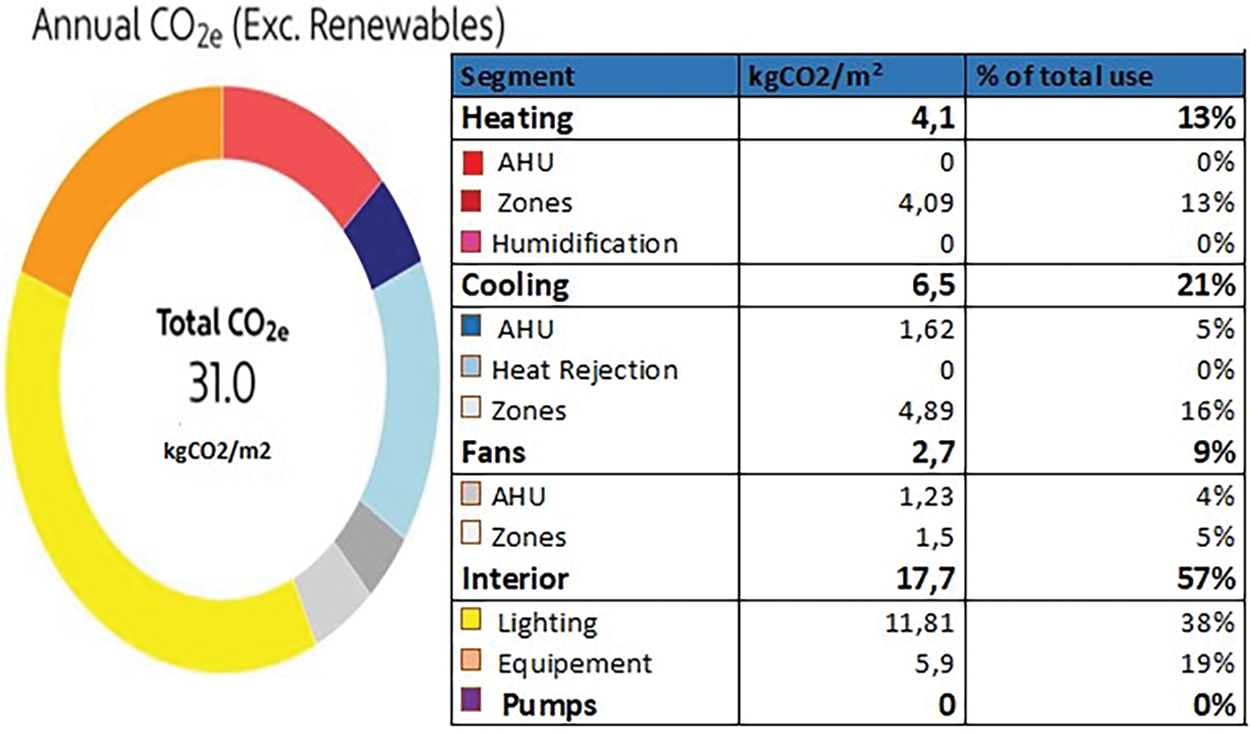
Figure 14: Analysis of the impact carbon of the house studied
3.2.1 Description of the Measurement Instruments
The interior temperature was measured inside the house using the thermocouple related to the acquisition unit. The SA 32 analog data acquisition unit is designed to measure, process, monitor, and record parameters from analog sensors on 32 channels in 2 wires and 8 channels in 4 wires. The voltage of the unit is between 0–10 V, and the Current is between 0–20 mA and 4–20 mA with shunts to connect as input. Thermocouples: Type K/T/J/S/B/N with or without cold solder compensation, resistance: 3000 Ω, resistive probes: Pt100 in 3 or 4 wires dry contacts. The precision of the thermocouple K used to measure the temperature is ±0.1°C. The humidity has been measured using a hygrometer that measures between 3% and 98% of relative humidity for an ambient temperature of air between −10°C and 60°C with a precision of ±2% HR.
3.2.2 Temperature, Humidity and Photovoltaic System
According to Fig. 15, the interior measured temperature of the house doesn’t exceed 26°C, which is confirmed by the simulation using TRNSYS as shown in Fig. 11, so the composition of the house permits assuring good thermal inertia properties and an average temperature near the limit of comfort. Concerning the humidity behavior, based on Fig. 16, it is above 50%, which is the threshold of human comfort [31–33]. The analysis shows the annual energy yield is 18,507 kWh.
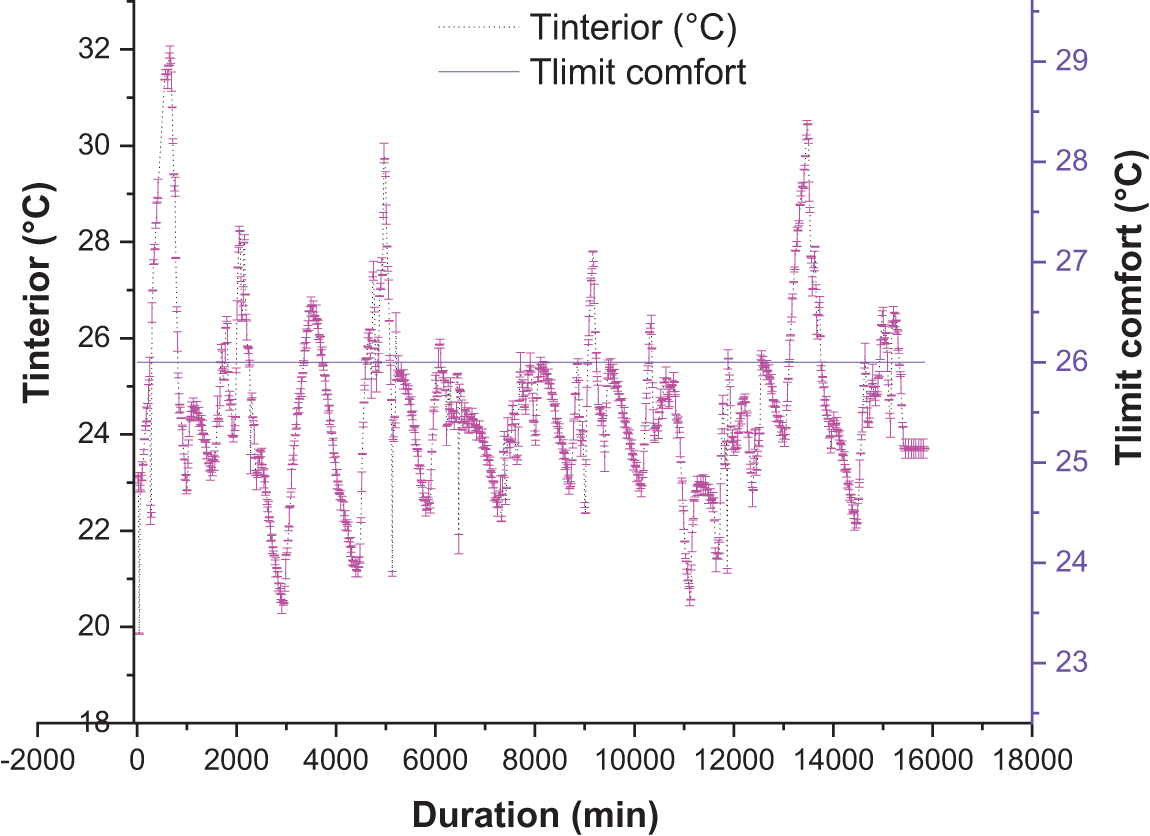
Figure 15: Analysis of temperature in living area
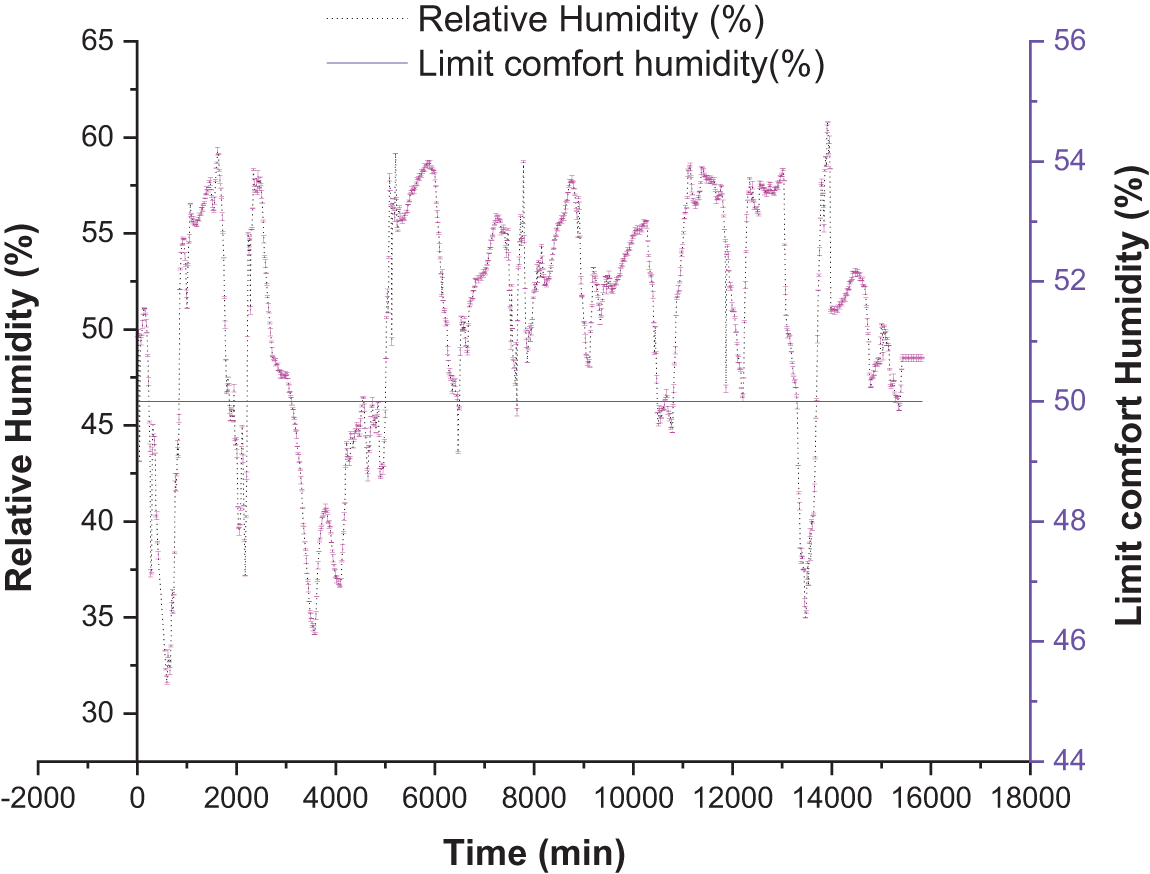
Figure 16: Analysis of the humidity in living area
3.2.3 Photovoltaic System Results
In the scenario illustrated in Fig. 17, the lifetime of the batteries was not optimized, the self-consumption was decreased by a ratio of 14.9%, and the injection in the network was increased by a value of 15,757 kWh; however, the scenario represented in Fig. 18 takes into account the optimization of the lifetime of batteries by increasing the self-consumption, results were compared to literature showing an interesting findings compared to other study where renewable energy play an important role on reducing fuel consumption and carbon emissions [34]. The results of using renewable energy were compared to the literature to show the relation between the reduction of fuel consumption, carbon emissions, and the use of renewable energy. As Li et al. [35] assessed the relation between the use of renewable energy, urbanization, carbon emissions, and consumption of fuel, the authors advised that the Chinese government needs to encourage the use of mixed energy.
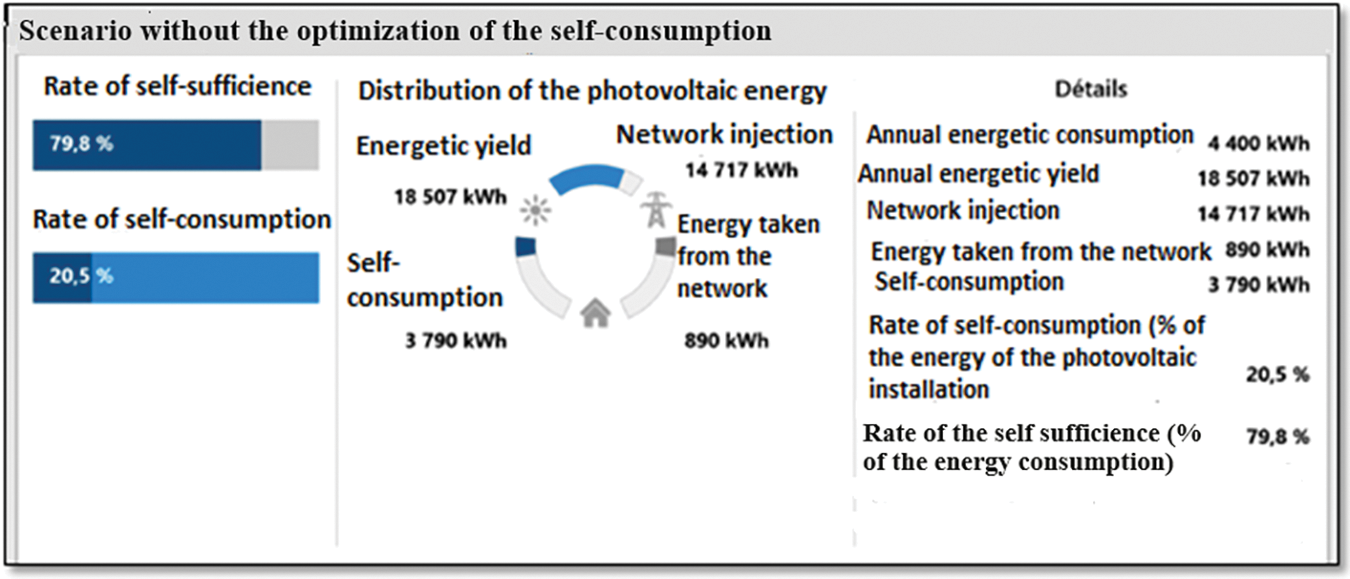
Figure 17: Sketch from the monitoring system of the photovoltaic installation without optimization
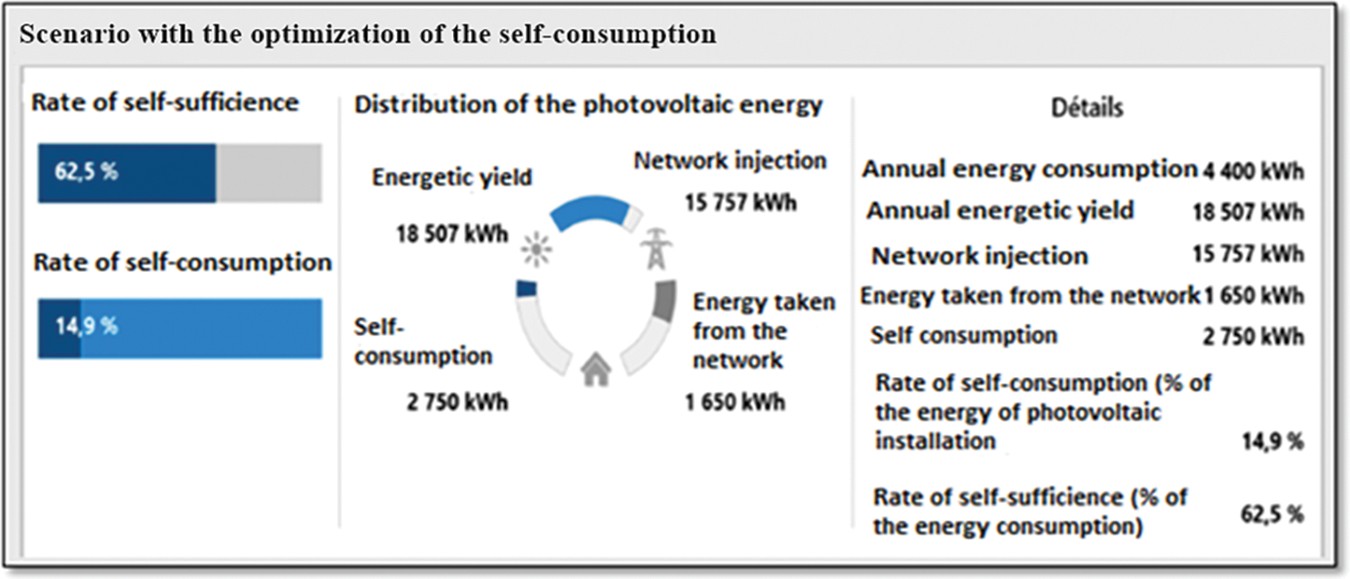
Figure 18: Sketch from the monitoring system of the photovoltaic installation with optimization
3.2.4 Comparison of the House’s Characteristics with Literature
The performance of the house studied as the annual energy consumption with a value of 49 kWh/m2.year as compared to literature, as in the work of Holopainen et al. [36], in a study of five low-energy buildings that were recently constructed in southern Finland, the average primary energy consumption was 120 kWh/m2.year in the low energy houses, which presents a gain of 59% for our house. Also, another comparison was done concerning the work of [37], which illustrated the performance of two built houses with low energy standards, and they found an annual energy consumption of 4921 kWh for the code of sustainable homes, which was presented to us as a gain of 10.6% compared to the house studied.
3.2.5 Economic Performance of the Photovoltaic System
An analysis of the energetic performance of the photovoltaic system was considered to show the gain obtained from the solar energy as illustrated in Table 2.

According to Table 2, the gain obtained from the PV system is estimated to be 18507 DH during a year. However, the gain in euros is 5367.03 euros and 2924.16 dollars, which represents an important economic gain during a year.
In terms of the building envelope, this paper explains the idea and performance of a green and sustainable building in arid regions that uses solar energy as its primary energy source and ecological, biosourced materials. Additionally, a study of Benguerir City’s climate was carried out, with a particular focus on the outside temperature for each month of the year. The values of these temperatures were compared to the operating temperature inside the house under study, and the gain from the thermal inertia of the house under study represented by the building envelope was computed. The authors work on the arrangement of the areas, the height, the accessibility, and the movability of the house, drawing inspiration from the traditional homes of Fez.
Our study’s advantages include presenting a real-world model of a green and sustainable structure that was constructed with biosourced materials controlling the inside temperature and relative humidity in arid conditions. The experimental measurements validated the full theoretical analysis. Additionally, the newly built home uses renewable solar energy to power itself and connects to the network, which is unprecedented in Africa. This will encourage the government to amend the building code to allow residential buildings to connect to the network, just like in developed nations, where residents can rely on this technology to generate income. The high cost of the crystalline and on-grid technologies, as well as the high cost of the batteries used, are the study’s limitations.
Because bio-sourced materials were used, the building under study performed well in terms of the building envelope, achieving a value of 0.15 W.m−2.K−1, which is the standard for passive buildings. Furthermore, a hybrid photovoltaic system with monocrystalline technology, with a 10 kW capacity and 4.8 kWh of battery storage, serves as the primary energy source for the house. Various optimization scenarios were carried out. The first one allows for a rate of 20.5% self-consumption and 79.8% self-sufficiency by increasing self-consumption and the lifespan of batteries, which are the costliest components in the PV system. The second one, however, ignores the lifetime of batteries by decreasing self-consumption. With low carbon emissions of 31 kgCO2/m2, the house’s interior temperature and humidity are well-regulated through the use of bio-sourced materials, resulting in excellent thermal transmittance and operating temperature performance. The authors assessed the operating temperature and the energy requirements for heating and cooling over the course of a year using a simulation run with TRNSYS. The house’s annual heating needs are 2.3 E + 06 (KJ/h), or 6.38 (kWh/m2.an), while its cooling needs are 1.78 E + 07 (KJ/h), or 49 (kWh/m2.an). The numerical results and experimental measurements of temperature and relative humidity inside the house, which are in good accordance with the international standards, have confirmed that the temperature in the house is well controlled, not exceeding 26°C, and that the threshold of relative humidity is an average of 50%.
Acknowledgement: The authors present special thanks to IRESEN and the American Department of Energy (DOE) for their help to construct this prototype.
Funding Statement: The authors received no specific funding for this study.
Author Contributions: The authors confirm contribution to the paper as follows: study conception and design: Soumia Mounir, Youssef Maaloufa; data collection: Soumia Mounir, Youssef Maaloufa, Abdelhamid Khabbazi, Elina Mohd Husini, Mina Amazal, Asma Souidi, Malika Atigui; analysis and interpretation of results: Soumia Mounir, Youssef Maaloufa, Yakubu Aminu Dodo, Nurul Syala Abdul Latip, Ahmed Aharoune, Rime EL Harrouni; draft manuscript preparation: Soumia Mounir, Youssef Maaloufa, Yakubu Aminu Dodo. All authors reviewed the results and approved the final version of the manuscript.
Availability of Data and Materials: The authors confirm that the data supporting the findings of this study are available within the article.
Ethics Approval: Not applicable.
Conflicts of Interest: The authors declare no conflicts of interest to report regarding the present study.
References
1. IEA, “Africa Energy Outlook 2019—Analysis IEA,” 2019. Accessed: May 05, 2024. [Online]. Available: https://www.iea.org/reports/africa-energy-outlook-2019 [Google Scholar]
2. SDA, “Team A FREE HOME—SDA,” 2019. Accessed: Jul. 06, 2024. [Online]. Available: https://www.solardecathlonafrica.com/fr/team-a-free-home [Google Scholar]
3. P. Moran, J. O’Connell, and J. Goggins, “Sustainable energy efficiency retrofits as residential buildings move towards nearly zero energy building (NZEB) standards,” Energy Build., vol. 211, no. 9, 2020, Art. no. 109816. doi: 10.1016/j.enbuild.2020.109816. [Google Scholar] [CrossRef]
4. Y. Yu et al., “Effect of implementing building energy efficiency labeling in China: A case study in Shanghai,” Energy Pol., vol. 133, Oct. 01, 2019, Art. no. 110898. doi: 10.1016/j.enpol.2019.110898. [Google Scholar] [CrossRef]
5. L. Brottier and R. Bennacer, “Thermal performance analysis of 28 PVT solar domestic hot water installations in Western Europe,” Renew. Energy, vol. 160, pp. 196–210, Jan. 01, 2020. doi: 10.1016/j.renene.2020.06.072. [Google Scholar] [CrossRef]
6. F. L. Rashid et al., “Recent advances and developments in phase change materials in high-temperature building envelopes: A review of solutions and challenges,” Buildings, vol. 14, no. 6, Jun. 2024, Art. no. 1582. doi: 10.3390/buildings14061582. [Google Scholar] [CrossRef]
7. F. L. Rashid et al., “Bio-based phase change materials for thermal energy storage and release: A review,” J. Energy Stor., vol. 73, Dec. 12, 2023, Art. no. 109219. doi: 10.1016/j.est.2023.109219. [Google Scholar] [CrossRef]
8. F. D. Agbajor and M. C. Mewomo, “Green building research in South Africa: A scoping review and future roadmaps,” Energy Built Environ., vol. 5, no. 2, pp. 316–335, Jan. 01, 2024. doi: 10.1016/j.enbenv.2022.11.001. [Google Scholar] [CrossRef]
9. A. Moghayedi, J. Mahachi, R. Lediga, T. Mosiea, and E. Phalafala, “Revolutionizing affordable housing in Africa: A comprehensive technical and sustainability study of 3D-printing technology,” Sustain. Cities Soc., vol. 105, Jun. 01, 2024, Art. no. 105329. doi: 10.1016/j.scs.2024.105329. [Google Scholar] [CrossRef]
10. A. R. Abdulmunem, P. M. Samin, K. Sopian, S. Hoseinzadeh, H. A. Al-Jaber and D. A. Garcia, “Waste chicken feathers integrated with phase change materials as new inner insulation envelope for buildings,” J. Energy Storage, vol. 56, no. 2, Jan. 12, 2022, Art. no. 106130. doi: 10.1016/j.est.2022.106130. [Google Scholar] [CrossRef]
11. F. L. Rashid et al., “A review of radiant heating and cooling systems incorporating phase change materials,” J. Therm. Anal. Calorim., vol. 149, no. 15, pp. 7891–7917, Aug. 01, 2024. doi: 10.1007/s10973-024-13193-6. [Google Scholar] [CrossRef]
12. S. Mounir, A. Khabbazi, K. El Harrouni, and Y. Maaloufa, “Performance of cork and composites joints,” in Reference Module in Materials Science and Materials Engineering. Elsevier: Oxford, Jan. 01, 2020, pp. 212–222. [Google Scholar]
13. S. Mounir, A. Khabbazi, F. Z. Elwardi, K. Elharrouni, and Y. Maaloufa, “Energy efficiency and impact carbon of a multilayer material composed of ecological additives,” Energy Procedia, vol. 157, no. 10, pp. 419–427, Jan. 01, 2019. doi: 10.1016/j.egypro.2018.11.206. [Google Scholar] [CrossRef]
14. R. Igaz, L. Krišťák, I. Ružiak, M. Gajtanska, and M. Kučerka, “Thermophysical properties of OSB boards versus equilibrium moisture content,” BioResources, vol. 12, pp. 8106–8118, Sep. 15, 2017. [Google Scholar]
15. F. Asdrubali et al., “Experimental thermo-acoustic characterization of innovative common reed bio-based panels for building envelope,” Build. Environ., vol. 102, pp. 217–229, Jun. 01, 2016. doi: 10.1016/j.buildenv.2016.03.022. [Google Scholar] [CrossRef]
16. Bayle O,” [Nouveauté] Aperçu technologique Insight For Revit 2023.1,” Mar. 2023. Accessed: Jun. 20, 2024. [Online]. Available: https://blogs.autodesk.com/villagebim/2023/03/nouveaute-apercu-technologique-insight-for-revit-2023-1.html [Google Scholar]
17. M. Zafaranchi and H. Sozer, “Enhancing energy efficiency through hourly assessments of passive interventions in educational-office buildings: A case study in a Mediterranean Climate,” Energy Rep., vol. 11, no. 10, pp. 423–441, Jun. 01, 2024. doi: 10.1016/j.egyr.2023.12.016. [Google Scholar] [CrossRef]
18. M. L. Rivera, H. L. MacLean, and B. McCabe, “Implications of passive energy efficiency measures on life cycle greenhouse gas emissions of high-rise residential building envelopes,” Energy Build., vol. 249, Oct. 15, 2021, Art. no. 111202. doi: 10.1016/j.enbuild.2021.111202. [Google Scholar] [CrossRef]
19. A. E. Ahmed, M. S. Suwaed, A. M. Shakir, and A. Ghareeb, “The impact of window orientation, glazing, and window-to-wall ratio on the heating and cooling energy of an office building: The case of hot and semi-arid climate,” J. Eng. Res., Oct. 27, 2023. doi: 10.1016/j.jer.2023.10.034. [Google Scholar] [CrossRef]
20. F. Asdrubali, F. D’Alessandro, G. Baldinelli, and F. Bianchi, “Evaluating in situ thermal transmittance of green buildings masonries—A case study,” Case Stud. Constr. Mater., vol. 1, no. 7, pp. 53–59, Apr. 19, 2014. doi: 10.1016/j.cscm.2014.04.004. [Google Scholar] [CrossRef]
21. E. Rodrigues, M. S. Fernandes, A. R. Gaspar, Á Gomes, and J. Costa, “Thermal transmittance effect on energy consumption of Mediterranean buildings with different thermal mass,” Appl. Energy, vol. 252, Oct. 15, 2019, Art. no. 113437. doi: 10.1016/j.apenergy.2019.113437. [Google Scholar] [CrossRef]
22. Afnor (NF EN 16798-1“Performance énergétique des bâtiments-Ventilation des bâtiments-Partie 1 : Données d’entrées d’ambiance intérieure pour la conception et l’évaluation de la performance énergétique des bâtiments couvrant la qualité de l’air intérieur, l’ambiance thermique, l’éclairage et l’acoustique (Module M1-6),” 2019. Accessed: Jun. 20, 2024. [Online]. Available: https://www.boutique.afnor.org/fr-fr/norme/nf-en-167981/performance-energetique-des-batiments-ventilation-des-batiments-partie-1-do/fa187070/85501 [Google Scholar]
23. Meteoblue, “Simulated historical climate & weather data for Ben Guerir meteoblue,” Accessed: Jul. 06, 2024. [Online]. Available: https://www.meteoblue.com/en/weather/week/ben-guerir_morocco_2556018 [Google Scholar]
24. T. Kristiansen, F. Jamil, I. A. Hameed, and M. Hamdy, “Predicting annual illuminance and operative temperature in residential buildings using artificial neural networks,” Build. Environ., vol. 217, Jun. 01, 2022, Art. no. 109031. doi: 10.1016/j.buildenv.2022.109031. [Google Scholar] [CrossRef]
25. Y. Liu, W. Yao, and W. Gao, “Thermal environment evaluation and thermal comfort zone deviation—A case study of Chinese seaweed house in summer,” J. Build. Eng., vol. 78, Nov. 01, 2023, Art. no. 107703. doi: 10.1016/j.jobe.2023.107703. [Google Scholar] [CrossRef]
26. A. Lamrani Alaoui et al., “Thermal and energy efficiency study of passive heating and cooling systems in Morocco’s cold desert climate,” e-Prime–Adv. Electr. Eng. Electron. Energy, vol. 6, Dec. 01, 2023, Art. no. 100355. doi: 10.1016/j.prime.2023.100355. [Google Scholar] [CrossRef]
27. S. Elmallah, C. Crespo Montañés, and D. Callaway, “Who heats and cools? Access to residential heating and cooling in Northern California and implications for energy transitions,” Energy Pol., vol. 191, Aug. 01, 2024, Art. no. 111947. doi: 10.1016/j.enbuild.2022.111947. [Google Scholar] [CrossRef]
28. L. Pajek, J. Potočnik, and M. Košir, “The effect of a warming climate on the relevance of passive design measures for heating and cooling of European single-family detached buildings,” Energy Build., vol. 261, Apr. 15, 2022, Art. no. 111947. doi: 10.1016/j.enbuild.2022.111947. [Google Scholar] [CrossRef]
29. H. Ma et al., “Investigation on the control strategy of new spray cooling system based on PV/T and heat recovery in sow houses: As a case study in Nanchang, China,” Renew. Energy, vol. 219, Dec. 01, 2023, Art. no. 119472. doi: 10.1016/j.renene.2023.119472. [Google Scholar] [CrossRef]
30. X. Zhang, J. Xu, X. Zhang, and Y. Li, “Life cycle carbon emission reduction potential of a new steel-bamboo composite frame structure for residential houses,” J. Build. Eng., vol. 39, Jul. 01, 2021, Art. no. 102295. doi: 10.1016/j.jobe.2021.102295. [Google Scholar] [CrossRef]
31. Penn State, “Humans can’t endure temperatures and humidities as high as previously thought” | Penn State University. Accessed: Jun. 15, 2024. [Online]. Available: https://www.psu.edu/news/research/story/humans-can’t-endure-temperatures-and-humidities-high-previously-thought [Google Scholar]
32. AFP 2023 Scientists Identify, “The maximum heat limit the human body can take ScienceAlert,” Accessed: Aug. 12, 2023. [Online]. Available: https://www.sciencealert.com/scientists-identify-the-maximum-heat-limit-the-human-body-can-take [Google Scholar]
33. D. J. Vecellio, Q. Kong, W. L. Kenney, and H. M. Greatly, “enhanced risk to humans as a consequence of empirically determined lower moist heat stress tolerance,” Proc. Natl. Acad. Sci. U.S.A., vol. 120, Oct. 09, 2023, Art. no. e065653. doi: 10.1073/pnas.2305427120. [Google Scholar] [CrossRef]
34. X. Wu, J. Li, Y. Cai, and S. Huang, “Optimization study of active-passive heating system parameters in village houses in the southern Xinjiang province,” Energy Eng., vol. 121, no. 7, pp. 1963–1990, Jun. 11, 2024. doi: 10.32604/ee.2024.048477. [Google Scholar] [CrossRef]
35. B. Li and N. Haneklaus, “The role of renewable energy, fossil fuel consumption, urbanization and economic growth on CO2 emissions in China,” Energy Rep., vol. 7, pp. 783–791, 2021, Nov. 11, 2021. doi: 10.1016/j.egyr.2021.09.194. [Google Scholar] [CrossRef]
36. R. Holopainen, K. Salmi, E. Kähkönen, P. Pasanen, and K. Reijula, “Primary energy performance and perceived indoor environment quality in Finnish low-energy and conventional houses,” Build. Environ., vol. 87, pp. 92–101, May 01, 2015. doi: 10.1016/j.buildenv.2015.01.024. [Google Scholar] [CrossRef]
37. R. V. Jones, A. Fuertes, S. Goodhew, and P. de Wilde, “The actual performance of aspiring low energy social houses in the United Kingdom,” Energy Procedia, vol. 105, no. 5, pp. 2181–2186, May 01, 2017. doi: 10.1016/j.egypro.2017.03.615. [Google Scholar] [CrossRef]
Cite This Article
 Copyright © 2025 The Author(s). Published by Tech Science Press.
This work is licensed under a Creative Commons Attribution 4.0 International License , which permits unrestricted use, distribution, and reproduction in any medium, provided the original work is properly cited.


 Submit a Paper
 Propose a Special lssue
 View Full Text
 Download PDF
 Downloads
 Citation Tools