 Open Access
ARTICLE
Method for Estimating the State of Health of Lithium-ion Batteries Based on Differential Thermal Voltammetry and Sparrow Search Algorithm-Elman Neural Network
School of Electrical and Electronic Engineering, Hubei University of Technology, Wuhan, 430068, China
* Corresponding Author: Daoyu Zhang. Email:
(This article belongs to the Special Issue: Advanced Modelling, Operation, Management and Diagnosis of Lithium Batteries)
Energy Engineering 2025, 122(1), 203-220. https://doi.org/10.32604/ee.2024.056244
Received 17 July 2024; Accepted 25 October 2024; Issue published 27 December 2024
Abstract
Precisely estimating the state of health (SOH) of lithium-ion batteries is essential for battery management systems (BMS), as it plays a key role in ensuring the safe and reliable operation of battery systems. However, current SOH estimation methods often overlook the valuable temperature information that can effectively characterize battery aging during capacity degradation. Additionally, the Elman neural network, which is commonly employed for SOH estimation, exhibits several drawbacks, including slow training speed, a tendency to become trapped in local minima, and the initialization of weights and thresholds using pseudo-random numbers, leading to unstable model performance. To address these issues, this study addresses the challenge of precise and effective SOH detection by proposing a method for estimating the SOH of lithium-ion batteries based on differential thermal voltammetry (DTV) and an SSA-Elman neural network. Firstly, two health features (HFs) considering temperature factors and battery voltage are extracted from the differential thermal voltammetry curves and incremental capacity curves. Next, the Sparrow Search Algorithm (SSA) is employed to optimize the initial weights and thresholds of the Elman neural network, forming the SSA-Elman neural network model. To validate the performance, various neural networks, including the proposed SSA-Elman network, are tested using the Oxford battery aging dataset. The experimental results demonstrate that the method developed in this study achieves superior accuracy and robustness, with a mean absolute error (MAE) of less than 0.9% and a root mean square error (RMSE) below 1.4%.Keywords
In response to the growing severity of energy and environmental crises, numerous countries and regions are ramping up investments in renewable energy technologies. Among these, lithium-ion batteries have gained widespread application in electric vehicles, substations, and photovoltaic power grids, owing to their long lifespan, low self-discharge rate, high energy density, high power output, and environmentally friendly properties [1,2]. However, during charge-discharge cycles, various side reactions occur inside the battery, leading to the loss of active materials and electrolytes. This results in capacity decay, increased impedance, and performance degradation, thus posing safety hazards [3–5]. Additionally, the battery aging process is a positive feedback loop, and improper operations such as overcharging and over-discharging during use can accelerate aging, potentially causing system failures and safety issues. The state of health (SOH) of a battery, which serves as a key indicator of its aging status, is a critical parameter within battery management systems (BMS). Precise SOH estimation enables the BMS to effectively monitor and manage battery safety, thereby ensuring the reliable and stable operation of the overall battery system.
The estimation of a battery’s SOH typically involves three main approaches: the feature parameter method, model-based techniques, and data-driven approaches [6]. Model-based techniques are further divided into two categories: electrochemical models and equivalent circuit models. The feature parameter method, on the other hand, calculates SOH by deriving equations based on measured aging-related parameters such as terminal voltage, current, and internal resistance, allowing for an assessment of the battery’s current SOH through these computations. This method is simple in principle and broadly applicable, but its estimation accuracy is affected by the precision of the measurement equipment, and the measurement cycle is usually long, making it more suitable for laboratory applications [7]. The model-based method simulates the external characteristics of the battery by establishing a physical-chemical model of the battery. It requires parameter identification combined with filters and the use of optimization algorithms to estimate SOH. This approach is mainly categorized into equivalent circuit models and electrochemical models. Equivalent circuit models are structurally simple and require relatively low computational resources, but their parameters vary under different operating conditions, performing well only under conditions where the model parameters have been identified, which limits their adaptability. Electrochemical models, on the other hand, describe the battery’s capacity degradation mechanisms through a series of partial differential equations based on the internal aging mechanisms of the battery. However, identifying parameters for electrochemical models is challenging and computationally complex, making them unsuitable for BMS applications [8]. The data-driven approach bypasses the need to understand the internal mechanisms of the battery. Instead, it focuses on analyzing and extracting health features (HFs) that are closely related to the battery’s condition, employing machine learning algorithms to establish a nonlinear mapping between these HFs and the battery’s SOH. By eliminating the need for physical modeling and parameter identification, this method offers enhanced flexibility and holds significant potential for practical applications, which has attracted considerable attention and extensive research from the academic community [9].
The data-driven approach primarily relies on the rationality of health features and the generalization capability of the training algorithms [10]. In the selection of data for feature extraction, the charging data of the battery is more valuable for estimating SOH. In practical applications, battery discharge conditions are often complex, while charging conditions are generally more controlled. Typically, batteries are charged using a constant current (CC) phase followed by a constant voltage (CV) phase. Researchers, such as Wang et al. [11], applied Incremental Capacity Analysis (ICA) to extract features from the Incremental Capacity (IC) curves during battery charging. They then utilized Support Vector Regression (SVR) to estimate the battery’s SOH. Additionally, Severson et al. [12] introduced a data-driven method to predict the cycle life of lithium-ion batteries before capacity degradation occurs. The research team utilized a large battery dataset and employed machine learning algorithms, such as random forests, to analyze early cycle features and successfully predict battery lifespan. The innovation of this method lies in its ability to accurately forecast the cycle life of batteries without requiring complete discharge tests, thereby significantly reducing testing time and costs. Zhang et al. [13] proposed a model free SOH estimation method combining Coulomb counting method and differential voltage analysis. The above research mainly depends on the voltage characteristics, without considering the temperature factor of battery aging process. In addition to voltage, battery temperature and other characteristics can also characterize battery aging. Scholars such as Jiang et al. [14] proposed that the surface temperature of lithium-ion batteries changes with cycling and aging, affecting battery performance. Surface temperature characteristics can describe the temperature trends of batteries in different aging stages, assessing their aging status and preventing serious accidents from occurring. Through experiments, that considering temperature factors during the testing process enhances the accuracy of SOC and SOH estimation methods [15]. Yang et al. [16] fitted battery surface temperature using an exponential model, extracting health features that characterize temperature variation rates from model parameters, and validated their association with battery capacity degradation. Tian et al. [17] analyzed temperature difference curves during the CC process and utilized SVR within certain voltage ranges to estimate SOH. In the article by Zhang et al. [18], the advantages of data-driven approaches for SOH estimation in lithium-ion batteries are extensively discussed. The authors highlighted that data-driven methods offer significant benefits in SOH applications due to their ability to automatically extract relevant features from large datasets and model complex, nonlinear relationships inherent in battery degradation processes. These methods enhance prediction accuracy and adaptability, as they do not require detailed physical modeling or prior domain knowledge. Moreover, data-driven approaches are highly flexible, making them suitable for real-time applications and various operational conditions, thereby improving the robustness and reliability of battery health prognostics. Among various data-driven methods, Liu et al. [19] provided a detailed introduction on how to use Elman neural network for SOH estimation of lithium-ion batteries, and provides an application example of Elman neural network in battery SOH estimation. At the same time, it compares with other traditional neural networks and proves the superiority of Elman neural network, especially in the processing of nonlinear and dynamic time series data and adaptability in complex environments.
The above review indicates that current research on SOH estimation primarily relies on voltage characteristics, often neglecting temperature factors that may also signify battery aging. Meanwhile, data-driven methods exhibit significant advantages in SOH estimation. However, traditional neural networks have inherent limitations, such as susceptibility to local minima, slow convergence rates, and challenges in accurately selecting initial weights and thresholds. To address these issues, this study considered both voltage and temperature factors of the battery. Differential Thermal Voltammetry (DTV) and Incremental Capacity Analysis (ICA) were employed to extract features related to temperature and battery voltage, respectively. Through Pearson correlation coefficient analysis, suitable HFs were selected as indicators for battery SOH and model inputs, aiming to reduce model training and computation time. Aiming at the traditional Elman neural network which also suffers from the drawbacks mentioned above, such as the susceptibility to local minima, slow convergence, and the difficulty in selecting initial weights and thresholds, this study optimized the model using the Sparrow Search Algorithm (SSA). The SSA-Elman neural network SOH estimation model was established to improve estimation accuracy and robustness.
2 Data Set Analysis and Feature Extraction
Using data-driven approaches, the estimation of battery SOH depends on establishing a nonlinear mapping between HFs and SOH. Therefore, the selection of HFs is a critical factor affecting estimation accuracy. During the battery aging process, extracting HFs from discharge conditions is generally challenging due to their complexity. In contrast, battery charging typically follows a constant current followed by constant voltage (CC-CV) pattern, making features extracted from the constant current charging stage more practically applicable in real-world settings [20]. Furthermore, existing SOH estimation methods predominantly rely on voltage features without considering temperature characteristics during battery aging. Utilizing different types of features, including both voltage and temperature, can effectively enhance the accuracy and robustness of SOH estimation [21]. Therefore, when selecting health features for accurate estimation, priority must be given to the voltage and temperature factors of the battery.
SOH refers to the present energy storage capacity of a lithium-ion battery compared to its capacity when new. Expressed as a percentage, SOH quantifies the battery’s condition throughout its lifecycle, offering a clear measurement of its current performance level and efficiency [22]. Currently, SOH can be defined in various ways, primarily focusing on capacity, energy, internal resistance, cycle count, peak power, and other aspects. The most commonly used definitions of SOH are as shown in Eq. (1):
In the equation, Qrate denotes the battery’s rated capacity at the time of manufacture, while Qaged represents the remaining usable capacity of the battery after it has been in operation.
2.2 Analysis of the Oxford Battery Ageing Dataset
The Oxford Battery Ageing dataset was developed by Birkl et al. at the University of Oxford, UK, through a long-term ageing experiment involving eight Kokam lithium cobalt-oxide batteries. Each of the eight cells, designated as Cell1 to Cell8, had a rated capacity of 740 mAh. During the testing process, the batteries were placed in a Binder thermostat, maintaining an ambient temperature of 40°C, while being subjected to identical charging and discharging protocols. In the ageing experiment, the cells were charged at a 2C current (where 1C = 740 mA) and discharged under Urban Artemis conditions to simulate real-world vehicle operation. Data on voltage, current, and surface temperature were collected using a Bio-logic MPG-205 battery tester with a sampling interval of 1 s for every 100 cycles until the end of the batteries’ useful life. Except for Cell2, the capacity of all cells remained relatively stable, without notable capacity fluctuations, as the number of cycles increased.
2.3 Temperature Feature Extraction Based on the DTV Method
The DTV analysis method allows for simultaneous consideration of both battery voltage and temperature factors. Unlike other methods, it does not require experiments to be conducted under constant temperature conditions [23]. The definition of DTV is the ratio of the change in temperature over time to the change in voltage over time, expressed as shown in Eq. (2):
In the equation, DTV represents the differential thermal voltage change, where T is the surface temperature, V is the voltage, and t is the time.
Due to limitations in temperature sensor sampling frequency and performance, the temperature data of the battery exhibit some local fluctuations. For example, the temperature data of Oxford Battery Cell1 at Cycle 100 is shown in Fig. 1.
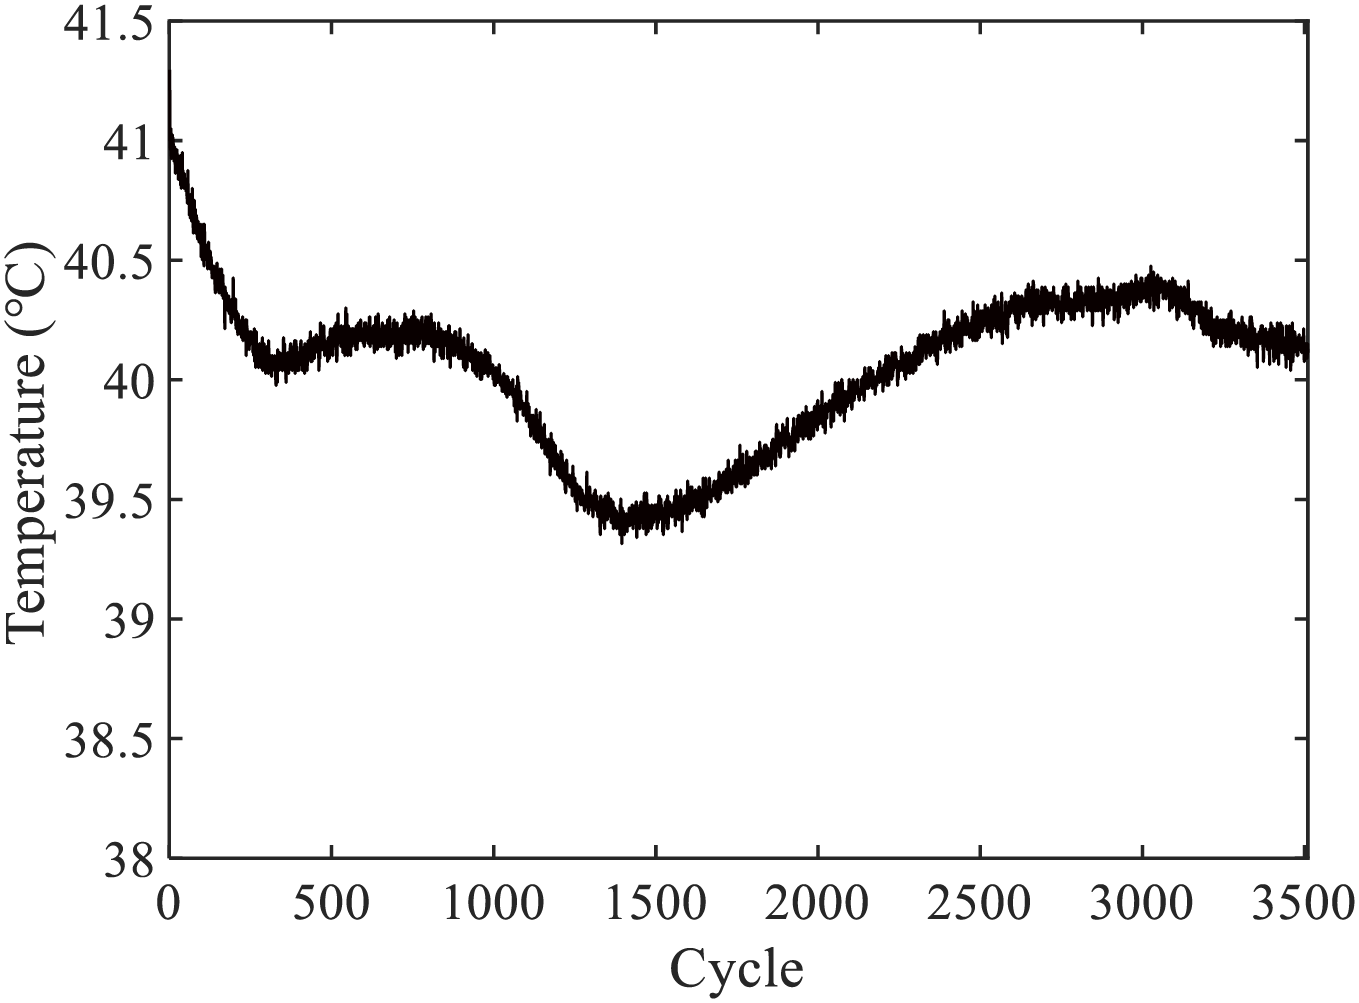
Figure 1: Temperature data of Cycle 100 of Oxford Cell Cell1
Therefore, in the process of plotting the DTV curve, noise reduction is an essential step in the battery data processing. According to the definition of DTV, direct calculation of the data can amplify the influence of measurement noise on the DTV curve, especially at voltage plateaus.
To reduce the impact of errors, during the experimental process, battery data is reconstructed using local weighted quadratic regression smoothing for the DTV curve, with a window size set to 0.5. As an example, the smoothed DTV curve for the charging data of Cell1 over several cycles is shown in Fig. 2.
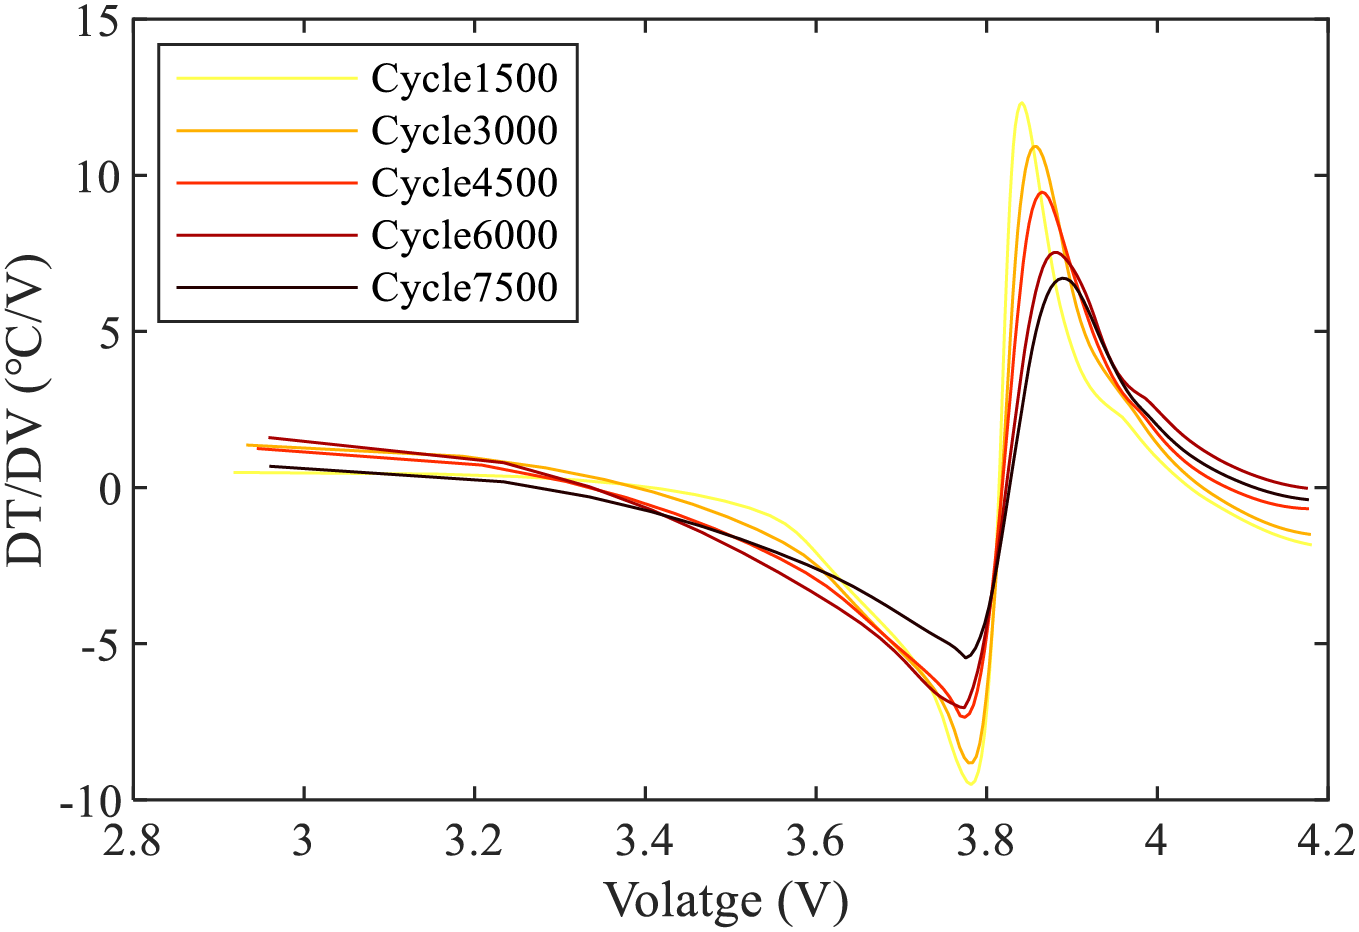
Figure 2: DTV curve of the Cell1 part of the cycle after smoothing treatment
In the case of Cell1, it can be observed that the DTV curve undergoes noticeable changes in certain geometric features such as peaks, valleys, and their corresponding voltage positions as the cycle count increases, as illustrated in Fig. 3. The valley of the DTV curve is denoted as V_DTV, and the peak is denoted as P_DTV. Similarly, the position corresponding to the valley in the voltage is denoted as PV_DTV, and the position corresponding to the peak is denoted as PP_DTV. As shown in Fig. 4, the DTV curve exhibits some significant outliers in peak and valley magnitudes, which somewhat impacts its correlation with battery SOH. However, the peak position PP_DTV is less affected by these outliers. Merla et al. [24] decoupled the DTV curve into individual peaks representing specific phases and utilizes peak parameters as features for SOH estimation. However, this decoupling and peak extraction process increases computational complexity.
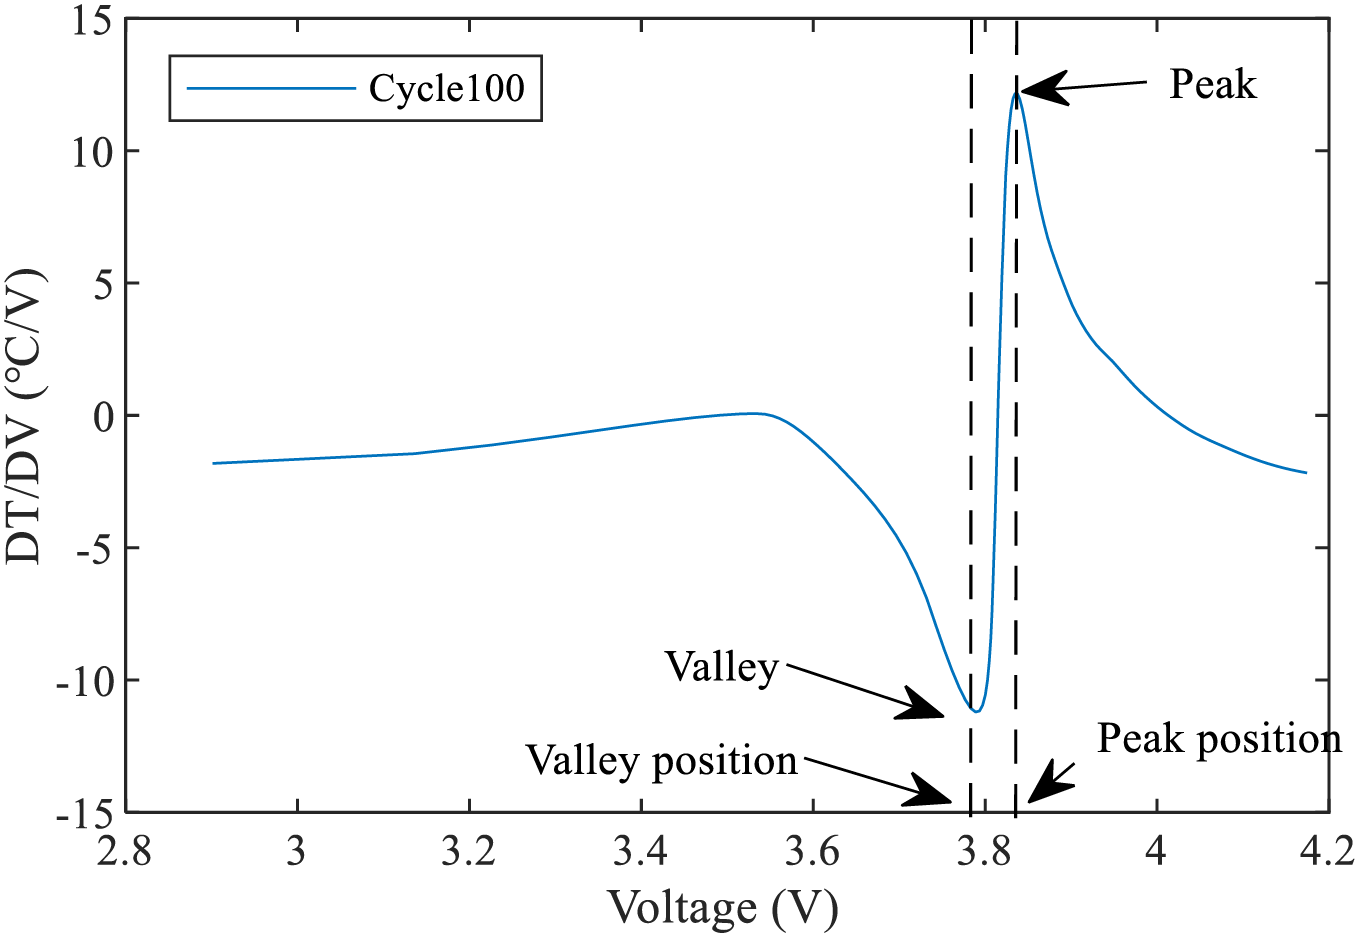
Figure 3: Features of the DTV Curve
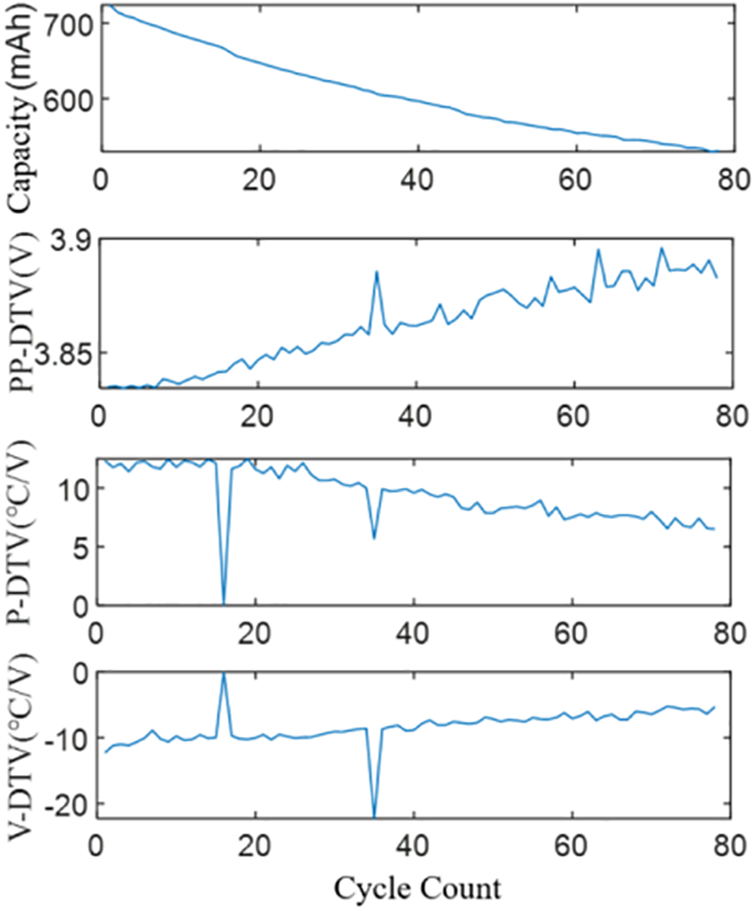
Figure 4: Trends in the peaks and troughs of Cell1
2.4 Voltage Feature Extraction Based on IC Method
The IC analysis method investigates battery aging mechanisms from the perspective of electrode-level behavior. One of its key features is its ability to transform the voltage plateaus of batteries into easily distinguishable peaks on the IC curves. These IC peaks reflect the phase transition characteristics of lithium-ion active materials during the processes of intercalation and deintercalation [25]. The primary principle of IC analysis is the rate of change of battery capacity relative to battery voltage, defined as shown in Eq (3):
In the equation, Q represents discharge capacity, V denotes voltage, I stands for discharge current, and t denotes discharge time.
According to the definition, it is known that the IC analysis method, similar to the DTV analysis method, can produce significant errors at voltage plateaus. Therefore, the same smoothing method is applied to the DTV curve to reduce the impact of these errors. The variation in IC curves is shown in Fig. 5.
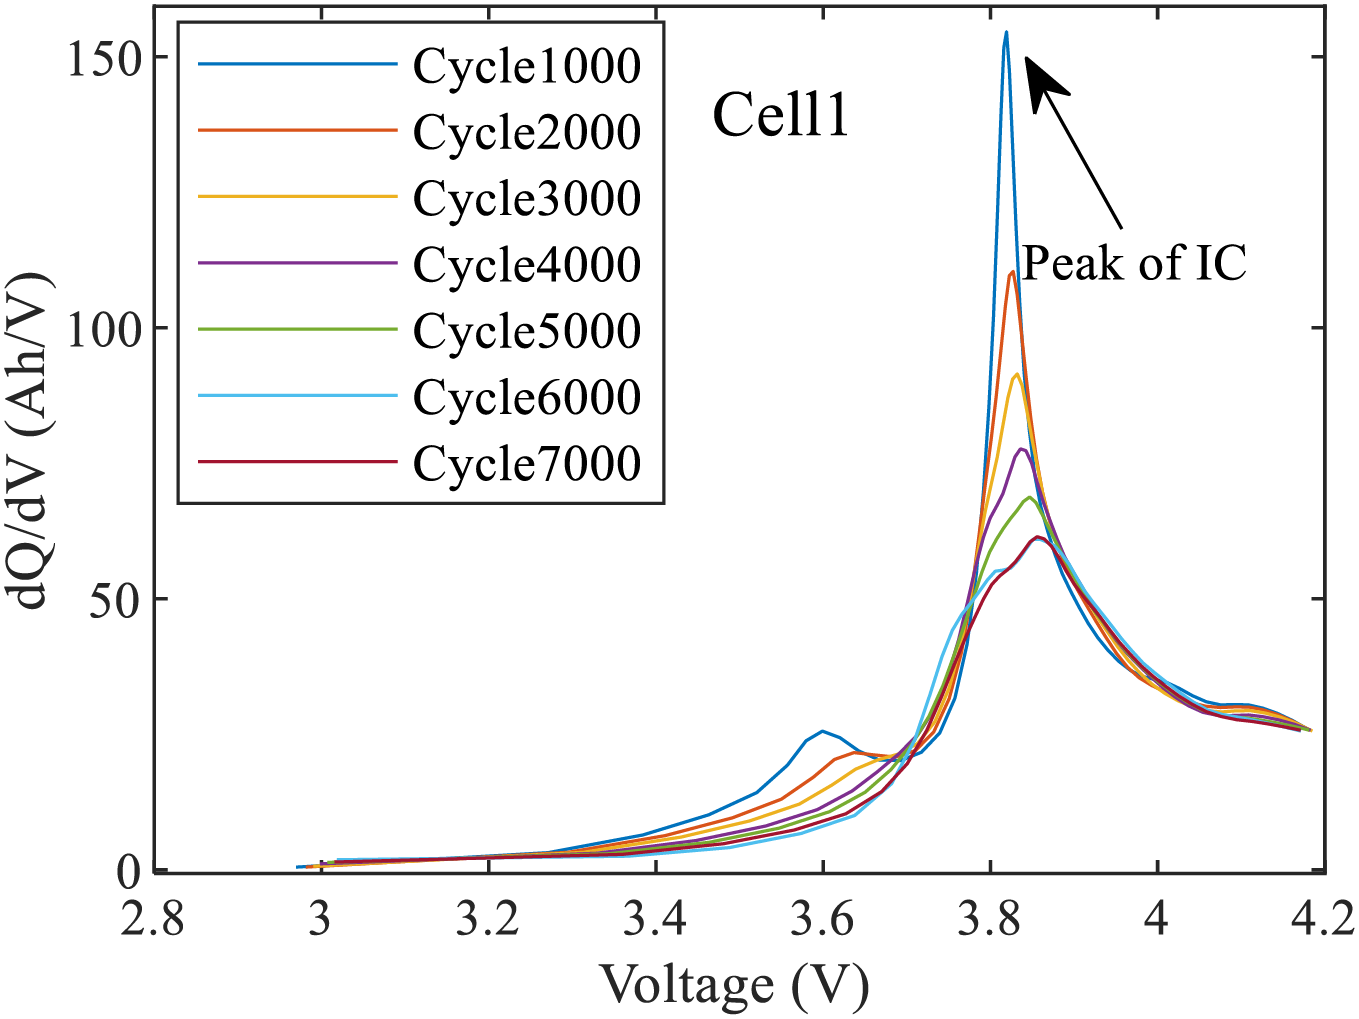
Figure 5: Trend of IC curves for battery Cell1
From Fig. 5, it can be observed that with battery aging, the maximum peak of the IC curve exhibits a pronounced trend of change. In the text, this IC peak is denoted as P_IC.
2.5 Selection of Health Features
According to the aforementioned methods, battery characteristic parameters are extracted through DTV analysis and IC analysis, resulting in the peaks, valleys, and their corresponding voltage positions from the DTV curve, as well as the peaks from the IC curve. To select suitable HF, the Pearson correlation coefficient is used to measure the degree of correlation between HF and capacity. The definition of Pearson analysis is shown in Eq. (4):
In the equation, R is the Pearson correlation coefficient, n is the total number of samples, xi represents the health features, yi represents the battery SOH, and

As presented in Table 1, the absolute Pearson correlation coefficients for the health features PP_DTV and P_IC across batteries Cell1 to Cell8 are consistently greater than 0.9, indicating a high degree of correlation. This demonstrates that PP_DTV and P_IC can be used to characterize battery aging and are suitable for SOH estimation. Therefore, this paper proposes a feature combination based on DTV analysis and IC analysis for the estimation of battery SOH. The effectiveness of the proposed feature combination will be validated through the experimental testing phase of this study.
Data-driven methods for SOH estimation mainly rely on machine learning algorithms to create a nonlinear mapping between HFs and the battery’s SOH. The trained predictive model is then used to estimate SOH.
The Elman neural network, a dynamic recurrent neural network, was first introduced in 1990 to address challenges in speech processing [26]. It is a classic example of a local recurrent network, consisting of four main layers: input, hidden, context, and output layers, as illustrated in Fig. 6. In contrast to the BP neural network, the Elman network includes a context layer, which functions as a one-step delay operator to facilitate memory. This context layer receives feedback from the hidden layer, with each hidden node corresponding to a node in the context layer. The context layer stores the hidden layer’s previous state and integrates it with the current input to form the input for the hidden layer, essentially providing state feedback. The hidden layer’s transfer function is still a nonlinear function, most commonly a Sigmoid function. With its enhanced computational power compared to feedforward neural networks, the Elman network is capable of addressing more complex dynamic problems, including rapid optimization tasks.
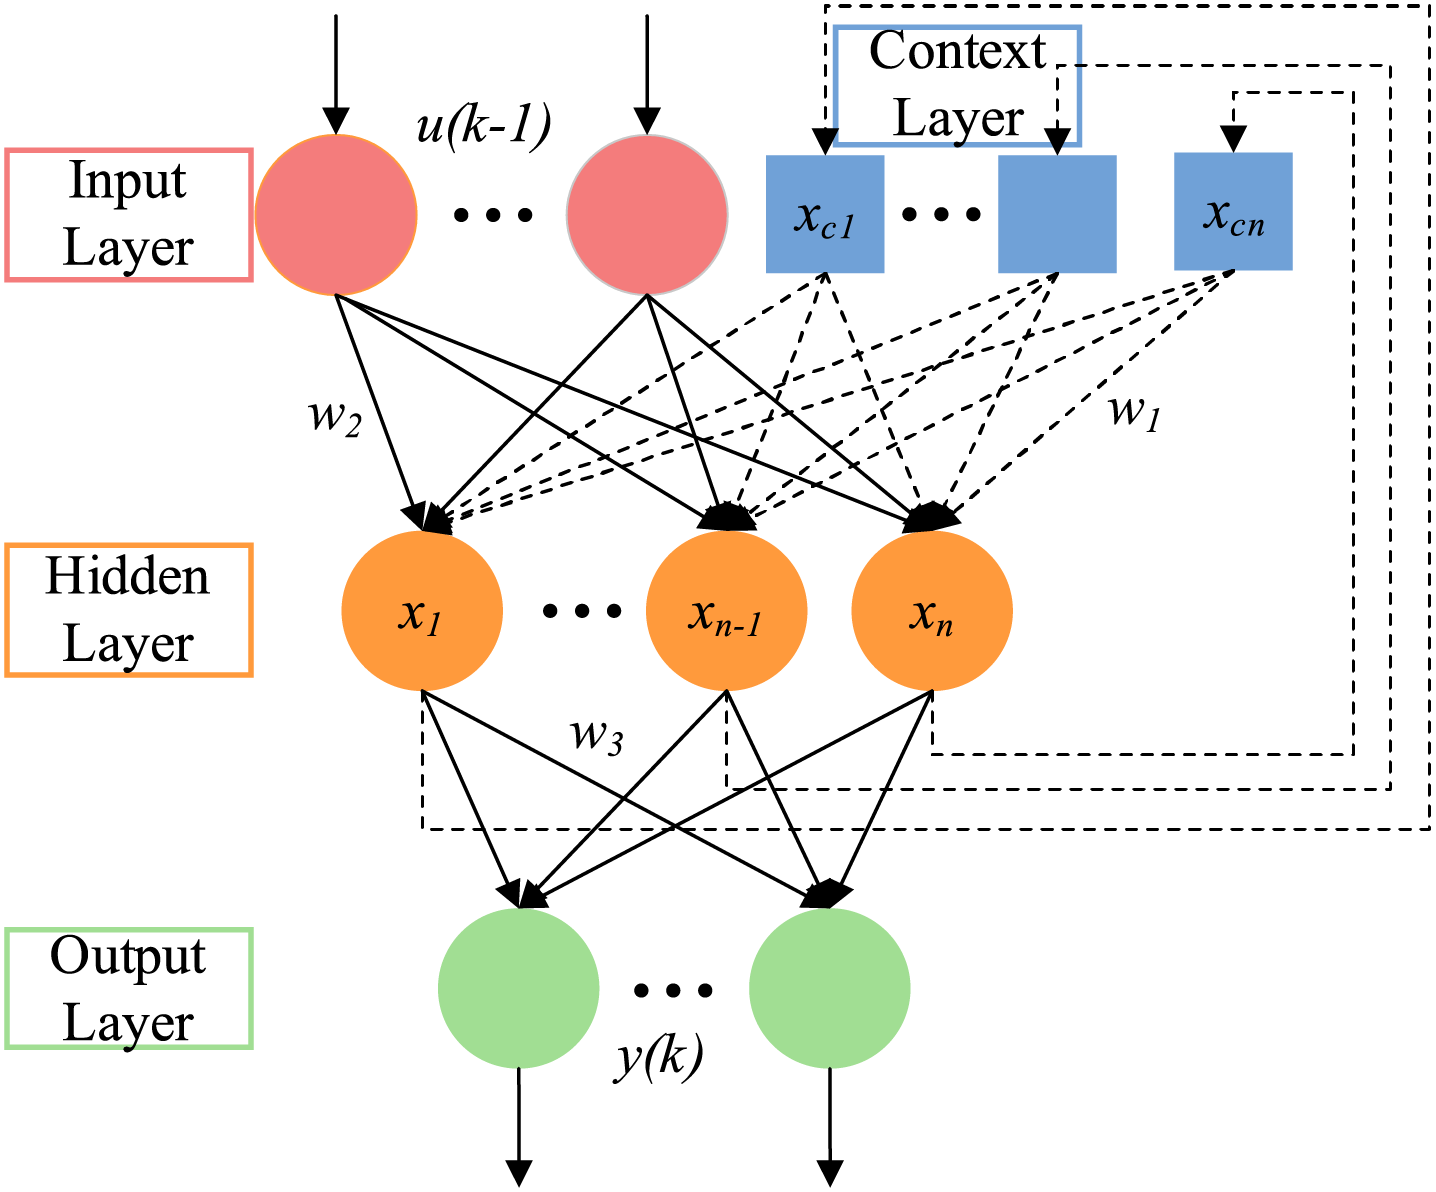
Figure 6: Elman network structure
Nonlinear state space representation of the Elman network is as shown in Eq. (5):
The neurons in the hidden layer can be represented as Eq. (6):
The hidden layer’s output is fed back into its input via the delay and storage mechanism of the subsequent layer, establishing a recurrent connection, resulting in the following relationship being expressed in Eq. (7):
In the equation, y denotes the output node vector, x represents the hidden layer node unit vector, u stands for the input vector, xc represents the feedback state vector, w3 signifies the connection weights from the hidden layer to the output layer, w2 denotes the connection weights from the input layer to the hidden layer, and w1 denotes the weights from the context layer to the hidden layer.
The traditional Elman neural network frequently demonstrates limited robustness, primarily attributable to the stochastic nature of its initial weights and thresholds. This randomness can result in slower convergence rates and a higher probability of the model becoming ensnared in local optima. To improve both the predictive accuracy and stability of the Elman neural network model, it is essential to optimize these initial weights and thresholds.
3.2 The Sparrow Search Algorithm
The SSA is an intelligent optimization method inspired by the foraging and anti-predatory behaviors of sparrows. It offers several advantages, including rapid convergence speed and a broad search capability. The core principle of the algorithm involves simulating the predation and anti-predation behaviors of a sparrow population by dividing it into discoverers and joiners, where the sparrows with better fitness are considered discoverers [27]. The process of building the SSA is shown below.
The initialization of the sparrow population position is first carried out as shown in Eq. (8):
In this context, d signifies the dimensionality of the variables requiring optimization, specifically the initial weights and thresholds of the Elman neural network in this study. Meanwhile, n refers to the total number of individuals within the sparrow population. The fitness of all sparrows can be expressed as shown in Eq. (9):
The f in Eq. (9) denotes the value of population fitness.
As mentioned in the previous section, we divided the sparrow population into discoverers and joiners, and the higher the fitness value of the former, the easier it is to obtain food, because the duty of the discoverers is not only to make food available for themselves, but also need to provide other sparrow individuals can forage area and foraging direction. Building on this concept, the discoverer possesses a more extensive foraging area than the follower. The process of iterative updating allows for the location of the discoverer to be represented by Eq. (10):
In the Eq. (10), t represents the current iteration number; j = 1, 2, …, d;
Followers base their foraging activities on the directional cues provided by the discoverers, with their position updates governed by Eq. (11):
In the formula, Xp represents the current optimal position occupied by the explorer, and Xw denotes the current globally worst position. A is a 1xd order matrix, with each element randomly assigned a value of 1 or −1, A+ = AT(AAT)−1. When
During the experiment, 10% to 20% of sparrows became aware of danger and avoided it, and their initial positions were randomly generated within the population. The formula for updating their position is as Eq. (12):
In the formula, fi is the fitness value of the i-th sparrow; fg and fw are respectively the best and worst fitness values within the global scope; Xp and Xw are respectively the fitness values of the global best and worst solutions; β and K are step size control parameters.
From the above analysis, the SSA model can be constructed to optimize the Elman neural network, following the procedure outlined in Fig. 7.
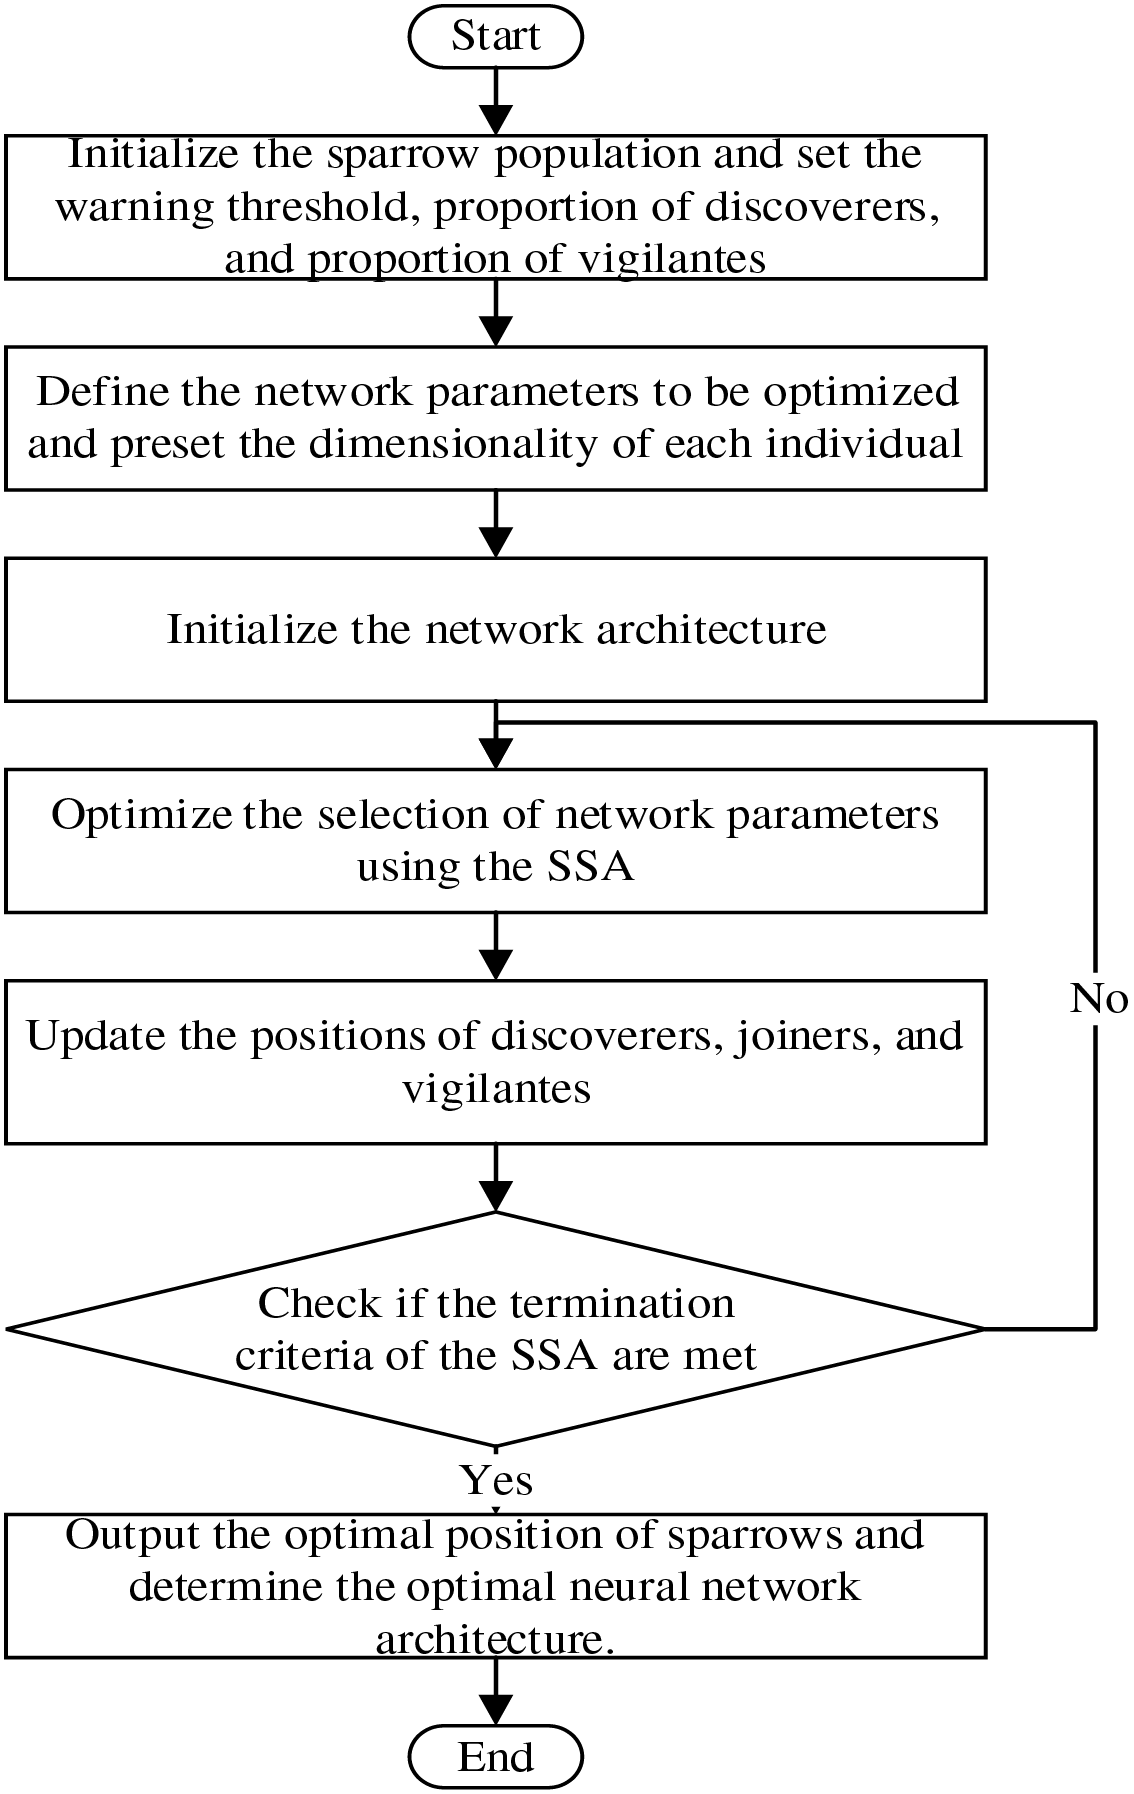
Figure 7: SSA algorithm flowchart
3.3 SSA-Elman Based SOH Estimation Methodology
Similar to the BP network, the Elman neural network also relies on gradient descent, which has limitations such as slow convergence and vulnerability to local minima, making it challenging to achieve global optimization during neural network training. Typically, when the Elman network is used for predictive tasks, the initial weights and thresholds are set using pseudo-random numbers, resulting in unstable performance and affecting prediction accuracy. To address this, the SSA is employed to optimize the Elman network’s initial weights and thresholds, thereby enhancing prediction accuracy. The fitness function is formulated as the mean absolute error between the estimated and actual values of the lithium batteries. Fig. 8 presents the overall experimental framework of the SSA-Elman-based SOH estimation method for lithium-ion batteries, which is divided into three main parts: data processing, model construction, and testing and analysis.
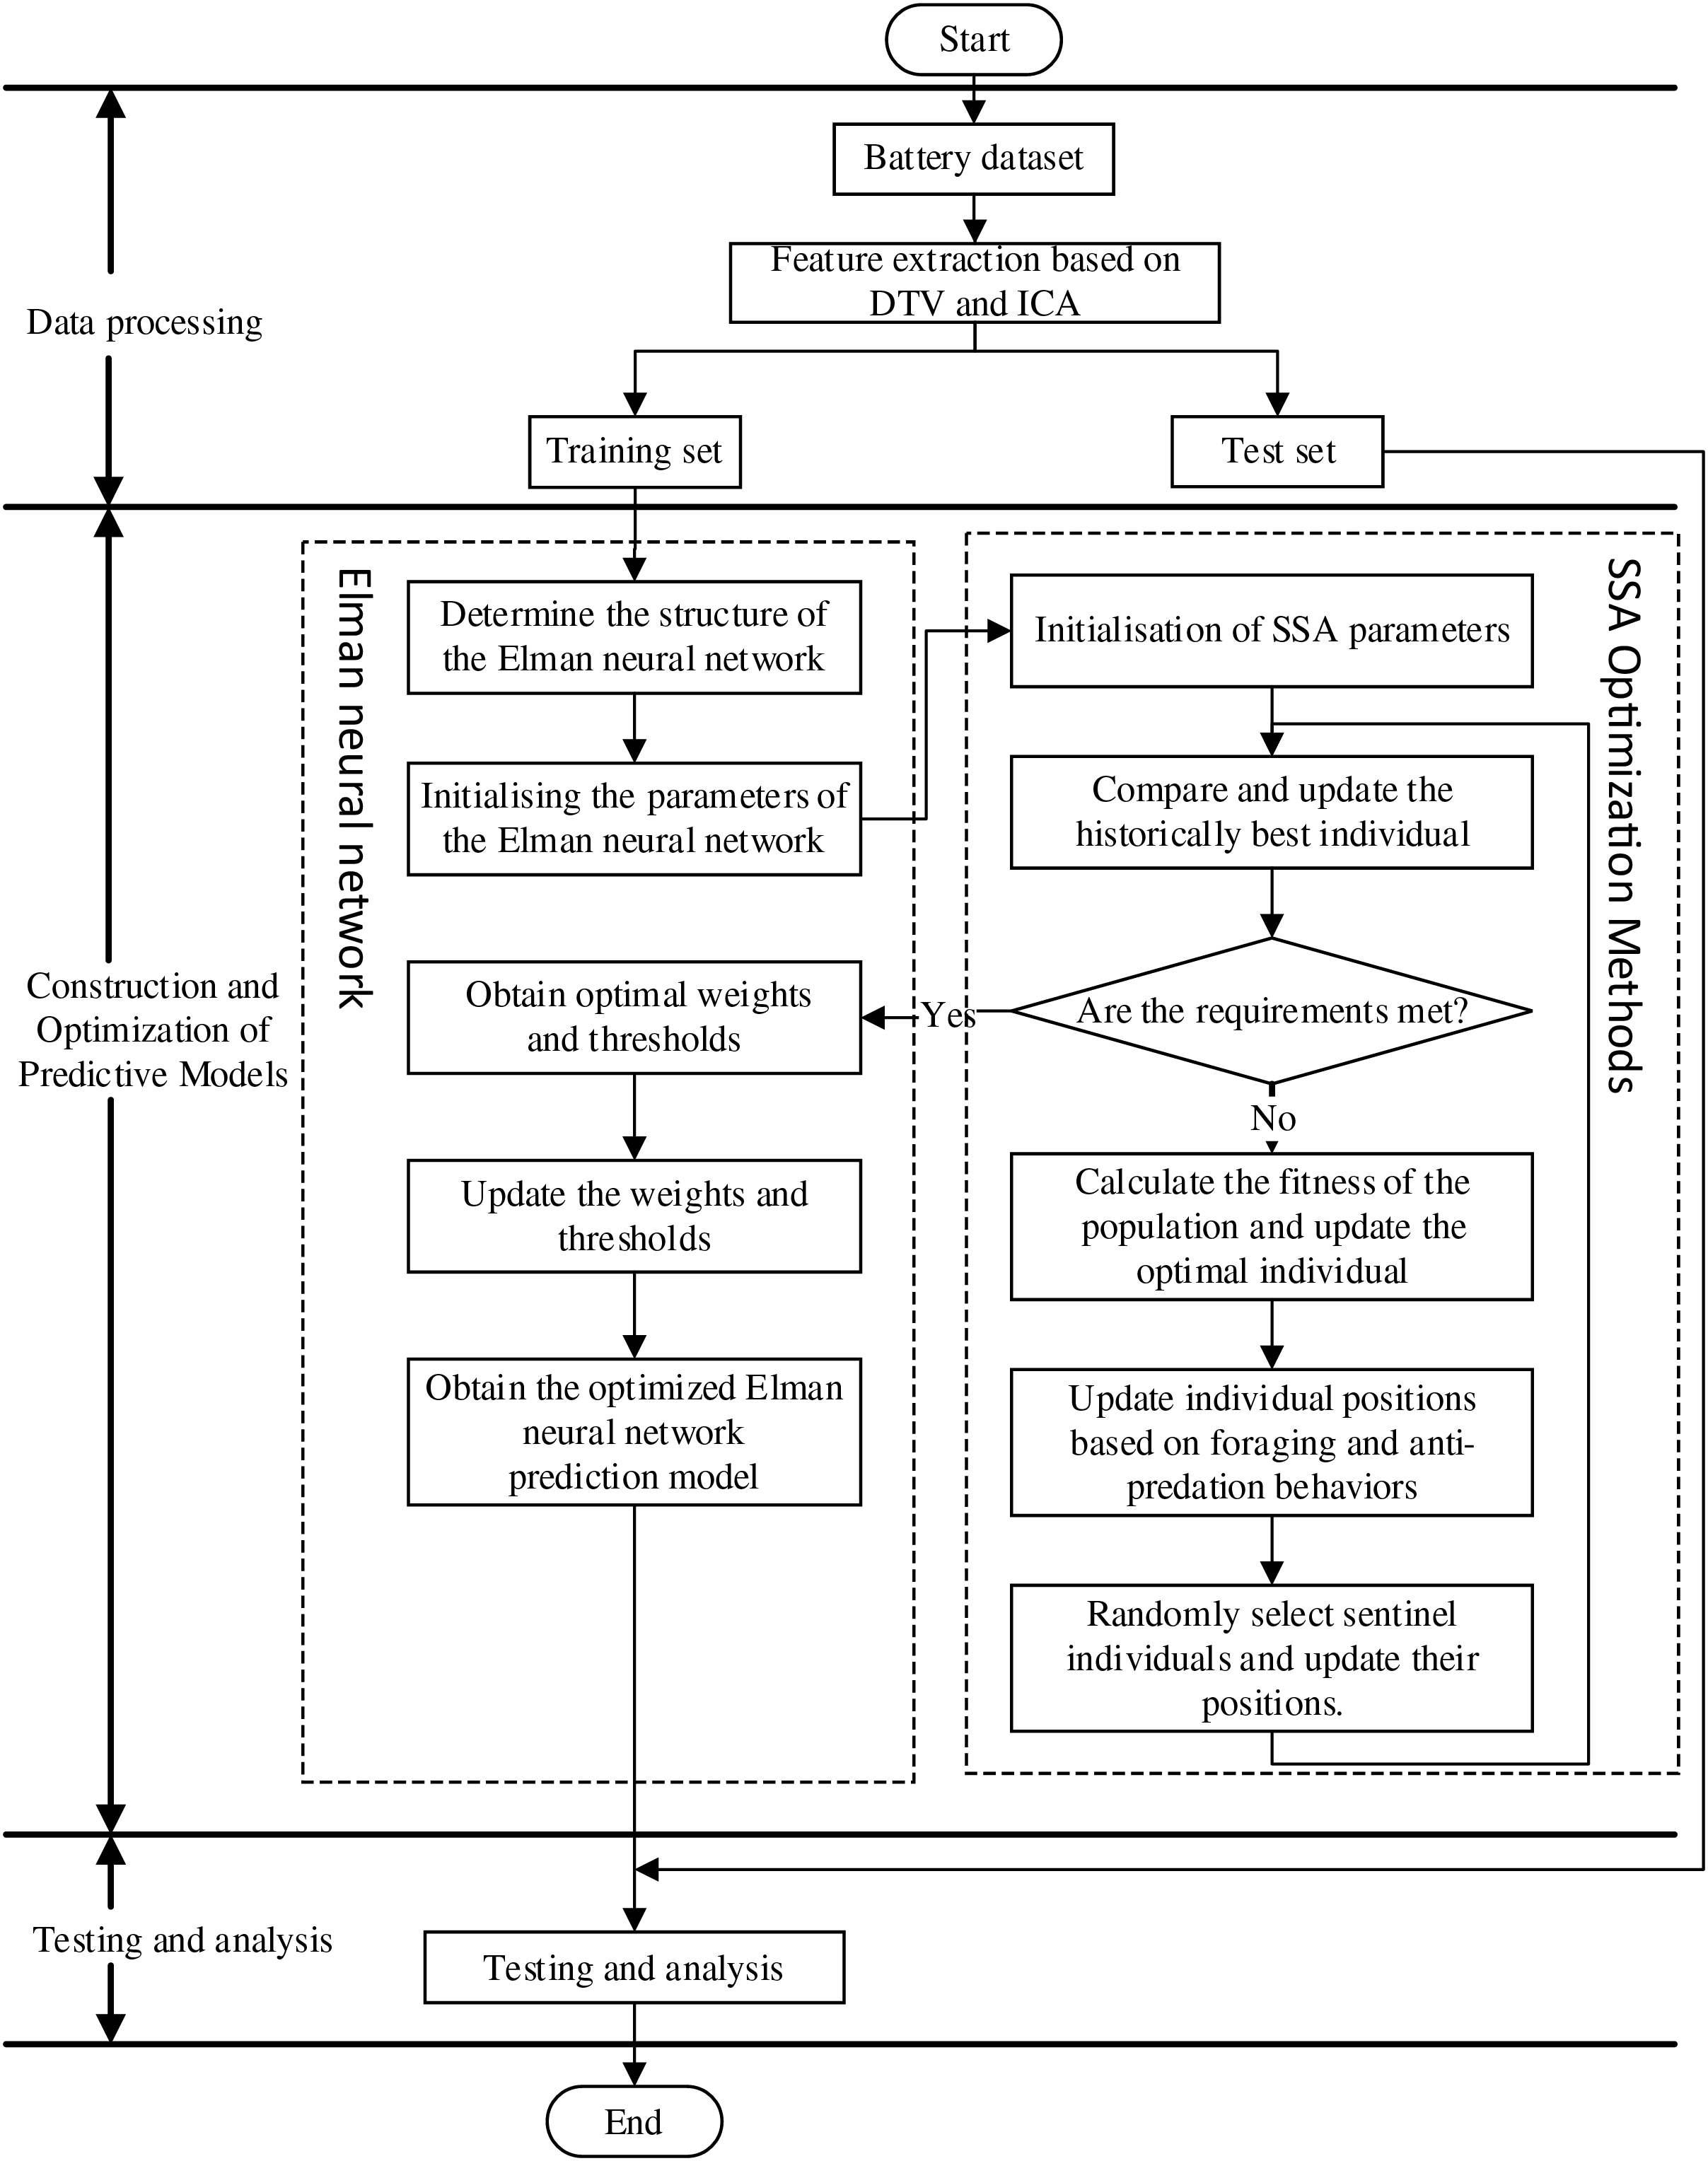
Figure 8: Diagram of the experimental scheme of the SOH estimation method based on SSA-Elman algorithm
The process can be divided into the following 5 steps:
(1) The dataset was identified and voltage features and temperature features were extracted using the DTV and ICA identified in Chapter 2, and then the battery data was divided into two parts: the training set and the test set.
(2) Based on the training set in Step 1, determine the structure of the Elman neural network, and initialize parameters such as weights, thresholds, number of iterations, and learning rate to construct the Elman neural network.
(3) Set the individual parameters of the sparrow population, specifically the parameters of the maximum number of iterations of the population, the size of the population, the share of discoverers in the population, the share of followers, and the maximum number of trainings of the algorithm.
(4) Compute the fitness of the initial sparrow individuals in the population and begin the iterative training cycle. The SSA algorithm calculates the population fitness value, continuously updating the current optimal individual. Throughout the process, the sparrow population performs foraging and anti-predation behaviors. The value of the best individual is compared and updated at each iteration. Once the maximum number of iterations is reached or the optimal solution during the process is smaller than the predefined threshold, the system evaluates whether the optimal solution has been achieved, and if so, terminates the loop early.
(5) The optimal solution obtained in Step 4 is brought in as parameters such as the optimal weight threshold required for the Elman network model to construct the optimal SOH prediction model, and the optimized prediction model is used for online estimation of battery SOH.
Among the parameters of the initial sparrow algorithm after many experiments and experiences were set as follows: the maximum number of iterations of the population was 30, the number of sparrows was set to 20, the weight of sparrow scouts was 0.2, the weight of spotters was 0.8, and the value of the population warning was 0.7.
The Oxford battery dataset is utilized to validate the feasibility and accuracy of the proposed SOH estimation method. To perform a quantitative evaluation, Mean Absolute Error (MAE) and Root Mean Squared Error (RMSE) are employed, as presented in Eqs. (13) and (14). In these equations, xi and
Based on Table 1, it is evident that the PP_DTV of the DTV curve exhibits a strong correlation with battery SOH, with Pearson correlation coefficients consistently exceeding 0.91 in absolute terms. The experimental design is structured as follows: the first 50 cycles of data from Cell1 are utilized as the training set to develop the prediction model, while the remaining data from Cell1, along with data from the other batteries, serve as the testing set for evaluation. Health features are extracted from the selected experimental data using the DTV and IC feature extraction methods described in Chapter 2. Following the data partitioning, the prediction model is trained on the training set and tested on the testing set. The results of SOH estimation using various neural networks, including the SSA-Elman model proposed in this study, are shown in Fig. 9, with the corresponding MAE and RMSE values provided in Table 2. Fig. 9 demonstrates that the SSA optimization of Elman’s initial weights and thresholds effectively mitigates the problem of local minima during Elman’s estimation, resulting in improved prediction accuracy. The alignment between the estimated SOH values from SSA-Elman and the actual SOH is notably precise.
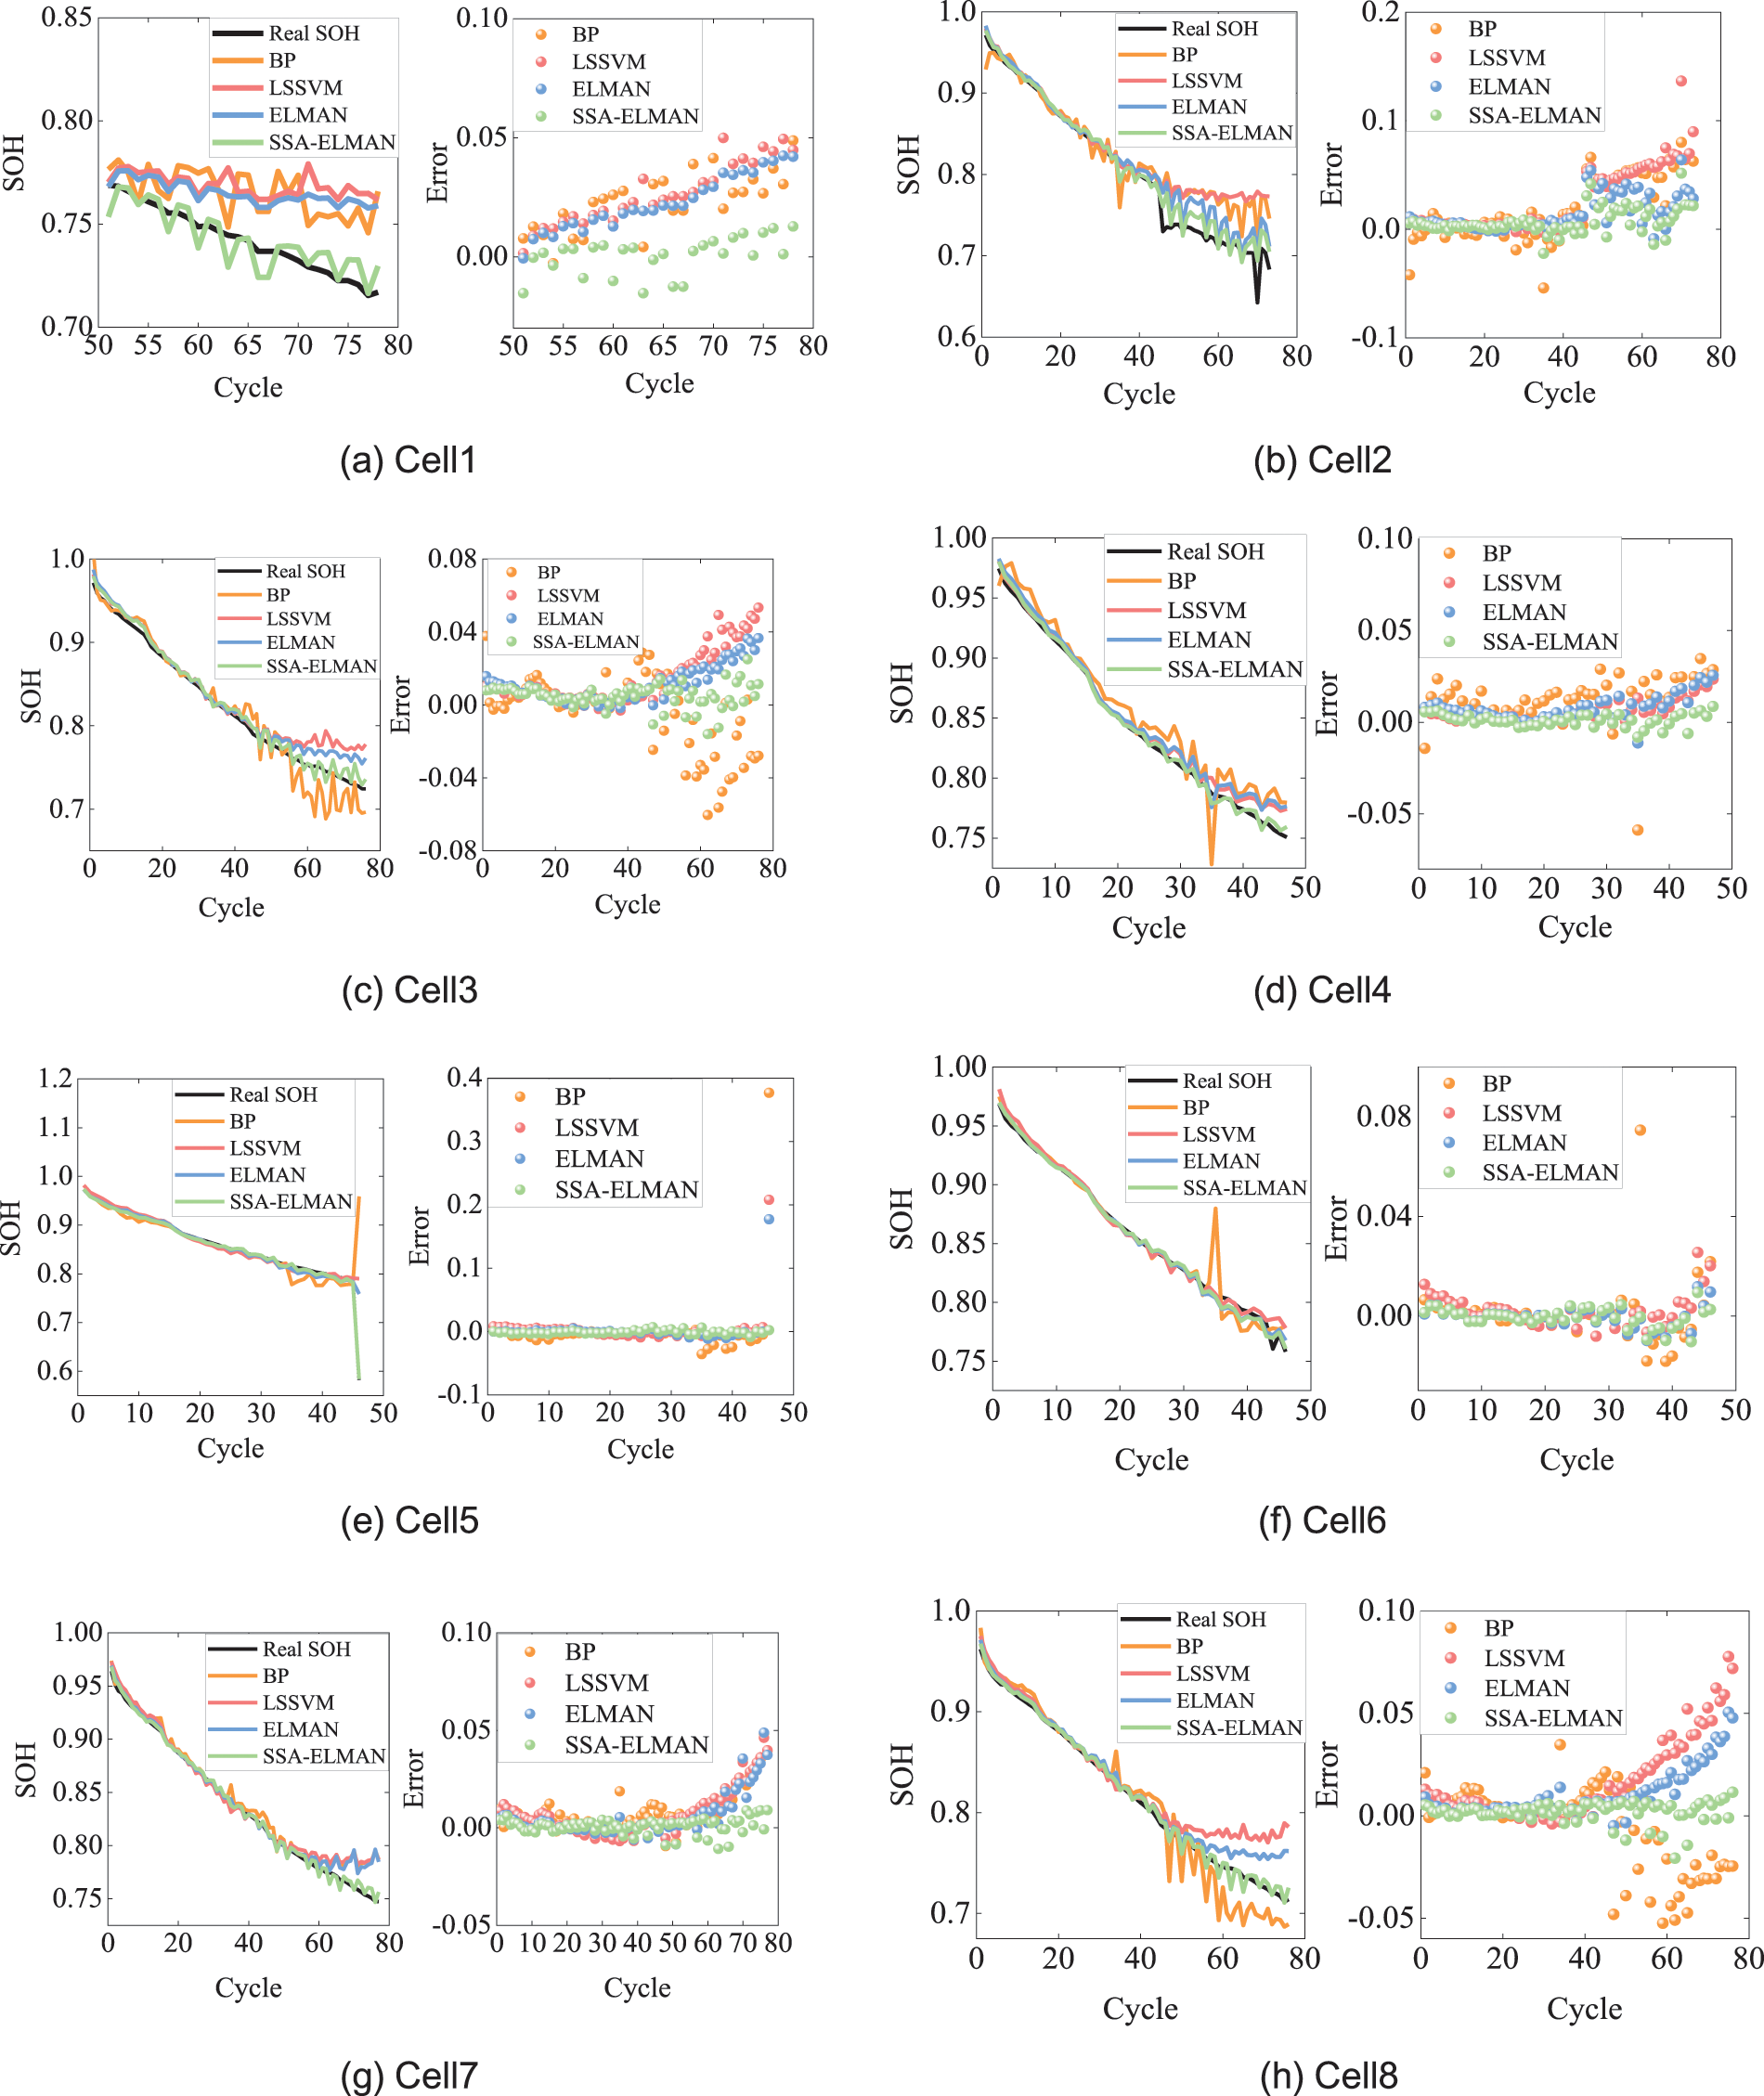
Figure 9: Predicted results from different methods

Table 2 shows the errors for each battery. Except for Cell5, using different methods based on the features proposed in this paper, the SOH estimation errors in terms of MAE do not exceed 2.7% and RMSE does not exceed 3.9%. Moreover, the SOH estimation errors using the SSA-ELMAN method are less than 0.9% for MAE and less than 1.4% for RMSE. This indicates that the proposed PP_DTV and P_IC feature combination can effectively reflect the aging status of batteries, including the sudden drop in SOH observed at the end of testing for Cell5 due to a fault. For SSA-ELMAN, the estimation errors are less than 0.3% for MAE and less than 0.35% for RMSE, demonstrating that the SOH estimation method based on the proposed features and SSA-Elman can achieve highly accurate SOH estimation results.
This study proposes a battery SOH estimation method based on the fusion of DTV curve features and IC curve features using SSA-Elman. Firstly, health features are extracted: PP_DTV, which considers temperature factors, is extracted through DTV analysis, and P_IC, which considers voltage factors, is extracted through IC analysis. The Pearson correlation analysis is then used to analyze the correlation between each feature and SOH.
Next, the weights and thresholds of the Elman neural network are optimized using the SSA, and the estimation results based on SSA-Elman are compared and analyzed against results from different neural networks. The model prediction results indicate that with consideration of temperature factors, the model achieves an estimation error of MAE less than 0.9% and RMSE less than 1.4%. This represents an improvement in accuracy compared to other models. Additionally, the SSA algorithm optimizes the Elman neural network to address issues such as susceptibility to local minima, slow convergence, and difficulty in selecting correct initial weights and thresholds.
The above analysis demonstrates the advantages and feasibility of the model proposed in this study. Accurate battery aging estimation for BMS can be provided by the proposed method in this study. Meanwhile, the on-board BMS system emphasizes on real-time, and the present method is an online estimation method. From these two aspects, this study has some practical value for the development or operation of BMS, which is important for prolonging battery life, predicting maintenance needs and ensuring safe operation. However, this study also has some limitations, mainly because lithium-ion batteries are evolving from single cells to more modular and systematic configurations. Estimating the SOH in battery pack systems will be the focus of our future research.
Acknowledgement: I would like to thank Professor Yu Zhang for her guidance on this paper, as well as Professor Tiezhou Wu for his support of the research and project, and my colleagues for their help and encouragement.
Funding Statement: This work was supported by the National Natural Science Foundation of China (NSFC) under Grant (No. 51677058).
Author Contributions: The authors confirm contribution to the paper as follows: study conception and design: Daoyu Zhang, Yu Zhang, Tiezhou Wu; data collection: Daoyu Zhang, Yu Zhang; analysis and interpretation of results: Daoyu Zhang, Yu Zhang, Tiezhou Wu; draft manuscript preparation: Daoyu Zhang. All authors reviewed the results and approved the final version of the manuscript.
Availability of Data and Materials: The data that support the findings of this study are available from the corresponding author, Daoyu Zhang, upon reasonable request.
Ethics Approval: Not applicable.
Conflicts of Interest: The authors declare that they have no conflicts of interest to report regarding the present study.
References
1. B. J. Guo, L. N. Jia, J. H. Zhu, and X. Zhang, “Research progress in sulfide electrolytes for all-solid-state Li-ion battery,” Battery Bimonthly, vol. 54, no. 4, pp. 559–563, Aug. 2024. doi: 10.19535/j.1001-1579.2024.04.025. [Google Scholar] [CrossRef]
2. B. Li, B. Liu, and C. Li, “A review of thermal safety management techniques for lithium-ion energy storage power stations under new power systems,” New Power Syst., vol. 2, no. 2, pp. 126–139, May 2024. doi: 10.20121/j.2097-2784.ntps.240014. [Google Scholar] [CrossRef]
3. J. S. Karunarathna, U. K. Madawala, M. Sandelic, F. Blaabjerg, and C. Baguley, “The impact of operational and environmental conditions on battery lifetime in fast electric vehicle charging systems,” IEEE Trans. Power Electron., vol. 39, no. 4, pp. 4645–4656, Apr. 2024. doi: 10.1109/TPEL.2023.3342121. [Google Scholar] [CrossRef]
4. A. Bavand, S. A. Khajehoddin, M. Ardakani, and A. Tabesh, “Online estimations of li-ion battery SOC and SOH applicable to partial charge/discharge,” IEEE Trans. Transp. Electrification, vol. 8, no. 3, pp. 3673–3685, Sep. 2022. doi: 10.1109/TTE.2022.3162164. [Google Scholar] [CrossRef]
5. Z. Meng, K. A. Agyeman, and X. Wang, “Multi-segment state of health estimation of lithium-ion batteries considering short partial charging,” IEEE Trans. Energy Convers., vol. 38, no. 3, pp. 1913–1923, Sep. 2023. doi: 10.1109/TEC.2023.3242876. [Google Scholar] [CrossRef]
6. J. Wu, X. Cui, J. Meng, J. Peng, and M. Lin, “Data-driven transfer-stacking-based state of health estimation for lithium-ion batteries,” IEEE Trans. Ind. Electron., vol. 71, no. 1, pp. 604–614, Jan. 2024. doi: 10.1109/TIE.2023.3247735. [Google Scholar] [CrossRef]
7. S. J. Yang, B. Y. Luo, J. Wang, J. Q. Kang, and G. R. Zhu, “State of health estimation for lithium-ion batteries based on peak region feature parameters of incremental capacity curve,” J. Electrical Eng. Technol., vol. 36, no. 11, pp. 2277–2287, Jun. 2021. doi: 10.19595/j.cnki.1000-6753.tces.L90355. [Google Scholar] [CrossRef]
8. X. H. Li, B. H. Chen, Q. L. Gu, J. Wang, and X. F. Wei, “Research progress of health assessment methods for lithium ion batteries,” Power Technol., vol. 45, no. 6, pp. 818–822, Nov. 2021. doi: 10.3969/j.issn.1002-087X.2021.06.032. [Google Scholar] [CrossRef]
9. Q. Y. Chen, Y. H. He, G. D. Yu, M. Y. Liu, C. Xu and Z. M. Li, “Integrating model- and data-driven methods for accurate state estimation of lithium-ion batteries,” Energy Storage Sci. Technol., vol. 12, no. 1, pp. 209–2017, Jan. 2023. doi: 10.19799/j.cnki.2095-4239.2022.0508. [Google Scholar] [CrossRef]
10. Y. X. Fan, F. Xiao, J. Xu, G. R. Yang, and X. Tang, “State of health estimation of lithium-ion batteries based on the partial charging voltage segment and kernel ridge regression,” (in ChineseChin. J. Electr. Eng., vol. 41, no. 16, pp. 5661–5670, Aug. 2021. doi: 10.13334/j.0258-8013.pcsee.201805. [Google Scholar] [CrossRef]
11. C. She, Z. Wang, F. Sun, P. Liu, and L. Zhang, “Battery aging assessment for real-world electric buses based on incremental capacity analysis and radial basis function neural network,” IEEE Trans. Ind. Inform., vol. 16, no. 5, pp. 3345–3354, May 2020. doi: 10.1109/TII.2019.2951843. [Google Scholar] [CrossRef]
12. K. A. Severson et al., “Data-driven prediction of battery cycle life before capacity degradation,” Nat. Energy, vol. 4, no. 5, pp. 383–391, May 2019. doi: 10.1038/s41560-019-0356-8. [Google Scholar] [CrossRef]
13. S. Zhang, X. Guo, X. Dou, and X. Zhang, “A rapid online calculation method for state of health of lithium-ion battery based on coulomb counting method and differential voltage analysis,” J. Power Sources, vol. 479, 2020, Art. no. 228740. doi: 10.1016/j.jpowsour.2020.228740. [Google Scholar] [CrossRef]
14. S. Ma et al., “Temperature effect and thermal impact in lithium-ion batteries: A review,” Progress in Nat. Sci. Mater Int., vol. 28, no. 6, pp. 653–666, Dec. 2018. doi: 10.1016/j.pnsc.2018.11.002. [Google Scholar] [CrossRef]
15. H. Chaoui, A. El Mejdoubi, and H. Gualous, “Online parameter identification of lithium-ion batteries with surface temperature variations,” IEEE Trans. Vehicular Technol., vol. 66, no. 3, pp. 2000–2009, Mar. 2017. doi: 10.1109/TVT.2016.2583478. [Google Scholar] [CrossRef]
16. J. Yang, Y. Cai, and C. Mi, “A battery capacity estimation method using surface temperature change under constant-current charge scenario,” in 2021 IEEE Energy Convers. Congr. Expo. (ECCE), Vancouver, BC, Canada, 2021, pp. 1687–1691. doi: 10.1109/ECCE47101.2021.9595207. [Google Scholar] [CrossRef]
17. T. H. Feng, L. Yang, X. W. Zhao, H. D. Zhang, and J. X. Qiang, “Online identification of lithium-ion battery parameters based on an improved equivalent-circuit model and its implementation on battery state-of-power prediction,” J. Power Sources, vol. 281, pp. 192–203, May 2015. doi: 10.1016/j.jpowsour.2015.01.154. [Google Scholar] [CrossRef]
18. Y. Zhang and Y. F. Li, “Prognostics and health management of Lithium-ion battery using deep learning methods: A review,” Renew. Sustain. Energ. Rev., vol. 161, Mar. 2022. doi: 10.1016/j.rser.2022.112282. [Google Scholar] [CrossRef]
19. P. Liu, Y. Luo, Z. Long, K. Chen, K. Liu and G. Q. Gao, “State of health estimation of lithium-ion battery based on elman neural network,” in 2024 IEEE 7th Int. Electr. and Energy Conf. (CIEEC), Harbin, China, 2024, pp. 5005–5009. doi: 10.1109/CIEEC60922.2024.10583619. [Google Scholar] [CrossRef]
20. H. Lu, G. J. Li, and L. C. Zhang, “SOC estimation of lithium battery based on dynamic forgetting factor recursive least squaresand improved particle filtering algorithm,” Automotive Engine, no. 3, pp. 66–73, Jun. 2024. doi: 10.3969/ji.ssn.1001-2222.2024.03.011. [Google Scholar] [CrossRef]
21. P. T. Coman, D. Petrushenko, E. C. Darcy, and R. E. White, “Electrical-thermal modeling and electrical design optimization of fuses in a nickel bus-plate for a Li-ion battery pack,” J. Energy Storage, vol. 86, May 2024. doi: 10.1016/j.est.2024.111226. [Google Scholar] [CrossRef]
22. P. Lall and V. Soni, “Effect of li-ion battery form factor on the SoH degradation under randomized charge-discharge cycles and c-rates,” in 2023 IEEE 73rd Electron. Components Technol. Conf. (ECTC), Orlando, FL, USA, 2023, pp. 1205–1212. doi: 10.1109/ECTC51909.2023.00206. [Google Scholar] [CrossRef]
23. Z. Wang, C. Yuan, and X. Li, “Lithium battery state-of-health estimation via differential thermal voltammetry with gaussian process regression,” IEEE Trans. Transp. Electrification, vol. 7, no. 1, pp. 16–25, Mar. 2021. doi: 10.1109/TTE.2020.3028784. [Google Scholar] [CrossRef]
24. Y. Merla, B. Wu, V. Yufit, N. P. Brandon, R. F. Martinez-Botas and G. J. Offer, “Novel application of differential thermal voltammetry as an in-depth state-of-health diagnosis method for lithium-ion batteries,” J. Power Sources, vol. 307, pp. 308–319, Mar. 2016. doi: 10.1016/j.jpowsour.2015.12.122. [Google Scholar] [CrossRef]
25. J. Q. Chen, Z. H. Li, F. C. Li, X. P. Jiang, W. Pan and J. Chen, “Real-vehicle battery health state estimation based on nonlinear reduced-dimensional IC features,” Automot. Eng., vol. 2, no. 45, pp. 199–208, Feb. 2023. doi: 10.19562/j.chinasae.qcgc.2023.02.005. [Google Scholar] [CrossRef]
26. D. Li, H. Wang, Y. Zhang, and C. Fang, “Power grid load state information perception forecasting technology for battery energy storage system based on elman neural network,” in 2019 IEEE 3rd Inf. Technol. Netw. Electron. Automat. Control Conf. (ITNEC), Chengdu, China, 2019, pp. 914–917. doi: 10.1109/ITNEC.2019.8729075. [Google Scholar] [CrossRef]
27. Y. Zheng, X. Wang, Z. Xu, Y. Dong, M. Hou and S. Guo, “Optimization of BP neural network based on improved SSA algorithm,” in 2023 IEEE 5th Int. Conf. Civil Aviation Safety Inf. Technol. (ICCASIT), Dali, China, 2023, pp. 257–262. doi: 10.1109/ICCASIT58768.2023.10351729. [Google Scholar] [CrossRef]
Cite This Article
 Copyright © 2025 The Author(s). Published by Tech Science Press.
This work is licensed under a Creative Commons Attribution 4.0 International License , which permits unrestricted use, distribution, and reproduction in any medium, provided the original work is properly cited.


 Submit a Paper
 Propose a Special lssue
 View Full Text
 Download PDF
 Downloads
 Citation Tools