 Open Access
ARTICLE
Study of the Transport Behavior of Multispherical Proppant in Intersecting Fracture Based on Discrete Element Method
1 CNOOC Research Institute Company Limited, Beijing, 100028, China
2 School of Petroleum Engineering, Yangtze University, Wuhan, 430100, China
3 Hubei Key Laboratory of Oil and Gas Drilling and Production Engineering (Yangtze University), Wuhan, 430100, China
* Corresponding Author: Biao Yin. Email:
(This article belongs to the Special Issue: Hydraulic Fracturing Theory and Application for Geo-energy Development)
Energy Engineering 2025, 122(1), 185-201. https://doi.org/10.32604/ee.2024.056062
Received 13 July 2024; Accepted 22 October 2024; Issue published 27 December 2024
Abstract
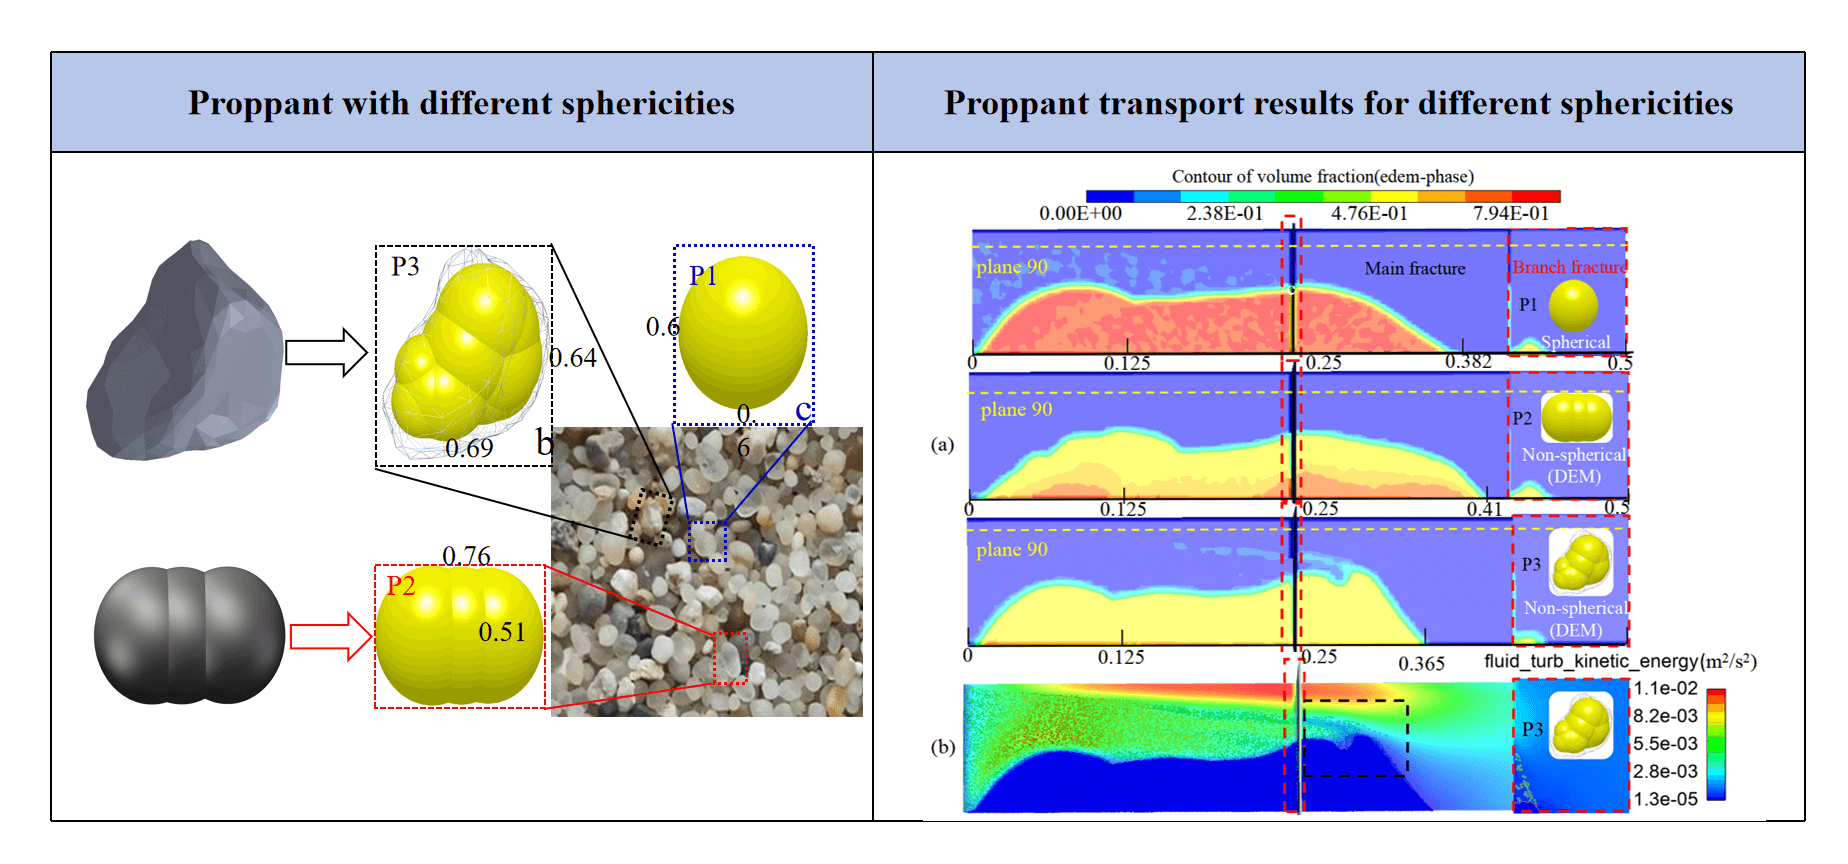
To analyze the differences in the transport and distribution of different types of proppants and to address issues such as the short effective support of proppant and poor placement in hydraulically intersecting fractures, this study considered the combined impact of geological-engineering factors on conductivity. Using reservoir production parameters and the discrete element method, multispherical proppants were constructed. Additionally, a 3D fracture model, based on the specified conditions of the L block, employed coupled (Computational Fluid Dynamics) CFD-DEM (Discrete Element Method) for joint simulations to quantitatively analyze the transport and placement patterns of multispherical proppants in intersecting fractures. Results indicate that turbulent kinetic energy is an intrinsic factor affecting proppant transport. Moreover, the efficiency of placement and migration distance of low-sphericity quartz sand constructed by the DEM in the main fracture are significantly reduced compared to spherical ceramic proppants, with a 27.7% decrease in the volume fraction of the fracture surface, subsequently affecting the placement concentration and damaging fracture conductivity. Compared to small-angle fractures, controlling artificial and natural fractures to expand at angles of 45° to 60° increases the effective support length by approximately 20.6%. During hydraulic fracturing of gas wells, ensuring the fracture support area and post-closure conductivity can be achieved by controlling the sphericity of proppants and adjusting the perforation direction to control the direction of artificial fractures.Graphic Abstract
Keywords
Hydraulic fracturing, as a vital method for enhancing oil production, involves the integration of engineering and geological practices. To ensure effective post-fracturing conductivity, high-strength proppants suspended in high-viscosity fracturing fluids are pumped into artificially created fractures to support the walls. However, under reservoir pressure, these proppants may deform, embed, or fracture, potentially impairing fracture conductivity [1]. Therefore, achieving efficient proppant transport within artificial fractures and creating long-term conductivity of propped fractures remain essential goals for industry professionals.
Common types of proppants include quartz sand, ceramic beads, resin-coated sand, walnut shells, and plastic beads [2]. According to current industry standards, sphericity evaluates how closely particles resemble spheres and serves as a critical indicator for assessing the performance of different proppants in enhancing flow conductivity during oil and gas extraction [3]. Quartz sand and ceramic proppants, the most widely used, exhibit significant differences in sphericity. However, research on sphericity has primarily focused on its identification and measurement, lacking studies on how variations in sphericity affect the results of proppant transport. Scholars typically study proppant transport in fractures using a combination of experimental and numerical modeling approaches. Laboratory setups with fixed structural configurations and simplified boundary conditions effectively simulate proppant transport and deposition processes. Researchers such as Raimbay et al. [4] and Troy [5] have developed multifaceted physical simulation devices to visualize the effects of various sensitive factors on proppant transport and deposition in fractures. However, these findings are inherently limited in providing systematic guidance for the design of the fracturing process. As experimental conditions improve, studies have effectively examined the impact of the injection rate, proppant concentration, sequence of injection and multisize proppant additions, and fracture surface roughness on proppant distribution within fractures. Experimental setups often overlook the presence of natural fractures, typically assuming hydraulic fractures as two smooth parallel plates to investigate the effects of proppant settling after fracture closure.
Experimental design and conditions inherently impose limitations; in contrast, numerical simulations offer lower costs, diverse modeling forms, and different boundary conditions, making them more closely aligned with practical applications in studying proppant transport. Currently, numerical simulations of fluid-particle two-phase flow are typically conducted using Euler-Euler or Euler-Lagrangian methods [6]. Zhang et al. [7] systematically studied the transport and deposition of multi-size proppants in complex and horizontal wells, quantitatively characterizing the effects of multi-size particles compared to uniform-size particles on proppant placement. Based on previous simulation studies, the coupled (Computational Fluid Dynamics) CFD-DEM (Discrete Element Method) demonstrates advantages in more accurately modeling particle-laden flows and holds greater potential in the field of proppant transport modeling compared to other simulation methods [8]. In 2020, Lu et al. [9] conducted CFD-DEM simulations with varying fracturing fluid viscosities and proppant densities, revealing the reasons and mechanisms for non-uniform proppant distribution and low efficiency in simplified single fractures. Zhang et al. [10] established a dual-fluid model to simulate the behavior of proppant transport in single fractures. Xu et al. [11], using a coupled model of free and porous media flow in COMSOL software, simulated the flow of fracturing fluid in micro-fractures. In addition, existing literature surveys indicated that increasing fluid viscosity leads to greater proppant migration distance and non-propped length near the wellbore.
However, comprehensive studies on the mechanisms and patterns of irregular proppant transport and placement within fractures are lacking. Understanding the flow behavior of fracturing fluids and internal flow field changes is crucial for assessing proppant transport behavior and flow conductivity during hydraulic fracturing, yet systematic research results are deficient. Therefore, this study addresses challenges such as short effective fracture support lengths and poor conductivity in the L block gas field. Using the discrete element method, numerical models of non-spherical quartz sand are constructed, and employing bidirectional coupling of CFD-DEM reveals the transport patterns of particles coupled with flow fields in complex fracturing fractures. The study quantitatively compares the placement effectiveness of irregular quartz sand constructed by the discrete element method with spherical ceramic proppants based on changes in transport distance and conductivity. Moreover, the optimization of proppant filling processes during sand transport in reservoir natural fractures is integrated into the study, aiming to provide guidance for hydraulic fracturing production.
To analyze the transport and placement process of different types of proppants in intersecting fractures, we conducted a dynamic analysis of the placement of three different types of proppants in fractures using the method of constructing aspherical particles with multiple spheres. In this analysis, a particle phase object was considered as a collection of individual particles governed by Newton’s second law. The interaction forces (drag force, lifting force, pressure gradient force) between the particles were coupled to calculate and update the position changes of both the particles and the fluids.
2.1 Continuous Phase Governing Equation
For incompressible fluids, the calculation of the flow field is governed primarily by the local mean three-dimensional Navier-Stokes equations at the cell scale with source terms [12]. In accordance with the finite volume calculation method, the fluid region is discretized into grid cells based on the principle of mass conservation, where the net mass flux through an element equals the mass change within that element. The specific mass conservation equation can be expressed as [13]:
where
where p represents the fluid pressure, Pa;
2.2 Discrete Phase Governing Equation
DEM is often used to simulate particle collisions. The general approach involves formulating motion control equations for both fluid and particle phases, followed by defining input parameters for CFD and DEM. The process of establishing irregular particle models often involves assembling rigidly connected spheres, with force and contact determined by the positions of their shape surfaces [14]. When the distance between the centers of adjacent spheres equals the sum of their radii, it indicates that the particles are in contact. Differences in particle sphericity lead to significant variations in their transport and deposition processes. Accordingly, three different particle samples were established in this study: P1 as spherical ceramic particles, P2 and P3 as quartz sand with different sphericities established using the discrete element method, as depicted in Fig. 1.

Figure 1: Particle models of three different sphericities
Sphericity refers to the extent to which the shape of a particle resembles that of a sphere. It significantly influences both the particle transport distance and mineral morphology. Sphericity significantly influences the mode of particle transport. Particles with high sphericity move in a rolling manner, while particles with low sphericity move in a floating manner. According to the Chinese petroleum and natural gas industry standard SY/T5108-1997, sphericity is defined as follows [15]:
where

2.3 Force Analysis of the Particles
2.3.1 Continuous Phase Governing Equation
The motion of particle p is influenced by its own gravitational force, buoyancy, contact forces (particle-particle and particle-wall contact), and interaction forces (such as tensile force, wall shear force, rotational lift force, etc.) [16].
where
where
2.3.2 Contact Force and Torque Discrete Phase
Based on the particle force analysis, Fig. 2 illustrates the force diagram of collisions between the sub-circular particles we simulated. In accordance with Di Renzo et al., the contact force of the j-th element of particle q on the i-th element of particle p is expressed as [18]:
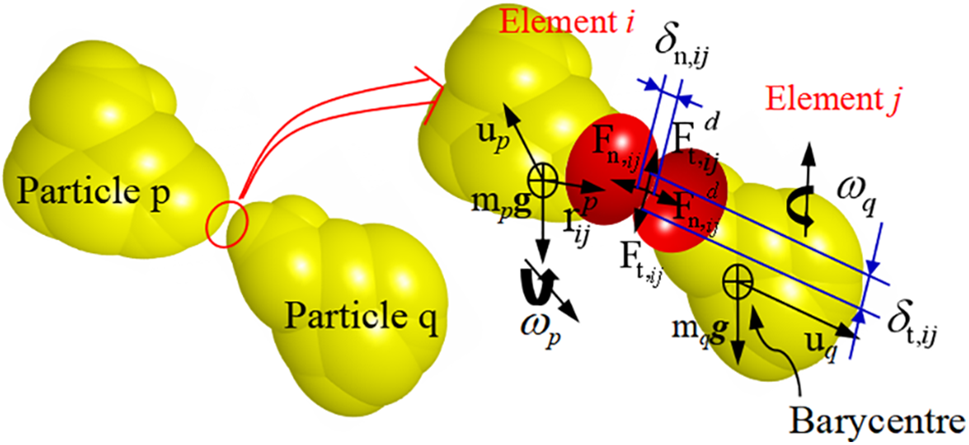
Figure 2: Forces between contact units during the collision of particle p and particle q
The normal contact force of the particles is:
where
The tractive force on particle p is:
where
3 Establishment and Verification of the Numerical Model
Modeling and simulating intersecting fractures are more time-consuming and resource-intensive compared to single-plane fractures. In geological formations where fractures develop, artificial fractures encountered during hydraulic fracturing often intersect natural fractures. Therefore, modeling the domain of intersecting fractures provides a more realistic environment for simulating proppant transport. Currently, the reconstruction of rough fractures in simulations often relies on core scanning, and rough fracture modeling of reservoir fractures with small samples tends to be highly random and primarily specific to particular reservoirs, providing limited general guidance. Therefore, we simplified the fracture model, with the focus shifting towards studying the transport behavior of multispherical proppant in complex fractures. A numerical model of vertical fractures was established to simulate the dynamics dominated by viscous forces and geometric similarities. Boundary conditions are based on production data from the gas well of the L block, considering the development of natural fractures in the target reservoir, with a maximum natural fracture density of three per meter. Fig. 3a shows the ant tracking results of the target reservoir, and the tracked result (Fig. 3b) indicates that natural fractures are predominantly high-angle and mainly develop in the north-south direction. Severe interbedding of sandstone and shale significantly reduces the effective support distance of fractures.

Figure 3: Process of identifying natural fractures in the target reservoir. (a) Results after ant tracking. (b) Natural fractures distribution pattern of the reservoir
The initial simulation boundary conditions for hydraulic fracturing construction are detailed in Table 2. The inlet boundary conditions are set as velocity inlet, with 3 pressure outlets, and the remaining boundaries are designated as walls. The maximum horizontal stress direction is oriented 10° east of north. A model depicting a 90° angle between the main fracture and natural fractures is shown in Fig. 4a.

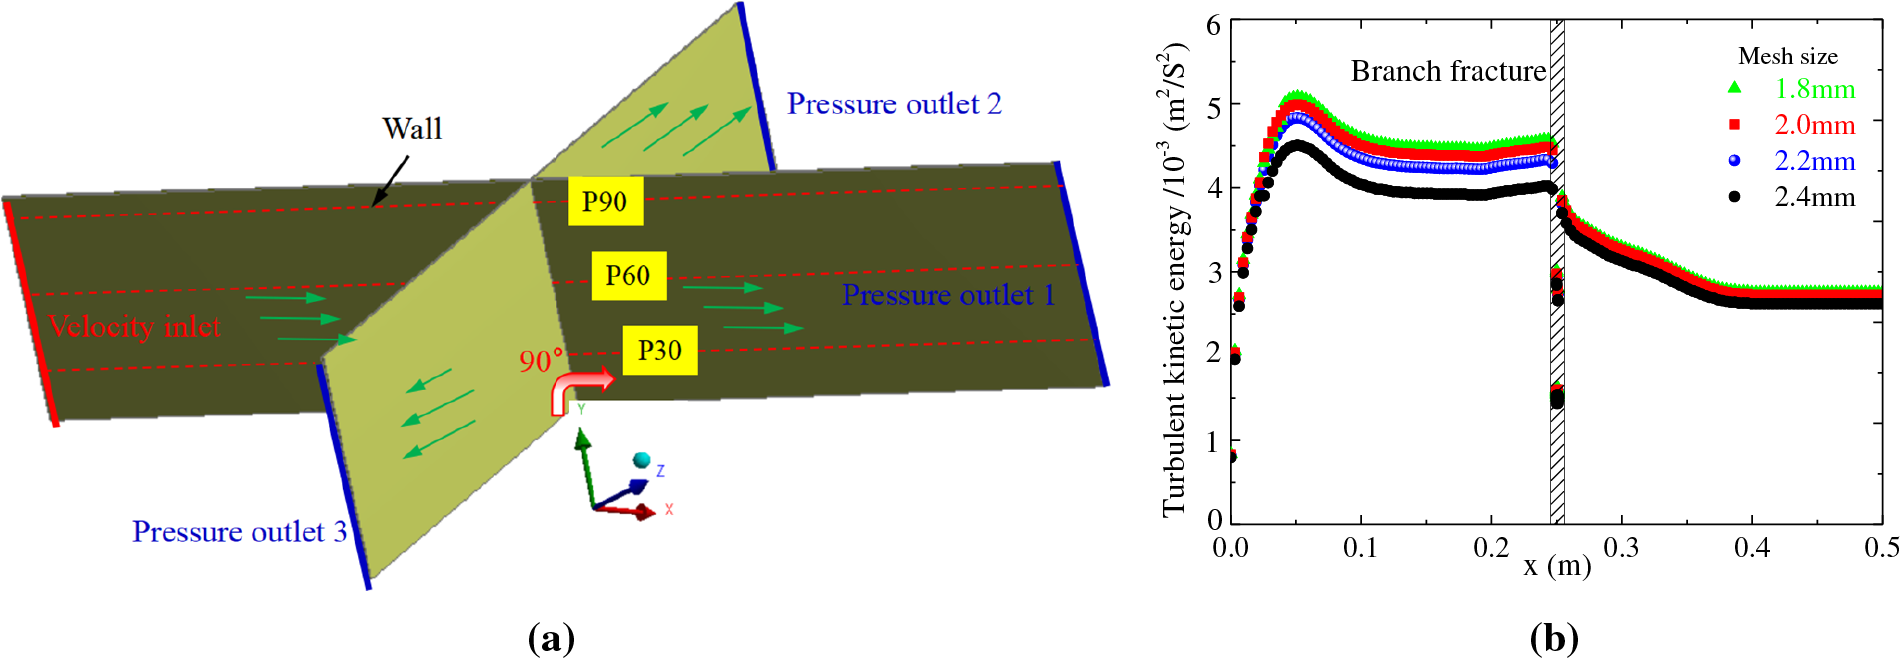
Figure 4: Simulation Modeling. (a) Numerical modeling of intersecting fractures in three dimensions. (b) Grid independence analysis
The existing K-epsilon model utilizes two transport equations to characterize the properties of turbulence in the fracture. Three equidistant planes (P30, P60, and P90) were established along the z-axis to monitor the flow field parameters under identical boundary conditions following proppant placement. Calculation time can be customized, with the simulation for this grid independence analysis limited to 5 s. To ensure convergence, the coupling interface requires the minimum grid size of the fracture model to be at least 1.5 times the particle diameter. A large grid size will reduce the accuracy of the results, while an overly small grid significantly decreases computational efficiency. As shown in Fig. 4b, based on the analysis of turbulent kinetic energy across the P90 section, a 2 mm hexahedral grid was selected to achieve an optimal balance between precision and efficiency.
Existing literature often uses single fractures for experimental studies. To verify the reliability of the computational model (CFD-DEM), the accuracy of the numerical model is validated against the proppant distribution profiles from the experimental studies of single-sided plate models by Tong [20]. The parameters for model validation and subsequent simulation (CFD-DEM) are listed in Table 2. The validation results are shown in Fig. 5. For comparison purposes, a red dashed line is drawn along the proppant bed to describe its shape, and the simulation results are overlapped. The comparison shows that the experimental and simulation results are consistent within a reasonable error margin. Minor differences may arise from uncalibrated model parameters, which are not currently available from existing experimental work and literature. Accordingly, the proppant placement results in both the primary and secondary fractures indicate that the established coupled model is reliable.
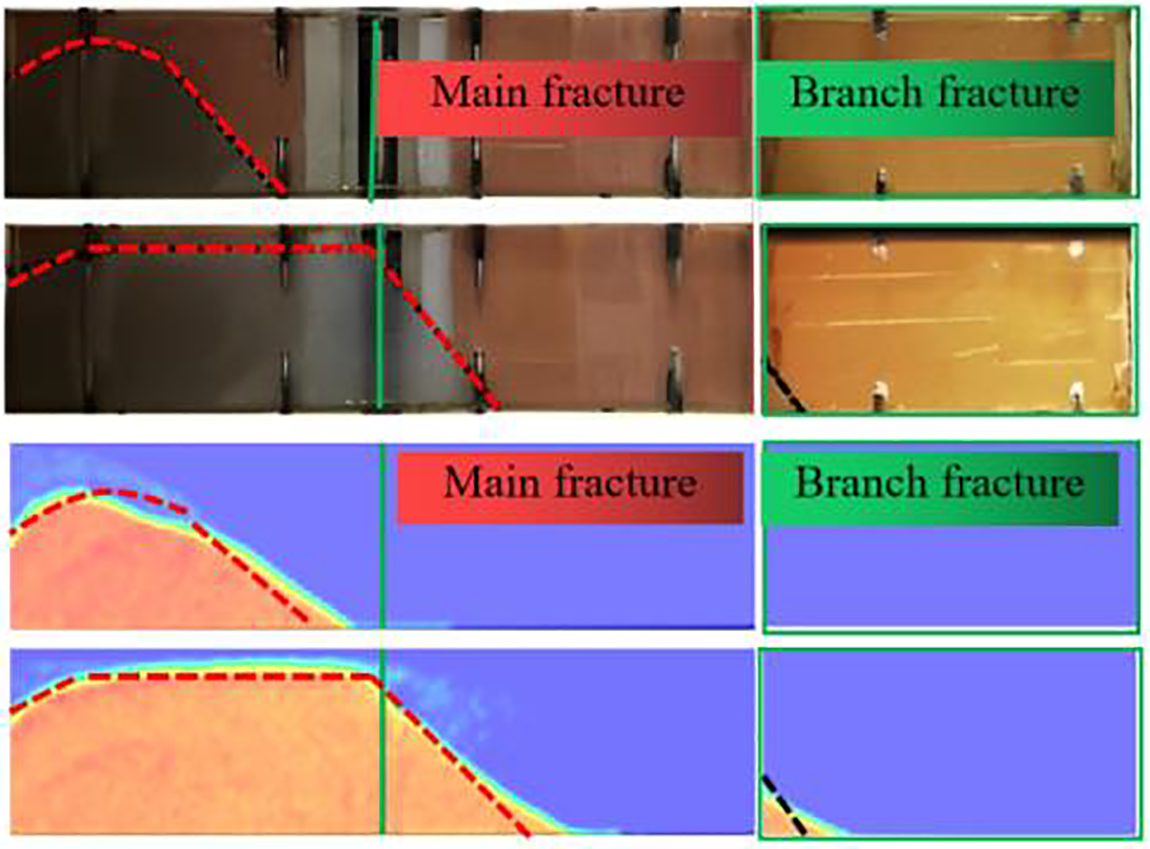
Figure 5: Simulation results of deposition profiles verified with Tong and Mohanty 90 through-slot experiments
4 Results of Multispherical Proppant Placement under Different Conditions
4.1 Analysis of the Flow Field within the Fractures
Turbulent kinetic energy (k) within the fracture flow field is a critical parameter that reflects the momentum transfer and conversion between the sand-carrying fluid and particles, influenced by mean velocity gradients and buoyancy, thereby impacting turbulence energy levels. The effect of turbulence on the energy dissipation of two-phase flow particles in turbulent motion is significant and must be considered in numerical analysis [21]. Considering the target reservoir conditions of the oil field, slickwater fracturing fluid with a viscosity of 5 cP was used. Using the common example of 90° vertical fractures, the study observes the placement of proppants at three different times, as shown in Fig. 6, where the wall colors indicate the turbulent kinetic energy distribution. Existing simulations of proppant transport within rough fractures are typically based on scanning core samples from target reservoirs or generating random rough surfaces to study trends for guiding hydraulic fracturing production. However, these studies often involve limited samples and lack reproducibility [22]. Therefore, the subject of this study primarily consists of planar fractures.
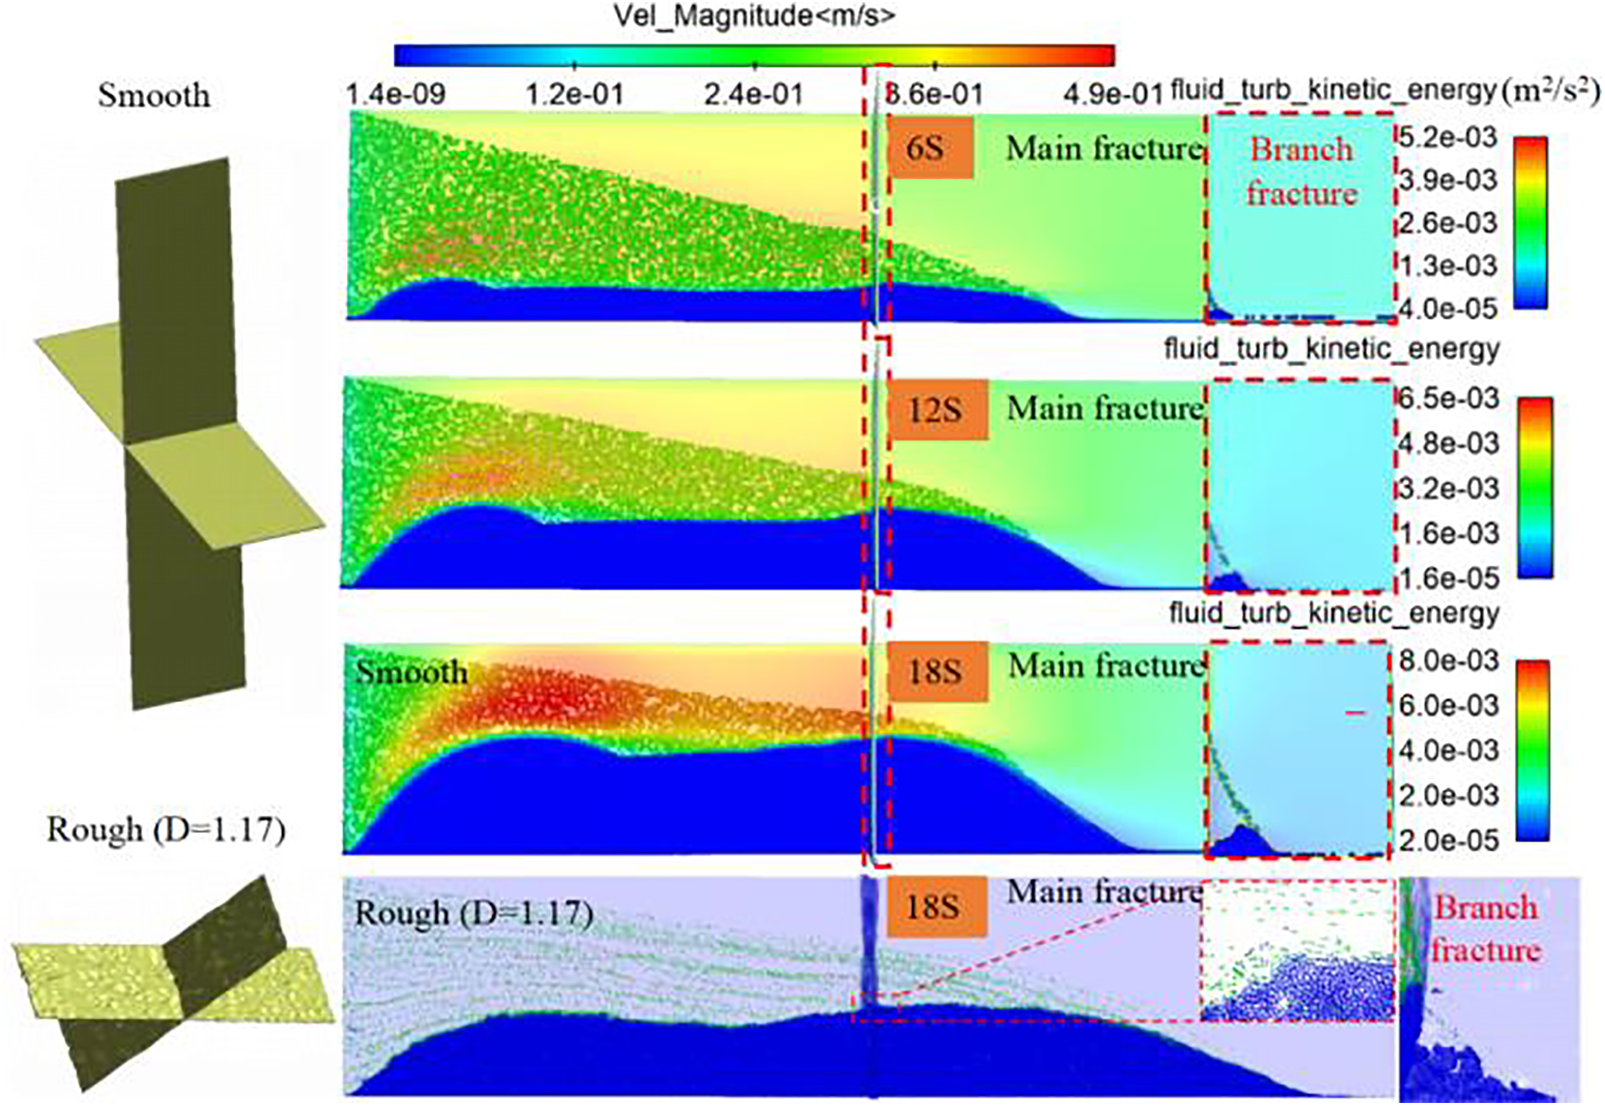
Figure 6: Placement of proppant in intersecting fractures at different moments (90°)
Moreover, to investigate the general influence of rough fractures, Matlab was used to model rough fractures with the same fractal dimension. The fracture surface roughness was identified by fractal dimension (D = 1.17), with larger D values indicating greater surface roughness. The results clearly reveal that as proppants are continuously injected, they increasingly accumulate at the bottom of the fracture due to gravity. The presence of secondary fractures leads to a much greater turbulent kinetic energy near the wellbore than at the far end. As the proppant bed at the bottom rises, this phenomenon causes significant increases in both the maximum turbulent kinetic energy and particle velocity within the main fracture, reaching 8 × 10⁻³ m²/s² at 18 s. The greater turbulent kinetic energy transports the subsequently injected proppants to the rear end of the proppant bed, facilitating the movement of proppants to more distant locations. Compared to planar fractures, the proppant deposition height in rough fractures is lower within the main fracture. The proppant transport distance increased from 0.382 to 0.43 m, but the distribution became sparser. In narrower secondary fractures, the amount of proppant deposition increased significantly. Additionally, according to the study by Guo et al. [23], surface roughness delays the settling speed of some proppants and reduces the horizontal transport speed, thereby promoting further proppant transport, which aligns with the simulation results.
The turbulent kinetic energy along the x-axis of the main fracture and the proppant deposition at various cross-sections are shown in Fig. 7. For the area already deposited at the bottom (P30), the deposition concentration of particles in the cross-section reaches 2000 kg/m³, with the corresponding turbulent kinetic energy being extremely low (approximately 0.15 × 10⁻³ m²/s²). Meanwhile, the non-deposited areas (P60, P90) exhibit greater turbulent kinetic energy, with the maximum value appearing at the top of the proppant bed and the highest proppant flow velocity. Consequently, the non-deposited proppants can move more effectively to distant locations. Additionally, the turbulent kinetic energy distribution in rough fractures is more irregular, with the maximum being over three times that of planar models. This confirms that vortices help keep proppants suspended, reducing settling and allowing for further transport along the fracture.
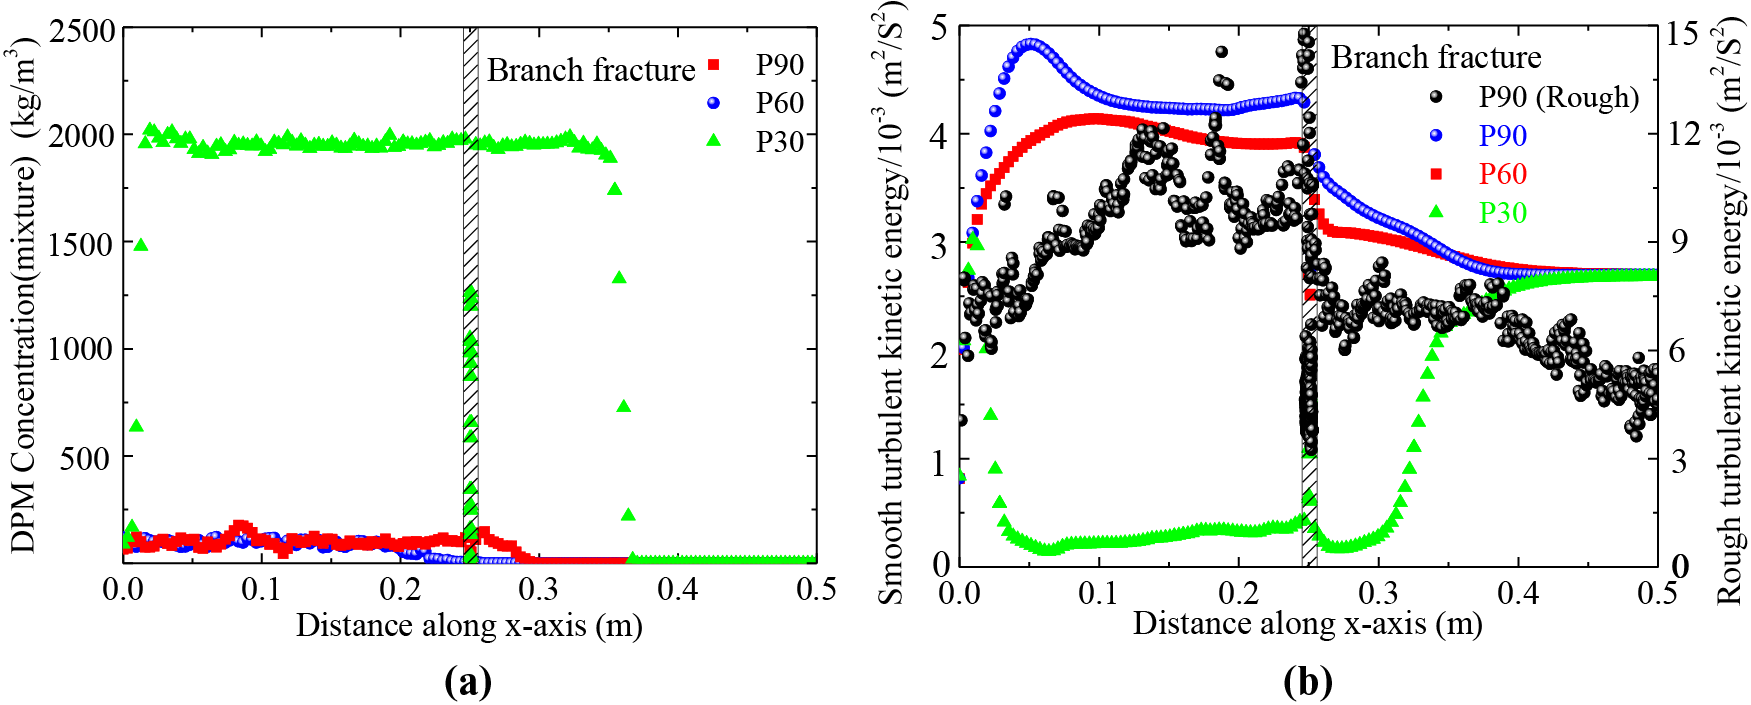
Figure 7: The flow conditions within the fracture flow field. (a) Distribution of particle deposition of three different cross sections. (b) Turbulent kinetic energy at 18 s
4.2 Results of Multisphericity Proppant Placement and Conductivity
To investigate the impact of different types of proppants at equal volumes on proppant migration in fractures, simulation models were established under initial boundary conditions using various proppant parameters, as outlined in Table 2. The resulting calculations are presented in Fig. 8. The volume fraction contour maps for the three types of particles reveal similar proppant placement areas, but with more irregular shapes for the deposited non-spherical proppants. The highest average deposition volume fraction appears for ceramic proppants (P1) at 75.3%, while the lowest appears for quartz sand proppants (P3) at 47.6%. The relationship between volume fraction and conductivity is derived as follows:
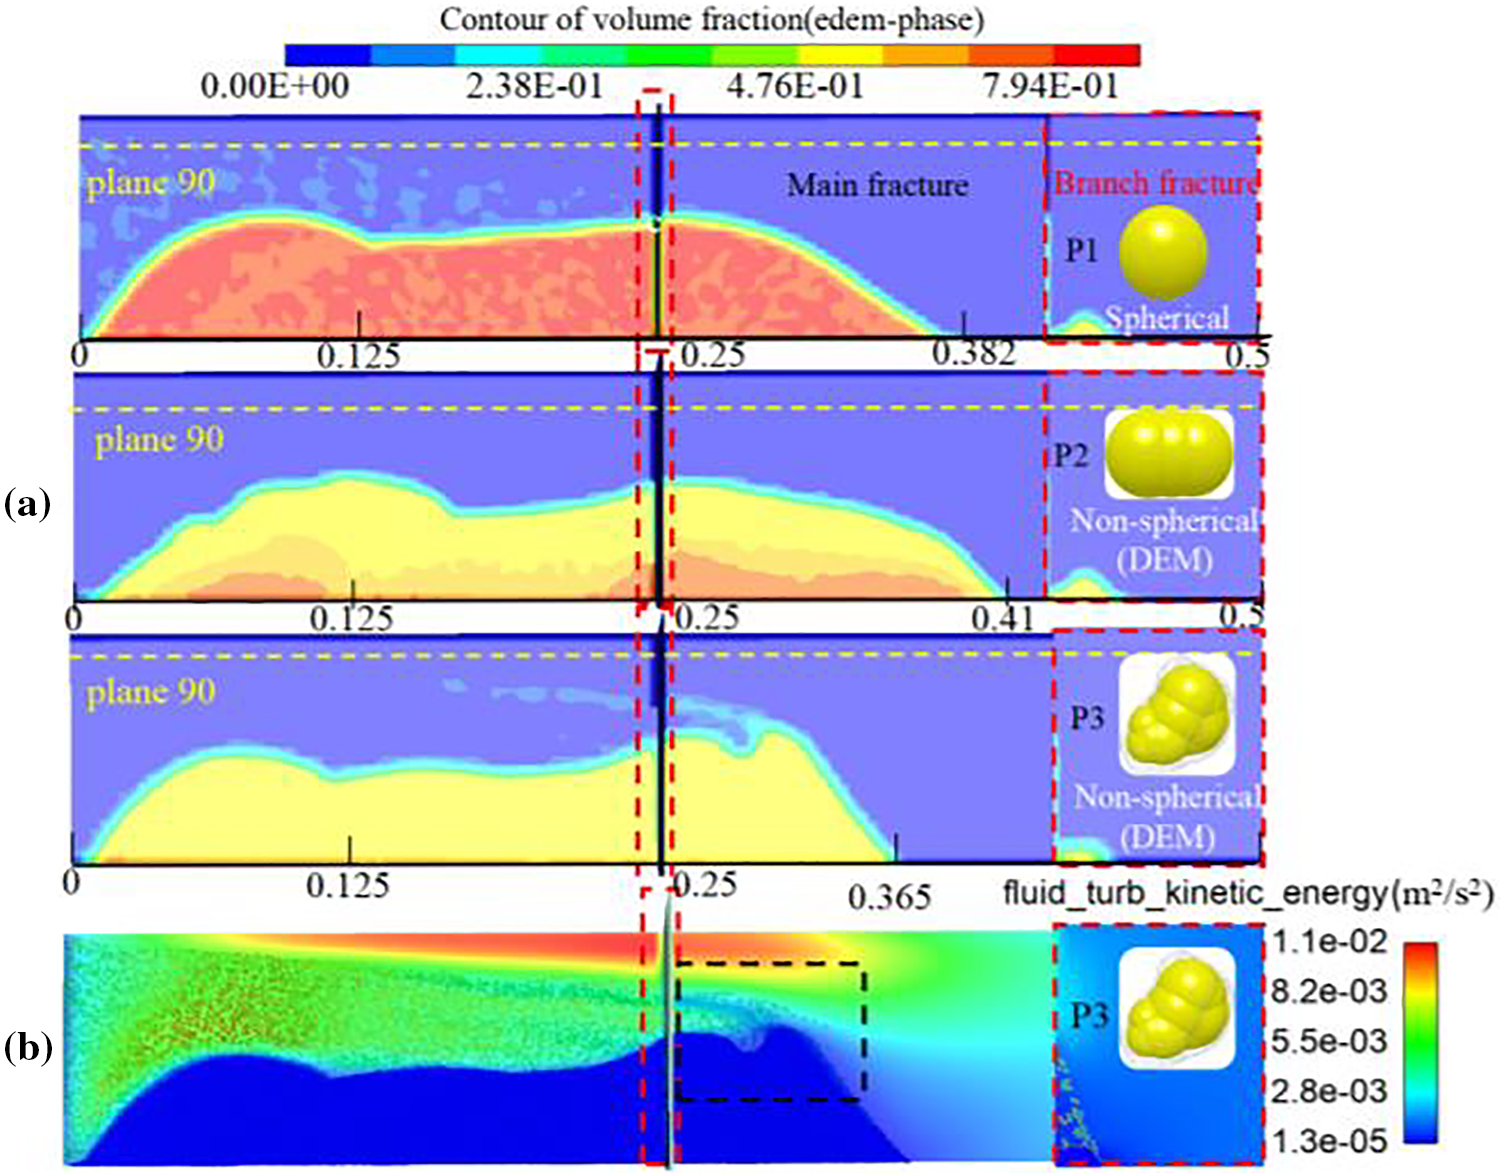
Figure 8: Deposition results for different proppant types. (a) Contours of the volume fraction of three different proppant types. (b) Turbulent kinetic energy distribution of the proppant (P3) in fracture
where K represents the fracture conductivity, m2; ρ is the proppant density, kg/m3; C stands for the concentration of proppant laid in the sand, kg/m2; S is the area where the proppant is placed, m2; m is the mass of proppant, kg; V is the volume of accumulated proppant, m3; ω is the coefficient of sand laying concentration and inflow capacity under the condition of 0 closure pressure. Vp refers to the volume fraction of the proppant, and Vw is the volume of fracture, m3. Previous studies have shown a significant positive correlation between conductivity and proppant placement concentration per unit area. Moreover, calculations show that under identical particle size conditions, the hydraulic conductivity of spherical ceramic beads (P1) is 1.42 times greater than that of irregular quartz sand particles (P3) simulated using the discrete element method. Fig. 8a shows the volume fractions of three different proppants after placement, which can reflect the proppant concentration per unit area. This pattern indicates that reducing the sphericity decreases the proppant coverage density per unit area within the fracture, leading to decreased conductivity and thereby impacting production efficiency.
Comparison of the turbulent kinetic energy distribution maps between proppants P3 and P1 in Fig. 8b reveals that P3, characterized by lower sphericity, exhibits uneven deposition along the upper intersecting fracture, resulting in larger turbulent effects reaching a maximum of 11e−3 m²/s². This phenomenon intensifies the irregular movement of proppants after passing through the fracture (black dashed box), reducing the proppant displacement distance from 0.382 to 0.365 m and decreasing the effective propped length by over 7%.
Analysis revealed that as proppants continue to settle, the maximum turbulent kinetic energy within the fracture appears at the top of the proppant bed, causing turbulent disturbances that carry subsequently introduced proppants toward the rear of the deposition. Consequently, monitoring was conducted on the turbulent kinetic energy scatter distribution along the x-axis at section P90 for all three types of proppants, as shown in Fig. 9. Considering the morphology of the deposition shown in the figure, it can be inferred that the overall turbulent kinetic energy within the fracture decreases at the branch fracture. Among the three types of proppants, the irregular quartz sand proppant P3 established by the DEM, which has the lowest sphericity, exhibits a turbulent kinetic energy of 10.4 × e−3 m²/s², which is 2.8 times that of P1. Increased turbulent effects intensify the probability of collisions between particles and with the wall, significantly reducing transport efficiency.
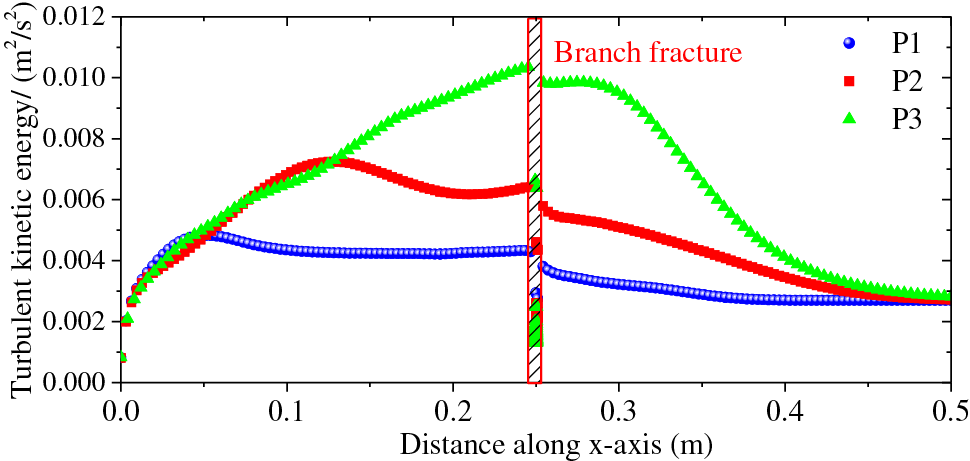
Figure 9: Turbulent kinetic energy distribution on Plane 90 with three different proppants after 18 s
4.3 Effects of Placement under Different Natural Fracture Orientations
As shown in Fig. 3a, the ant tracking results show that natural fractures are highly developed in the L block. Due to changes in conditions such as horizontal stress in the formation and fault orientations, natural fractures in the reservoir segment exhibit varying orientations. In the study of ceramic proppant P1, models of intersecting fractures with four different angles were established, as shown in Fig. 10a.
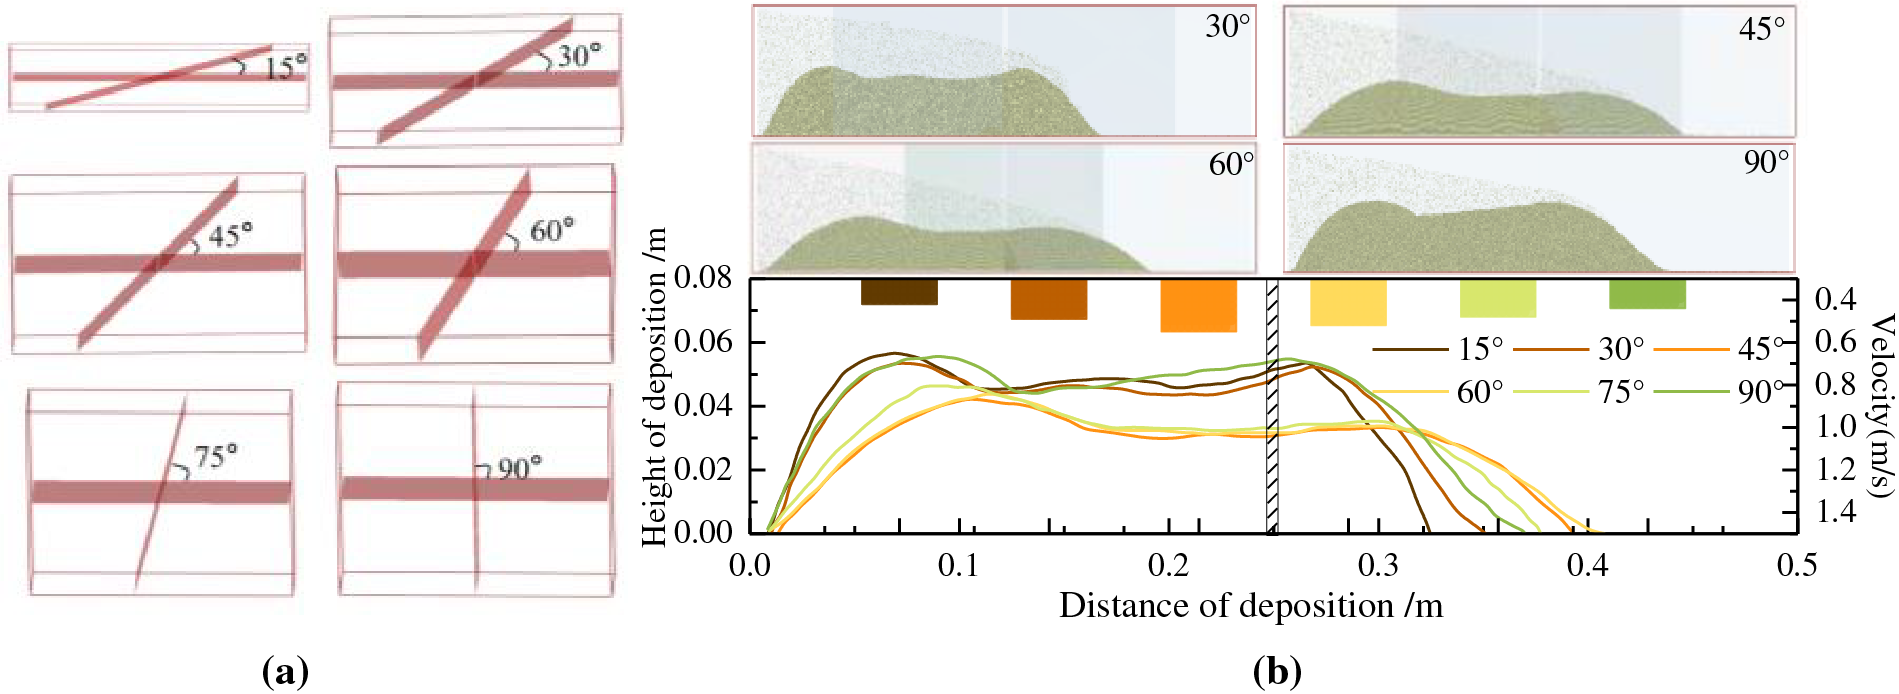
Figure 10: Simulation of different fracture inclinations. (a) Modeling of fractures with different inclination angles. (b) Results of proppant migration and deposition for six different fracture models
As illustrated in Fig. 10b, the fracture length and height exhibit a non-linear response to the increase in the angle between the natural and artificial fractures. With an increase in the angle between natural and induced fractures, the length of the fractures initially increases and then decreases, while the height first decreases and then increases. The maximum transport velocity during proppant transport follows the same pattern as the deposition length, with the peak velocity of 0.55 m/s occurring at a 45° inclination angle. Specifically, as the angle increases from 30° to 60°, the effective propped distance of proppants in the main fracture increases from 0.34 to 0.41 m, resulting in a 20.6% increase in the effective post-fracturing length. The height decreases from 56 to 45 mm initially, and then increases, resulting in a 19.6% decrease in the effective fracture height. Due to the presence of multiple lithological interlayers in the target reservoir, increasing the injection fluid volume during fracturing operations enhances the length of the main fracture. Furthermore, adjusting the perforation direction of the production wells to control the angle between the main and natural fractures within 45° to 60° improves the effective half-length of the fracture by 18.2%.
From an oil field production perspective, increasing injection rates are aimed at enhancing the effective propped length to boost oil field productivity. This study investigated the effect of three different combinations of fracturing fluid velocities and fracture angles on proppant (P1) placement within fractures. As shown in Fig. 11, consistent with previous findings on different inclinations, the transport of proppants distance at the main fracture initially increases and then decreases with increasing fracture angle. Moreover, the deposition height initially decreases and then increases. With an increase in the sand-carrying fluid velocity, when the velocity reaches 0.7 m/s, proppants start to flow out of the main fracture, exceeding the designated length of the main fracture (0.5 m) and significantly increasing the effective propped length. Additionally, at a velocity of 0.7 m/s, the deposition height is effectively enhanced compared to that at 0.3 m/s, showing a maximum increase of 19.8%.
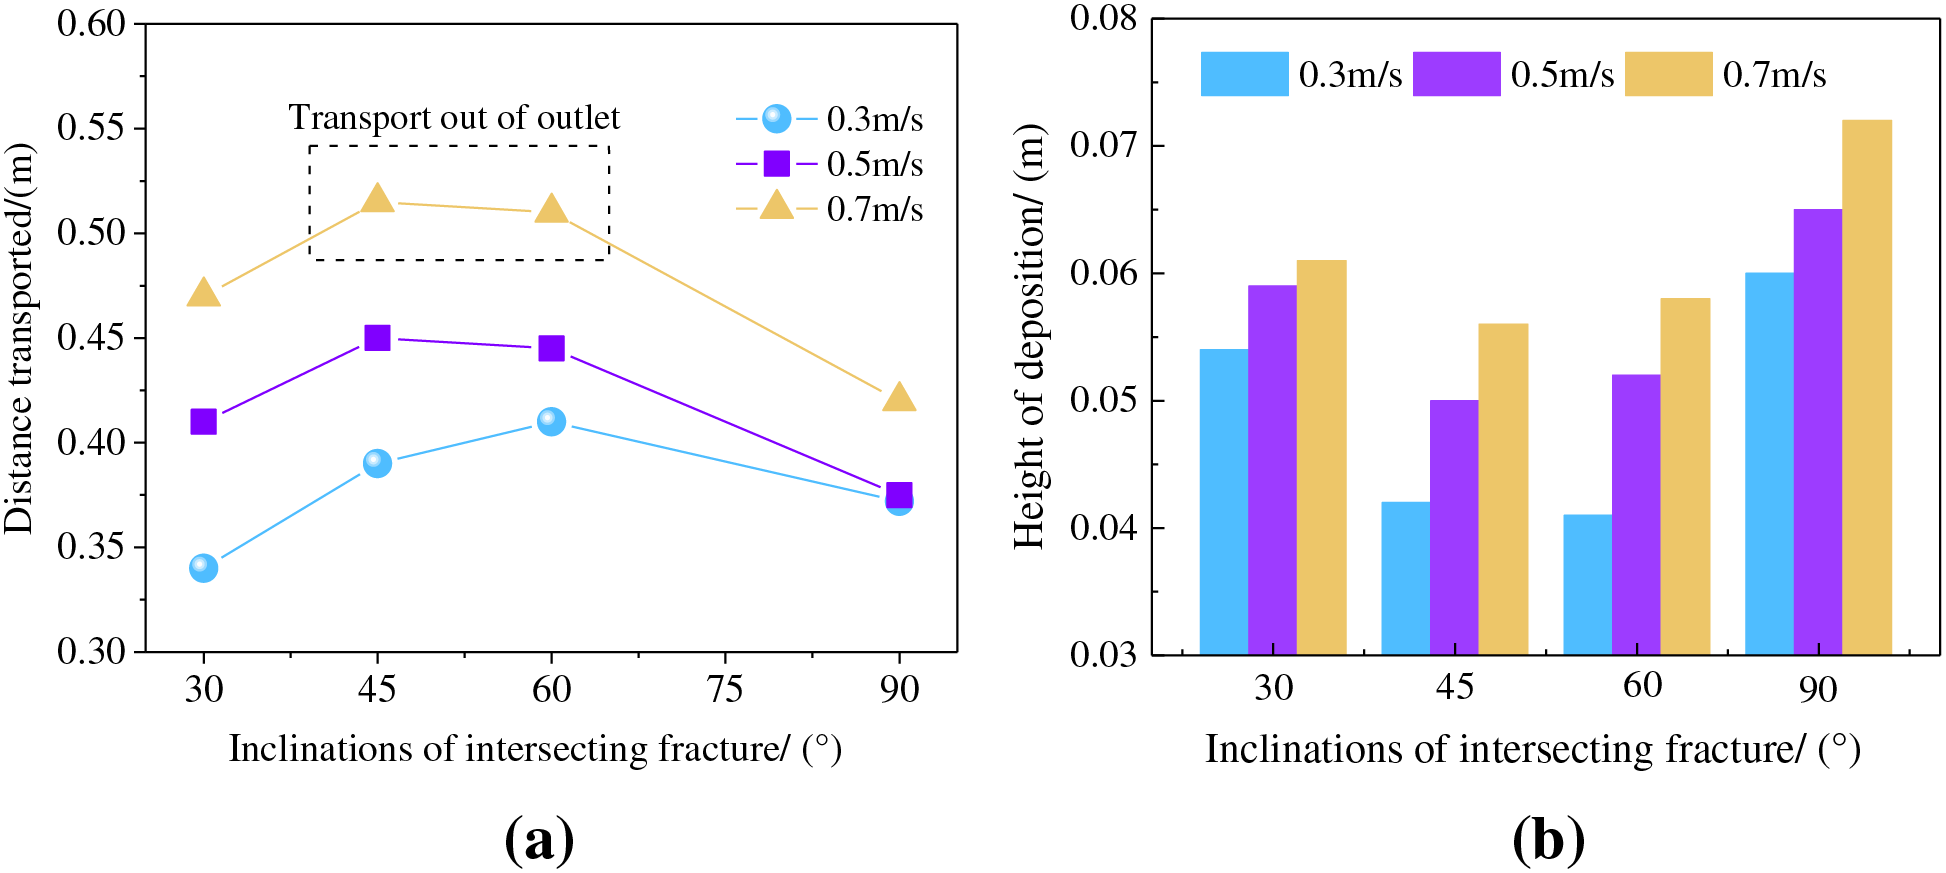
Figure 11: Results of proppant transportation at different conditions. (a) Proppant placement at different angles of inclination. (b) Proppant placement at different velocities
5 Production Optimization of Fracture Conductivity
The estimated ultimate recovery (EUR) of individual wells is significantly influenced by the effective proppant characteristics within fractures, with conductivity playing a decisive role. In the L block, adjacent wells (well 20 and well 50) were hydraulically fractured in different layers using 20/40 mesh quartz sand and ceramic proppants. The reservoir interval at the same depth is approximately 1700 m, with a formation pressure of approximately 28 MPa. The proppant sphericity was determined to be 0.95 for ceramic proppants and 0.8 for quartz sand, based on sieve analysis. After laying down the proppant, the proppant was placed in the crushing chamber of device 3 in Fig. 12a at a specific reservoir pressure. Conductivity experiments were conducted using the same fracturing fluid at different times. Moreover, the change in closure pressure has a significant impact on the fracture aperture, which ultimately reflects on the conductivity [24]. The formula for calculating conductivity is as follows:
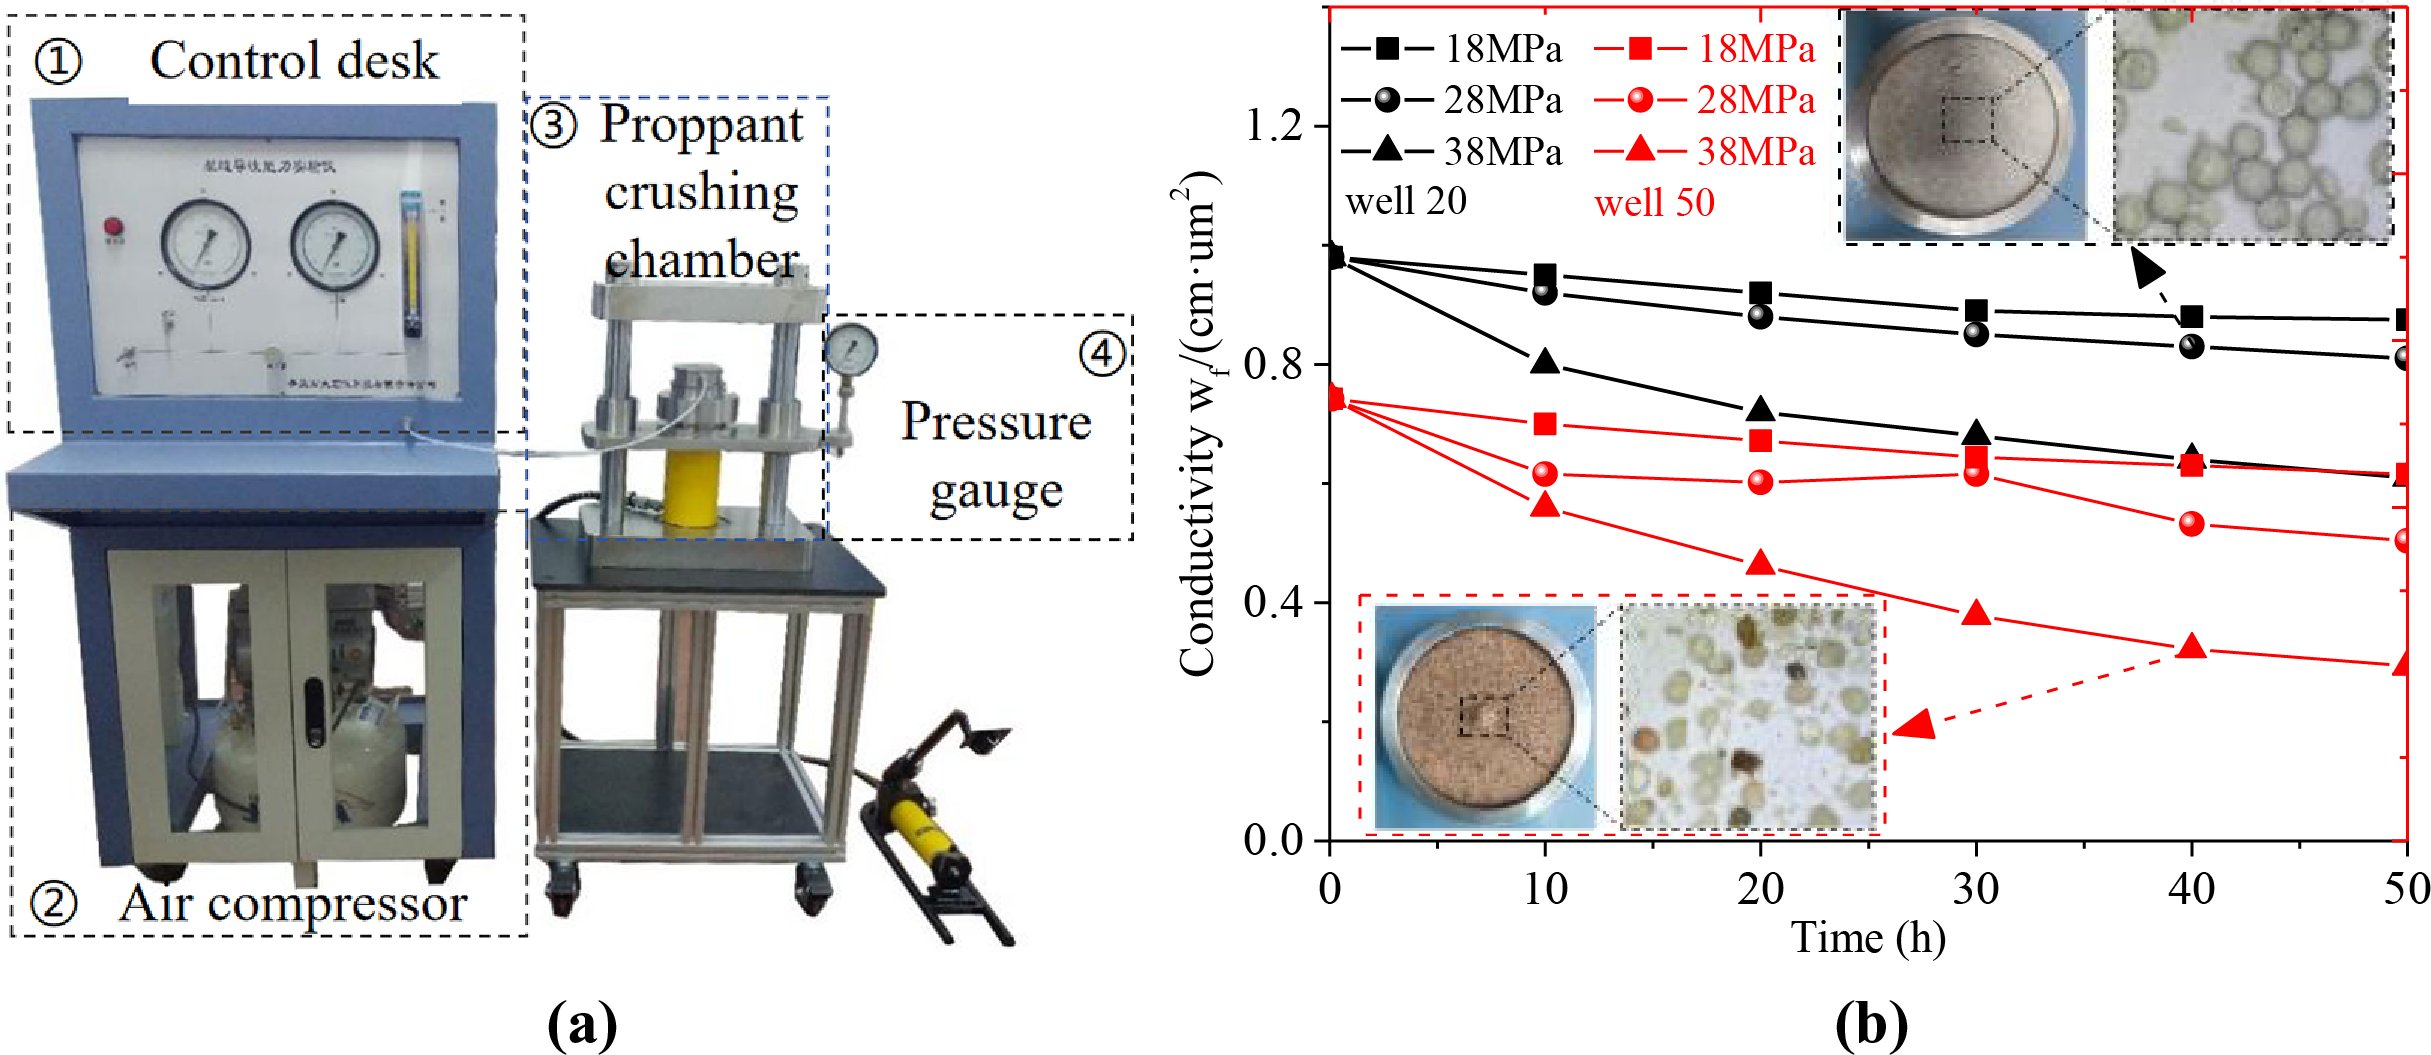
Figure 12: Long-term conductivity test. (a) Test system for conductivity. (b) Experiments on the conductivity of two different proppants
where K1 represents the permeability of the proppant pack measured by fluid, μm²; K1·df is the fluid-measured conductivity of the proppant pack, μm²·cm; q1 is the fluid flow rate, cm³/s; µ1 is the viscosity of the test fluid, mPa·s; L is the distance between the pressure measurement points, cm; Δp is the pressure differential between upstream and downstream, kPa; b is the width of the chamber, cm; and df is the thickness of the proppant pack, cm. Eq. (13) shows that fracture aperture changes ultimately affect the conductivity. Therefore, intermediate variables are not analyzed separately.
Compared to the simulation results, after 50 h considering the effect of reservoir pressure, it was observed that the proppants fractured, as depicted in Fig. 12b. The conductivity of the ceramic proppants decreased to 0.81 cm·µm² under target reservoir stress, marking an 18.9% decrease. Meanwhile, the conductivity of the quartz sand decreased to 0.37 cm·µm², showing a more significant decrease of 33.3% in the case of the well 50. The simulated conductivity of ceramic proppant (P1) and non-spherical quartz sand proppant (P3) is consistent with the calculated results, showing that under the same placement concentration and reservoir conditions, the conductivity of the ceramic proppant is significantly higher than that of the quartz sand with lower sphericity. As the pressure increases, more crushing of the quartz sand proppants occur, resulting in a decrease in inflow capacity to 0.21 cm·µm². Under the same engineering parameters, the average daily gas production increased by 26% in well 20 using ceramic proppants compared to that the well 50 using quartz sand. Obtaining more geological and engineering parameters, including fracture roughness for different lithologies and reservoir stress in different blocks, would allow for simulations of proppant placement concentrations under various fracturing conditions. This approach would enable systematic conductivity experiments at different placement concentrations, optimizing production parameters for the specific oil field.
Discrete Element Method (DEM) serves as an effective tool for simulating irregular particle behavior. In this study, the focus is on addressing issues such as short effective propped length and poor conductivity in hydraulic fracturing wells within the L block gas field. Two numerical simulations were conducted using spherical ceramic proppants and multisphere constructs in DEM to model different degrees of sphericity in quartz sand proppants. In addition, turbulent kinetic energy was found to be an important intrinsic factor affecting the proppant transport efficiency. Through this study, the following conclusions were drawn:
1. The turbulent kinetic energy within the fracture rapidly diminishes near the rear intersection of artificial and natural fractures. The increasing turbulent kinetic energy due to continual proppant deposition and appropriate fracture roughness ensures further transportation of the subsequently introduced proppants.
2. The deposition of proppants with different shapes has a notable impact on the turbulent kinetic energy within the fracture. Quartz sand proppants with low sphericity, simulated using the discrete element method, induce significant turbulence, leading to a 7.14% decrease in transport efficiency compared to spherical ceramic proppants.
3. Compared to the lowest sphericity quartz sand proppant P3, spherical ceramic proppants exhibit higher deposition density, resulting in a 27.7% increase in volume fraction after deposition. After fracture closure, spherical ceramic proppants demonstrate 1.42 times the conductivity of irregular quartz sand proppants.
4. To optimize gas well production, ceramic proppants were chosen over quartz sand to enhance the fracture conductivity and distance of transport. Additionally, adjusting the perforation direction to achieve an optimal angle (45–60°) between artificial and natural fractures increased the effective propped length by 18.2%, ensuring stable production efficiency.
Acknowledgement: We would like to thank all the authors for their guidance and help on this article.
Funding Statement: This study was funded by the project of the Major Scientific and Technological Projects of CNOOC in the 14th Five-Year Plan (No. KJGG2022-0701), the CNOOC Research Institute (No. 2020PFS-03).
Author Contributions: Study conception and design: Biao Yin, Chengyong Peng; data collection: Jianshu Wu, Biao Yin; analysis and interpretation of results: Mao Jiang, Chengyong Peng; draft manuscript preparation: Yishan Lou. All authors reviewed the results and approved the final version of the manuscript.
Availability of Data and Materials: Data will be made available on request.
Ethics Approval: Not applicable.
Conflicts of Interest: The authors declare that they have no conflicts of interest to report regarding the present study.
References
1. P. Tan, Z. Chen, S. Fu, and Q. Zhao, “Experimental investigation on fracture growth for integrated hydraulic fracturing in multiple gas bearing formations,” Geoenergy Sci. Eng., vol. 231, no. 1, Dec. 2023, Art. no. 212316. doi: 10.1016/j.geoen.2023.212316. [Google Scholar] [CrossRef]
2. Z. Wen et al., “A review on numerical simulation of proppant transport: Eulerian-Lagrangian views,” J. Petrol. Sci. Eng., vol. 217, Oct. 2022. doi: 10.1016/j.petrol.2022.110902. [Google Scholar] [CrossRef]
3. J. Xu et al., “Conductivity analysis of tortuous fractures filled with non-spherical proppants,” J. Petrol. Sci. Eng., vol. 198, Mar. 2021. doi: 10.1016/j.petrol.2020.108235. [Google Scholar] [CrossRef]
4. A. Raimbay et al., “Effect of fracture roughness, shear displacement, fluid type, and proppant on the conductivity of a single fracture: A visual and quantitative analysis,” SPE Reserv. Eval. Eng., vol. 20, pp. 446–470, Aug. 2017. doi: 10.2118/171577-PA. [Google Scholar] [CrossRef]
5. T. Chun, Y. Li, and K. Wu, “Comprehensive experimental study of proppant transport in an inclined fractur,” J. Petrol. Sci. Eng., vol. 184, Jan. 2020. doi: 10.1016/j.petrol.2019.10652. [Google Scholar] [CrossRef]
6. G. Cao et al., “Investigation of vibration on rheological behavior of fresh concrete using CFD-DEM coupling method,” Constr. Build. Mater., vol. 425, 2024, doi: 10.1016/j.conbuildmat.2024.135908. [Google Scholar] [CrossRef]
7. G. Zhang, M. Li, and M. Gutierrez, “Simulation of the transport and placement of multi-sized proppant in hydraulic fractures using a coupled CFD-DEM approach,” Adv. Powder Technol., vol. 28, no. 8, pp. 1704–1718, Jul. 2017. doi: 10.1016/j.apt.2017.04.008. [Google Scholar] [CrossRef]
8. T. Wang, S. Chen, M. Li, and M. An, “A resolved CFD-DEM investigation into sand production under water flooding in unconsolidated reservoir,” Powder Technol., vol. 442, Jun. 2024. doi: 10.1016/j.powtec.2024.119859. [Google Scholar] [CrossRef]
9. C. Lu et al., “A novel hydraulic fracturing method based on the coupled CFD-DEM numerical simulation study,” Appl. Sci., vol. 10, no. 9, Feb. 2020. doi: 10.3390/app10093027. [Google Scholar] [CrossRef]
10. T. Zhang, J. Guo, and W. Liu, “CFD simulation of prop pant transportation and settling in water fracture treatments,” (in Chinese) J. Southwest Pet. Univ. (Sci. Technol. Ed.), vol. 36, no. 1, pp. 74–82, Sep. 2014. doi: 10.11885/j.issn.1674-5086.2013.11.07.06. [Google Scholar] [CrossRef]
11. J. Xu, Y. Ding, L. Yang, Z. Liu, R. Gao and Z. Wang, “Transportation and distribution laws of proppants in tortuous micro-fractures,” (in Chinese) Acta Petrolei Sinica, vol. 40, no. 8, pp. 965–974, Aug. 2019. doi: 10.7623/syxb201908007. [Google Scholar] [CrossRef]
12. S. Zhang, B. Li, and H. Ma, “Numerical investigation of scour around the monopile using CFD-DEM coupling method,” Coast. Eng., vol. 183, Aug. 2023. doi: 10.1016/j.coastaleng.2023.104334. [Google Scholar] [CrossRef]
13. P. Xu, P. Han, Z. He, X. An, K. Sun and L. Gao, “CFD-DEM study on the synergistic effect of coke consumption and particle dynamics in the blast furnace raceway,” Particuology, vol. 89, pp. 270–278, Jun. 2024. doi: 10.1016/j.partic.2023.11.009. [Google Scholar] [CrossRef]
14. H. Kruggel, S. Rickelt, S. Wirtz, and V. Scherer, “A study on the validity of the multi-sphere Discrete Element Method,” Powder Technol., vol. 188, no. 2, pp. 153–165, Dec. 2008. doi: 10.1016/j.powtec.2008.04.037. [Google Scholar] [CrossRef]
15. R. Y. Pei, C. L. Xie, K. X. Hu, and X. R. Lv, “Research on measurement of sphericity and roundness of proppant,” (in Chinese) Electron. Meas. Technol., vol. 38, no. 1, pp. 21–24, Sep. 2015. doi: 10.19651/j.cnki.emt.2015.01.005. [Google Scholar] [CrossRef]
16. Z. Ma, Q. Tu, Z. Liu, Y. Xu, R. Ge and H. Wang, “CFD-DEM investigation of the gas-solid flow characteristics in a fluidized bed dryer,” Chem. Eng. Res. Des., vol. 196, pp. 235–253, Aug. 2023. doi: 10.1016/j.cherd.2023.06.054. [Google Scholar] [CrossRef]
17. S. B. Kuang, A. B. Yu, and Z. S. Zou, “Computational study of flow regimes in vertical pneumatic conveying,” Ind. Eng. Chem. Res., vol. 48, no. 14, pp. 6846–6858, Jun. 2009. doi: 10.1021/ie900230s. [Google Scholar] [CrossRef]
18. A. Di Renzo and F. P. D. Maio, “Comparison of contact-force models for the simulation of collisions in DEM-based granular flow codes,” Chem. Eng. Sci., vol. 59, no. 3, pp. 525–541, Feb. 2004. doi: 10.1016/j.ces.2003.09.037. [Google Scholar] [CrossRef]
19. D. D. Attanayake, F. Sewerin, S. Kulkarni, A. Dernbecher, A. D. Alonso and B. Wachem, “Review of modelling of pyrolysis processes with CFD-DEM,” Flow, Turbul. Combust., vol. 111, no. 2, pp. 355–408, Jul. 2023. doi: 10.1007/s10494-023-00436-z. [Google Scholar] [CrossRef]
20. S. Tong, “The effect of connectivity of secondary fractures on proppant placement,” in Proc. 5th Unconv. Resour. Technol. Conf., 2017, pp. 24–26. doi: 10.15530/urtec-2017-2671549. [Google Scholar] [CrossRef]
21. F. Deng, B. Yin, X. Li, Y. Wang, and Y. Xu, “Analysis of the scaling mechanism and characteristics of a double-defects screen based on data from Hafaya oilfield,” J. Petrol. Sci. Eng., vol. 216, Sep. 2022. doi: 10.1016/j.petrol.2022.110729. [Google Scholar] [CrossRef]
22. X. He, M. Sinan, H. Kwak, and H. Hoteit, “A corrected cubic law for single-phase laminar flow through rough-walled fractures,” Adv. Water Resour., vol. 154, Aug. 2021. doi: 10.1016/j.advwatres.2021.103984. [Google Scholar] [CrossRef]
23. T. K. Guo et al., “Numerical simulation on proppant migration and placement within the rough and complex fractures,” Pet. Sci., vol. 19, no. 5, pp. 2268–2283, Oct. 2022. doi: 10.1016/j.petsci.2022.04.010. [Google Scholar] [CrossRef]
24. X. He, H. Hoteit, M. M. AlSinan, and H. T. Kwak, “Modeling hydraulic response of rock fractures under effective normal stress,” in ARMA/DGS/SEG Int. Geomech. Symp., Nov. 2020. [Google Scholar]
Cite This Article
 Copyright © 2025 The Author(s). Published by Tech Science Press.
This work is licensed under a Creative Commons Attribution 4.0 International License , which permits unrestricted use, distribution, and reproduction in any medium, provided the original work is properly cited.


 Submit a Paper
 Propose a Special lssue
 View Full Text
 Download PDF
 Downloads
 Citation Tools