 Open Access
ARTICLE
Dispatchable Capability of Aggregated Electric Vehicle Charging in Distribution Systems
1 Economic and Technology Research Institute, State Grid Henan Electric Power Company, Zhengzhou, 450052, China
2 College of Electrical Engineering, Sichuan University, Chengdu, 610065, China
* Corresponding Author: Binhua Tang. Email:
Energy Engineering 2025, 122(1), 129-152. https://doi.org/10.32604/ee.2024.054867
Received 10 June 2024; Accepted 14 September 2024; Issue published 27 December 2024
Abstract
This paper introduces a method for modeling the entire aggregated electric vehicle (EV) charging process and analyzing its dispatchable capabilities. The methodology involves developing a model for aggregated EV charging at the charging station level, estimating its physical dispatchable capability, determining its economic dispatchable capability under economic incentives, modeling its participation in the grid, and investigating the effects of different scenarios and EV penetration on the aggregated load dispatch and dispatchable capability. The results indicate that using economic dispatchable capability reduces charging prices by 9.7% compared to physical dispatchable capability and 9.3% compared to disorderly charging. Additionally, the peak-to-valley difference is reduced by 64.6% when applying economic dispatchable capability with 20% EV penetration and residential base load, compared to disorderly charging.Keywords
Nomenclature
| Constants | |
| Charging efficiency of EV | |
| Scheduling interval | |
| The collection of periods for EVs in charging station | |
| Set of interruptible loads | |
| The initial EV capacity | |
| The real-time electricity prices | |
| The base load on the feeder | |
| Base load | Non-EV electricity load |
| (·)min/max | min/max value of a quantity |
| Maximum capacity limit of the feeder | |
| The base load on the feeder j | |
| SOC | State of charge |
| Variables | |
| The SOC of | |
| The charging power of an EV at | |
| The charging power of the | |
| The SOC of | |
| The SOC of | |
| Describe whether the EV is at a charging station or not | |
| EV’s charging power at | |
| Optimal charging power of the charging station under economic incentives | |
| The SOC of single EV under economic incentives | |
| The SOC of the charging station under economic incentives | |
| Economic dispatchable capability | |
| Sacrificed economic dispatchable potential | |
To address the pressing global issues of energy scarcity and greenhouse gas emissions, and to meet national goals for peak carbon dioxide emissions and carbon neutrality, the promotion of the new energy revolution and the enhancement of renewable energy within the energy mix have become critical priorities in the construction of the national ecological civilization [1–3]. Electric vehicles (EVs), as green transportation solutions with zero or low emissions, hold a significant position in the new energy revolution, with their industry experiencing rapid growth. In 2022, China’s production of electric vehicles has exceeded 2 million units [4,5], supported by a public charging infrastructure comprising 666,500 charging piles and 43,300 charging stations [6–9]. This infrastructure constitutes the largest network, with the broadest coverage and the most comprehensive system in the world, catering to the charging needs of these vehicles.
The Energy Saving and New Energy Vehicle Technology Roadmap 2.0, published by the Chinese Society of Automotive Engineering, forecasts that by 2030, new energy vehicle sales will account for approximately 50% of total automobile sales [10]; and the demand for electric vehicles is predicted to reach around 25 million units by 2024 [11]. The extensive deployment of EVs can provide benefits such as acting as flexible energy storage resources and participating in ancillary services of the power market through demand-side management [12]. Moreover, they can significantly contribute to the promotion of renewable energy consumption [13].
To address the challenges faced by EVs in grid integration, it is crucial to consider their dispersed nature, large numbers, and relatively low individual power ratings. These characteristics make it difficult to manage EVs individually within grid operations. Therefore, aggregating EVs, with charging stations serving as the unit of aggregation, becomes a more effective approach [14]. However, large-scale integration of EVs into the grid introduces substantial charging loads, which can exacerbate the peak-to-valley load difference, degrade power quality, and potentially impact the secure and stable operation of the power system [15,16]. Thus, the development of an accurate aggregated charging model is essential to facilitate the efficient involvement of EVs in grid-supportive services, ensuring stability and optimizing energy distribution within the power grid.
The current research on aggregated electric vehicle (EV) charging loads heavily focuses on accurately determining the dispatchable capacity of these aggregations and their role in regulating power grids. One study in [17] proposes discontinuous variations of the SoC in the model when an EV is connected or disconnected from the charging point. However, it doesn’t consider the capacity that can be adjusted under economic incentives. Another study in [18] models the complex energy flow dynamics within an EV photovoltaic (PV) storage and charging aggregator, including the energy exchanges between EVs, PV systems, energy storage, and the power grid, but it doesn’t consider the variations in charging characteristics among different types of EVs in the aggregator. In addition, a study in [19] explores the economic aspects of charging power dispatchability by examining how spot market prices affect the dispatchable charging power of EVs to optimize charging economics. Another related study in [20] examines the spatial distribution of plug-in electric vehicles (PEVs) by analyzing their parking locations and categorizing them into distinct clusters. Each cluster is then modeled using a transmission-based load aggregation approach, with the battery’s state of charge (SOC) intervals further subdivided into sub-intervals. Furthermore, literature [21] proposes a mathematical model that integrates the SOC of EV batteries and the energy storage capacity at battery swapping stations to characterize the flexibility of EV charging demand. Another study in [22] introduces a model predicated on the affiliation function, which incorporates external conditions and user behavioral preferences during the EV charging process. In addition, literature [23] presents an EV cluster dispatching model, taking into account the non-rationally behavioral factors of users, facilitating the calculation of the dispatchable capacity of the aggregated model. Finally, literature [24] examines an EV aggregation model for both charging and discharging modes, delineating the energy and power boundaries of EVs and defining their flexibility. The objective is to mitigate the operating costs of the distribution network, yet the study does not account for the influence of different application scenarios on the dispatchable flexibility of EVs.
In a study by [25], a state-space model is used to depict the dynamics of aggregated EV charging. The main goal is to maximize benefits for the aggregator. The state variables include EVs’ state of charge (SOC) and the charging/discharging power. However, the model does not account for the complexities introduced by regulatory constraints on charging and discharging power.
Table 1 presents a more detailed comparison of various methods and their involvement in aggregated charging modeling and dispatchable capability, alongside the proposed method.
Based on existing research, this paper explores the evaluation of the controllable ability of combined electric vehicle (EV) charging loads, considering various factors. The study investigates how different factors such as base loads, EV adoption rates, and user participation impact the effectiveness of aggregated charging loads in managing peak demand and grid stability.
The paper makes three main contributions: (1) It develops a comprehensive model of the EV charging process, from individual charging units to aggregated charging stations’ participation in grid operations, while considering grid security constraints; (2) It uses the Minkowski addition method to model aggregated charging at the charging station level, simplifying the model and reducing the number of independent variables considered; (3) It compares the impact of demand response under varying controllable capacities, influenced by different base loads, EV adoption rates, and user participation levels, providing practical insights for charging aggregator strategies.
The remainder of this paper is structured as follows: Section 2 presents the development of an aggregated model of EV charging load at the charging station level. Section 3 details the model for aggregated EV charging participation in grid operations. Section 4 provides descriptions of the case studies, followed by the presentation of simulation results. Concluding remarks are offered in Section 5.
2.1 EV Individual Modeling Based on Charging Behavior
This study comprehensively considers the entire charging process of an individual EV, spanning from the moment the vehicle enters a charging station to the time it departs. In this case, only one specific charging station per electric vehicle is considered for charging. The time the EV arrives at the charging station is recorded starting at 0, EV’s SOC can be expressed as:
(1) Power constraints for EV
The charging and discharging power are limited by the maximum rated charging and discharging power of the EV, also EV can’t be charged and discharged at the same time, which can be expressed as:
(2) Capacity constraints for EV
The first equation in Eq. (3) means that the SOC during the charging period is limited between simin and simax for safety considerations, while the second equation ensures that the SOC at the end of the charge reaches the user’s needs.
2.2 EV Aggregation Modeling in Terms of Charging Stations
Individual EVs typically don’t meet the threshold for direct participation in the electricity market and are usually managed through aggregators. Consequently, EV charging stations, acting as natural aggregators, are essential in developing models for aggregated EV charging. When constructing a model for a charging station, it is not feasible to directly sum the charging/discharging power and the SOC of each EV, given that each EV occupies different periods within the station and possesses a distinct definition domain for its model. This conventional approach encounters issues such as excessive model constraints and elevated model dimensionality. This section extends the definition domain of each individual model to the entire research period T and introduces the parameter xi,t to describe whether the EV is at the charging station or not. Suppose the ith EV is in the charging station at the tth time period, xi,t = 1, otherwise xi,t = 0. Considering the sudden change of EV capacity caused by the EV arrival and leaving, the individual EV model with extended definition domain should be expressed in segmented function as:
where Tiarrive is the period that the ith EV arrives at the charging station; si0 is the initial EV capacity, which reflects the sudden change in capacity when the EV is first connected to the station; Tileave is the period that the ith EV leaves the charging station. The periods from Tiarrive to equal to Ti in Section 2.1.
(1) Power constraints for EV
Refer to power constraints in Section 2.1, the new power constraints considering the extended definition domain should be expressed as:
(2) Capacity constraints for EV
At the time before the EV leaves, its charging demand should be satisfied, so the new capacity constraints considering the extended definition domain can be described by Eq. (6):
Based on these constraints, the segmented formulation of Eq. (4) (i.e., the individual EV model with extended definition domain) can be harmonized into the following equation:
for the equation, to make sense when t is 0, xi, −1 is additionally defined to be 0. xi,t (1 − xi,t−1) = 1 is equivalent to satisfying the condition that t = Tiarrive, while (1 − xi,t−1) xi,t−1 = 1 is equivalent to satisfying the condition that t = Tileave + 1. When t < Tiarrive, si,t = 0 in Eq. (7); when t = Tiarrive, si,t = si0 + ηchpi,tchΔt, which takes into account the initial SOC of EV; when t = Tileave, si, Tileave = si0 + ηchpi,tchΔt; when t = Tileave + 1, si,t = 0, which takes into account the off-grid SOC. Thus, it solves the problem of sudden changes in SOC in a single equation and endows the charging model of a single vehicle with Minkowski additivity.
Sum up all EVs in the same charging station to get the EV aggregated model, which can be described as:
(1) Power constraints for EVs aggregated model
Sum power constraints of each EV with extended definition domain, so that the power constraints for EVs aggregated model are shown in Eq. (8):
(2) Capacity constraints for EVs aggregated model:
2.2.1 EV’s Physical Dispatchable Capability
Under disorderly charging conditions, EVs start charging at maximum power immediately upon arrival at the charging station until fully charged, and the physical dispatchable capability is defined by the EV aggregated model, which can be described as:
(1) Power and capacity constraints
By integrating Eq. (4), one of the SOC of aggregated model constraints between consecutive periods is shown below. To simplify the modeling process, the paper considers all EV charging effectiveness to be equal.
While other constraints can be described by Eqs. (8) and (9).
2.2.2 EV’s Economic Dispatchable Capability
The electricity price determined by the grid fluctuates in response to varying load conditions. Employing in-station optimization, charging stations can strategically schedule electric vehicle (EV) charging sessions to minimize charging costs for users and consequently achieve an aggregated load profile different from that resulting from uncoordinated charging. Furthermore, the economic dispatchable capability of EVs is characterized by contrasting it with the physical dispatchable capability.
The objective function should be stated as:
where fEV is the objective function of each EV that minimizes charging costs.
(1) Power and SOC constraints
where
Optimized charging station parameters are as follows:
The charging power neighborhood under economic incentives is defined as the economic dispatchable capability of the EVs aggregated model, and the degree of deviation from
where the region of Pn,t is the economic dispatchable capability;
Constraints can be expressed as:
3 EVs Aggregated Modeling Incorporated into the Grid
A critical differentiation between an aggregated EV charging model intended for participation in grid operations and a model that is scoped solely to the level of charging stations is the incorporation of grid constraints. Specifically, the charging power of the former model is subject to the capacity limitations of the feeder to which the charging station is connected, as well as the operational constraints related to the currents and voltages within the distribution network. The imposition of these constraints can result in a diminished dispatchable capability of the charging power. The additional constraints should encompass:
(1) Constraints for feeder capacity and power
where Fj is the maximum power allowed on the feeder j, and Lj(t) is the base load on the feeder j.
where Pi,t and Qi,t mean node i load active/reactive power at the tth time;
(2) Constraints for nodal voltage
where Ui,t means ith nodal voltage at tth time; Ui, N means the rated voltage of node i. Normally, the constraint range should be 0.95Ui, N to 1.05Ui, N, but this paper mainly aims to study the effect of line capacity on the dispatchable capability, so the voltage safety limits are amplified.
In summary, the aggregated charging dispatchable capability when participating grids should be fully defined by Eqs. (16)–(21).
The dispatchable capability is used as a constraint for charging load regulation. Different from the inner-station optimization process from the physical dispatchable capability to economic dispatchable capability, the optimization discussed in this section focuses on the interaction between EV clusters namely charging stations and base load. Charging optimization with the objective of peak shaving is considered with the objective function shown in (21).
where
(1) Constraints for charging stations
If based on physical dispatchable capability, the constraints for should be the same as in Section 2.2.1; If based on economic dispatchable capability, the constraints should be expressed as Eqs. (15)–(17).
(2) Constraints for feeder capacity and power are the same as Eqs. (18)–(20).
Typically, the charging power profile of EVs during disorderly charging exhibits significant differences compared to that shaped by economic incentives. In optimizing the participation of charging stations in grid operations, a smaller value of α that yields a solution indicates a greater dispatchable load region for charging stations.
First, we compare the effects of base loads with different characteristics and the use of different types of dispatchable capability on the tuning results of the combined charging load. Then, we investigate the effects of various EV penetration rates and different users’ willingness to participate in influencing the dispatchable capability of the charging load.
A practical distribution system is utilized for analyzing the co-optimization of energy reserves, as depicted in Fig. 1. The system consists of 7 feeders and 4 charging stations, all powered by the main grid. Detailed system parameters can be found in Reference [27]. Base load forecast values for residential and commercial areas are provided in Tables 2 and 3, while real-time economy prices are outlined in Table 4.
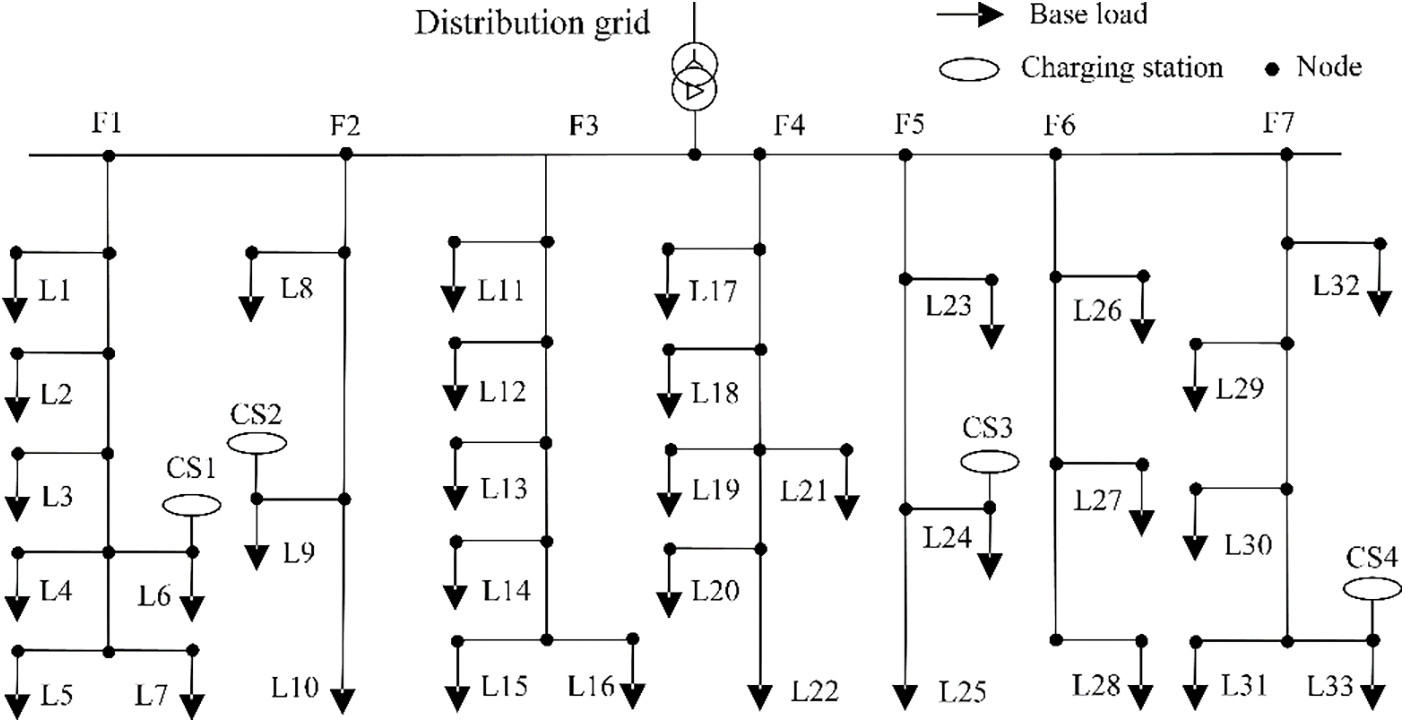
Figure 1: Structure of a practical test case


It’s important to note that each feeder has a maximum capacity of 8 MW. Electric vehicles (EVs) are divided into three groups at the charging stations based on their charging characteristics, and sample data for EVs are categorized accordingly. Sampling parameters for charging stations at 8% and 20% penetration are presented in Tables 5 and 6, respectively.


To better understand the impact of aggregated charging regulation, adjustments have been made to the capacity and charging power of individual vehicles, with a simultaneous increase in the number of vehicles.
4.2 Impact of Different Scenarios on Dispatchable Capability
The electric vehicle (EV) load penetration is set at 8% in this section, with charging stations connected to feeders 1, 2, 5, and 7. Firstly, charging parameters such as arrival time, expected departure time, initial state of charge (SOC), and maximum charging power are collected for each EV. Secondly, an aggregated EV charging model is developed by combining individual EV data. Based on the parameters of the aggregated EV charging model, both physical and economic dispatchable capabilities are calculated. These capabilities are then applied as power constraints.
The charging schedule within the station is optimized to minimize the charging cost for each EV. Subsequently, the aggregated load of the charging stations, corresponding to the minimized charging cost, is obtained, as illustrated in Fig. 2. The periods 1–91 correspond to the period from 8 AM to 8 AM the next day, with each time slot representing 15 min.
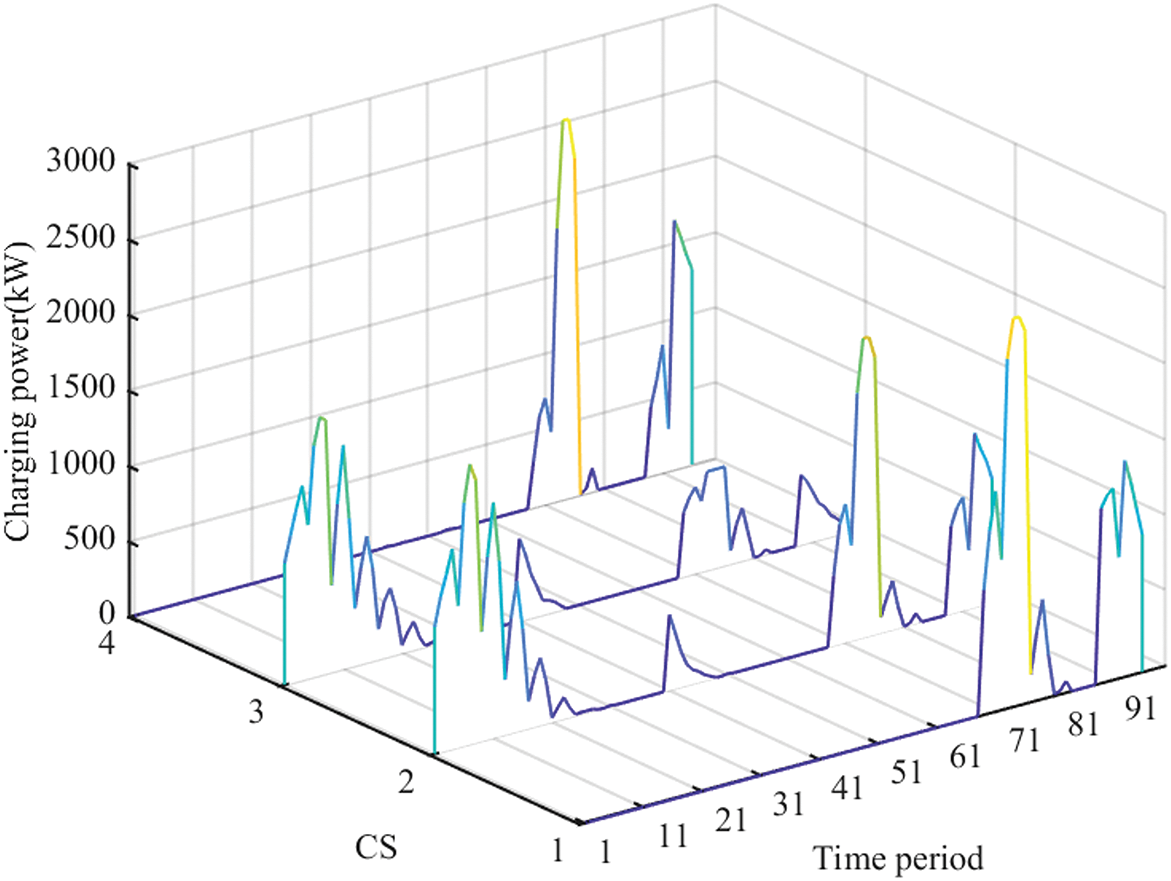
Figure 2: Charging stations load under economic incentive
In Fig. 1, let’s consider CS1. When α is 324 kW, the shaded area in Fig. 3 shows the optimized charging power region allowed.
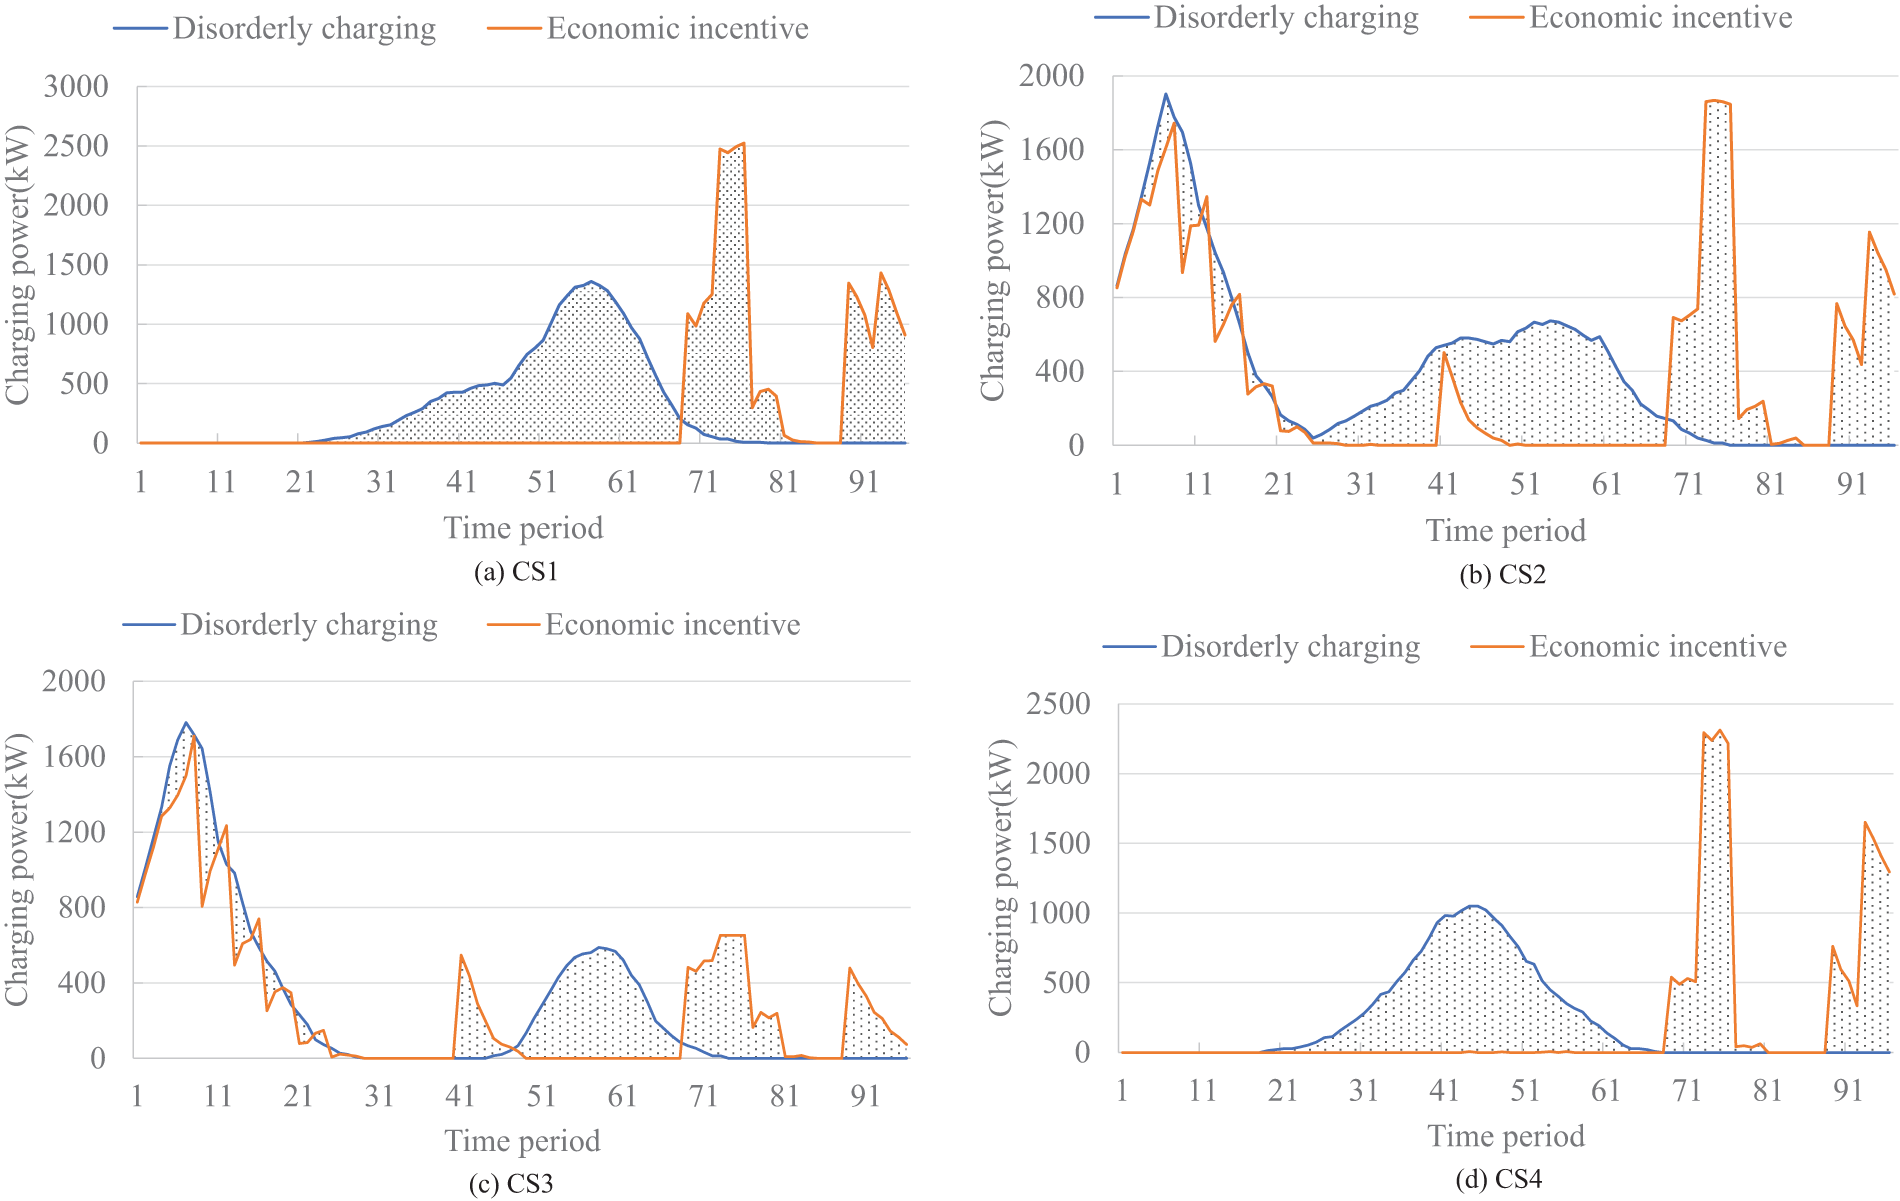
Figure 3: The economic dispatchable capability of charging stations
The modeling algorithm defines the physical dispatchable potential as the maximum power of the aggregated charging load. In comparison, the economic dispatchable potential is determined by minimizing charging costs. The difference between the optimized charging curve and the disorderly charging curve represents the economic dispatchable potential. Table 7 presents the standard criterion of the modeling algorithm.

4.2.1 Scenario #1: The Base Load Is Commercial Type
Base loads are generally divided into commercial loads, which peak during the day and decrease at night, and residential loads, which peak in the morning and evening.
Applying the physical dispatchable capability to optimize the aggregated load with commercial baseload effectively achieves the peak shaving objective, as illustrated in Fig. 4. This optimization reduces the peak load from 47,336.6 kW during unordered charging to 46,175 kW during ordered charging. It also smooths the load difference to 0 during the period 53–81. Furthermore, it effectively fills in the valleys, increasing the load valleys from 20,935.6 to 26,567.9 kW, and reducing the peak-to-valley difference by 25.7% from 20,401 kW in disorderly charging to 19,607.1 kW. This improvement is particularly significant due to the low proportion of EV load to total load.
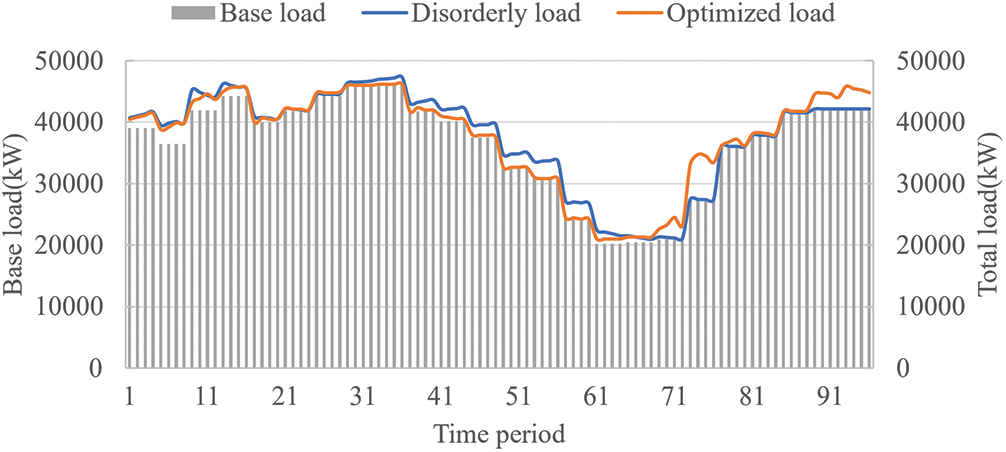
Figure 4: Commercial characteristic load based on physical potential
The aggregated load of each charging station after optimization is shown in Fig. 5.
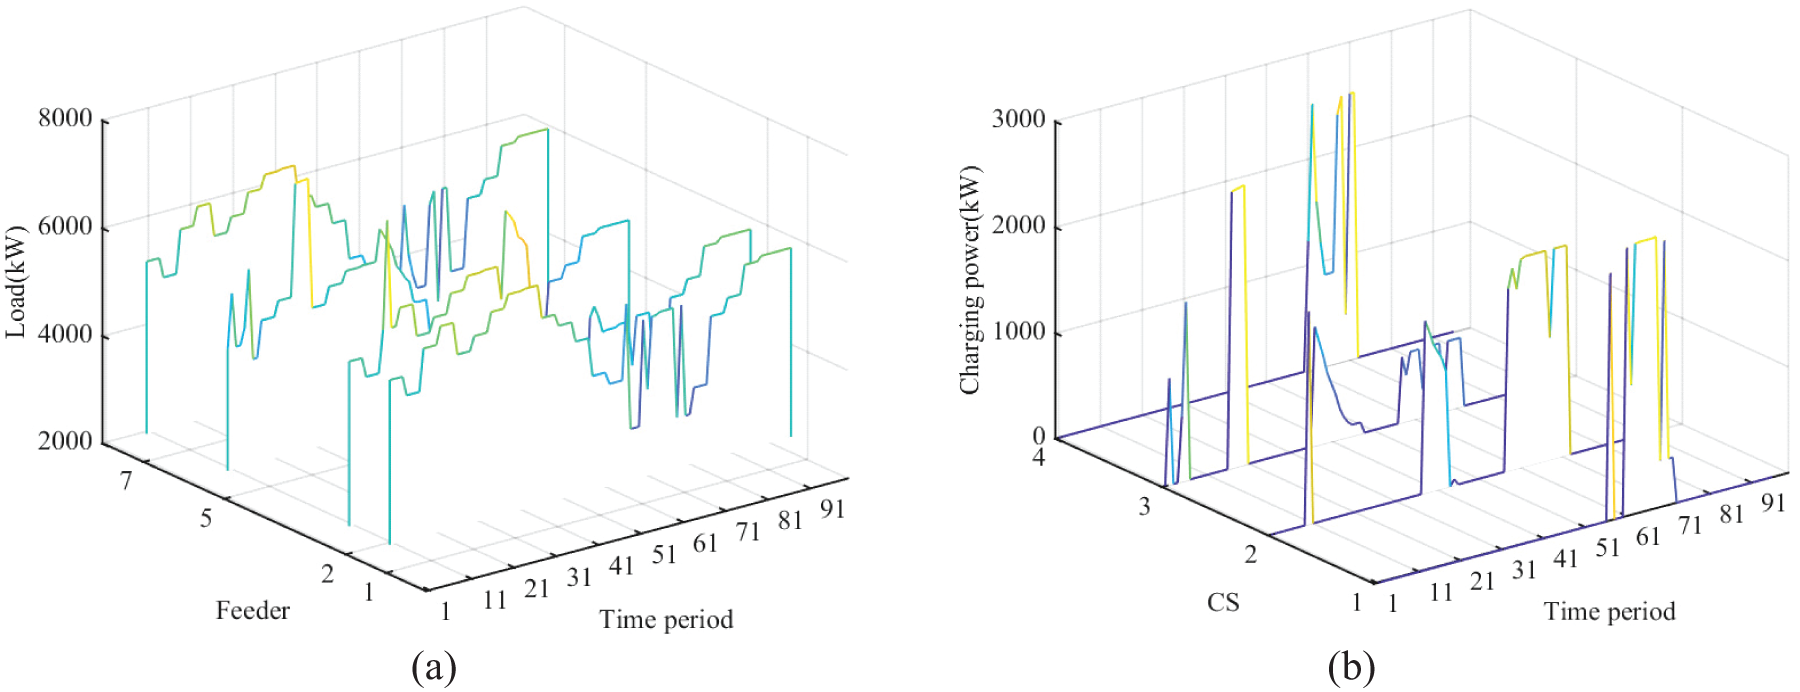
Figure 5: Feeders and EVs aggregated load after optimization
In the context of economic dispatchable capability, the optimized load and peak load illustrated in Fig. 6 decline from 47,336.4 kW during disorderly charging to 46,175.7 kW, representing a marginal reduction of 2.5%. Moreover, the load valley increases from 20,935.6 kW during disorderly charging to 20,987.5 kW, resulting in a reduction of the peak-valley difference from 26,401 to 25,187.5 kW, marking a 4.5% decrease. This effect is comparatively less pronounced when compared to the application of physical dispatchable capability. The underlying reason is the substantial number of vehicles opting to charge during the 67–76 and 89–15 time periods in response to economic incentives, consequently leading to peak loads.
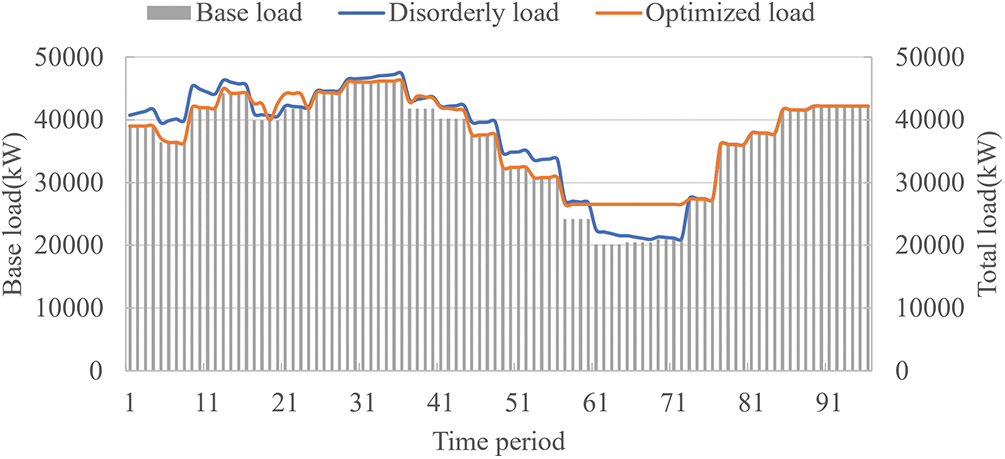
Figure 6: Commercial characteristic load based on economic potential
The optimized load of the charging stations and feeders is presented in Fig. 7. It is evident that the charging station loads are not constrained by security limitations during dispatch, thereby fully leveraging economic dispatchable capability. The optimized load of the charging station shown in the figure delineates the boundary of its dispatchable capability. Additionally, the total charging cost when employing economic dispatchable capability amounts to $61,876, denoting a 34.7% reduction from the $94,835 incurred when utilizing physical dispatchable capability.
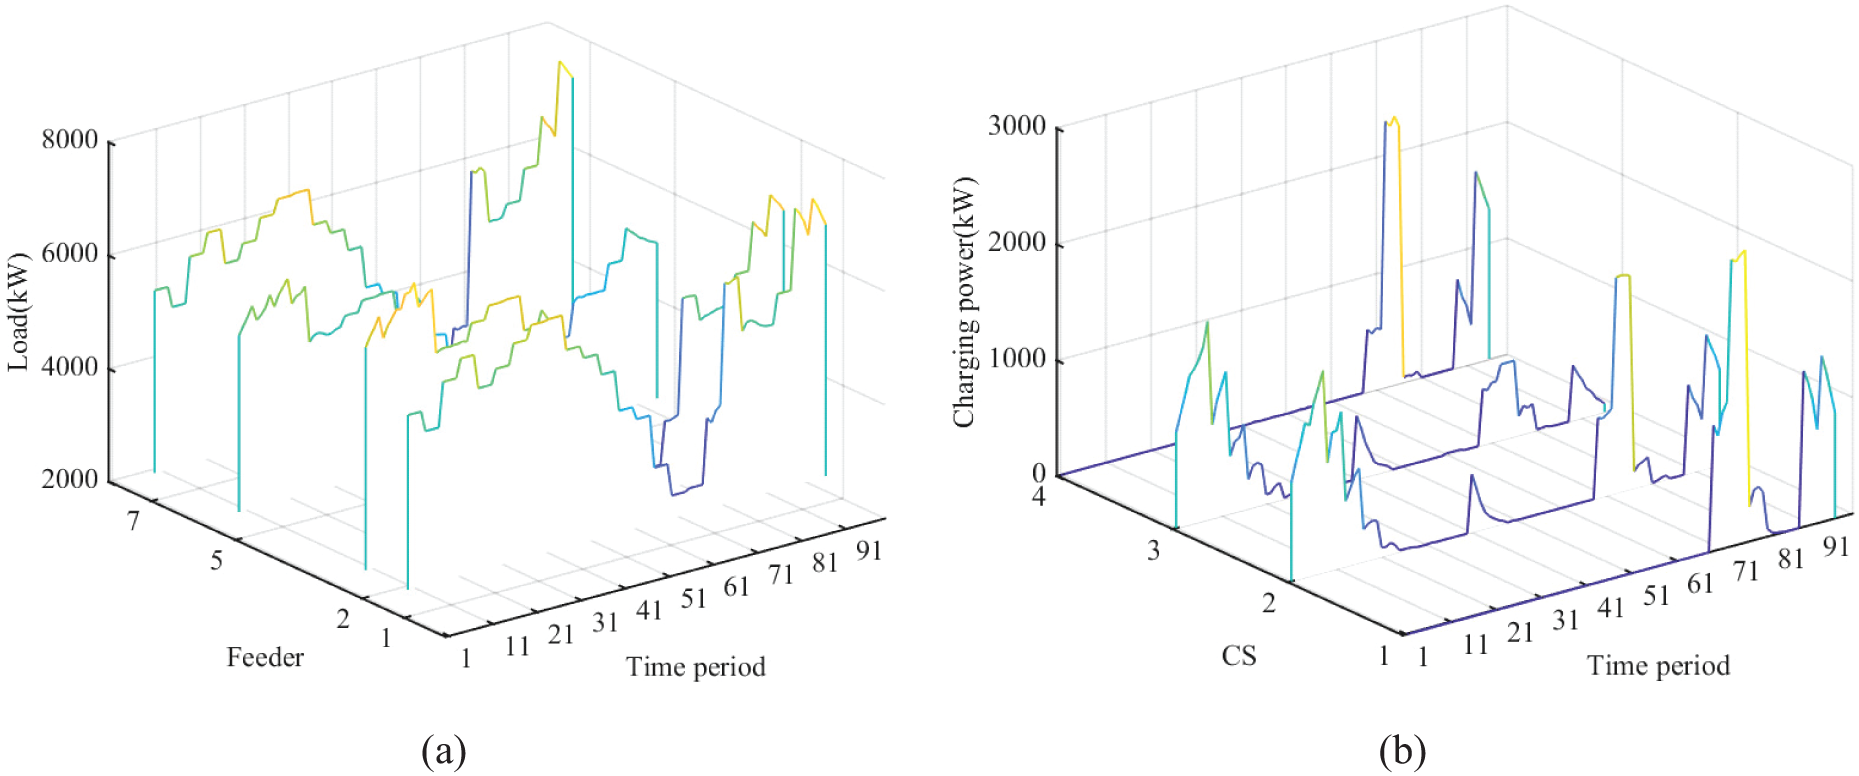
Figure 7: Feeders and EVs aggregated load after optimization
4.2.2 Scenario #2: The Base Load Is Residential Type
When the regional base load is residential type, the physical dispatchable capability is applied to optimize the charging decision of charging stations, and the load for disorderly and orderly charging is shown in Fig. 8. The peak-valley difference is cut from 13,800.6 to 9807.8 kW, a decrease of 28.9%; the load peak drops from 43,657.6 to 41,400.1 kW, and the load valley rises from 28,022.2 to 31,592.5 kW, effectively achieving peak shaving and valley filling. The aggregated load for each charging station is shown in Fig. 9, showing that charging stations primarily charge when the base load or the corresponding feeder load is low and cease charging when it is high.
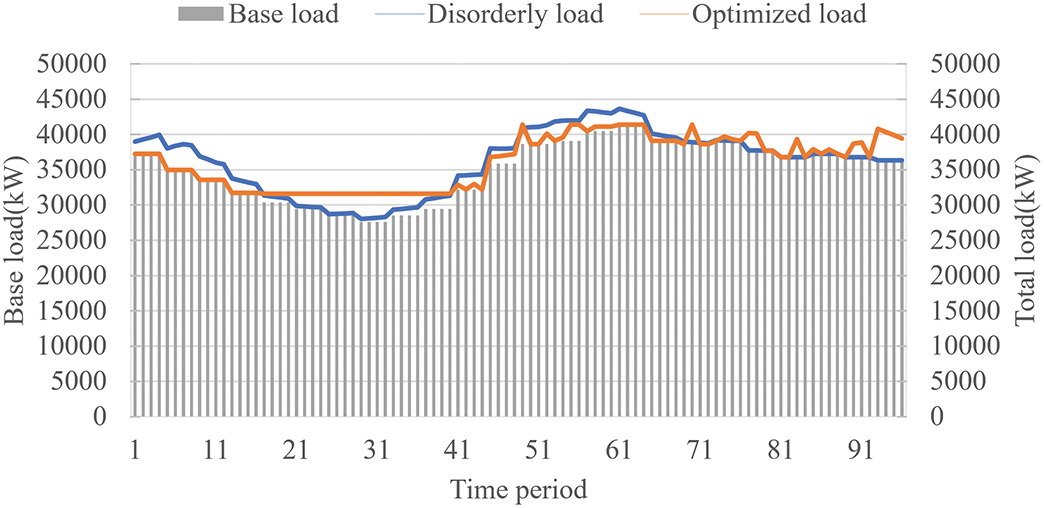
Figure 8: Base and total residential load based on physical potential
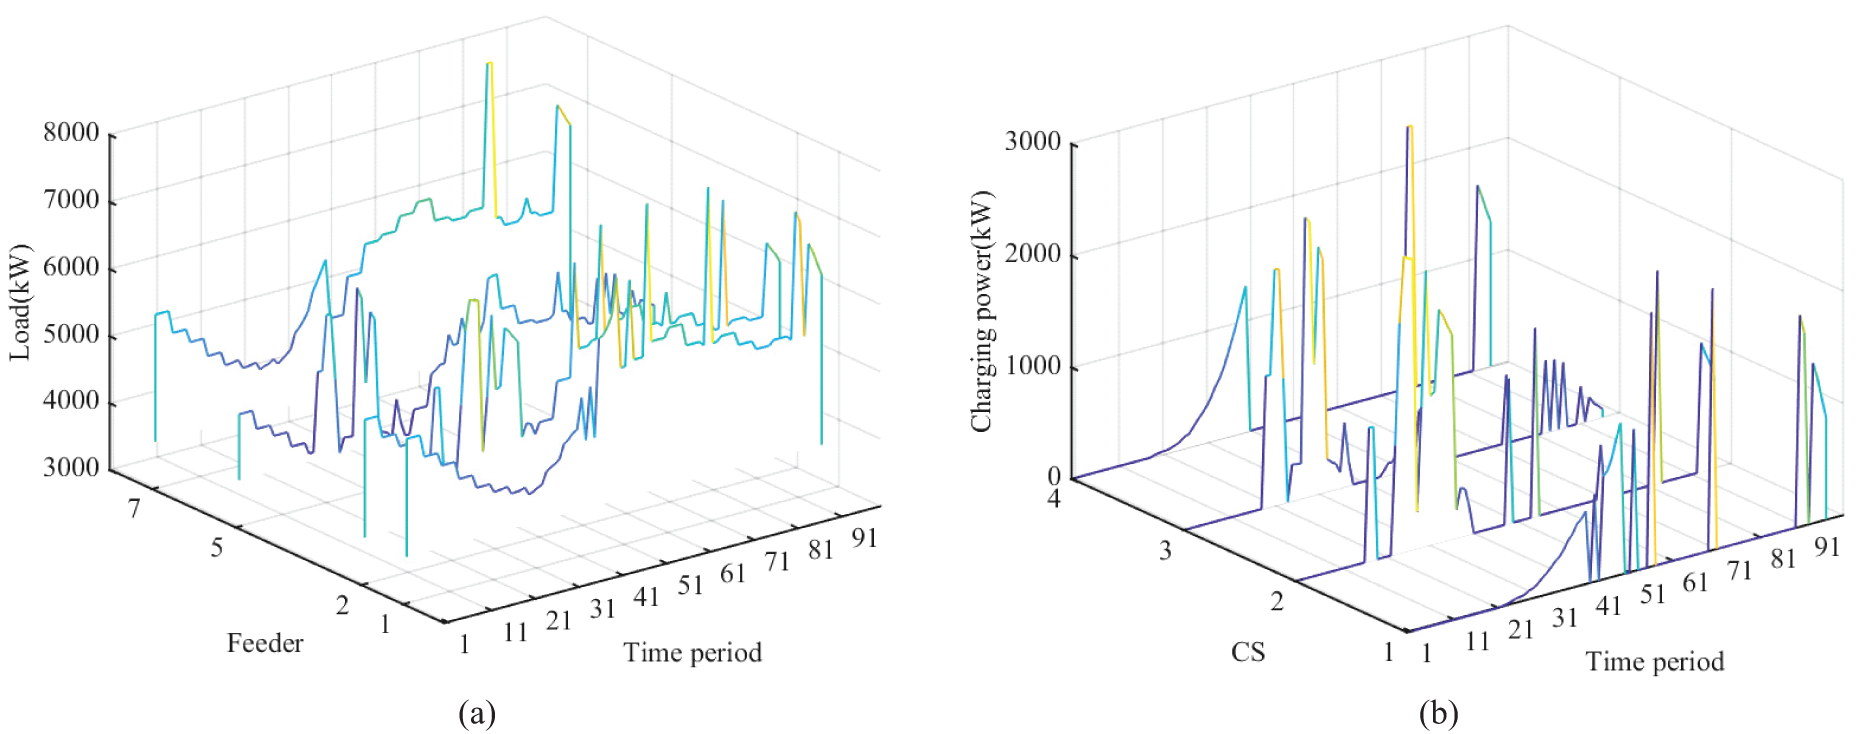
Figure 9: Feeders and EVs aggregated load after optimization
When the economic dispatchable capability is used, the aggregated load of each charging station is shown in Fig. 10. It can be observed that, under economic incentives, the charging stations predominantly perform high-power charging during periods 61–81 and 91–21, leading to feeder loads peaking during these corresponding periods. The total load of the study area is shown in Fig. 11, indicating that the effect of peak shaving is not significant compared to disordered charging. The peak-to-valley difference even worsens to 28,416.8 kW, as the optimized charging load peak coincides with the base load peak during periods 71–77, resulting in a new peak of 45,455.1 kW in the total load of the area.
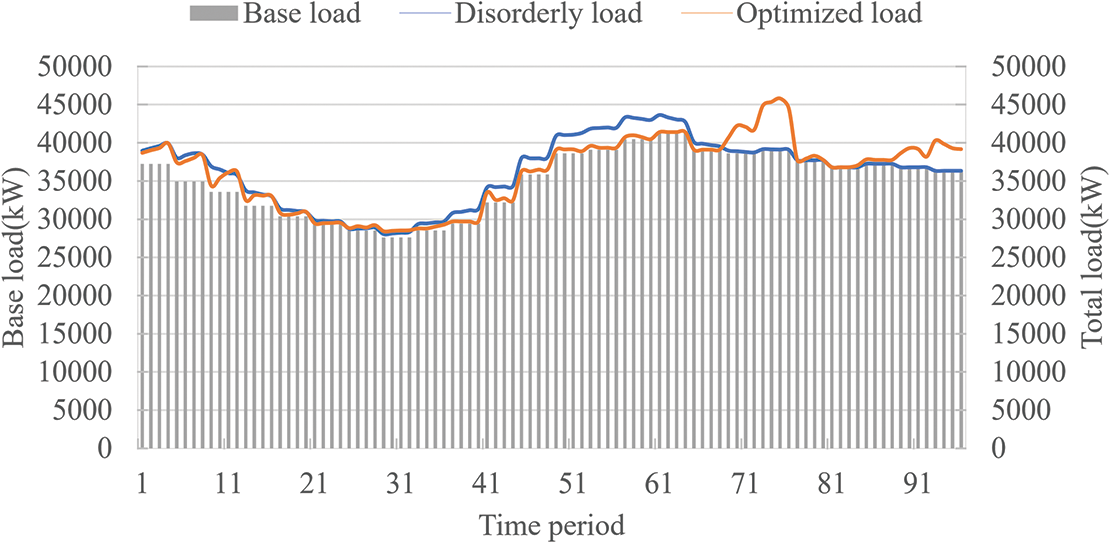
Figure 10: Base and total residential load based on economic potential
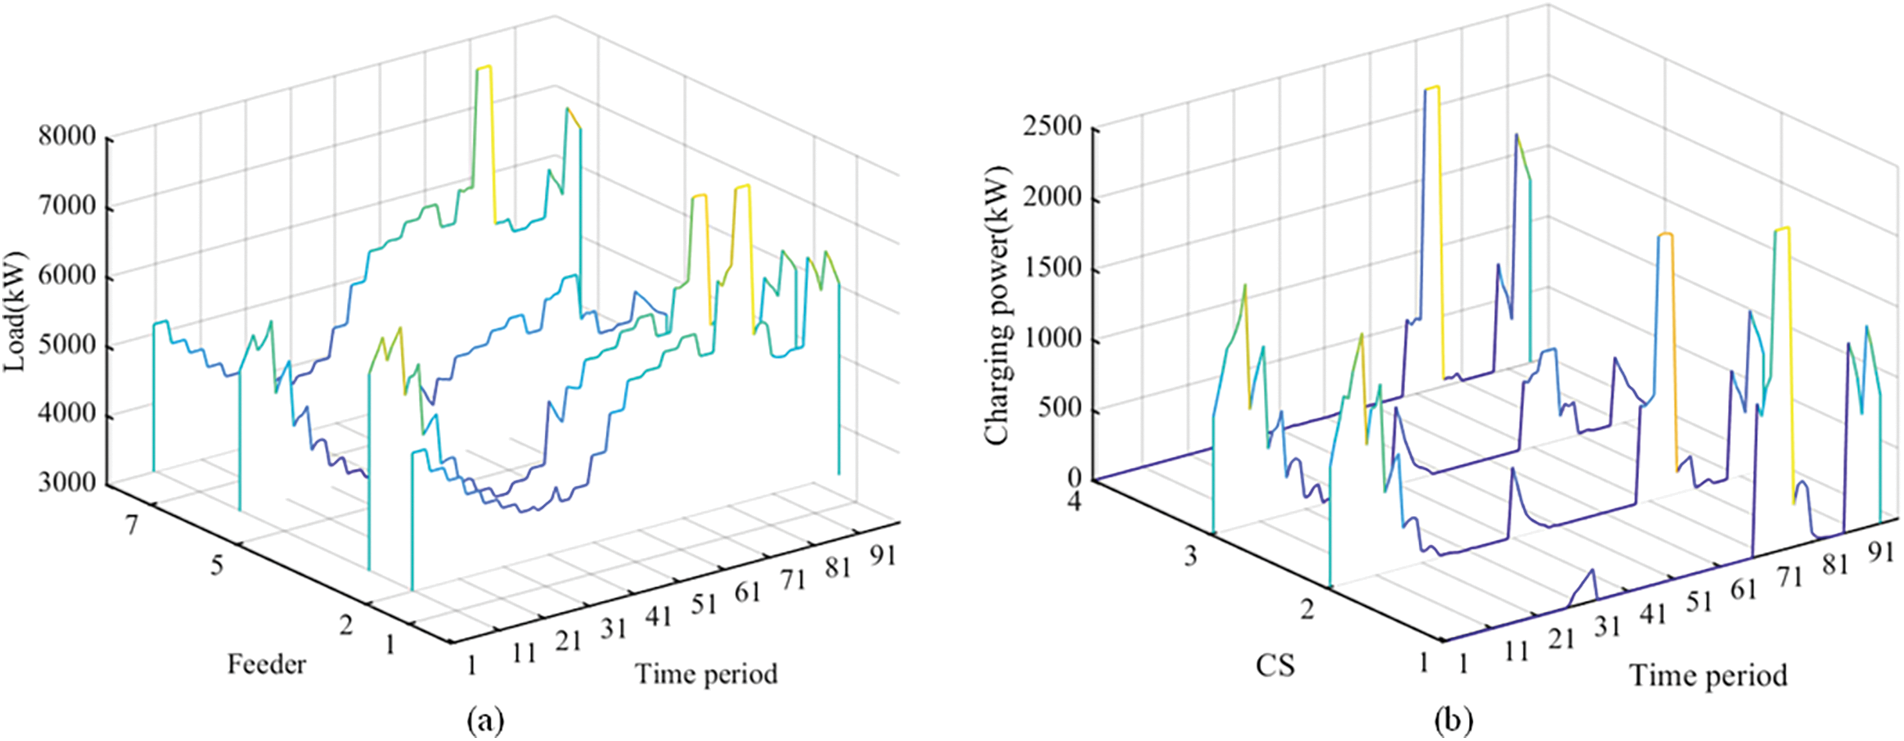
Figure 11: Feeders and EVs aggregated load after optimization
The total charging cost is $64,359, which is 45.69% lower than the $118,513 cost when using physical dispatchable capability, thereby satisfying the economic efficiency of charging.
The values of α required to ensure the solvability of the model are listed in Table 8. A higher α value typically corresponds to residential base loads rather than commercial ones, indicating limited economic flexibility for managing aggregated EV charging under residential base load conditions. This limitation arises from the alignment of residential base loads with the peaks of optimized EV loads, which leads to a fully loaded grid even with low EV penetration. Consequently, grid security constraints place a restricted boundary on dispatchable capability.

4.3 Impact of EVs Penetration on Dispatchable Capability
Assuming the same locations for charging stations as in Section 4.2, as EV penetration increases, there may be a decrease in the effectiveness of peak shaving when utilizing the economic dispatchable capability to optimize charging decisions. In some cases, there might even be challenges in meeting economic requirements due to safety constraints on feeders. Specific analyses are provided in the following sections.
4.3.1 Scenario #1: The Base Load Is Commercial Type
Assuming a 50% EV penetration and the base load characteristics typical of a commercial region, the total regional load, when optimized through the application of both physical and economic dispatchable capabilities, is depicted in Fig. 12. The peak-to-valley difference achieved by physical dispatchable capability methods is 3294.7 kW, marking a reduction of 95.7% compared to disorderly charging, while the peak-to-valley difference achieved by economic dispatchable capability methods is 39,694.7 kW, marking a reduction of 56.5%. The reason is that with a high penetration rate of electric vehicles, small fluctuations in electricity prices can lead to significant load changes, resulting in ineffective peak shaving and valley filling.
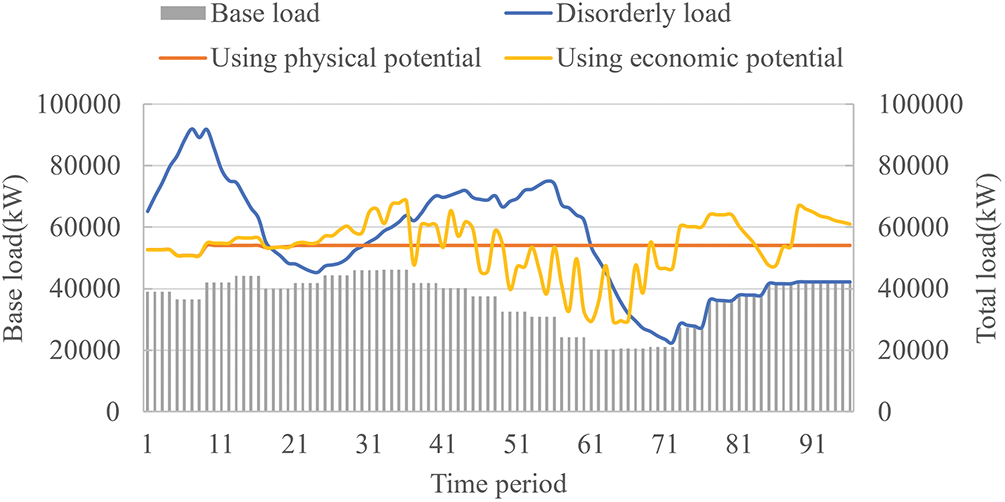
Figure 12: Base total load of commercial type, 50% penetration
The total charging cost amounts to $1,320,851 when utilizing the economic dispatchable capability, representing a 1.2% reduction compared to the $1,335,874 incurred when employing physical dispatchable capability. Moreover, it is 40.2% cheaper than the $1,852,637 cost associated with disorderly charging. This observation indicates a significant economic dispatchable load region of the charging station in this scenario, which aligns with the physical dispatchable load region. This alignment is primarily due to the lower electricity prices during periods 67–83 coinciding with the base load valley. Consequently, the objective of peak shaving is consistent to reduce charging costs.
The optimized load and dispatchable capability boundaries for the feeders and charging stations are depicted in Fig. 13a,b, correspondingly. Feeder 7 runs at full load during periods 61–75 and 81–90, covering about one-third of the study period, while Feeder 2 operates at full load for about two-thirds of the total period. Constraints on the dispatchable capacity of the charging stations are presented in Table 9. The analysis reveals safety risks for all feeders serving the charging stations, highlighting the need for strategic enhancement of feeder capacities to improve safety and economic efficiency of charging operations.
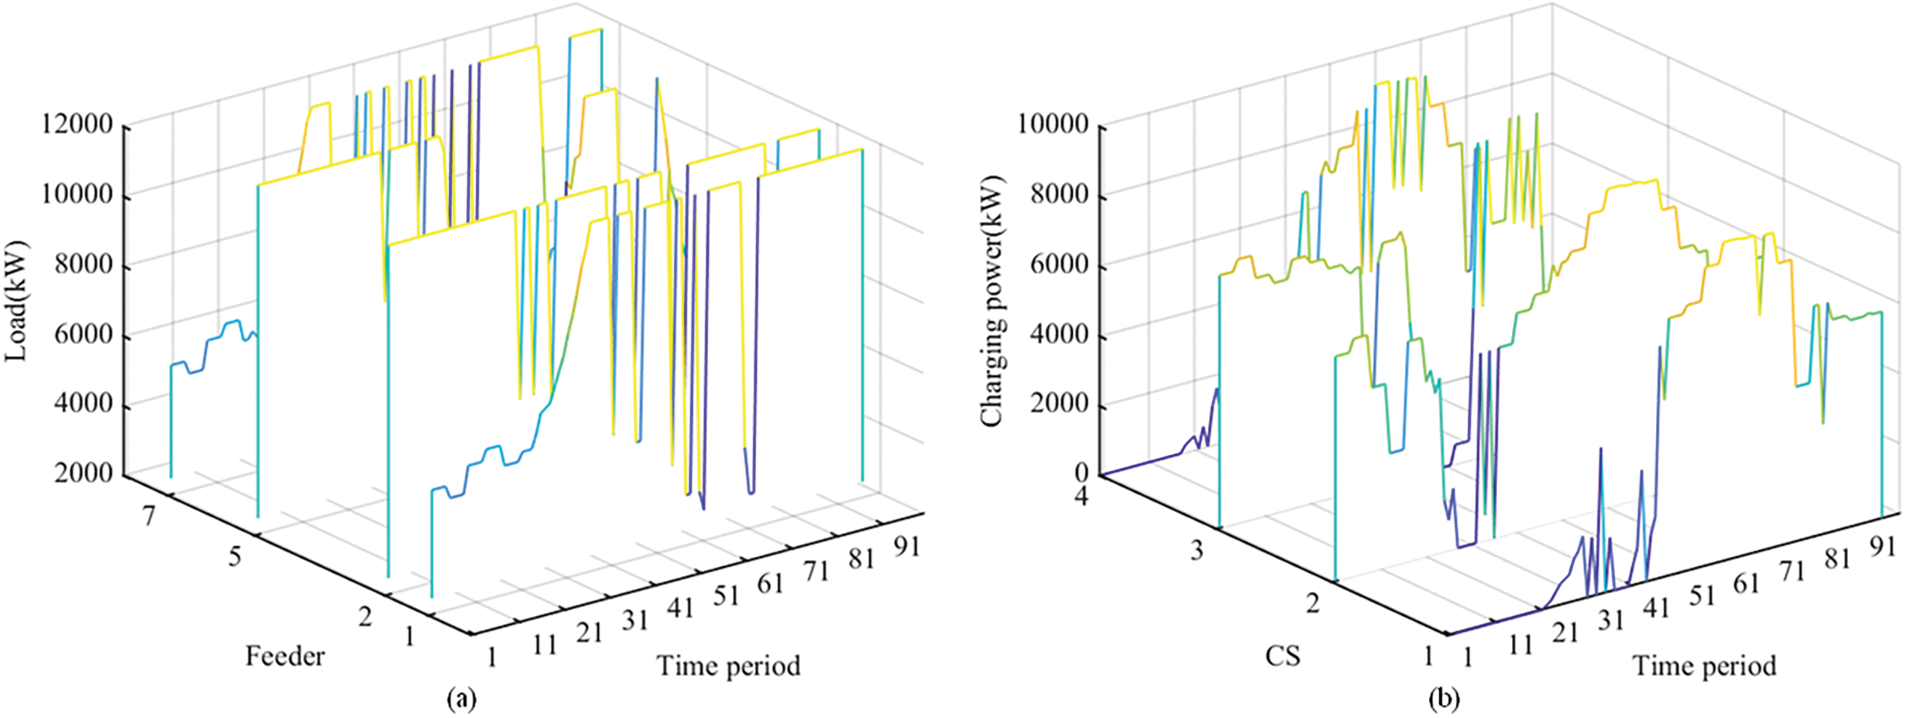
Figure 13: Feeders and charging stations load with commercial base load

When employing economic dispatchable capability, Electric vehicles have a significantly better peak-shaving effect at 50% penetration than at 8% penetration, which shows that although the high penetration rate affects the safety of the feeders, it also leads to a better peak-shaving and valley-filling ability.
4.3.2 Scenario #2: The Base Load Is Residential Type
The optimization of the charging process involves the utilization of both physical and economic dispatchable capabilities. Fig. 14 provides an illustration of the total regional load, with physical dispatchable capability methods demonstrating a peak-to-valley difference of 8285.6 kW, representing an 85.9% reduction compared to disorderly charging. Conversely, economic dispatchable capability methods result in a peak-to-valley difference of 34,823.1 kW, reflecting a 40.9% reduction.
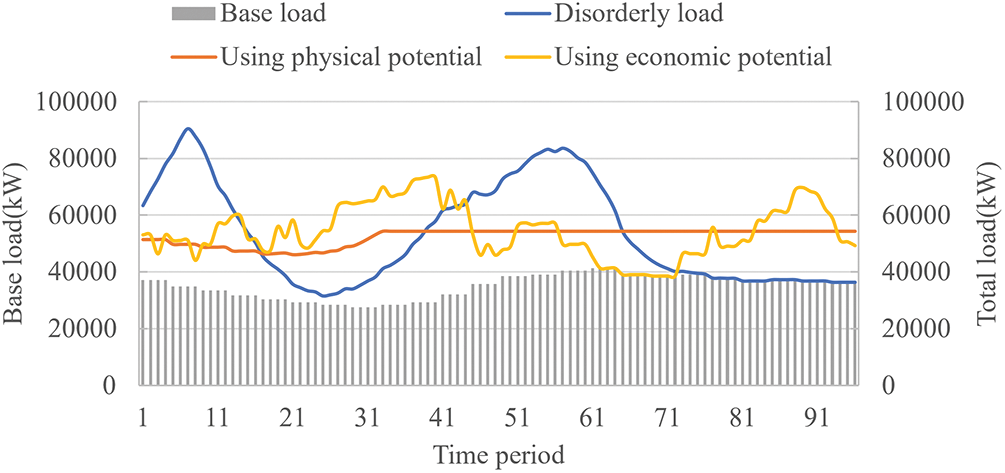
Figure 14: Base and total load of residential type, 50% penetration
The implementation of economic dispatchable capability results in a total charging cost of $240,619, representing a 23.7% cost reduction compared to the $314,889 cost associated with physical dispatchable capability, and an 86.6% reduction compared to the $1,797,417 cost of disorderly charging. However, it is crucial to note that this approach may be less economical than at 10% penetration, as fluctuations in base load during periods of lower electricity prices could lead to increased feeder capacity occupation and reduced economic dispatchable capability compared to the preceding section (Section 4.3.1).
The capacity limits of the optimized feeder loads and charging stations’ dispatchable capabilities are visually presented in Fig. 15a,b, respectively. It is evident from the figures that the feeders experience full utilization during instances of low electricity prices. Feeder 2, which exhibits a lower base load during Periods 1–60, demonstrates a greater economic dispatchable capability in order to achieve the peak shaving goal due to safety constraints during periods of low electricity prices.
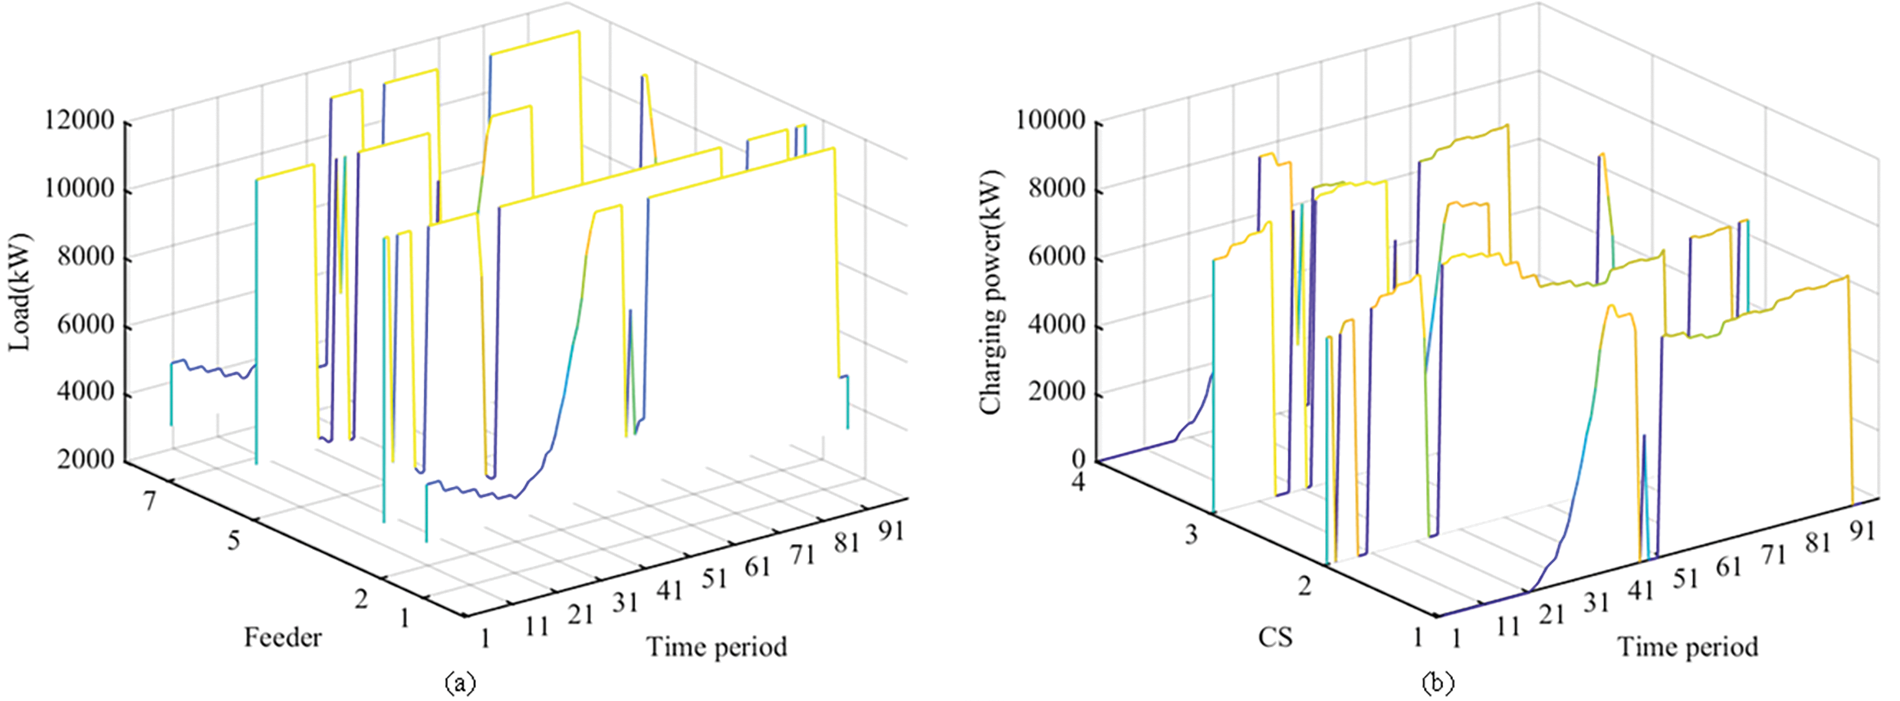
Figure 15: Feeders and charging stations load with residential base load
To further compare the economic dispatchable capabilities of different charging stations across various scenarios, the values of α that allow the model to have a solution in each case are shown in Table 10. As indicated in Table 10, CS3 has the highest economic dispatchable capability because Feeder 3 has the lowest base load and CS3 does not have a high charging load, providing sufficient feeder security margins to utilize the dispatchable capability. Charging stations with residential base loads generally have lower dispatchable capabilities than those with commercial base loads. These comparison results also offer recommendations for the location planning of charging stations: high-capacity charging stations should be built on feeders with low loads whenever possible.

4.4 Impact of Users’ Willingness to Respond to Dispatchable Capability
It is assumed that the base load represents the characteristics of a commercial area with a 20% electric vehicle (EV) penetration rate, and the locations of the charging stations are the same as in Section 4.2. The willingness of users to participate in organized charging may vary due to various subjective or objective reasons. This section examines the characteristics of the area load and the difference in the adjustable potential of each charging station under different levels of willingness of users to participate.
At a user participation willingness of 50%, Fig. 16 illustrates the ratio of disorderly load to dispatchable load within the optimized load at each charging station when applying the physical dispatchable capability. The disorderly charging and orderly charging in Fig. 16 refer to the dispatchable and non-dispatchable parts of the EV charging load. In addition, Fig. 17 presents the load profiles of the feeders hosting the charging stations, indicating that none of the feeders can satisfy the capacity constraints. When the charging station regulation objective is adjusted to focus on peak shaving for individual feeders, the optimization outcomes are depicted in Fig. 18, revealing that only Feeder 1 complies with safety requirements. It is known that the optimized charging power, aimed at achieving the minimum peak-to-valley difference, fails to comply with the feeder safety constraints. This shortfall is primarily due to the insufficient willingness of users to participate, which results in a heightened burden on the grid from uncoordinated charging. Given these circumstances, the economic dispatchable capability becomes an impractical consideration, as the priority lies with ensuring the grid’s operational safety and meeting the feeder constraints.
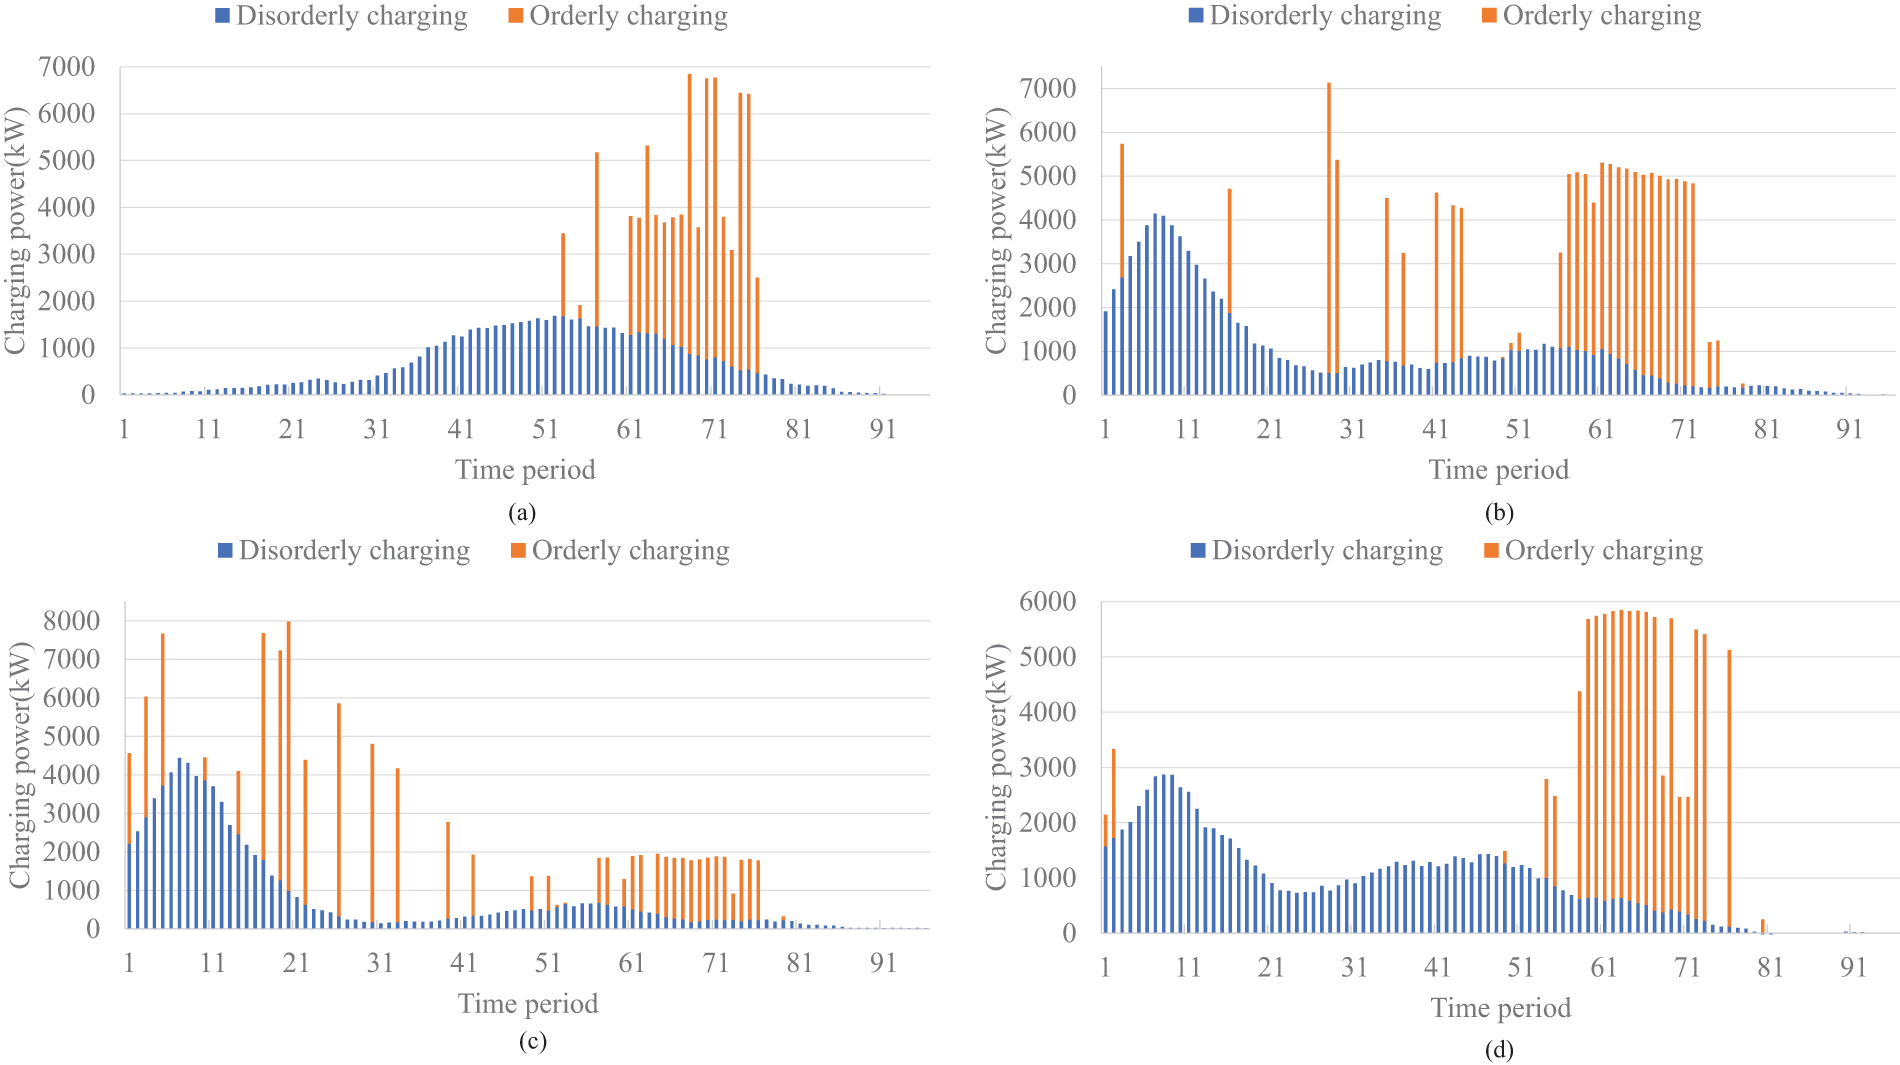
Figure 16: Disorderly and optimized load with 50% participation
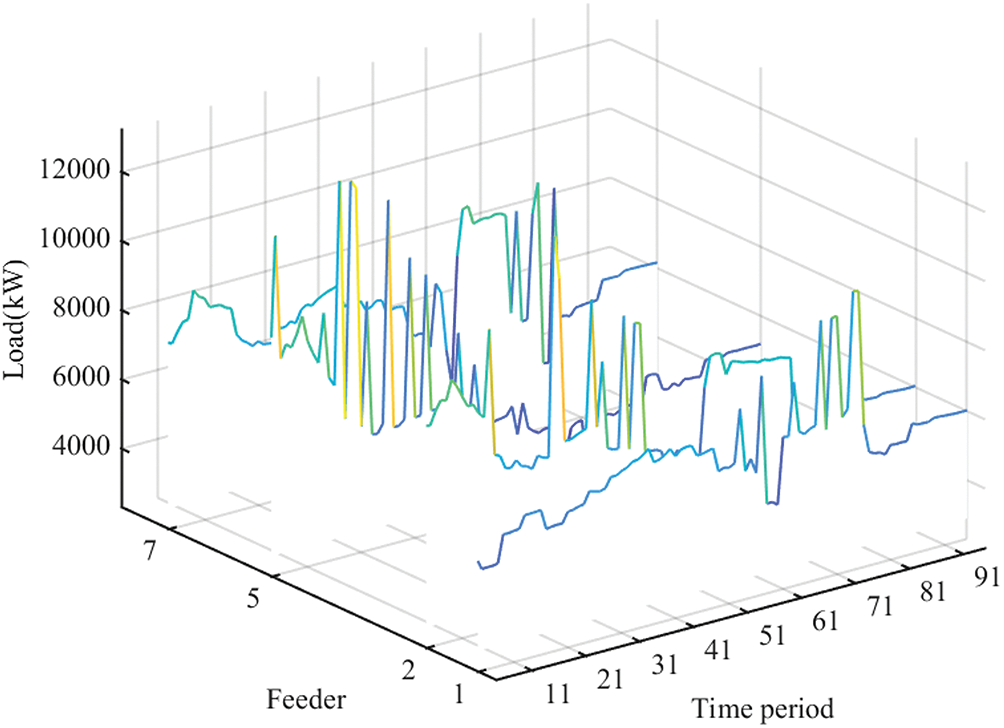
Figure 17: Feeders load with the objective for the region with 50% participation
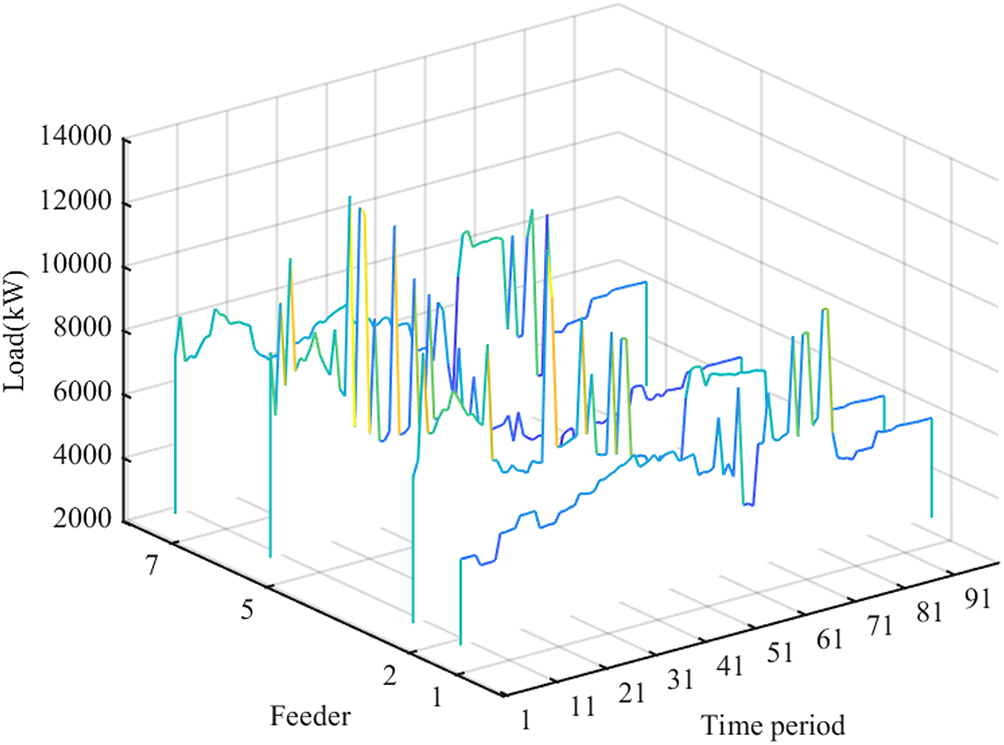
Figure 18: Feeders load with the objective for each feeder with 50% participation
With an 80% user participation rate, the load on each feeder is depicted in Fig. 19. It is evident that the economic dispatchable capability efficiently manages regionally optimized loads while meeting regulatory objectives and ensuring safety. The total charging cost of $704,599 reflects a commendable 5.5% reduction compared to the expenses associated with the physical dispatchable capability. Moreover, it is merely 2.8% higher than the economic outcome for a scenario with 100% participation, showcasing a well-balanced and cost-effective approach.
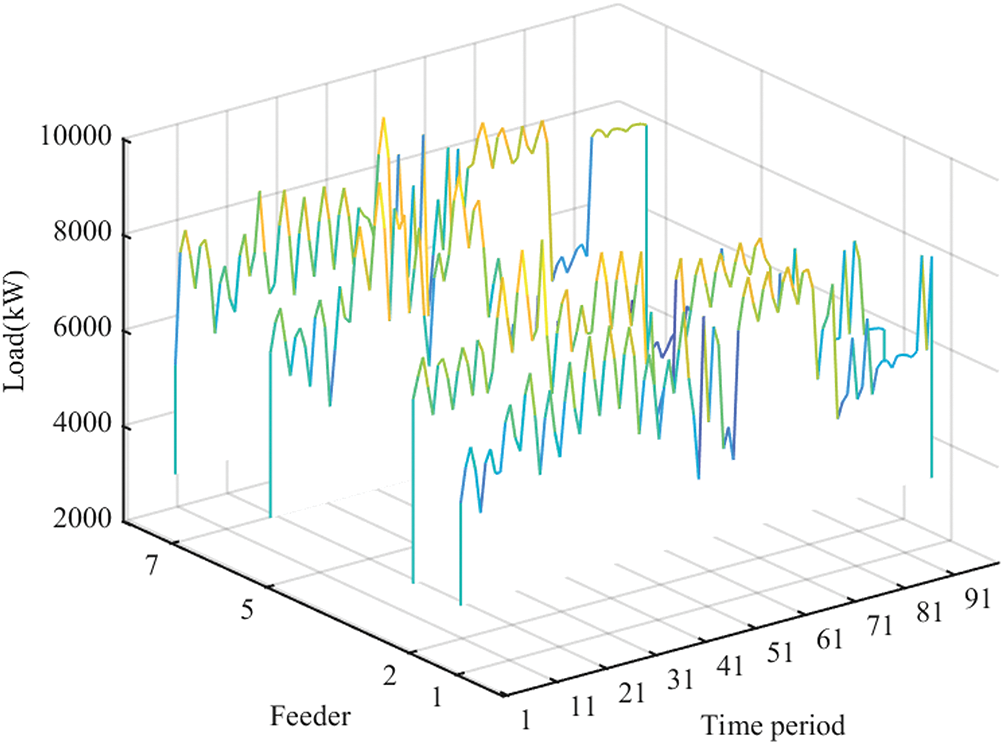
Figure 19: Feeders load with the objective for each feeder with 80% participation
The minimum α-value of charging stations, as detailed in Table 11, demonstrates meticulous consideration of various factors. Noteworthy is the fact that the α-values presented in Table 11 surpass those in Table 9, despite the lower associated charging costs. This variance can be attributed to a lesser number of vehicles involved in the regulation process in the current scenario, resulting in a smaller α-value compared to the previous scenario. However, if α, characterizing the aggregated EV charging model, is distributed among the individual participating vehicles, the individual α-value becomes greater than that observed in the previous scenario, underscoring the adaptability and efficiency of the system.

In summary, when the EV penetration is high, the requirements for users’ participation need to be higher to ensure feeder safety; if there are charging stations with low user participation rates, consideration needs to be given to selecting areas with low base load or expanding the feeder capacity when planning charging station construction.
This study introduces a comprehensive methodology for modeling and analyzing the dispatchable capability of aggregated EV charging in distribution systems. The approach combines individual EV charging behaviors into an aggregated model at the charging station level, estimating both physical and economic dispatchable capabilities. The research evaluates the impact of different baseload characteristics, EV penetration levels, and user participation willingness on the effectiveness of peak shaving and valley filling. The proposed model is validated using a practical distribution network system. The results indicate that: (1) Economic dispatchable capability is more effective when the base load exhibits residential characteristics compared to commercial characteristics, with a 50% penetration rate resulting in an 81.7% reduction in charging costs; (2) Using economic dispatchable capability not only reduces charging costs but also significantly lessens peak-to-valley load differentials compared to disorderly charging. It achieves a 9.7% cost reduction compared to physical dispatchable capability and a 9.3% reduction compared to disorderly charging; (3) With higher EV penetration, the economic dispatchable capability of aggregated loads increases, leading to improved charging economics. For instance, at 50% penetration, the average charging cost per vehicle is 40.3% lower than at 8% penetration, albeit with increased line safety hazards; (4) Higher user participation willingness enhances charging economy and aggregated load-shaving effectiveness.
After thoroughly analyzing the comprehensive data provided in the report on improving energy storage systems for electric cars, I have identified five suggestions for further research in this area: (1) Deeper study of user behavior patterns; (2) Optimization of charging station layout; (3) Development of intelligent charging algorithms; (4) Optimized scheduling for EV charging and renewable energy sources.
These future work directions aim to advance the integration of EVs with the power grid. The focus is on enhancing the grid’s capability to accommodate the growing adoption of EVs while ensuring reliability, efficiency, and sustainability.
Acknowledgement: Not applicable.
Funding Statement: State Grid Henan Power Company Science and Technology Project ‘Key Technology and Demonstration Application of Multi-Domain Electric Vehicle Aggregated Charging Load Dispatch’ (5217L0240003).
Author Contributions: The authors confirm their contributions to the paper as follows: study conception and design: Shiqian Wang, Binhua Tang, Jianshu Zhou, and Yue Xiang; collection and analysis of policies and data: Bo Liu, Yuanpeng Hua, and Qiuyan Li; draft manuscript preparation: Shiqian Wang, Bo Liu, and Binhua Tang. All authors reviewed the results and approved the final version of the manuscript.
Availability of Data and Materials: Data is available on request from the authors.
Ethics Approval: Not applicable.
Conflicts of Interest: The authors declare that they have no conflicts of interest to report regarding the present study.
References
1. J. Liu, Z. Wang, and L. Zhang, “Integrated vehicle-following control for four-wheel-independent-drive electric vehicles against non-ideal V2X communication,” IEEE Trans. Veh. Technol., vol. 71, no. 4, pp. 3648–3659, Apr. 2022. doi: 10.1109/TVT.2022.3141732. [Google Scholar] [CrossRef]
2. Z. Xi et al., “Hosting capability assessment and enhancement of electric vehicles in electricity distribution networks,” J. Clean. Prod., vol. 398, Apr. 2023, Art. no. 136638. doi: 10.1016/j.jclepro.2023.136638. [Google Scholar] [CrossRef]
3. Y. Xiang, Z. Jiang, C. Gu, F. Teng, X. Wei and Y. Wang, “Electric vehicle charging in smart grid: A spatial-temporal simulation method,” Energy, vol. 189, no. 5, Dec. 2019, Art. no. 116221. doi: 10.1016/j.energy.2019.116221. [Google Scholar] [CrossRef]
4. Y. Zhang, J. Li, W. Chen, and J. Shi, “The development trend of new energy electric vehicles in China,” in Int. Semin. Artif. Intell., Netw. Inf. Technol., AINIT, Nanjing, China, 2024, pp. 1913–1916. [Google Scholar]
5. M. Zand, M. Alizadeh, M. Azimi Nasab, M. Azimi Nasab, and S. Padmanaban, “Electric vehicle charger energy management by considering several sources and equalizing battery charging,” Renew. Energ. Focus., vol. 50, no. 10, Sep. 2024, Art. no. 100592. doi: 10.1016/j.ref.2024.100592. [Google Scholar] [CrossRef]
6. J. Ma and Q. He, “Studying the placement of EV charging stations in parking facilities in cities,” in IECON Proc., Singapore, 2023, pp. 1–6. [Google Scholar]
7. R. Deng et al., “Exploring flexibility of electric vehicle aggregators as energy reserve,” Electr. Pow. Syst. Res., vol. 184, no. 3, Jul. 2020, Art. no. 106305. doi: 10.1016/j.epsr.2020.106305. [Google Scholar] [CrossRef]
8. W. Liu, Y. Liu, and L. Wu, “Model predictive control based voltage regulation strategy using wind farm as black-start source,” IEEE Trans. Sustain. Energ., vol. 14, no. 2, pp. 1122–1134, Apr. 2023. doi: 10.1109/TSTE.2023.3238523. [Google Scholar] [CrossRef]
9. D. Liu, L. Wang, W. Wang, H. Li, M. Liu and X. Xu, “Strategy of large-scale electric vehicles absorbing renewable energy abandoned electricity based on master-slave game,” IEEE Access, vol. 9, pp. 92473–92482, 2021. doi: 10.1109/ACCESS.2021.3091725. [Google Scholar] [CrossRef]
10. B. Zeng, H. Li, C. Mao, and Y. Wu, “Modeling, prediction and analysis of new energy vehicle sales in China using a variable-structure grey model,” Expert Syst. Appl., vol. 213, no. 5, Mar. 2023, Art. no. 118879. doi: 10.1016/j.eswa.2022.118879. [Google Scholar] [CrossRef]
11. J. Li, R. Li, S. Wang, Y. Xiang, and Y. Gu, “Regional nonintrusive electric vehicle monitoring based on graph signal processing,” IET Gener. Transm. Dis., vol. 14, no. 26, pp. 6512–6517, Feb. 2021. doi: 10.1049/iet-gtd.2020.0845. [Google Scholar] [CrossRef]
12. Y. Wang, Y. Xiang, H. Hu, K. Lao, J. Tong and Y. Jiang, “Service-quality based pricing approach for charging electric vehicles in smart energy communities,” J. Clean. Prod., vol. 420, no. 1, 2023. doi: 10.1016/j.jclepro.2023.138416. [Google Scholar] [CrossRef]
13. H. Yu, J. Liu, X. Mou, C. Wu, Y. Lin and Z. Yang, “Orderly charging control method for charging stations based on dynamic service pricing,” (in Chinese), Power Syst. Big Data, vol. 26, no. 2, pp. 1–9, Feb. 2023. doi: 10.19317/j.cnki.1008-083x.2023.02.001. [Google Scholar] [CrossRef]
14. K. Chaudhari, N. K. Kandasamy, A. Krishnan, A. Ukil, and H. B. Gooi, “Agent-based aggregated behavior modeling for electric vehicle charging load,” IEEE Trans. Ind. Infor., vol. 15, no. 2, pp. 856–868, Feb. 2019. doi: 10.1109/TII.2018.2823321. [Google Scholar] [CrossRef]
15. X. Diao et al., “Research on electric vehicle charging safety warning based on A-LSTM algorithm,” IEEE Access, vol. 11, pp. 55081–55093, 2023. doi: 10.1109/ACCESS.2023.3281552. [Google Scholar] [CrossRef]
16. A. K. M. Yousuf, Z. Wang, R. Paranjape, and Y. Tang, “An in-depth exploration of electric vehicle charging station infrastructure: A comprehensive review of challenges, mitigation approaches, and optimization strategies,” IEEE Access, vol. 12, pp. 51570–51589, 2024. doi: 10.1109/ACCESS.2024.3385731. [Google Scholar] [CrossRef]
17. T. Offergeld, C. M. Vertgewall, M. Trageser, N. Mattus, and A. Ulbig, “Dependability of aggregated flexibility potential of e-mobility charging,” in CIRED Workshop, Porto, Portugal, 2022, pp. 1054–1058. [Google Scholar]
18. N. Li, Y. Wen, P. Du, N. Yang, and Z. Hu, “Coordinated interaction strategy between distribution network and aggregators of photo-voltaic, energy storage and electric vehicles,” (in Chinese), Smart Power, vol. 51, no. 12, pp. 38–44, 2023. [Google Scholar]
19. Y. Kong, S. Yang, M. Duan, Z. Ding, and K. Fang, “Optimal decision-making for electric vehicle aggregator based on a hybrid action reinforcement learning algorithm,” (in Chinese), Comput. Eng., vol. 50, no. 10, pp. 418–428, 2024. doi: 10.19678/j.issn.1000-3428.0068701. [Google Scholar] [CrossRef]
20. J. Yu et al., “Distributed demand response charging control of multiple plug-in electric vehicle clusters,” IET Smart Grid, vol. 6, no. 6, pp. 609–621, Aug. 2023. doi: 10.1049/stg2.12124. [Google Scholar] [CrossRef]
21. B. Wang, D. Zhao, P. Dehghanian, Y. Tian, and T. Hong, “Aggregated electric vehicle load modeling in large-scale electric power systems,” IEEE T. Ind. Appl., vol. 56, no. 5, pp. 5796–5810, Sep.–Oct. 2020. doi: 10.1109/TIA.2020.2988019. [Google Scholar] [CrossRef]
22. L. Pan, W. Zhuang, Q. Zhao, and J. Tian, “Evaluation of adjustable potential of urban electric vehicle centralized charging load based on MF-LSTM,” (in Chinese), Elect. Drive, vol. 53, no. 8, pp. 59–69, 2023. doi: 10.19457/j.1001-2095.dqcd24400. [Google Scholar] [CrossRef]
23. X. Zhu et al., “Calculation method of EV cluster’s schedulable potential capacity considering uncertainties and bounded rational energy consumption behaviors,” (in Chinese), Elect. Power Autom. Equipment, vol. 42, no. 10, pp. 245–254, Oct. 2022. doi: 10.16081/j.epae.202209010. [Google Scholar] [CrossRef]
24. X. Liu, G. Chen, N. Wu, J. Xiao, X. Wu and X. Li, “Day-ahead optimal scheduling considering the flexibility of EV charging and discharging mode,” (in Chinese), Distrib. Energy, vol. 8, no. 4, pp. 46–54, Aug. 2023. [Google Scholar]
25. L. Han, S. Chen, S. Wang, and Y. Cheng, “Scheduling strategy considering wind and photovoltaic power consumption and the flexibility of electric vehicles,” (in Chinese), Trans. China Electrotech. Soc., pp. 1–11, 2024. doi: 10.19595/j.cnki.1000-6753.tces.231603. [Google Scholar] [CrossRef]
26. H. Chen, Z. Guo, Y. Xin, Y. Zhao, and Y. Jia, “Coordination of PEV charging across multiple stations in distribution networks using aggregate PEV charging load model,” in Int. Smart Cities Conf., ISC2, Wuxi, China, 2017, pp. 1–5. [Google Scholar]
27. X. Zhan, J. Yang, S. Han, T. Zhou, and F. Wu, “Two-stage market bidding strategy of charging station considering schedulable potential capacity of electric vehicle,” Autom. Elect. Power Syst., vol. 45, no. 10, pp. 86–96, May 2021. doi: 10.7500/AEPS2020041400. [Google Scholar] [CrossRef]
Cite This Article
 Copyright © 2025 The Author(s). Published by Tech Science Press.
This work is licensed under a Creative Commons Attribution 4.0 International License , which permits unrestricted use, distribution, and reproduction in any medium, provided the original work is properly cited.


 Submit a Paper
 Propose a Special lssue
 View Full Text
 Download PDF
 Downloads
 Citation Tools