
 Submit a Paper
 Propose a Special lssue
 Open Access
ARTICLE

Forestvoltaics, Floatovoltaics and Building Applied Photovoltaics (BAPV) Potential for a University Campus
1 Faculty of Electrical and Electronics Engineering Technology, Universiti Malaysia Pahang Al-Sultan Abdullah, Pekan, 26600, Malaysia
2 Centre for Research in Advanced Fluid and Processes, Universiti Malaysia Pahang Al-Sultan Abdullah, Gambang, 26300, Malaysia
3 Faculty of Mechanical and Automotive Engineering Technology, Universiti Malaysia Pahang Al-Sultan Abdullah, Pekan, 26600, Malaysia
4 Centre for Automotive Engineering, Universiti Malaysia Pahang Al-Sultan Abdullah, Pekan, 26600, Malaysia
5 Energy Centre, Maulana Azad National Institute of Technology, Bhopal, 462003, India
* Corresponding Author: Kumarasamy Sudhakar. Email:
Energy Engineering 2024, 121(9), 2331-2361. https://doi.org/10.32604/ee.2024.051576
Received 09 March 2024; Accepted 27 May 2024; Issue published 19 August 2024
 View Full Text
 Download PDF
Abstract
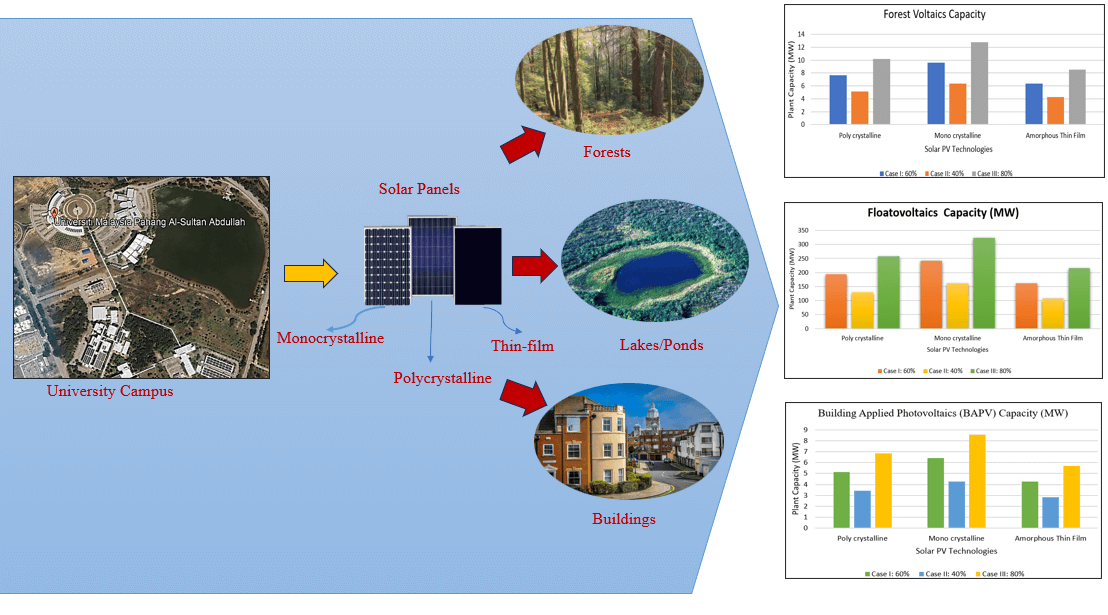
The United Nations’ Sustainable Development Goals (SDGs) highlight the importance of affordable and clean energy sources. Solar energy is a perfect example, being both renewable and abundant. Its popularity shows no signs of slowing down, with solar photovoltaic (PV) panels being the primary technology for converting sunlight into electricity. Advancements are continuously being made to ensure cost-effectiveness, high-performing cells, extended lifespans, and minimal maintenance requirements. This study focuses on identifying suitable locations for implementing solar PV systems at the University Malaysia Pahang Al Sultan Abdullah (UMPSA), Pekan campus including buildings, water bodies, and forest areas. A combined technical and economic analysis is conducted using Helioscope for simulations and the Photovoltaic Geographic Information System (PVGIS) for economic considerations. Helioscope simulation examine case studies for PV installations in forested areas, lakes, and buildings. This approach provides comprehensive estimations of solar photovoltaic potential, annual cost savings, electricity costs, and greenhouse gas emission reductions. Based on land coverage percentages, Floatovoltaics have a large solar PV capacity of 32.3 Megawatts (MW); forest-based photovoltaics (Forestvoltaics) achieve maximum yearly savings of RM 37,268,550; and Building Applied Photovoltaics (BAPV) have the lowest CO emissions and net carbon dioxide reduction compared to other plant sizes. It also clarifies the purpose of using both software tools to achieve a comprehensive understanding of both technical and economic aspects.Graphic Abstract
Keywords
A nation’s economic growth is directly impacted by the energy sector. Presently, fossil fuels account for 85%–90% of the world’s primary energy generation. Fossil fuel reserves, coupled with the continuous increase in the cost and rapid utilization of these fuels for power generation, are significant factors contributing to the global economic crisis. Today, the world is focused on the effective use of renewable energy resources, including solar, wind, thermal, and hydro, to solve the problem of the declining economy and the difficulties associated with the energy sector. Moreover, in various regions worldwide, agricultural activities, water resources, and infrastructure face obstacles due to insufficient cropland, freshwater, fossil energy (used for fertilizers and irrigation), and biological resources. The decline in the availability of fossil fuels has been particularly notable, with this trend intensifying post-2000 [1].
The one industry that is affected in terms of the energy crisis is agriculture. The primary source of food for humans is agriculture, but it requires a steady supply of energy to run its equipment, trucks, irrigation pumps, and other devices, all of which are powered by fossil fuel. The fact that solar energy is available practically everywhere on the planet’s land surface is pollution-free, and is cost-effective makes it the ideal renewable energy source. The simplest technology to harness solar energy is through solar photovoltaic route. The solar PV module consists of silicon cells linked up in series based on the photoelectric effect. A solar photovoltaic (PV) module is made up of silicon cells linked together in a series, which uses sunlight to create electricity.
There is a lot of focus on net zero initiatives and sustainable campuses [2] to reduce the carbon footprint and address climate change. Implementing renewable energy sources like solar power aligns with the university’s commitment to reducing its carbon footprint and promoting sustainability. Various solar PV installations on campus create educational opportunities for students, staff, and the community to learn about renewable energy technologies and their benefits. It can serve as a living laboratory for studying renewable energy systems and enhancing academic programs related to sustainability and engineering. The concept of forestvoltaics is unique since it involves the absorption of carbon dioxide and also generates energy. Forestvoltaics, floatovoltaics, and building-applied photovoltaics (BAPV) systems utilize underutilized spaces and existing infrastructure to minimize land use impact and generate clean energy. By utilizing multiple types of solar PV installations, the university can diversify its energy portfolio, potentially reducing overall energy costs in the long term. Building-applied photovoltaic systems can also provide additional benefits, such as shading and reducing university campus cooling costs. In this regard, research on forestvoltaics, floatovoltaics, and BAPV can provide a path to achieving net-zero campus targets. Most recent advances include the use of silicon nanowires in silicon-based technology [3] increases its application for renewable energy harvesting. Today, solar PV is also used for the generation of hydrogen as a fuel because of its high energy density per mass (120 MJ/kg) [4] and also as clean energy.
The concept of a solar panel on the canopy or solar tree is a new concept with more eco-system services. Um studied the potential of forest photovoltaic utilizing the solar tree as part of a simulation [5]. Janapati et al. showed that solar trees produce more electricity than ground-mounted PV systems while maintaining plant capacity and increasing the number of panels [6]. Hyder et al. studied the commercial designs of solar trees and their challenges [7]. Rocha et al. [8] studied the economic viability of a solar PV project at a forest nursery. The projected net present value was 79.2% greater than the standard net present value, capturing the benefit of flexibility for managers.
Goswami et al. carried out a techno-economic analysis of a floating solar photovoltaic power plant. The floating solar photovoltaics (FSPV) plant will save the United States Dollar (USD) 352,125 in land costs and USD 47,600 in water costs. This reduces the FSPV plant’s levelized rate to 0.026 USD/kWh, 39% cheaper than a land-based PV power plant [9]. Sharma et al. studied the design parameters of a 10 kW floating solar power plant [10].
Zomer et al. studied that the annual energy yield of BAPV is 7% higher than Building Integrated Photovoltaic (BIPV) [11]. Minelli et al. studied the integration of photovoltaic shading devices on building applied photovoltaic [12]. Zhang et al. studied the various geometrical configurations and analyzed the reliability and feasibility of a BAPV potential [13]. Reddy et al. studied the status of work in the BAPV system in India whereas the BIPV window system is arguably the best BIPV solution for the Indian setting in terms of reducing the Building’s Heating Ventilation Air Conditioning (HVAC) load [14].
In this context, it is anticipated that solar photovoltaic (PV) and wind technologies will propel the renewable energy market to surpass fossil fuel sources by the middle of the 2020s and supply more than half of the world’s electricity needs by 2050 [15]. Compared to the global total of 15 GW barely a decade ago, the annual solar PV sector has shown sustained growth in recent years, topping 100 GW (including on/off-grid capacity) and reaching a total capacity of 505 GW. However, the poor energy efficiency of PV modules (about 14%), which results in a conversion of 66.7 Wp/m2 of land, lowers investment incentives and causes a decrease in the deployment pace. Therefore, the development of floating photovoltaic (FPV) technology may mark a turning point in PV technology adoption, bypassing problems related to land occupancy. FPVs have acquired a lot of popularity in recent years due to their enormous potential for installation on bodies of water as well as other perks, including improved efficiency compared to PV systems. Energy conservation and energy-efficient technology continue to have challenges. Thus, the building is becoming more and more interested in using innovative and renewable energy sources, especially in producing electricity. Building energy consumption accounts for 25% to 40% of the total energy consumption. Along with transportation and industry as the three major energy-consuming households, building energy efficiency plays an important role in national energy conservation.
There is a growing trend towards developing and using renewable energy sources like solar, wind, and hydropower. Solar energy, in particular, has seen a steady increase in global installations and demand over the past two decades. However, large-scale solar farms on land can occupy significant areas, potentially impacting biodiversity. Additionally, geographical factors like sunlight intensity can affect solar energy utilization. Despite these challenges, advancements in technology are opening doors for alternative solar applications beyond traditional land-based installations.
This paper primarily focuses on (i) Analyzing the solar PV potential in forests, lakes, and buildings at the UMPSA Pekan campus. (ii) Conducting an economic analysis based on payback period and annual savings. (iii) Performing an environmental analysis in terms of annual carbon dioxide (CO2) generation and net CO2 reduction from solar PV installations. These data are calculated based on the simulation results of PV GIS and a Helioscope.
1. To analyze the solar PV potential on the rooftops of UMPSA Pekan buildings, including energy generation, annual savings, carbon dioxide emissions, and net CO2 emission reductions.
2. To evaluate the solar PV potential on the surface of water bodies (lakes) inside UMPSA Pekan, energy generation, annual savings, carbon dioxide emissions, and net CO2 emission reductions to generate electricity.
3. To study the solar PV potential in the forest zones within UMPSA Pekan, including the energy generation, annual savings, carbon dioxide emissions, and net CO2 emission reductions.
The primary scope of this study is to compare and calculate the potential installation of solar PV systems in forest zones, lakes, and buildings through an extensive literature review. Based on the collected data, the study will evaluate the advantages and disadvantages of various solar technologies from technical, economic, and environmental perspectives. The case study focuses on specific areas at the University Malaysia Pahang Al Sultan Abdullah (UMPSA) Pekan campus, including its forests, Tasik Lake, and the Canseleri Tun Abdul Razak building. Additionally, the study assesses solar technologies for different scenarios of area utilization (40%, 60%, and 80%). These evaluations will consider improvements based on current trends in PV technology growth.
2 Basic Descriptions of Forestvoltaics, Floatovoltaics and Building Applied Photovoltaics
Forest photovoltaic system as shown in Fig. 1 is a synergy between carbon sequestration and renewable energy production [16]. Installation of PV systems over land faces significant challenges like deforestation, soil erosion, and loss of biodiversity [17]. The forest has large expanses of underutilized land beneath the canopy that can be utilized to deploy the PV system [18]. Also, resizing the canopy branches can provide space for the installation of solar PV modules. They provide ecosystem services beyond electricity generation. The presence of PV panels can help regulate microclimate, reduce soil erosion, and enhance biodiversity by creating new habitats for certain species. Integrating PV into forest management methods can help improve sustainability by diversifying revenue streams and lowering reliance on logging and other extractive activities. This can help prevent forests from deforestation and degradation while also supporting renewable energy ambitions. These challenges generated a new concept for the installation of renewable energy systems on forested land. This also allows more direct solar irradiation; albedo loss will be less.
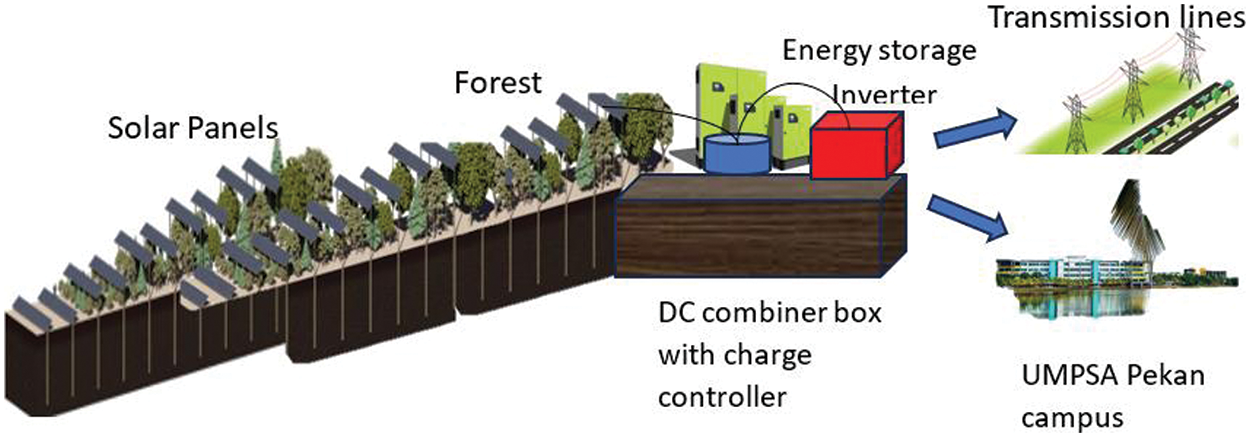
Figure 1: Forest-photovoltaics concept applied to UMPSA
The basic components of a Forestvoltaic system include:
1. Solar Panels: Solar panels, also known as photovoltaic (PV) panels, are devices designed to capture sunlight and convert it into electricity through a process called the photovoltaic effect [19–21]. These panels consist of multiple solar cells made from semiconductor materials, typically silicon. When exposed to sunlight, these cells generate an electric current by harnessing the energy from photons, which are particles of light.
2. Forests and Vegetation Area: It is a densely wooded area characterized by a community of trees and other vegetation, often supporting a diverse ecosystem of flora and fauna [20]. Forests play a crucial role in maintaining ecological balance, providing habitat for various species, contributing to biodiversity, and serving as a source of resources such as timber, oxygen production, and carbon sequestration. Forests can vary in type, including tropical rainforests, temperate forests, and boreal forests, each with distinct characteristics based on climate, flora, and fauna [21].
3. DC Combiner Box: This is a junction box that consolidates the direct current (DC) outputs from multiple solar panels [22]. Its primary purpose is to combine the electrical outputs of individual solar panels into a single DC output. The combiner box typically includes fuses or circuit breakers for each panel to protect against overcurrent or short circuits.
4. Charge Controller: A charge controller is a device that regulates the voltage and current coming from solar panels to the batteries in a solar power system [23]. It ensures that the batteries receive the optimal charge without overcharging, which can damage the batteries.
5. Inverter Box: An inverter is an electronic device that converts direct current (DC) electricity into alternating current (AC) electricity. This conversion is essential because many electrical devices and appliances used in homes and businesses operate on AC power [24].
6. Energy Storage: Energy storage refers to the process of capturing and storing energy for later use. It plays a crucial role in modern energy systems, providing a means to store surplus energy generated during periods of low demand and releasing it when demand is high or during periods when renewable energy sources, like solar or wind, are not actively generating power.
A floating solar system, also known as a floating solar farm or floating photovoltaic (FPV) system, is a type of solar power installation where solar panels are mounted on floating structures on bodies of water, such as lakes, reservoirs, ponds, or even the open sea [26]. This innovative approach to solar energy generation as shown in Fig. 2 offers several advantages and has gained attention as a sustainable and efficient solution. Here are the key features of floating solar systems:
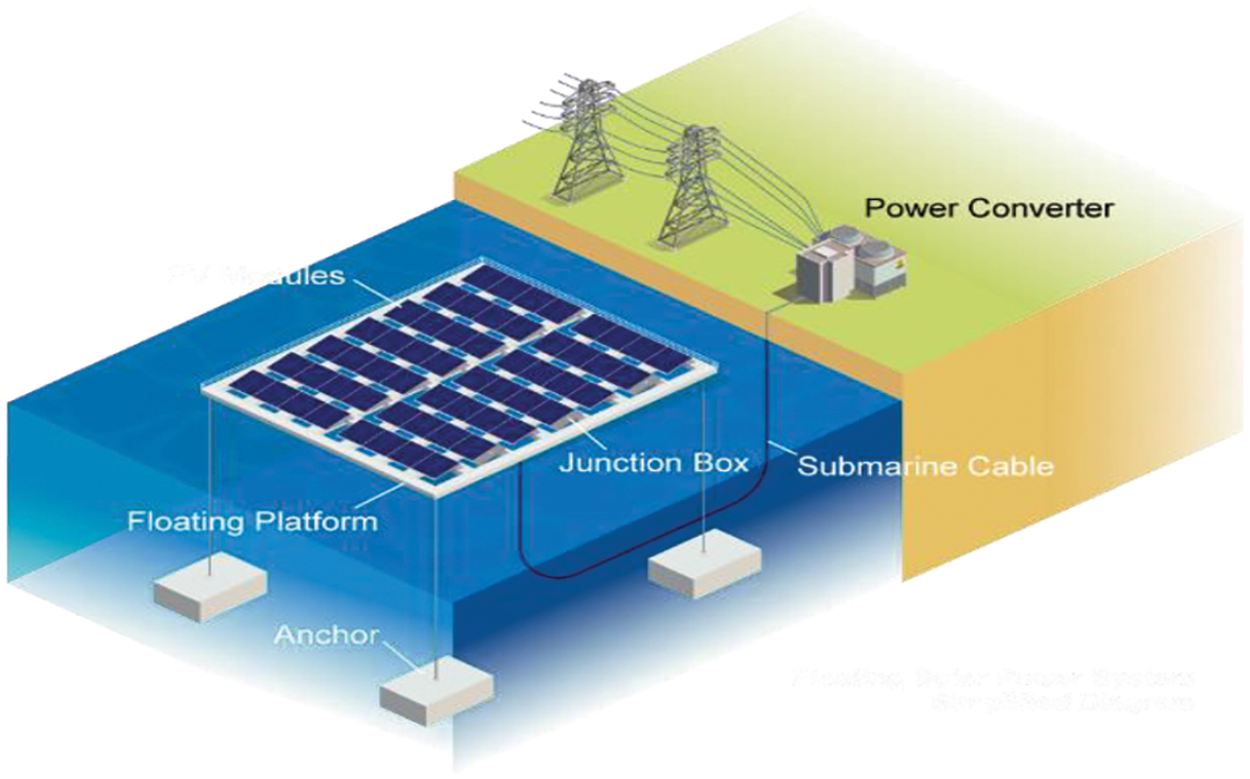
Figure 2: Schematic diagram of a floating solar PV plant [25]
1. Floating Platforms: The solar panels in a floating system are typically mounted on buoyant structures that keep them afloat on the water surface [27]. These platforms can be anchored to the bottom of the water body, tethered in place, or allowed to drift within a designated area.
2. Modules: Floating solar systems use conventional solar panels mounted on the floating platforms. The panels can be either monocrystalline or polycrystalline, depending on the specific project requirements [28].
3. Anchors: They play a crucial role in securing the floating solar platforms in place. Since these systems are installed on water bodies, it is essential to anchor them to prevent drifting and ensure stability. Anchors are typically attached to the floating structures and are secured to the bottom of the water body [29]. The anchors provide stability against the forces of wind, waves, and other environmental factors.
4. Junction Box: The junction box in a floating PV system serves as a connection point for the individual solar panels [30]. It is usually located on the floating platform and is responsible for interconnecting the electrical wiring from multiple solar panels.
5. Submarine Cable: The submarine cable is an essential component for transporting the electricity generated by the solar panels to the onshore or offshore electrical grid [31].
6. Power Converter: In a floating solar PV (photovoltaic) system, power converters play a crucial role in transforming and managing the electrical energy generated by the solar panels [32].
2.3 Building Applied Photovoltaics (BAPV)
A Building Applied Photovoltaics (BAPV) system as shown in Fig. 3 refers to the installation of solar photovoltaic (PV) panels on the walls and roofs of a building by mounting structures and moving rails. Instead of being added on as an afterthought, the solar panels are designed to be an integral part of the building’s architecture. This integration serves both functional and aesthetic purposes, providing the dual benefit of generating renewable energy while seamlessly blending with the building’s design.
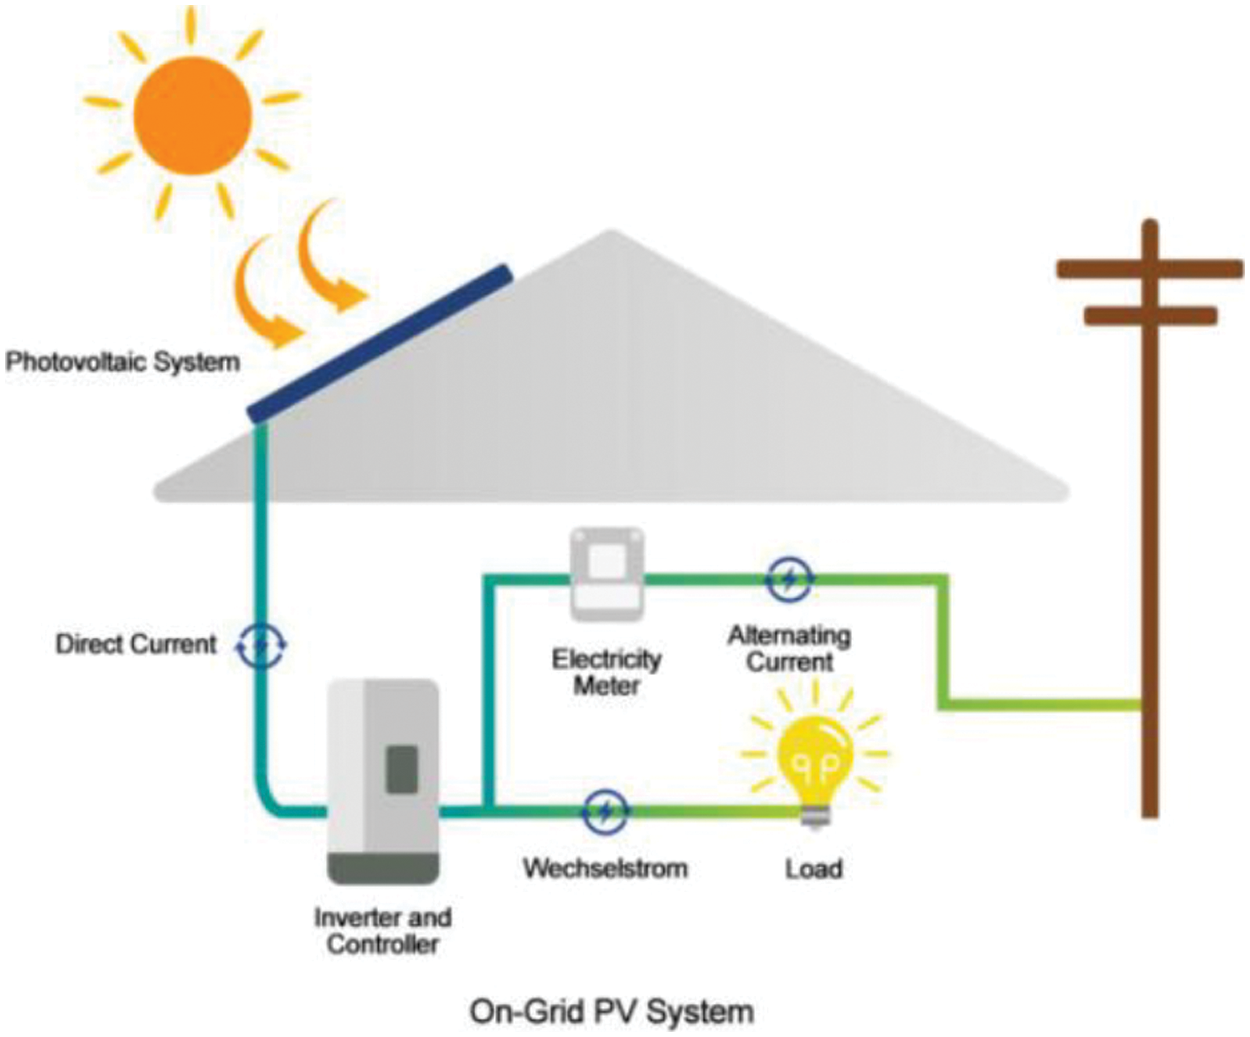
Figure 3: Layout of a BAPV system [33]
1. Solar Panel: BAPV systems involve the incorporation of solar modules directly into various building elements, such as polycrystalline, monocrystalline, and amorphous thin-film solar panels.
2. Roofing Materials: Solar panels can be integrated into roofing materials, replacing or complementing traditional roofing elements. Solar roof tiles or solar shingles are examples.
3. Facades: Solar panels can be integrated into the building’s exterior walls, serving as a part of the facade. This integration can be achieved through solar cladding or solar curtain walls [34].
4. Windows: Transparent solar cells can be embedded into windows, turning them into solar generators without obstructing the view.
5. Inverter: In a BAPV system, the inverter plays a crucial role in converting the direct current (DC) electricity generated by the solar panels into usable alternating current (AC) electricity for use in the building or for feeding back into the electrical grid. Here are the key functions of the inverter in a BAPV system. The inverter does the functions of DC-AC conversions, voltage regulation, synchronization with the grid, and monitoring and communication.
6. Solar Charge Controller: In renewable energy systems, particularly solar power systems, a solar charge controller regulates the charging and discharging of batteries. It ensures that the batteries are charged at the optimal voltage and current from the solar panels and prevents overcharging or deep discharge, thus extending the battery life.
7. Electricity Meter: An electricity meter, also known as an electric meter or energy meter, is a device used to measure and record the amount of electrical energy consumed by a residence, business, or industrial facility. It plays a crucial role in utility billing, helping to determine the amount of electricity used for billing purposes [35].
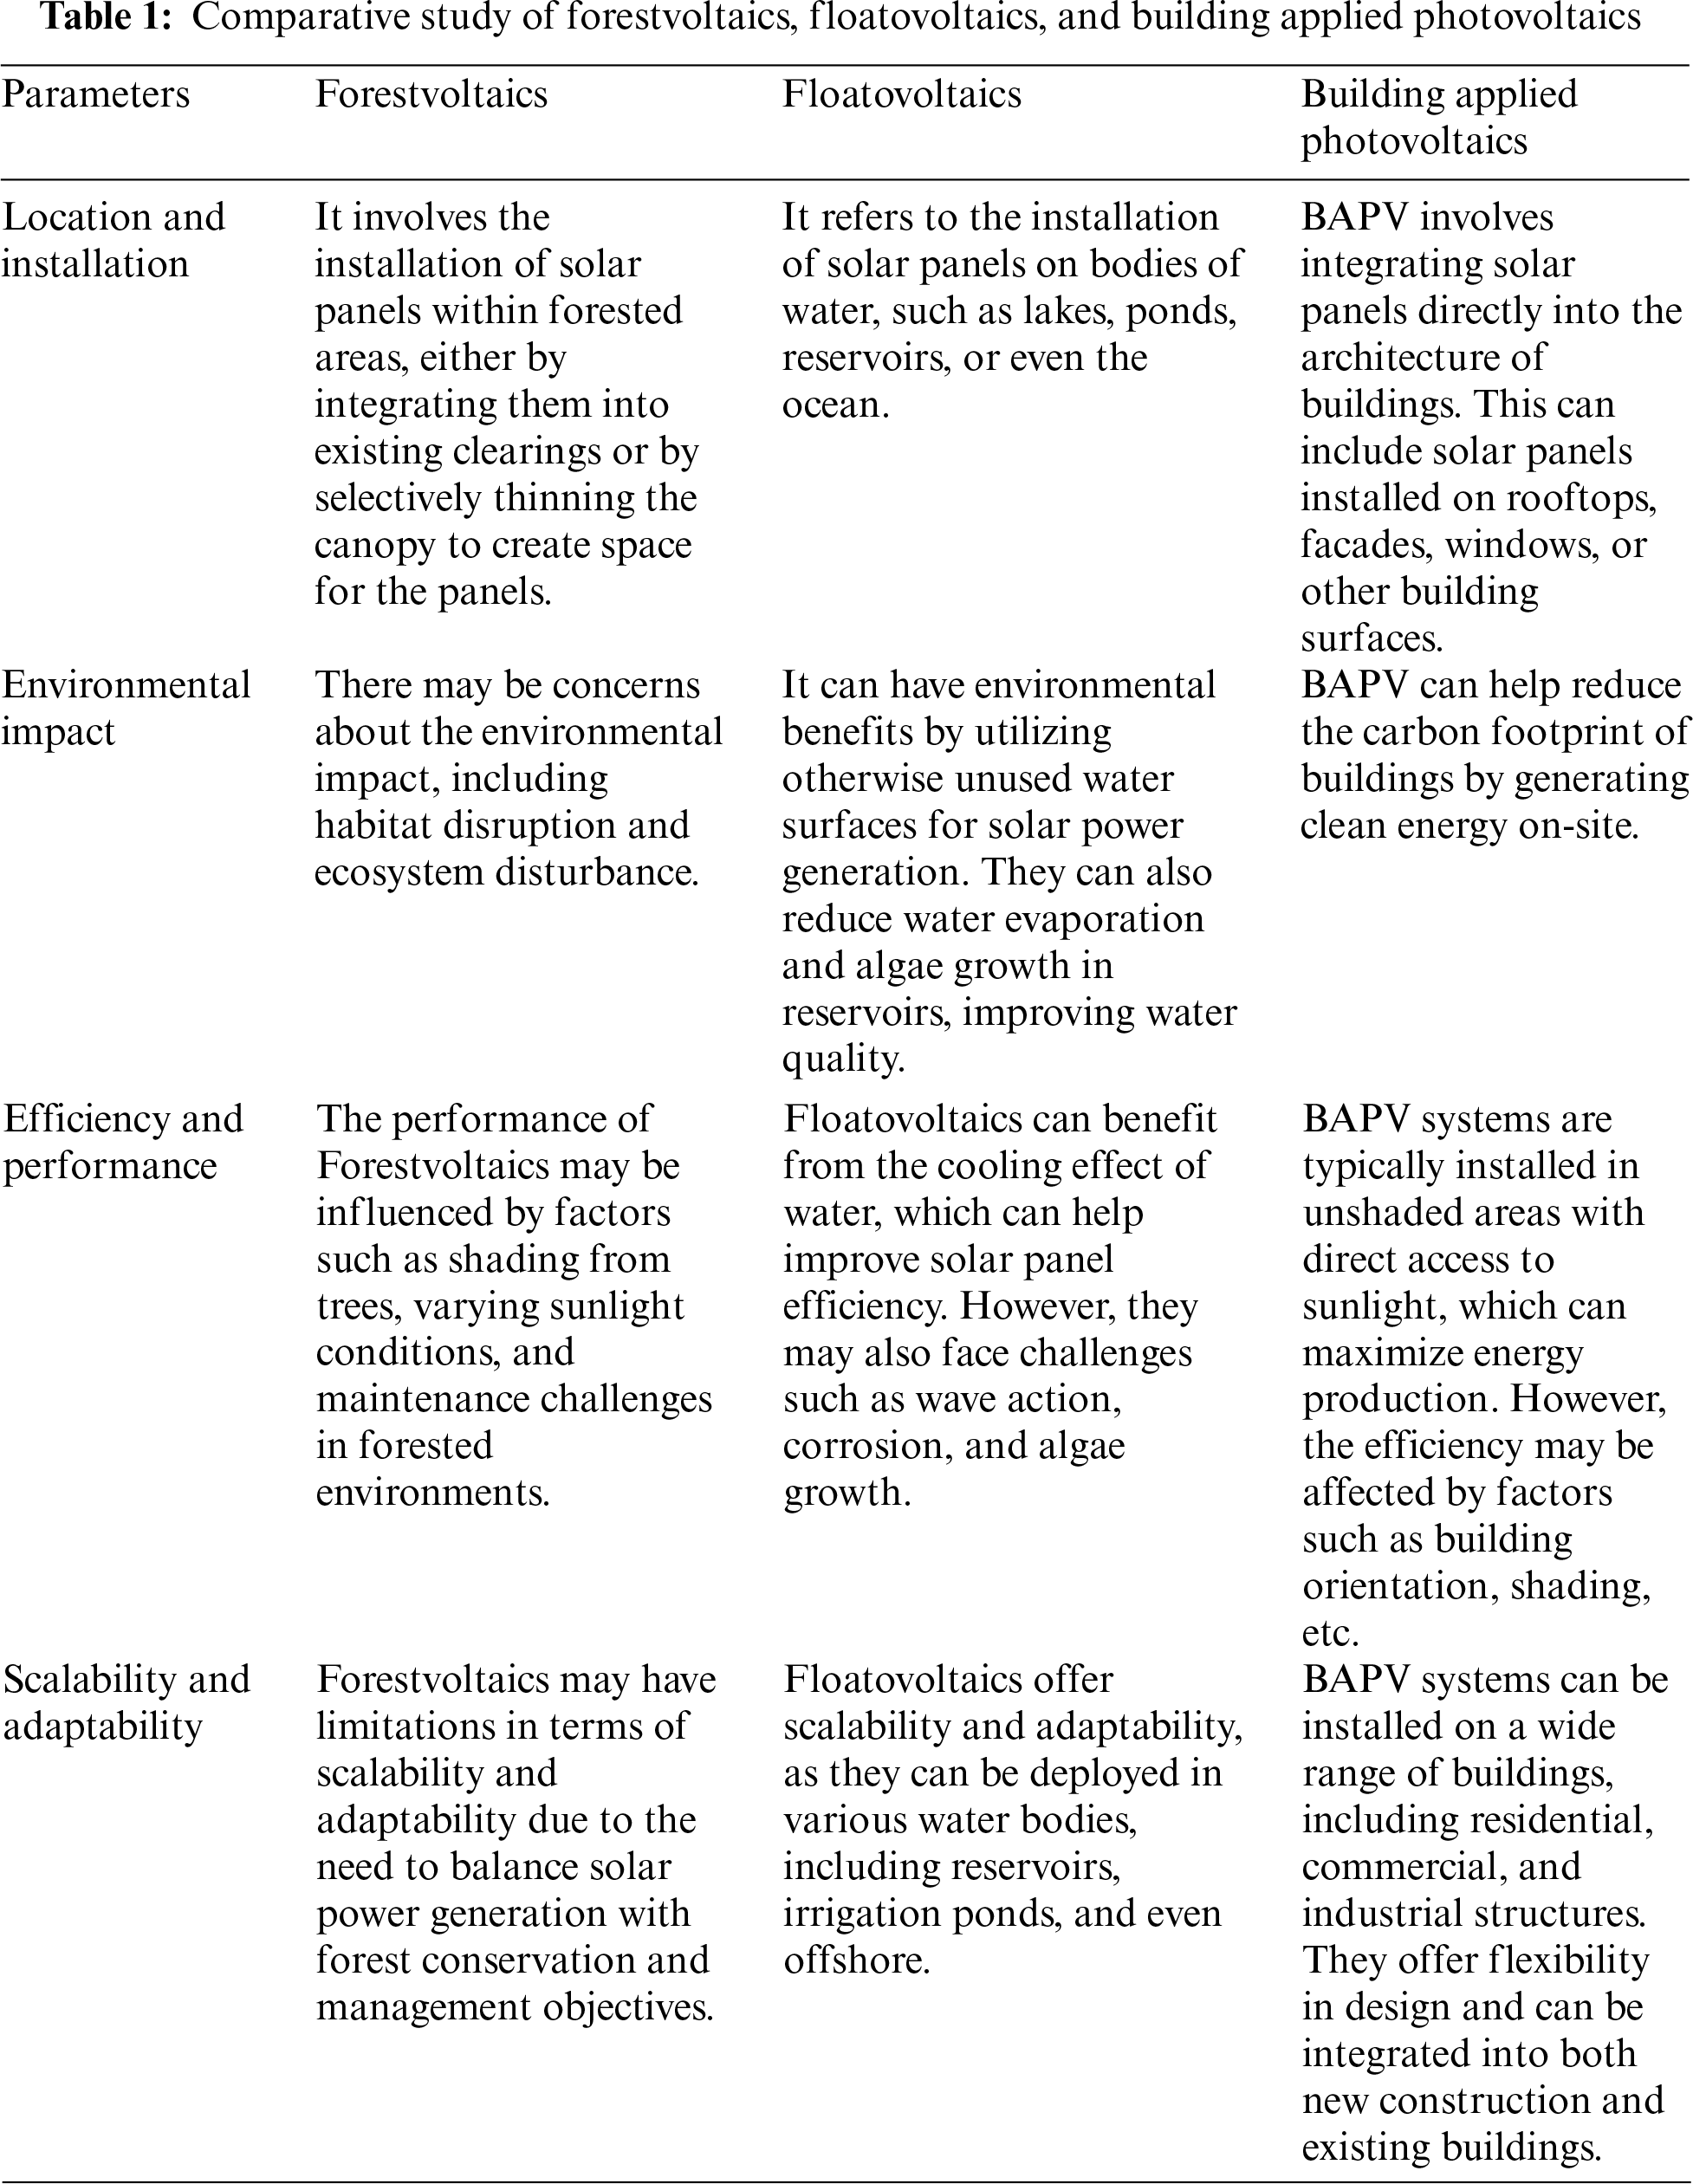
2.4 Comparison of Forestvoltaics, Floatovoltaics, and Building Applied Photovoltaics
Forestvoltaics, Floatovoltaics, and BAPV represent innovative approaches to harnessing solar energy in diverse environments. Each method offers unique advantages and challenges, catering to specific geographical, infrastructural, and environmental conditions. Table 1 discusses the differences in innovative technology as per location, environmental impact, efficiency, and scalability.
The University Malaysia Pahang Al Sultan Abdullah (UMPSA) Pekan campus is chosen as the case study site. Following the methodology outlined in Fig. 4, we calculate the potential base areas for Forestvoltaics, Floatovoltaics, and BAPV installations within the UMPSA Pekan campus. Based on these three potential applications (Forestvoltaics, Floatovoltaics, and BAPV), we estimate the solar power generation capacity for various scenarios. To validate and compare the results, we utilize two software tools: PV GIS and Helioscope.
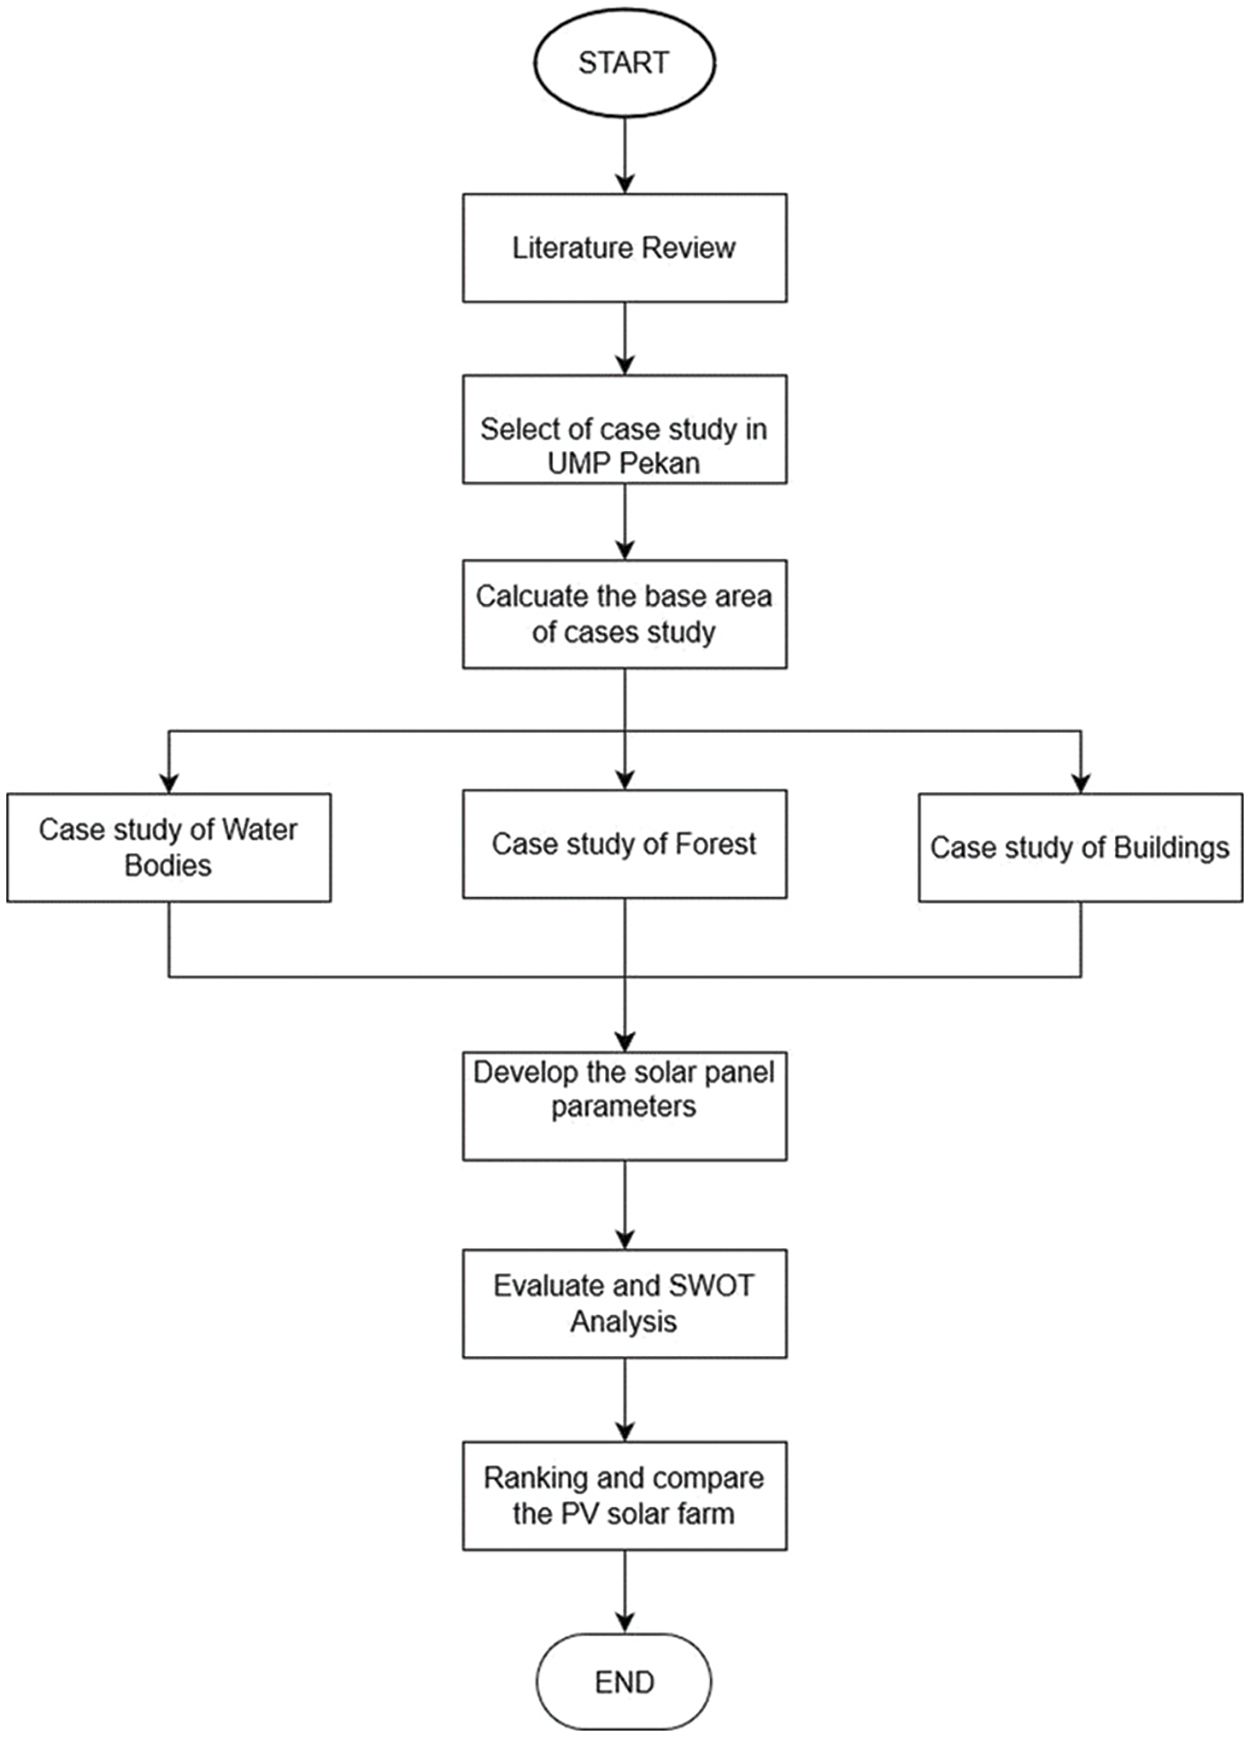
Figure 4: Methodology flowchart for solar potential assessment in forests, buildings, and water bodies
Universiti Malaysia Pahang Al-Sultan Abdullah (UMPSA) is located in the east coast state of Pahang, which is the biggest among other states in Peninsular Malaysia. UMPSA has its base campus located in the Pekan and another campus in the Gambang. However, in this case study, the Pekan campus was chosen because of the variety of places that have buildings, agriculture, and water bodies. The rural campus of UMP is known as the Pekan campus. With 2000 staff members, 15,000 students (5000 in Gambang and 10,000 in Pekan), 18 departments or units, and ten faculties, Universiti Malaysia Pahang Al-Sultan Abdullah (UMPSA) is a QS-ranked educational institution that contributes to the engineering, technology, and creativity fields. The campuses are made up of dependable infrastructure and facilities. Apart from this, UMPSA has a special interest in practicing energy and environmentally efficient practices to promote renewable and sustainable energy usage on campus. Geographically, UMPSA Pekan is situated at Latitude 3.544°N and Longitude 103.429°E. The UMPSA Pekan campus is about 12 m above sea level. The UMPSA has a total area of 658.06 acres, which is the result of two campuses, including the 642-acre Pekan campus, which is located on the rural side as marked in Table 2. As shown in Fig. 5, the lake, forest, and rooftops of buildings The lakes and forest area are marked in Fig. 5a, while the other rooftop areas of the building are respectively shown in Fig. 5b, c. Given that UMPSA has 658.06 acres of land, many of the open spaces—more than 20%—can be used. In addition, roof space could be utilized. In the below Google Earth terrain image, the red line shows the Universiti Malaysia Pahang Al-Sultan Abdullah (UMPSA) Pekan campus, while the forest and lakes have been marked for the study of the potential of solar PV installation.
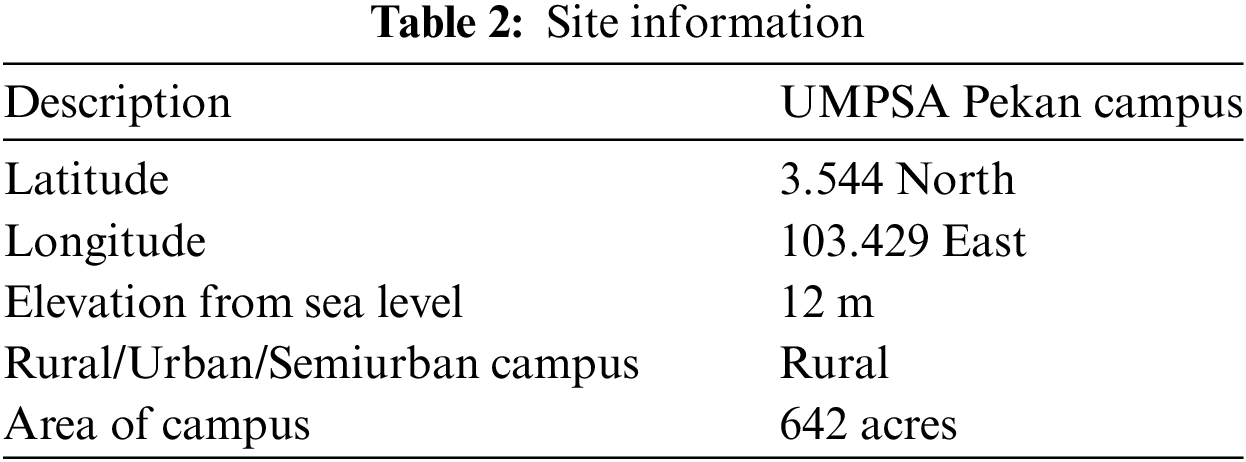
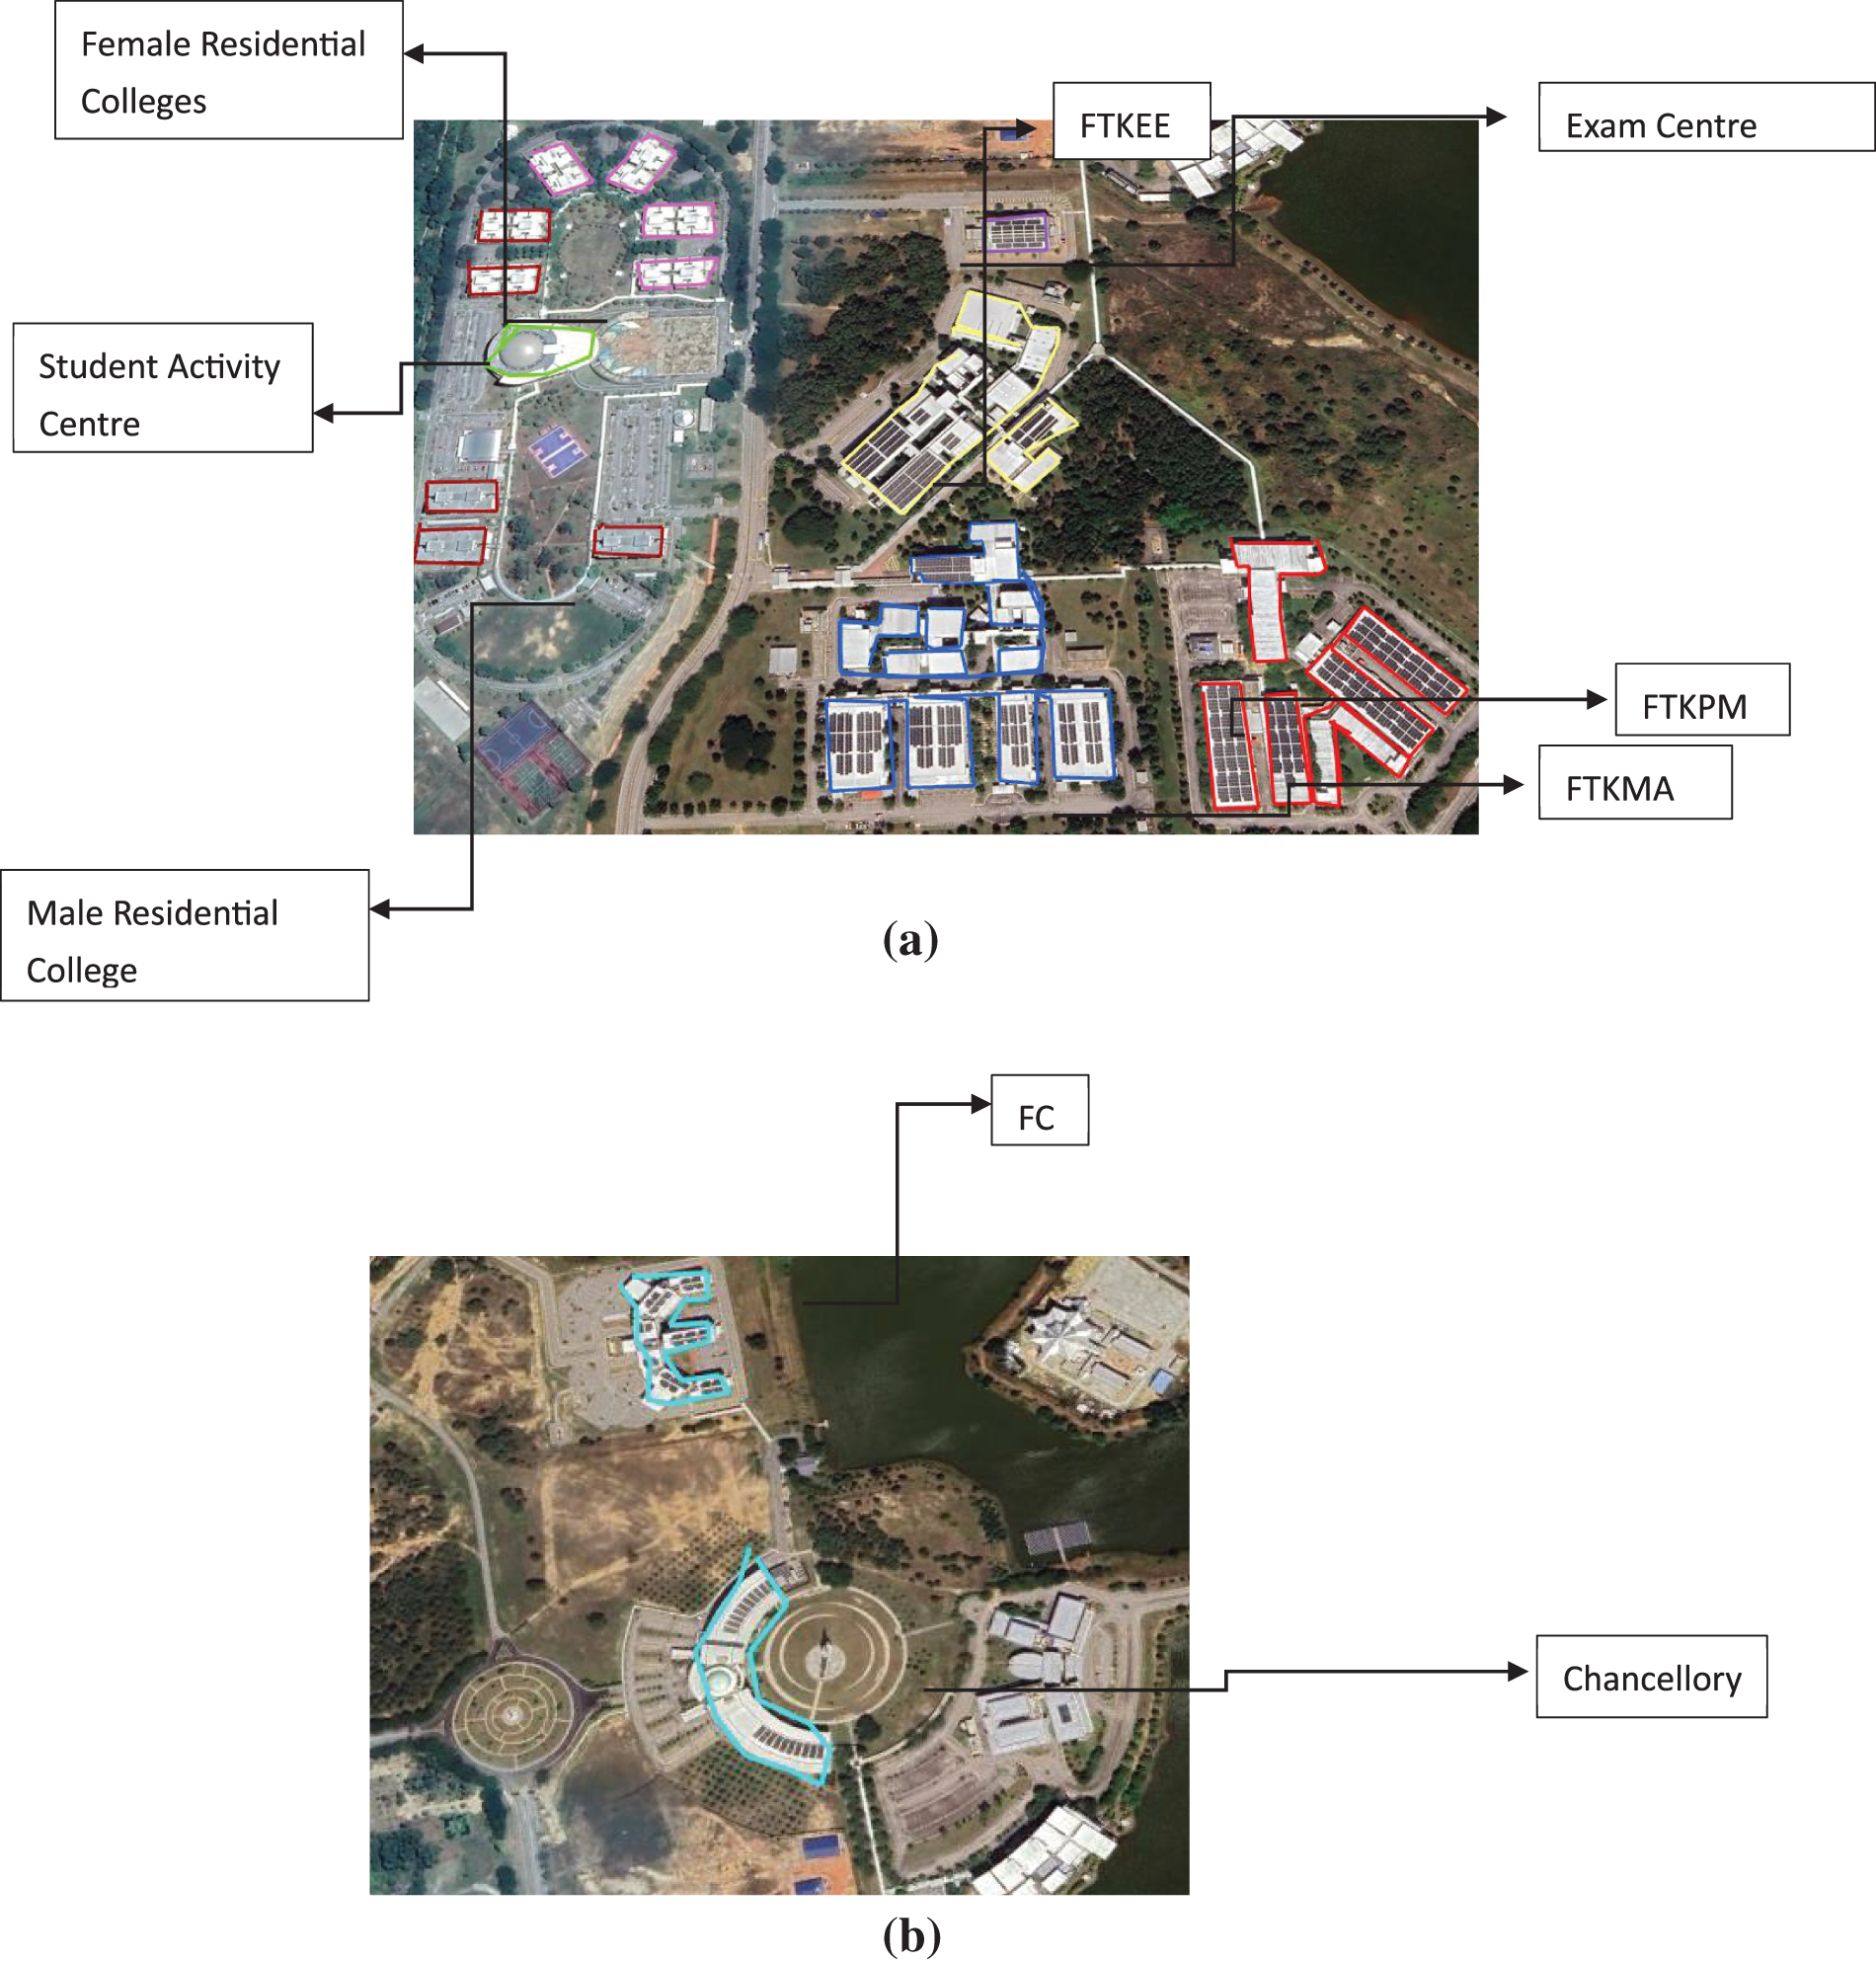

Figure 5: Overview of UMPSA Pekan (a) Rooftop of academic, and hostel (b) Rooftop of administrative building (c) Forest and lake area (Not to scale)
3.2 Photovoltaic Geographic Information System (PVGIS)
A photovoltaic geographic information system, or PVGIS for short, is one of the most well-known tools for evaluating the efficiency of solar PV power plants on most of the continents of Europe, Asia, and Africa. This tool is packaged with estimates for economic parameters, such as the cost of electricity, a performance assessment method, and a database of solar radiation [34]. The parameters needed for PV plant sizing can be entered into PVGIS based on the load or any hypothetical plants. The slope, tilt, and azimuth angles of the PV module can also be optimized by the user. Simulated results are displayed in a variety of ways depending on the user’s preferences, including as graphical representations, tabular columns, excel sheets, and PDF files. Using PVGIS, the user can perform the following analysis:
• Consummation of grid-connected PV
• Consummation of tracking PV
• Consummation of off-grid PV systems
• Monthly, average, and hourly irradiance data
The leading software platform for designing and evaluating the performance of a solar plant for medium-sized to large solar PV plants are called a Helioscope. The initial input for the Helioscope software is the area’s longitude and latitude; alternatively, as shown in Fig. 6, if the area’s name is correctly entered in the designated window, the area map of the relevant land is automatically downloaded. Once the area’s location has been determined in the software, the primary feature of the Helioscope is to put the field segments. The field segments consist of heights, azimuths, tilts, and module layouts. Further electrical segments consist of inverters and a range of maximum power point tracking (MPPT) strings. Also, it can select the appropriate kind of panels and inverting, and the entire plant’s layout is automatically generated with all the necessary information, including power output, system loss, energy to the grid, the number of modules and inverters, and the arrangement of the panel.
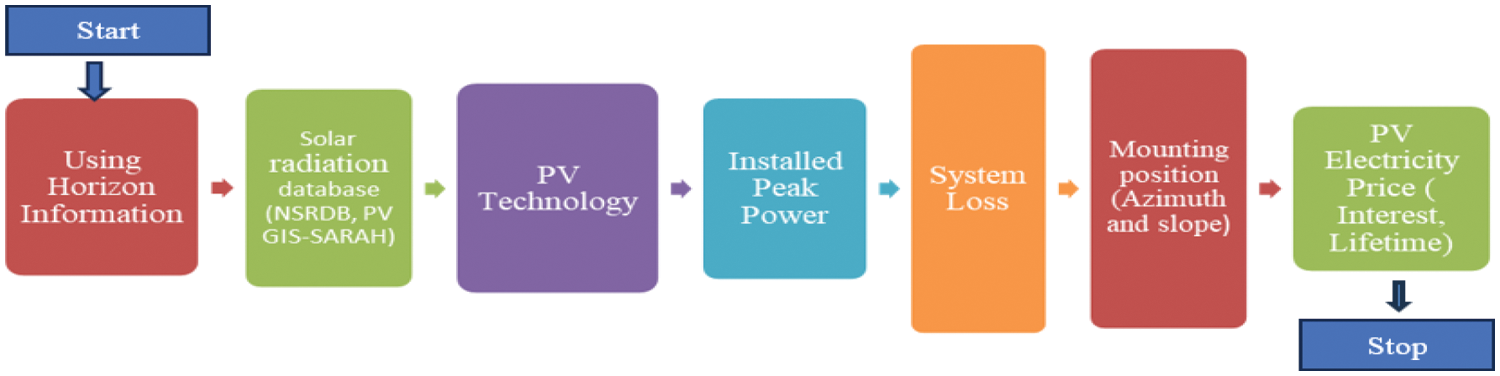
Figure 6: Input parameter of PV GIS simulation
Methodology of Helioscope for designing Forestvoltaics, Floatovoltaics, and Building Applied Photovoltaic (BAPV) is shown in Fig. 7. In Helioscope, create a login and project name. Enter the Global Positioning System (GPS) coordinates for your forest, lake, and building areas. This allows you to design separate projects utilizing solar panels for each application (forest, lake, Building). Within a new project, navigate to the “Mechanical” layout section. Here, you will define the placement of your solar panels. “Field Segments” represent areas like forests, lakes, and building roofs suitable for panels.
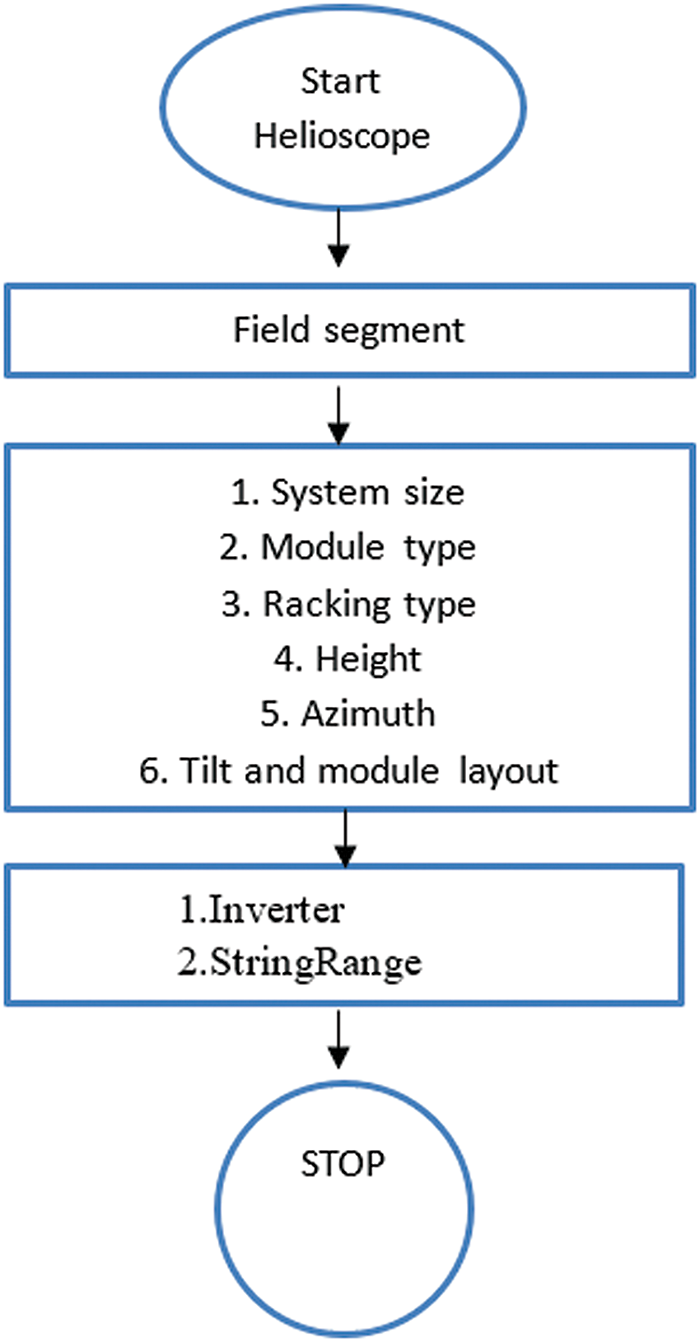
Figure 7: Input parameter of Helioscope simulation
Conversely, “Keep Outs” defines areas excluded due to shading from surrounding obstacles. Optimize your design by setting the maximum system size at the periphery and specifying the canopy area for solar coverage. Choose a suitable solar module for your project. Next, define the height, azimuth (orientation), tilt, layout, setbacks, and alignment of your panels, considering the specific conditions of forests, lakes, and building areas. Inverter placement also varies by location. In forests, position the inverter below the tree canopy for shade. For lakes and buildings, prioritize shaded areas to enhance inverter cooling. Finally, plan the string layout for connecting the solar panels in series. In the forest zone, route the strings internally to connect all panels. Due to limited combiner box inputs, combine these series strings from the solar panels as needed.
The solar panel forms the main part of the entire PV system, which accounts for the conversion from solar irradiance to DC electricity. On the types of various technologies, polycrystalline, monocrystalline, and amorphous solar PV have an efficiency of 15%, 20%, and 10%, respectively. Solar power capacity is given by the formula:
In the Eq. (1),
where
3.5 Economic and Carbon Mitigation Analysis
Eqs. (1) and (2) are used to conduct an economic analysis of the planned PV project. The annual savings and payback durations were determined.
where annual savings
The CO2 emission is measured in tCO2, which is the yearly energy generation measured in MWh or kWh, and its grid emission factor. The grid emission factor (GEF) is defined as the CO2 emission factor (tCO2/MWh) that is connected to every unit of electricity produced by a power system and is calculated per kWh or MWh. However, solar power facilities are not fully emission-free. Estimating CO2 emissions per kWh generated by solar plants is minimal. The emission from the PV facility is calculated using Eq. (5).
where CO2 emissions from a PV plant are measured in tCO2, annual energy generation in MWh or kWh. Eq. (6) calculates the net reduction in CO2 emissions from the solar PV plant. Net CO2 reduction is the overall reduction in carbon dioxide (CO2) emissions achieved by transitioning from traditional power plants to photovoltaic (PV) power plants. This reduction represents a significant environmental benefit as it helps mitigate climate change by reducing greenhouse gas emissions and minimizing the carbon footprint associated with electricity generation.
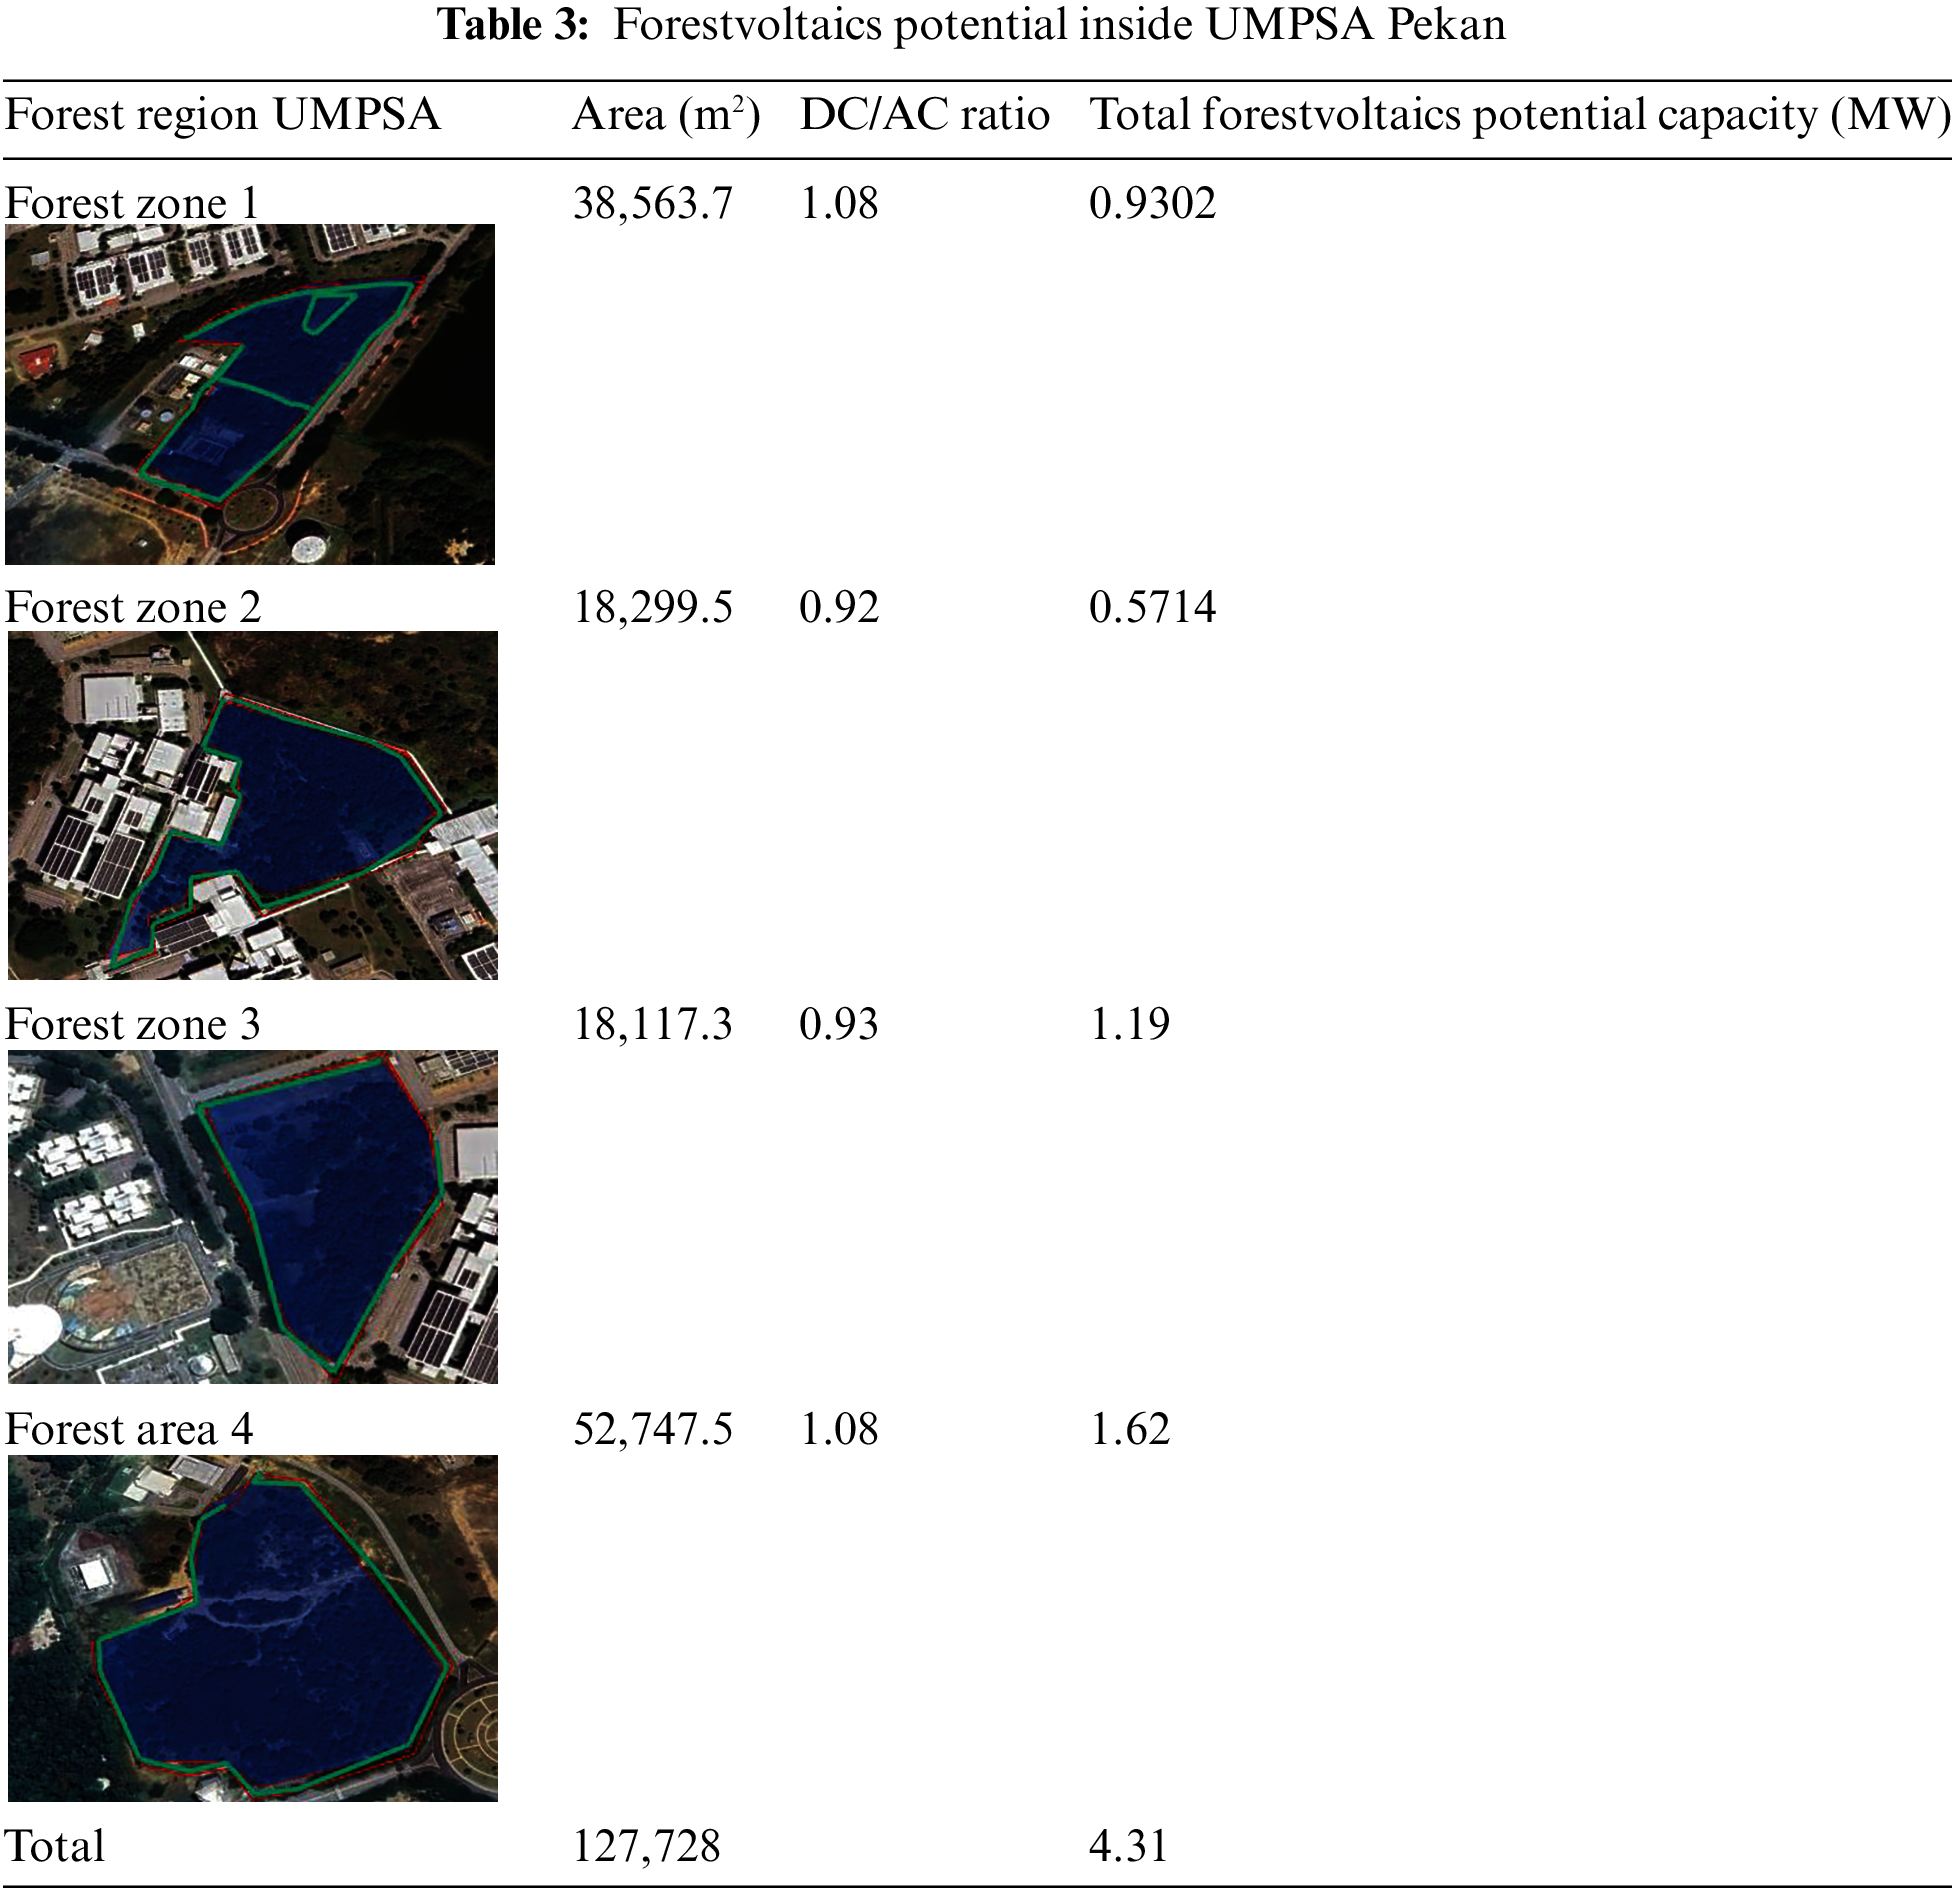
4.1 Forestvoltaics Potential in UMPSA Pekan
Based on Helioscope software, the forest voltaic potential of the UMPSA Pekan campus is estimated. Table 3 shows the solar PV site capacity to be installed over forest zones 1, 2, 3, and 4. The red line shows the area demarcated, the green line shows the periphery area where solar trees are planted, and the light blue shaded part shows the solar panels in the canopy area. Based on the percentage of land covered, there are three different cases discussed: the optimistic case (60%).
The Potential of Forestvoltaics Capacity (MW) with Different Solar Technologies
Total Area = 127,728 m2
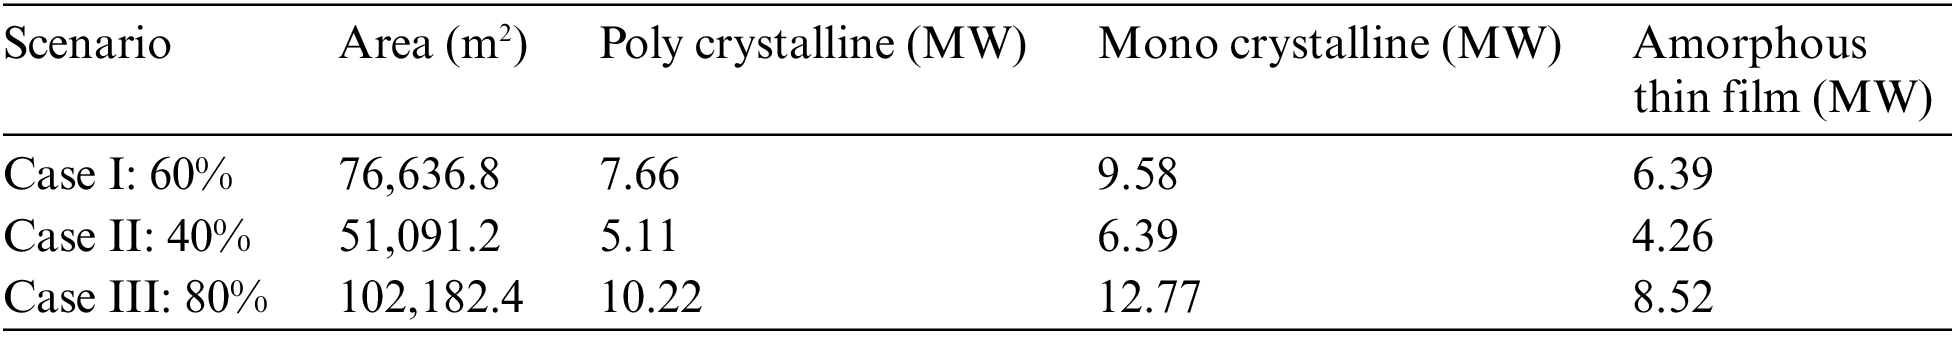
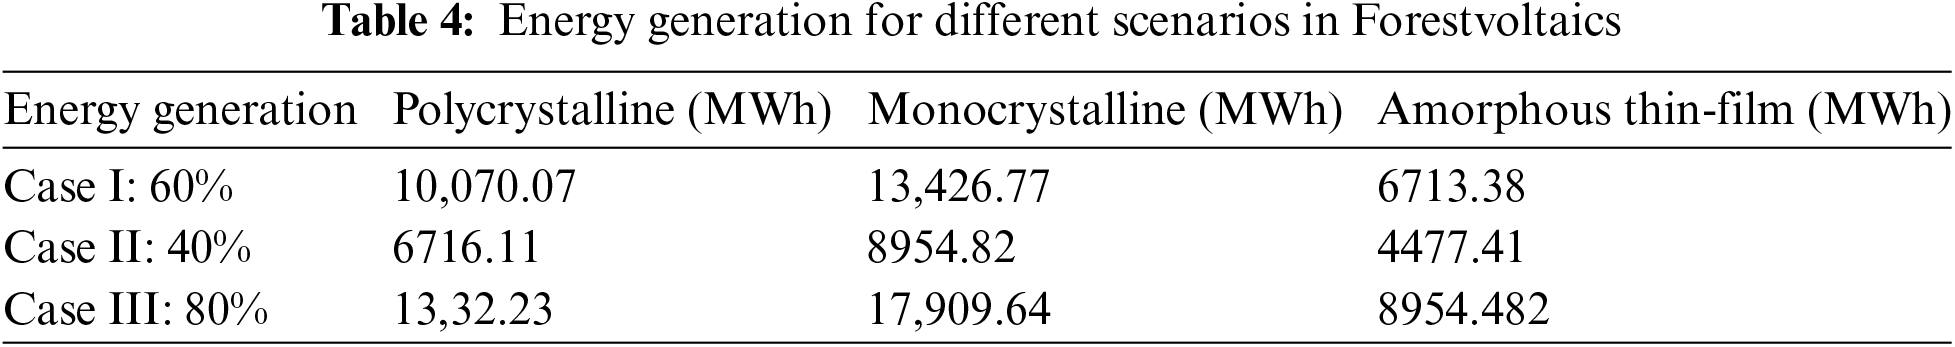
The solar PV potential in the forests of UMPSA Pekan on the basis of scenarios as depicted in Fig. 8 used different solar PV technologies. Table 4 compares three scenarios (Case I, Case II, and Case III) with varying coverage percentages (60%, 40%, and 80%) and three types of solar panels (polycrystalline, monocrystalline, and amorphous thin film). The capacity ranges from 5.11 to 12.77 MW, indicating the amount of solar energy that can be generated based on the specific scenario and solar panel type. Case III with monocrystalline solar panels consistently shows the highest potential capacity of 12.77 MW, while Case II with amorphous thin film solar panels has the lowest capacity at 4.26 MW. The optimum scenario among the three cases is Case I, with 60% coverage using polycrystalline panels, resulting in a capacity of 7.66 MW. Potential energy generation for these scenarios ranges from 6713.38 to 8954.48 MW. Again, Case III with monocrystalline solar panels shows the highest potential energy generation, while Case II with amorphous thin film panels shows the lowest. The optimal scenario, Case I with 60% polycrystalline panels, yields an energy generation of 7.66 MW.

Figure 8: Potential of Forestvoltaics (MW) with different technologies
4.2 Floatovoltaics Potential in UMPSA Pekan
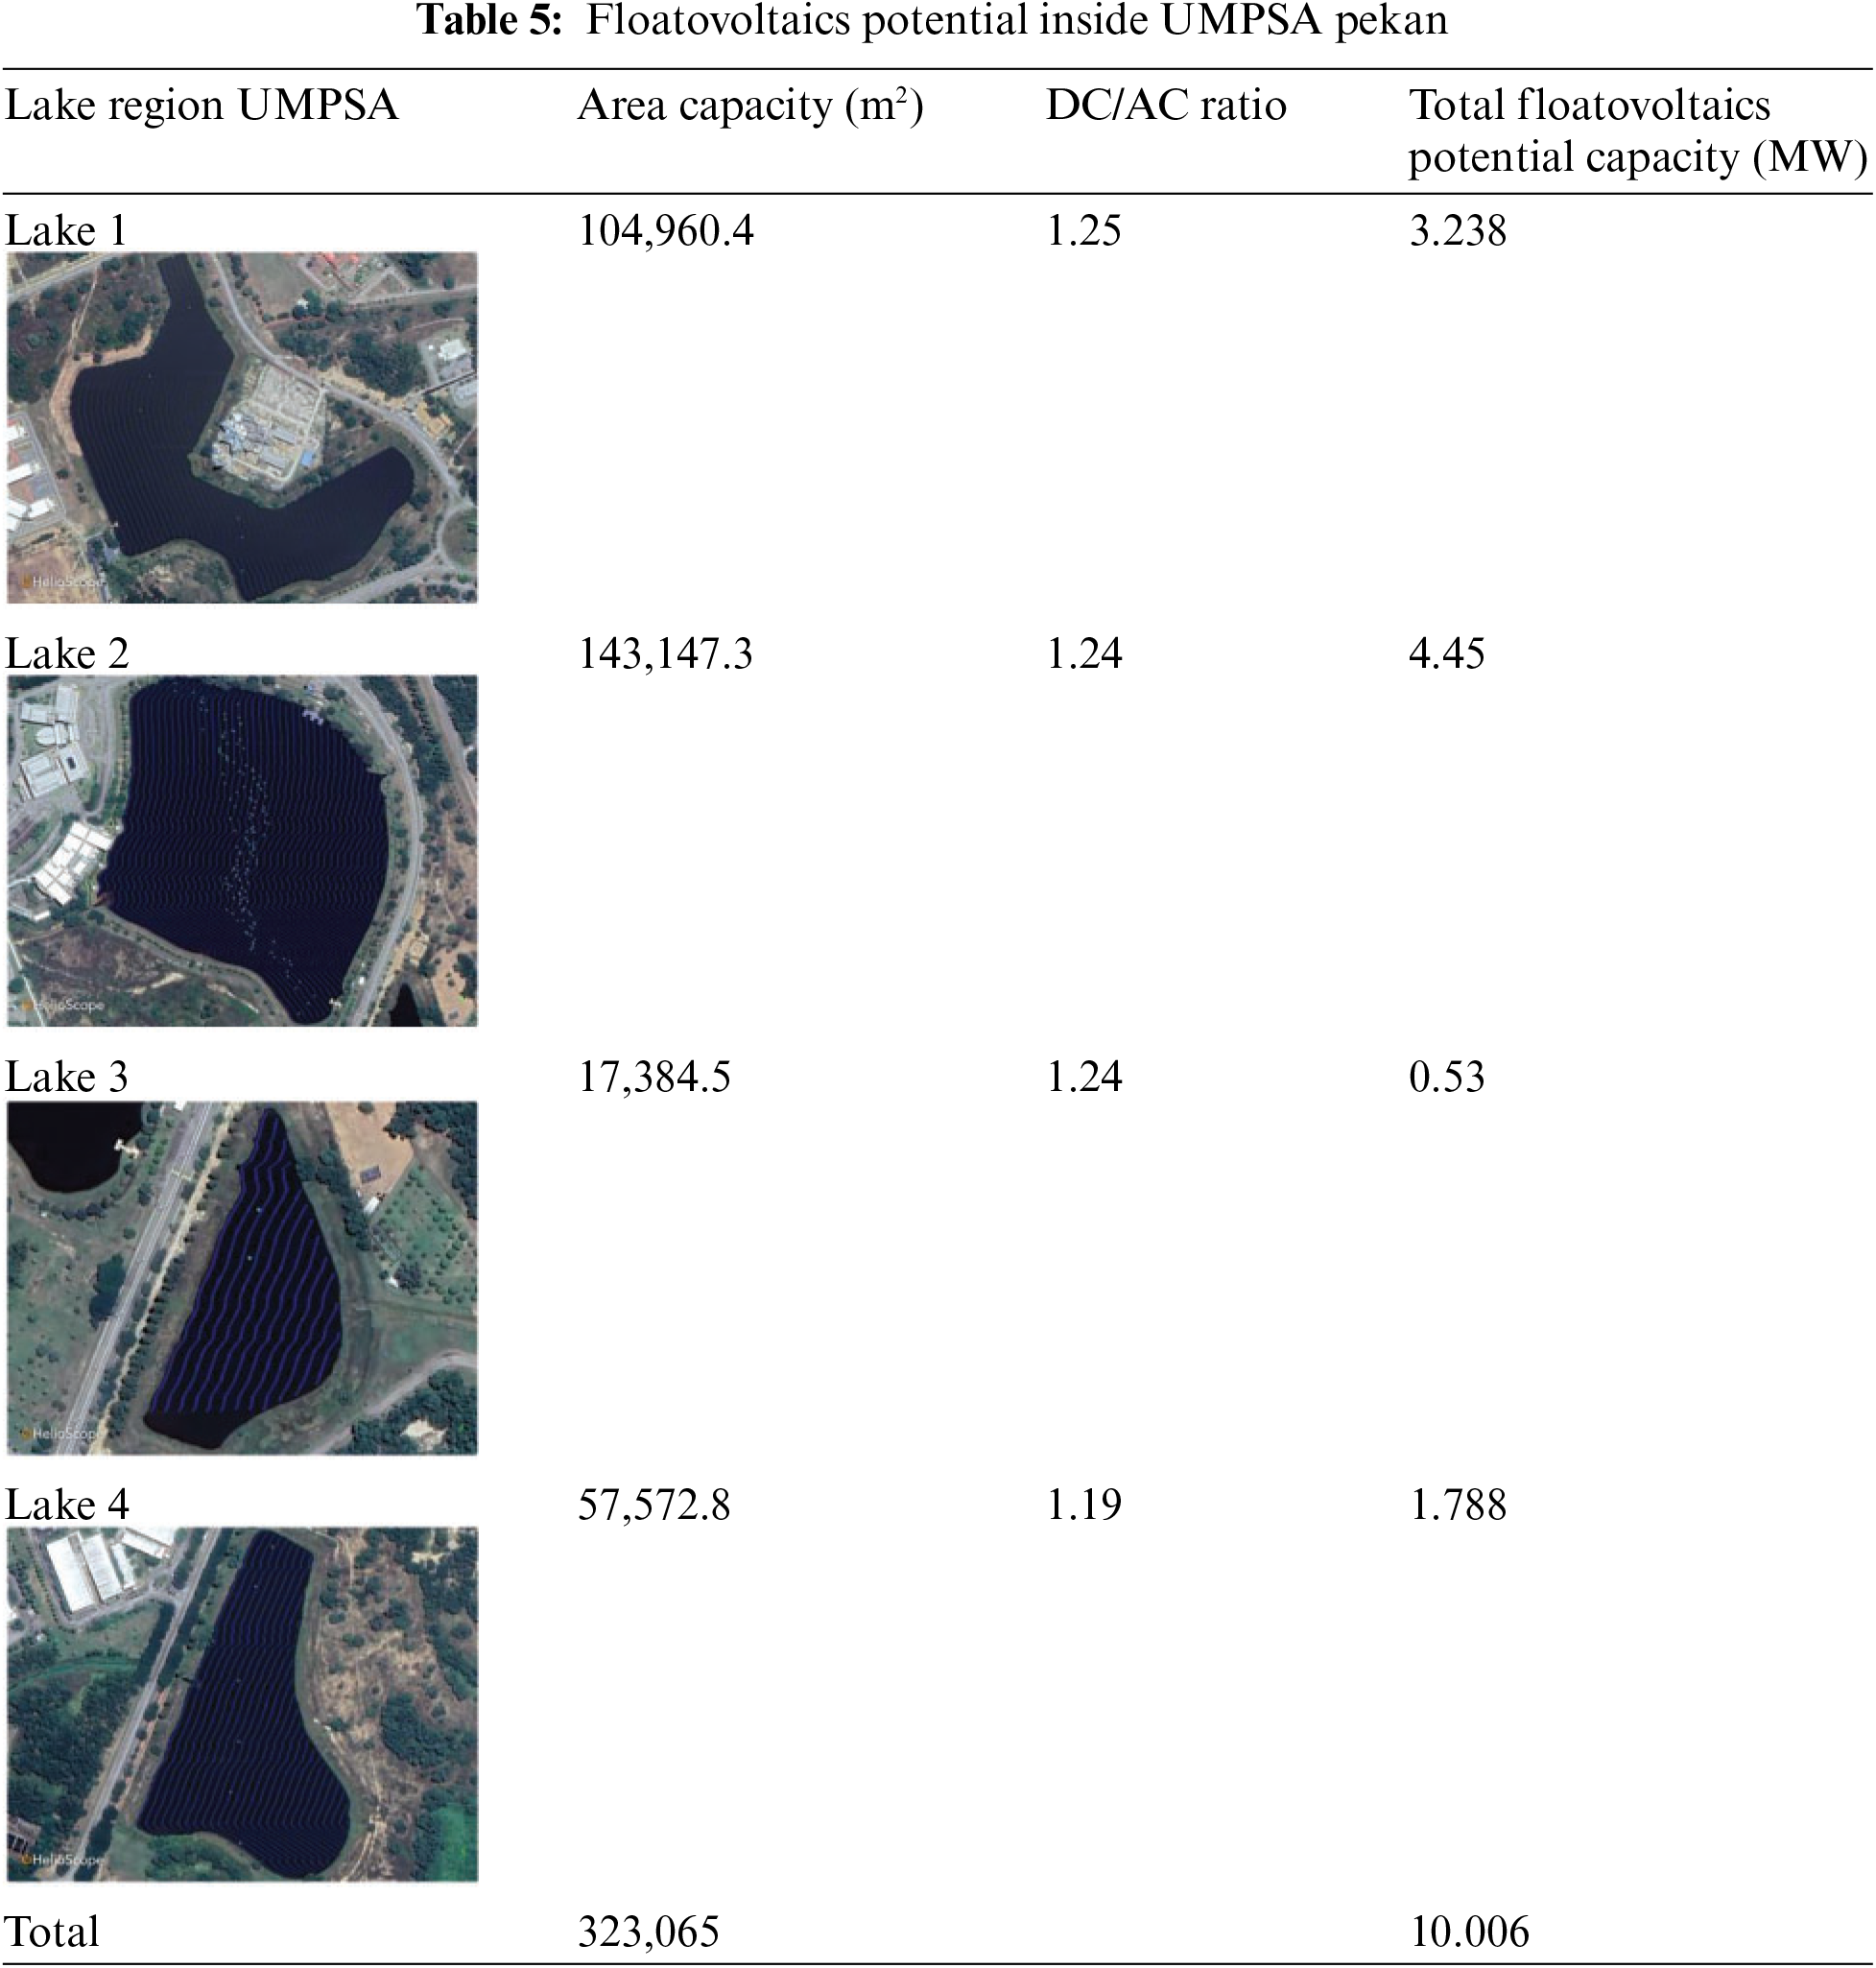
Based on Helioscope software, the floatovoltaic potential of the UMPSA Pekan campus is estimated. Table 5 showcases the viable opportunity for solar PV systems to be installed on the lakes of UMPSA Pekan. At the same time, the total potential capacity can be optimized based on the various parameters.
Potential Floatovoltaics Capacity with Different Generations of Solar Panels
The quantity of solar energy that can be produced in a given location, including the base area, is referred to as the prospective solar capacity related to that base area. Solar capacity is calculated using data on solar irradiation, installed capacity, and available area. In this instance, the base area can be used to determine the potential solar capacity. Specifically:
• 10 m² of polycrystalline material can yield 1 kilowatt (kW) of power.
• 8 m² of monocrystalline material can produce 1 kW of power.
• 12 m² of amorphous thin film material can create 1 kW of power.
Total Area = 323,064.2 m2
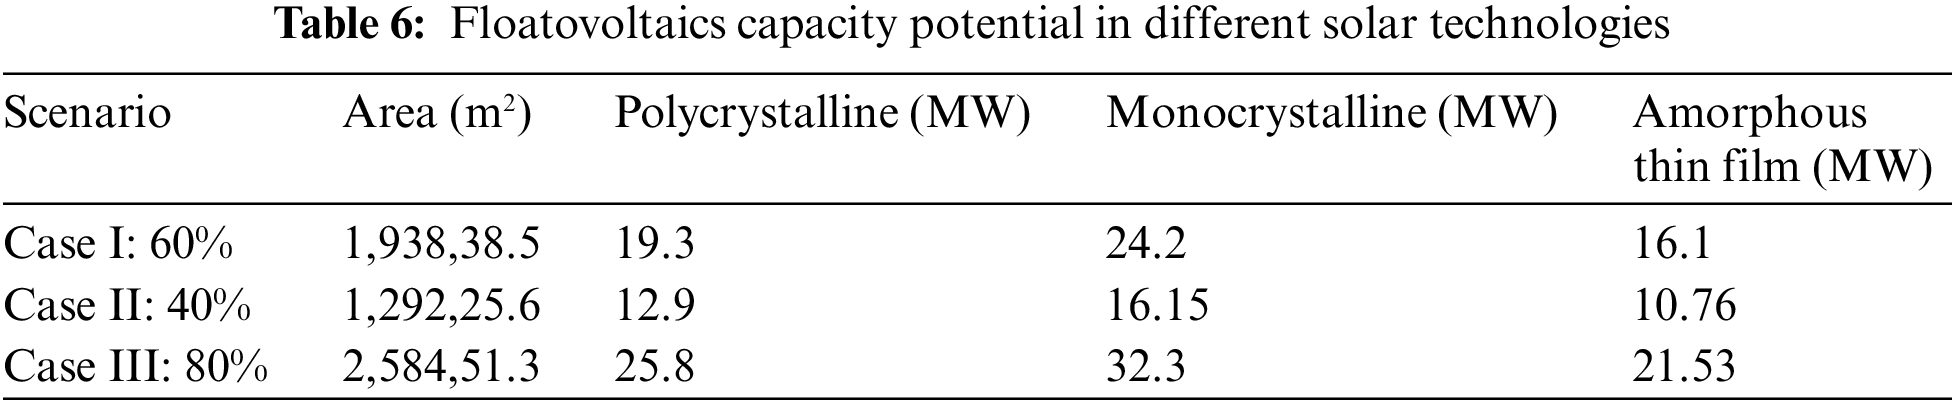
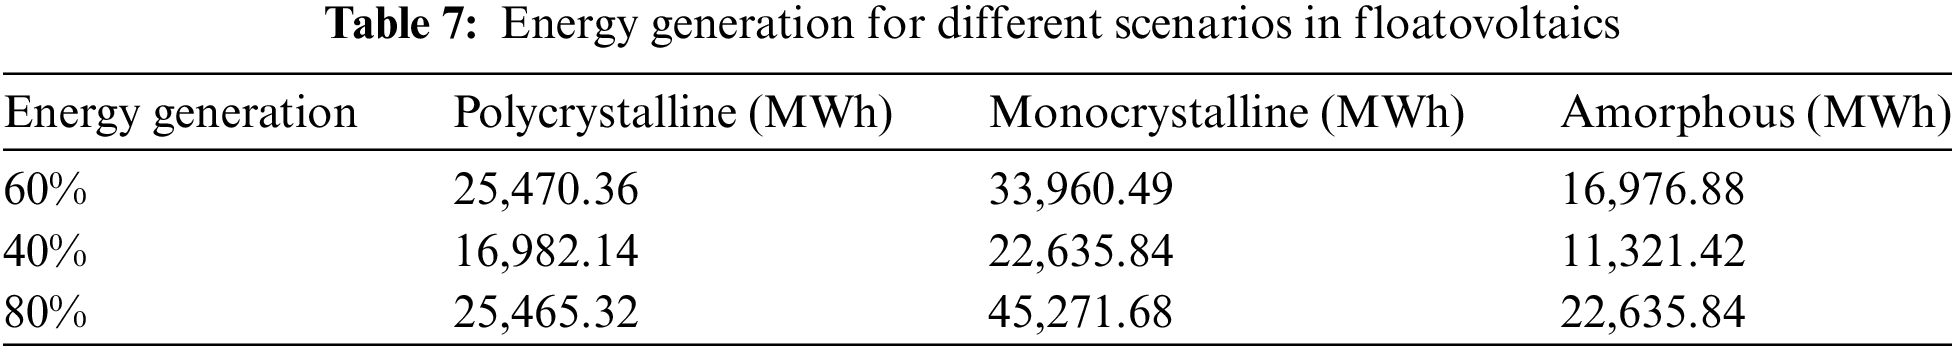
Fig. 9 and Table 6 illustrate the potential of floating solar installations at UMPSA Pekan’s Lake. The total available surface area is 3,230,64.2 square meters. The tables analyze potential solar capacity (in MW) across three scenarios (Case I, Case II, and Case III) with varying land use percentages (60%, 40%, and 80%) and three solar panel types (polycrystalline, monocrystalline, and amorphous thin film). The potential ranges from 12.9 to 32.3 MW. As expected, potential capacity increases with higher scenario percentages (more land use) for all panel types. Both polycrystalline and monocrystalline panels consistently outperform amorphous thin film in terms of potential capacity across all scenarios. Considering the objective of maximizing solar generation, Case III (80% land use) with monocrystalline panels emerges as the most suitable option. This scenario boasts the highest potential capacity at 32.3 MW. Overall, the analysis suggests that maximizing land use (Case III) with monocrystalline panels offers the most promising approach for floatovoltaics at UMPSA Pekan’s lake. Table 7 presents the potential energy generation for the three scenarios (Case I, Case II, and Case III) with different coverage percentages (60%, 40%, and 80%) and the three types of solar panels. The annual energy yield ranges from 11,321.42 to 45,271.68 MWh. Case III with monocrystalline panels consistently shows the highest energy generation of 45,271 MWh, while Case II with amorphous thin film panels consistently has the lowest energy generation.
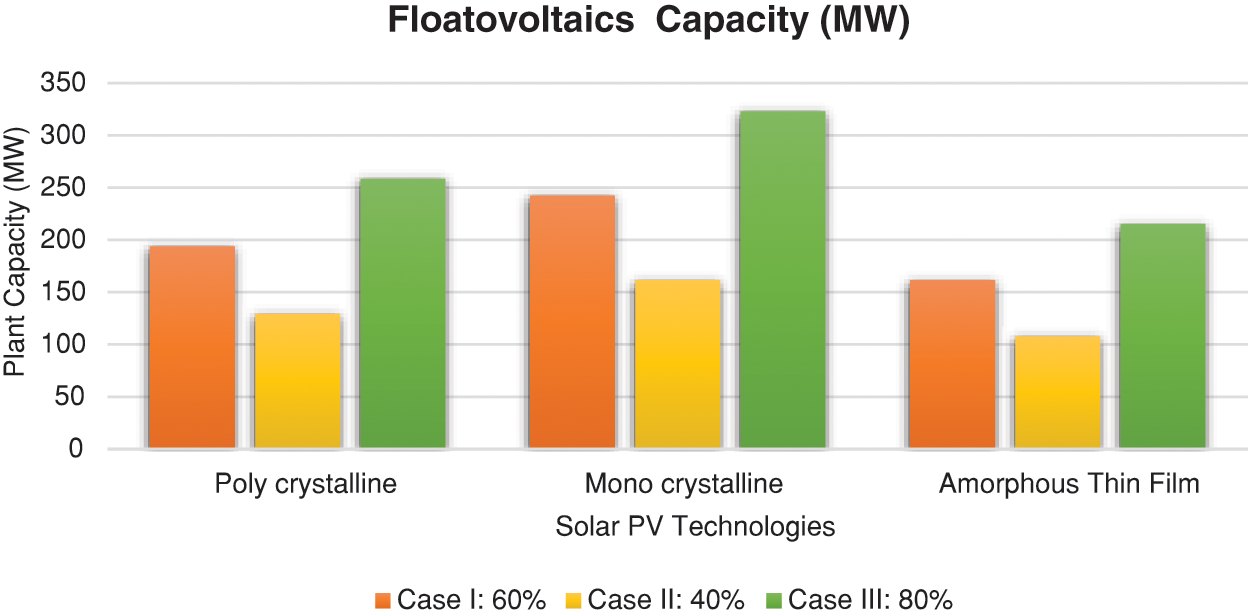
Figure 9: Potential of floatovoltaics solar capacity (MW) with different technologies of solar panel
4.3 BAPV Potential in UMPSA Pekan
Based on the Helioscope simulation, the potential for Building Applied Photovoltaics (BAPV) is estimated since the side view of the buildings is not available in Google Earth. The solar potential of the buildings is studied from the top view, excluding the façades and windows. Table 8 highlights the viable opportunities for installing solar PV systems on various buildings, including the chancery, Faculty of Mechanical and Automotive Engineering Technology (FTKMA), Faculty of Manufacturing and Mechanical Engineering Technology (FTKPM), Faculty of Electrical and Electronics Engineering Technology (FTKEE), Faculty of Computing (FC), the student activities center, and the male and female residential colleges. The total potential capacity can be optimized based on various parameters.

Potential of Buildings Solar Capacity (MW)
Total Area = 85,359.2 m2
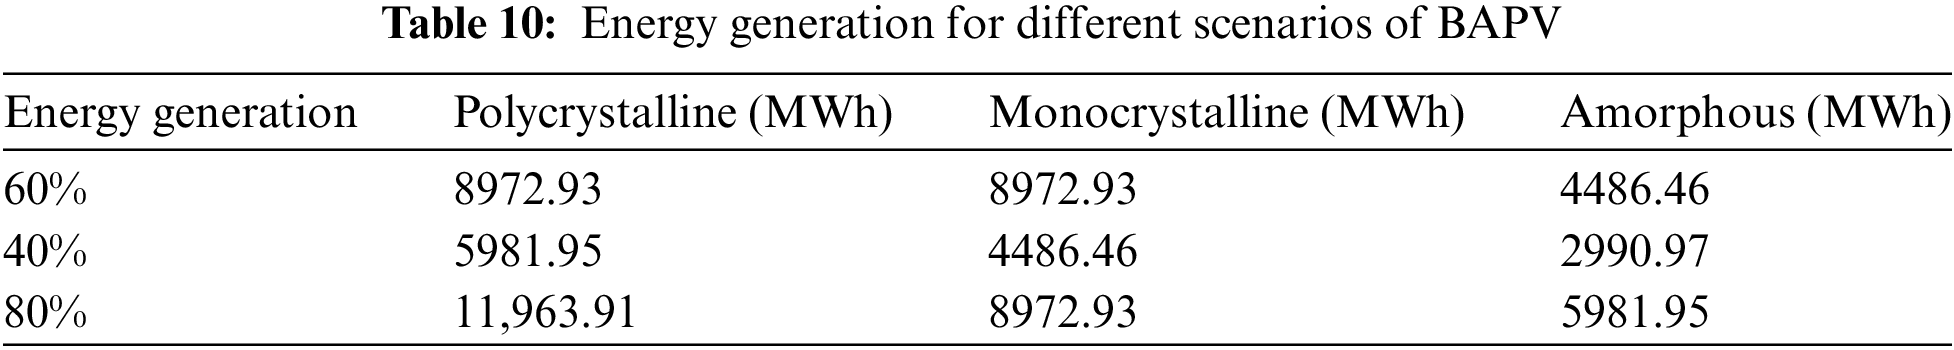
Case III consistently shows the highest potential capacity across all panel types, as shown in Table 9. The potential of solar pv capacity on buildings using different PV panels is illustrated in Fig. 10. Among the solar panel options, monocrystalline panels consistently exhibit the highest potential capacity, followed by polycrystalline and amorphous thin film panels. Therefore, considering the highest possible capacity and the performance of different solar panel types, Case III with monocrystalline panels appears to be the most suitable choice for maximizing solar energy generation in forested areas. The potential energy generation in Building Applied Photovoltaics (BAPV) is presented in Table 10 for three scenarios (Case I, Case II, and Case III) with different coverage percentages (60%, 40%, and 80%) and three types of solar panels (polycrystalline, monocrystalline, and amorphous thin film). The energy generation figures range from 2990.97 to 11,963.91 MWh. Comparing the scenarios, Case III with monocrystalline solar panels consistently shows the highest energy generation of 11,963.91 MWh. In contrast, Case II with amorphous thin film solar panels consistently has the lowest energy generation.
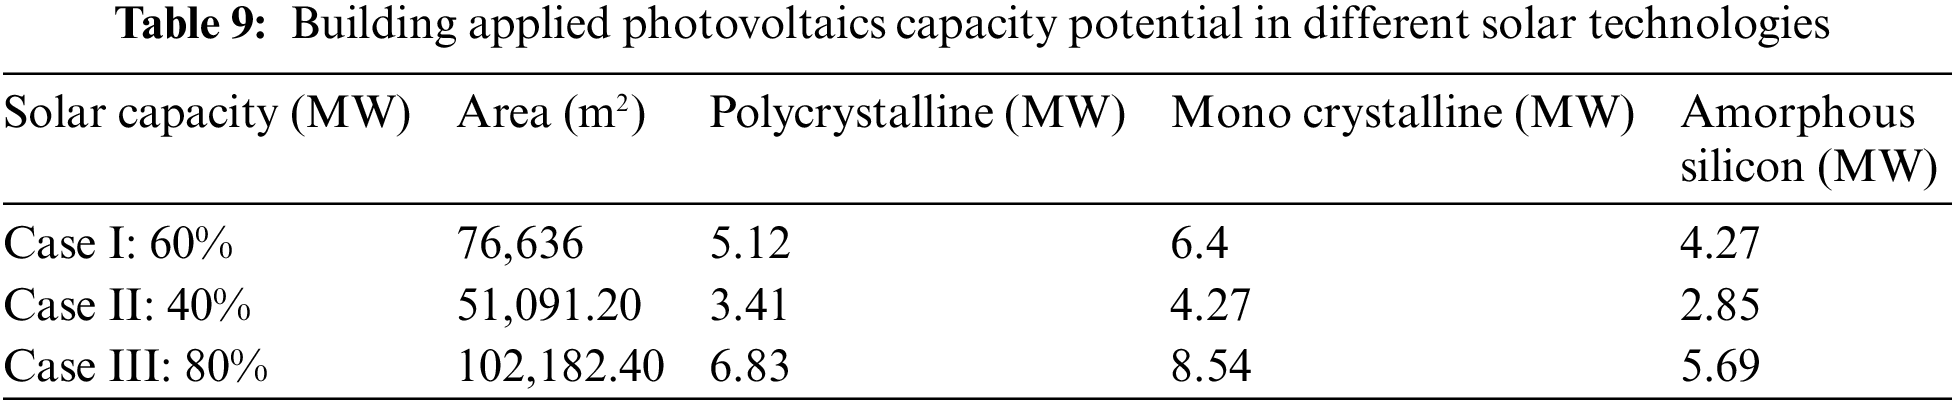
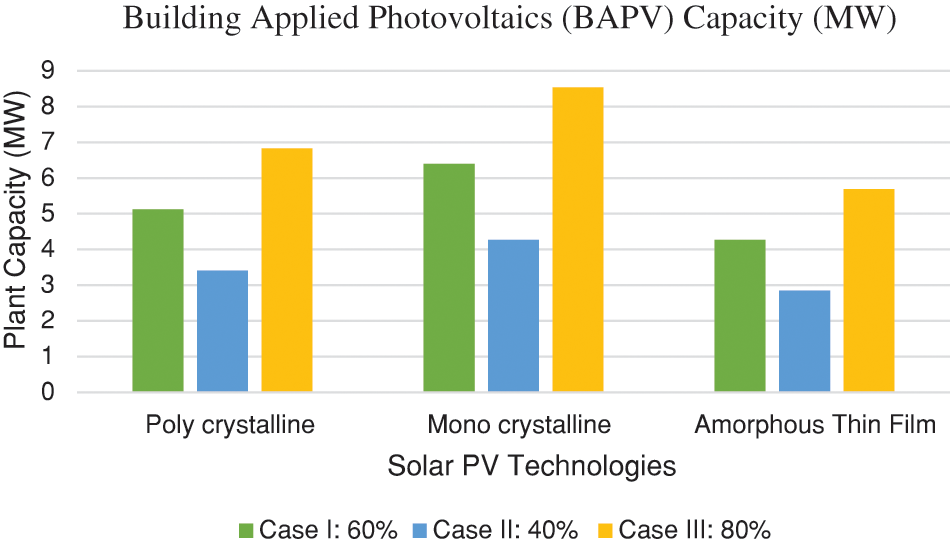
Figure 10: Potential solar capacity of buildings applied photovoltaics in (MW)
4.4 Financial Analysis of Forestvoltaics, Floatovoltaics, and Building Applied PV
The annual savings provide information on the FiT rate (RM/kWh) for different installed capacities of renewable energy installations in Malaysia, along with the effective and yearly period rates. The FiT rate in Table 11 represents the tariff rate at which the utility company purchases electricity generated from renewable energy sources. By multiplying the annual energy generation by the FiT rate, the formula calculates the amount of money that can be saved annually by selling renewable energy to the grid.
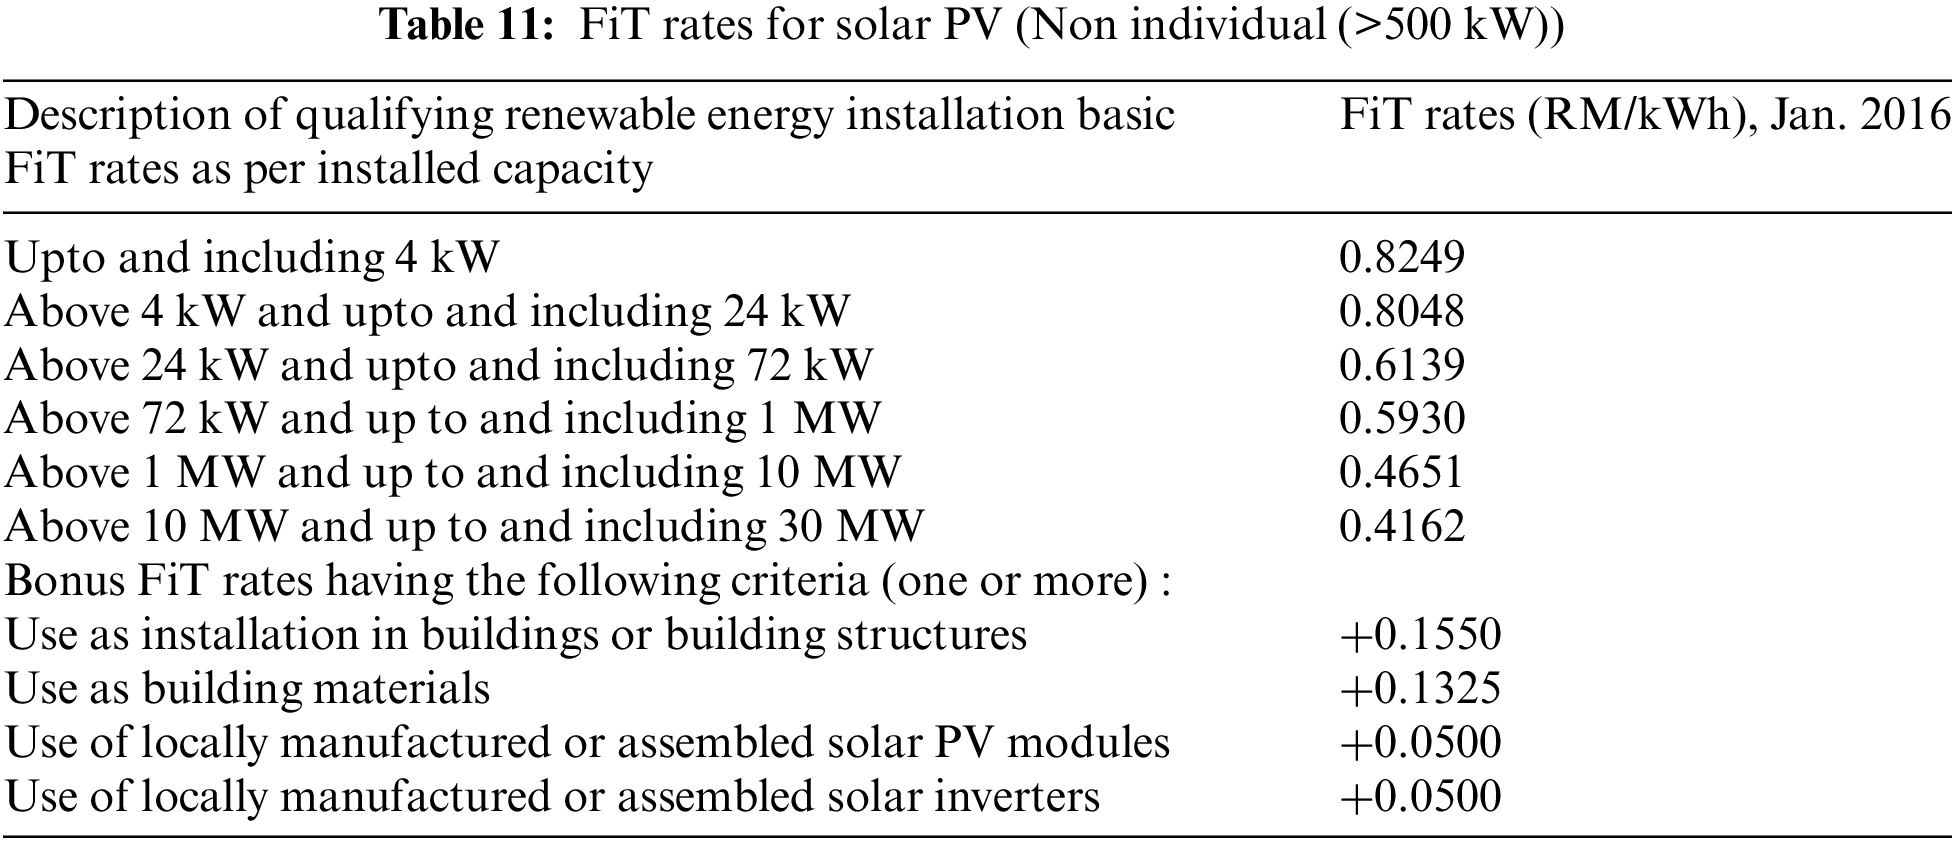
The effective period mentioned in a table related to solar PV installations typically refers to the duration over which the savings or benefits from the installation are calculated or realized. The effective period determines the time it takes to recover the initial investment in the renewable energy installation through savings on energy costs. A longer effective period allows for more time to recoup the upfront investment, potentially resulting in greater overall savings. The effective period impacts financial metrics such as the payback period, return on investment (ROI), and net present value (NPV). A longer effective period may result in a shorter payback period and a higher ROI, indicating a more financially attractive investment. The effective period should align with the expected lifespan of the installed renewable energy technology. For example, solar panels typically have a lifespan of 25 years or more. Extending the effective period beyond the technology’s lifespan may overstate potential savings. Changes in policies, regulations, incentives, and tariffs can impact the financial viability of renewable energy installations. The effective period should account for potential changes in the regulatory environment and their effects on savings over time.
4.4.1 The Effect of Degradation Rate on the FiT of a Solar PV System
The annual degradation rate in solar PV systems refers to the gradual decrease in the efficiency or output of the solar panel over time due to factors such as aging, environmental conditions, and material degradation. Typically expressed as 0.5% per year, this rate signifies that the panel loses 0.5% of its efficiency annually. This yearly degradation rate is crucial in determining the annual savings for solar PV systems as it directly influences the overall savings estimate. The degradation rate directly impacts the amount of electricity generated by the solar PV system. As the efficiency of the solar panels decreases over time, they produce less electricity compared to when they were initially installed. Consequently, the degradation rate must be taken into account when assessing the system’s annual energy production. Since the electricity generated by the solar PV system decreases each year due to degradation, the savings from avoided electricity purchases or revenue from excess energy sold back to the grid also decline over time. This reduction in savings is a direct consequence of the decrease in energy production caused by degradation. Incorporating the yearly degradation rate into the annual savings table leads to more accurate long-term financial estimates for the solar PV system. By accounting for degradation, stakeholders can gain a better understanding of how the system’s performance and savings potential will change over its operating life.
Annual Savings of Solar Power Plant.
FiT: 0.4162 RM (Floatovoltaics).
FiT: 0.4162 (RM (Floatovoltaics)).
FiT: 0.4651 (RM (BAPV)) + 0.1550 RM (Bonus for BAPV).
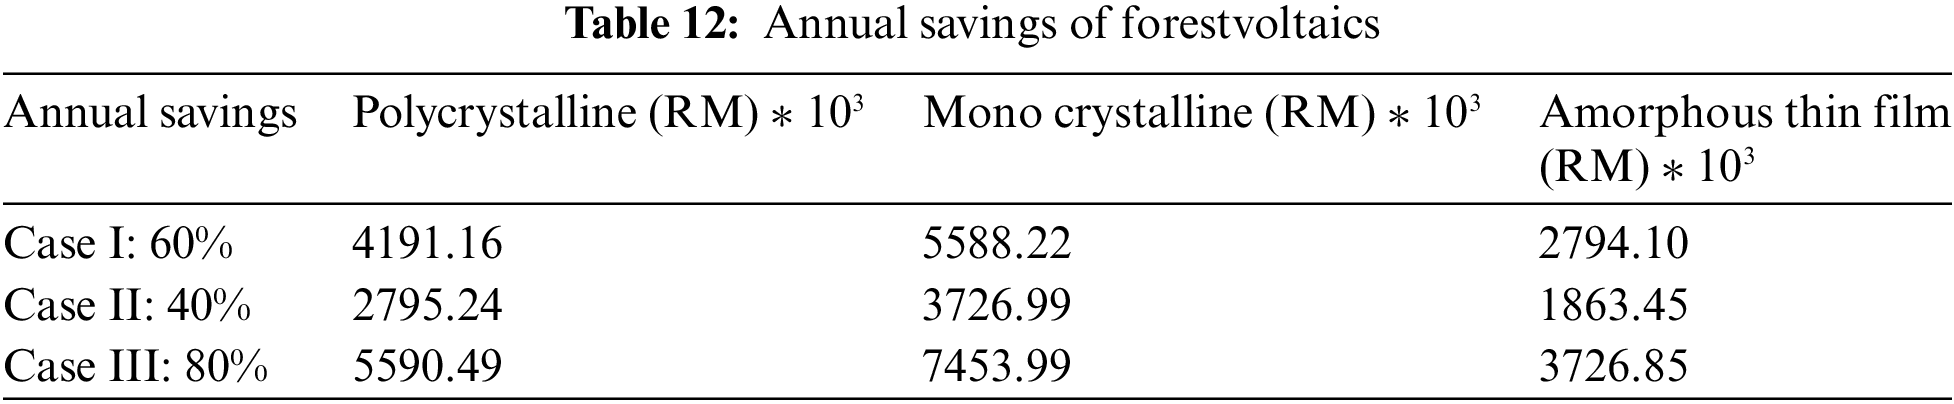
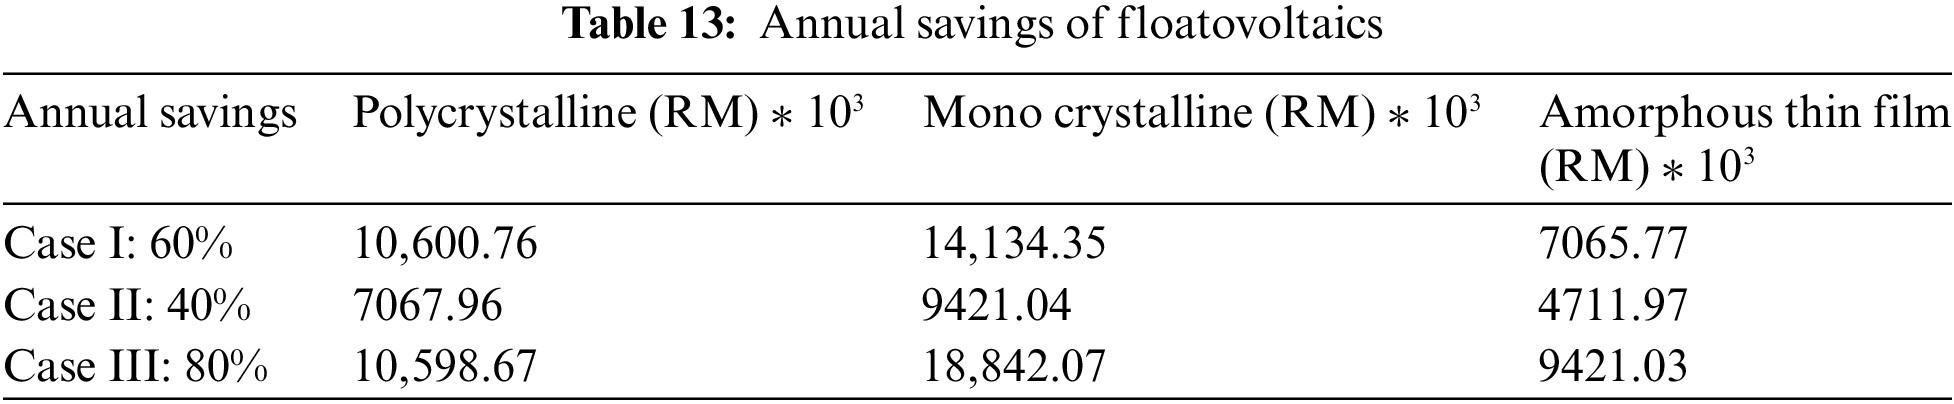
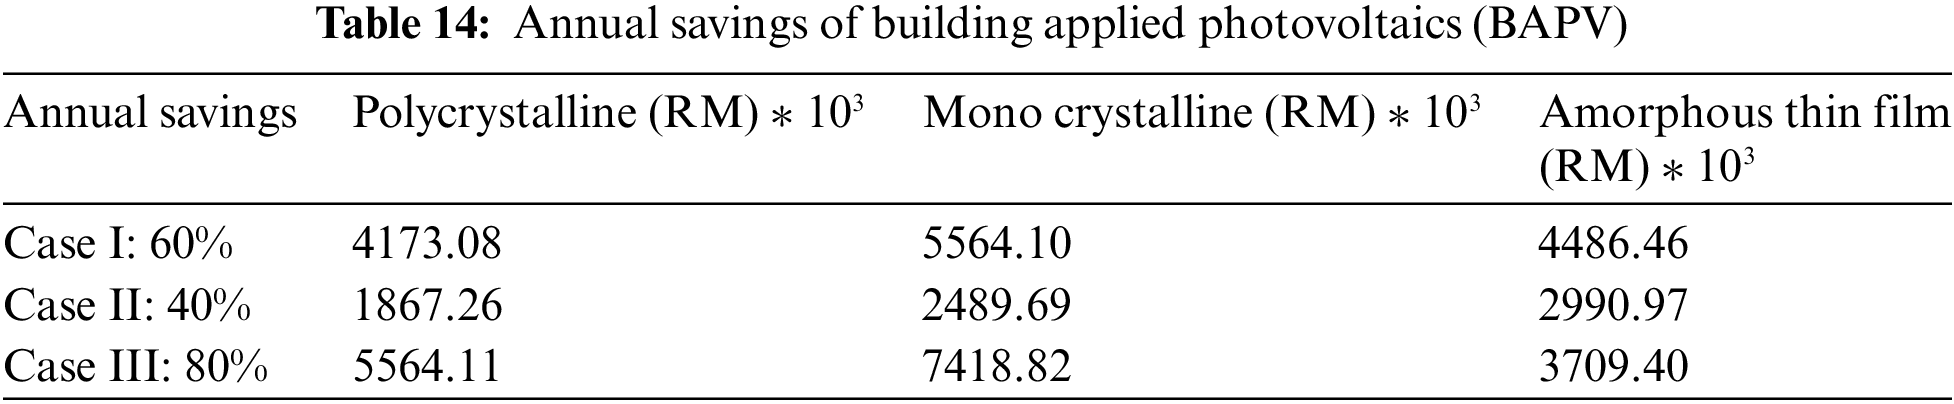
Based on Table 12, it is evident that the annual savings for forest photovoltaics generally increase as the scenario percentage rises for all types of solar PV technology. For maximizing annual savings, Case III with the 80% scenario for monocrystalline PV in forest photovoltaics seems the most suitable choice. However, the lowest yearly savings for forestvoltaics occur in Case II (40%) for amorphous thin film, amounting to RM 1863.50 * 103; meanwhile, the optimal value in Case I (60%) is RM 3568.97 * 103. Looking at the data in Table 13 on floatovoltaics, it is apparent that the annual savings generally increase as the scenario percentage rises for all solar PV technology. Among the panel types, polycrystalline and monocrystalline panels yield higher annual savings than amorphous thin film panels across all scenarios. For maximizing annual savings in floatovoltaics, Case III with the 80% scenario for monocrystalline panels appears to be the most suitable choice, amounting to RM 18,842.0710. However, the lowest annual savings value across the three scenarios is in Case II (40%) for Amorphous Thin Film, totaling RM 4711.97 * 103. The optimal value lies in Case I (60%) with polycrystalline panels, totaling RM 10,600.76 * 103. Based on the values in Table 14, the annual savings for BAPV generally increase as the scenario percentage rises for all panel types. Among the panel types, monocrystalline panels in Case III (80%) exhibit higher annual savings of RM 7418.82 * 103 compared to the lowest value of amorphous thin film panels in Case II (40%). Therefore, the optimal value is RM 4173.08 * 103 for Case I (60%) with polycrystalline solar panels.
4.5 GHG Mitigation Analysis of Forestvoltaics, Floatovoltaics, and Building Applied Photovoltaics
CO2 Emission from PV Plant:
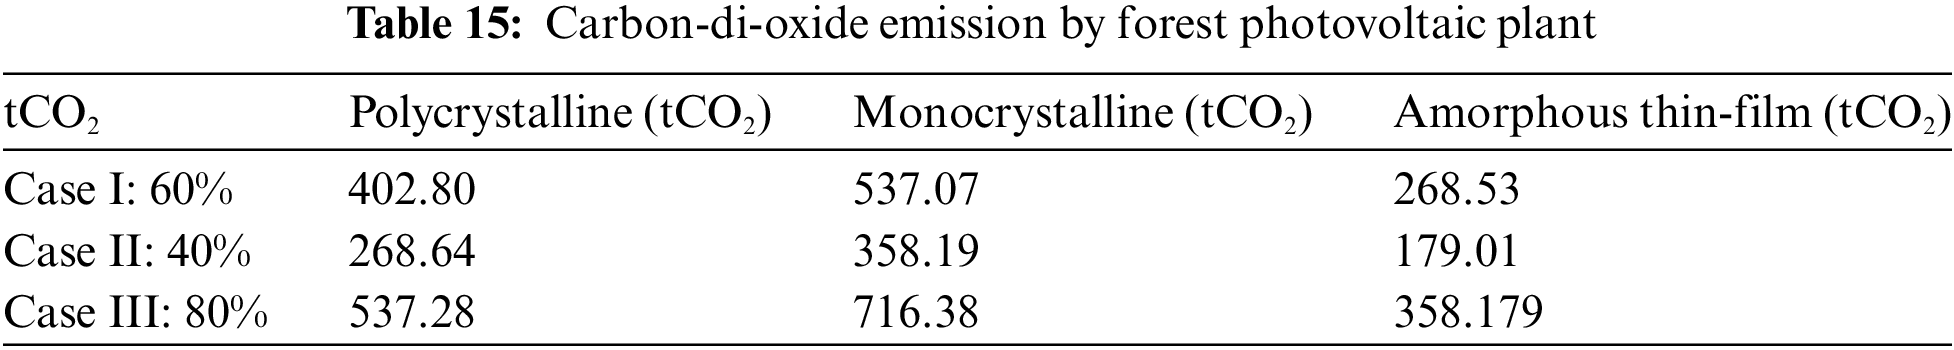
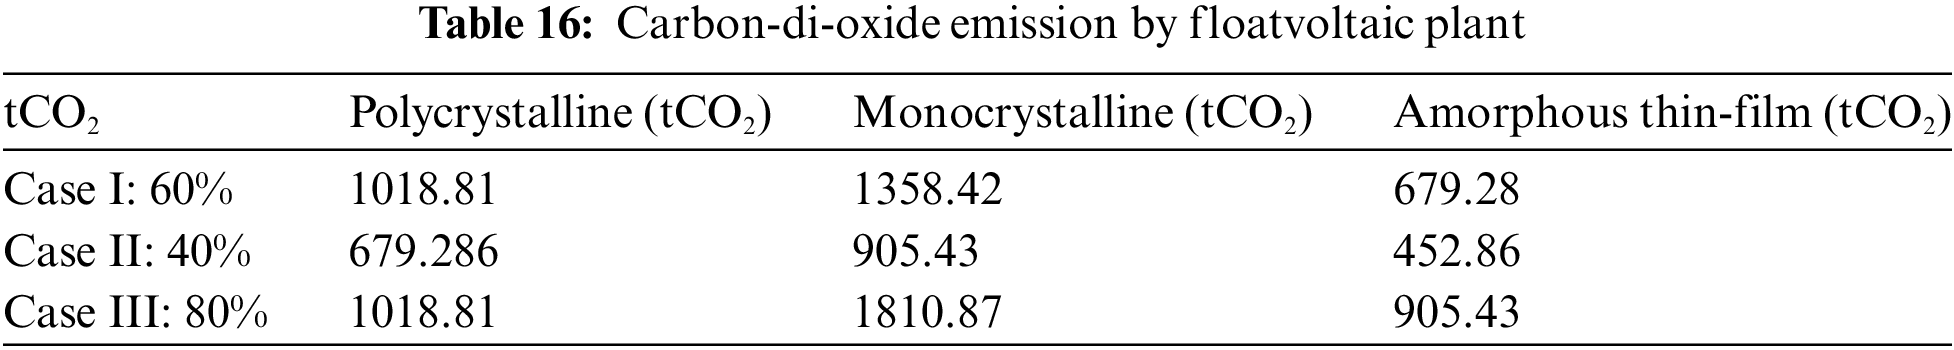
Unlike fossil fuel-based power plants, PV plants do not directly emit carbon dioxide (CO2) during their operation. In trials, PV systems emitting 30–317 g/kWh of CO2 yielded associated energy [37]. This is because they utilize a clean and renewable energy source, the sun, to produce electricity. However, it’s essential to consider the entire life cycle of a PV plant, including the production of solar panels, their installation, maintenance, and eventual decommissioning. CO2 emissions associated with a PV plant mainly arise from the energy-intensive manufacturing processes of solar panels, transportation, and construction activities. Based on the Tables 15–17 below, it is evident that CO2 emissions generally increase with higher scenario percentages. In terms of panel types, both polycrystalline and monocrystalline panels have higher emissions compared to amorphous thin film panels across all scenarios. Considering the goal of minimizing CO2 emissions in the case of forest photovoltaics, Case II with a 40% scenario for amorphous thin film appears to be the most suitable choice with 179.01 tCO2 emissions. Similarly, CO2 emissions generally increase as the scenario percentage increases. Among panel types, both polycrystalline and monocrystalline panels exhibit higher emissions than amorphous thin film panels across all scenarios. Considering the objective of minimizing CO2 emissions, Case II with a 40% scenario for Amorphous Thin Film stands out as the most suitable choice, with the lowest emissions for all panel types totaling 452.85 tCO2. Upon comparing the data, it is observed that CO2 emissions generally increase as the scenario percentage rises. Considering the goal of minimizing CO2 emissions, Case II with a 40% scenario for amorphous thin film appears to be the most suitable choice, as it has relatively lower emissions for all panel types, totaling 119.63 tCO2.

Net CO2 Reduction:
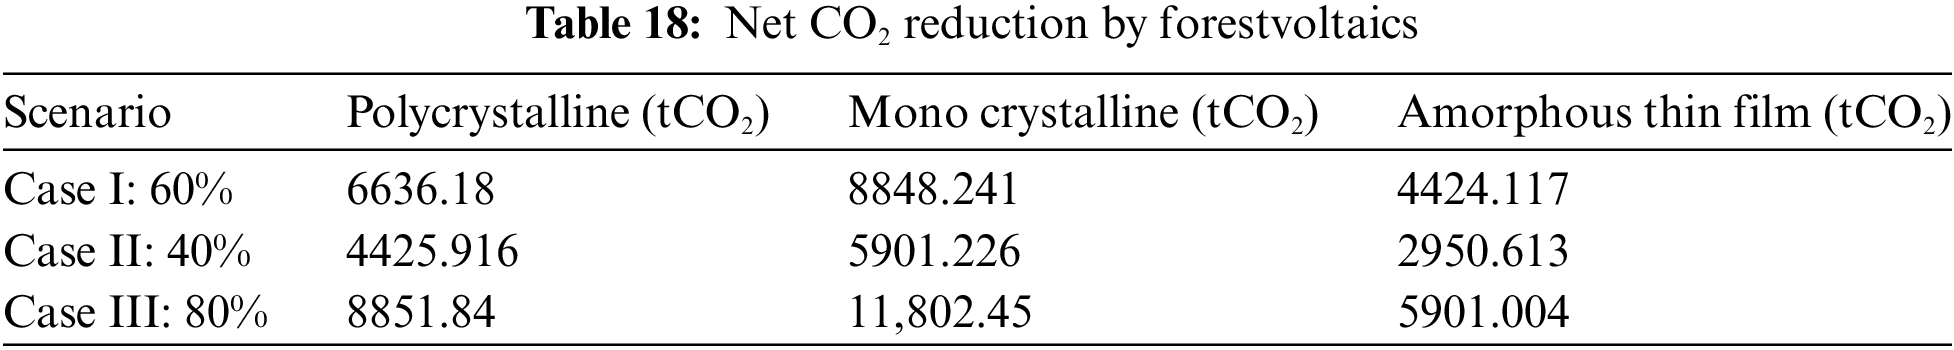
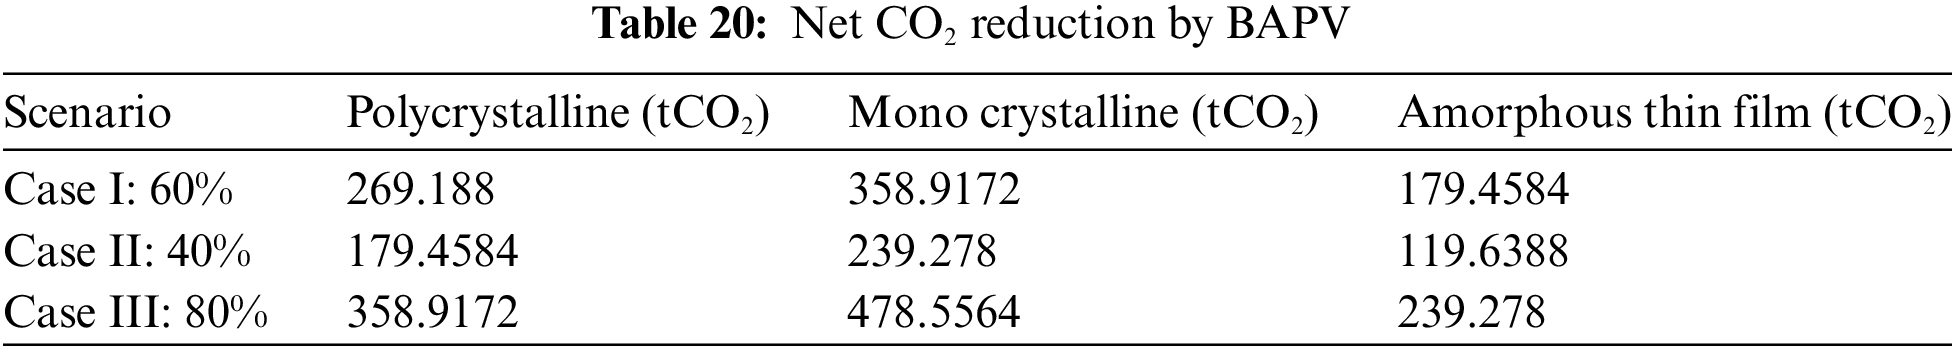
It is noticeable that the reduction of CO2 emissions generally increases as the scenario percentage rises for all panel types. Among the panel technologies as indicated in Tables 18–20 both polycrystalline and monocrystalline panels exhibit higher CO2 emissions reductions than amorphous thin film panels across all scenarios. For instance, in terms of floating solar capacity, the highest value of CO2 emission reduction is 29,834.04 tCO2 from Case III (80%) for monocrystalline solar panels. Similarly, for forest photovoltaics, the highest value for net CO2 emission reduction is observed in monocrystalline panels. Considering the goal of minimizing CO2 emissions, the Case II (40%) scenario of amorphous thin film (7460.816 tCO2) appears to be the most suitable choice as it demonstrates relatively lower emissions for all panel types. To summarize, among the panel types, both polycrystalline and monocrystalline panels exhibit higher CO2 emissions reductions compared to amorphous thin film panels across all scenarios. Considering the goal of minimizing CO2 emissions, the Amorphous Thin Film Case II (40%) scenario appears to be the most suitable choice, as it demonstrates relatively lower emissions for all panel types. Moreover, in the case of floating solar capacity, the highest net CO2 emission reduction value is 29,834.04 tCO2 from Case III (80%) with monocrystalline solar panels.

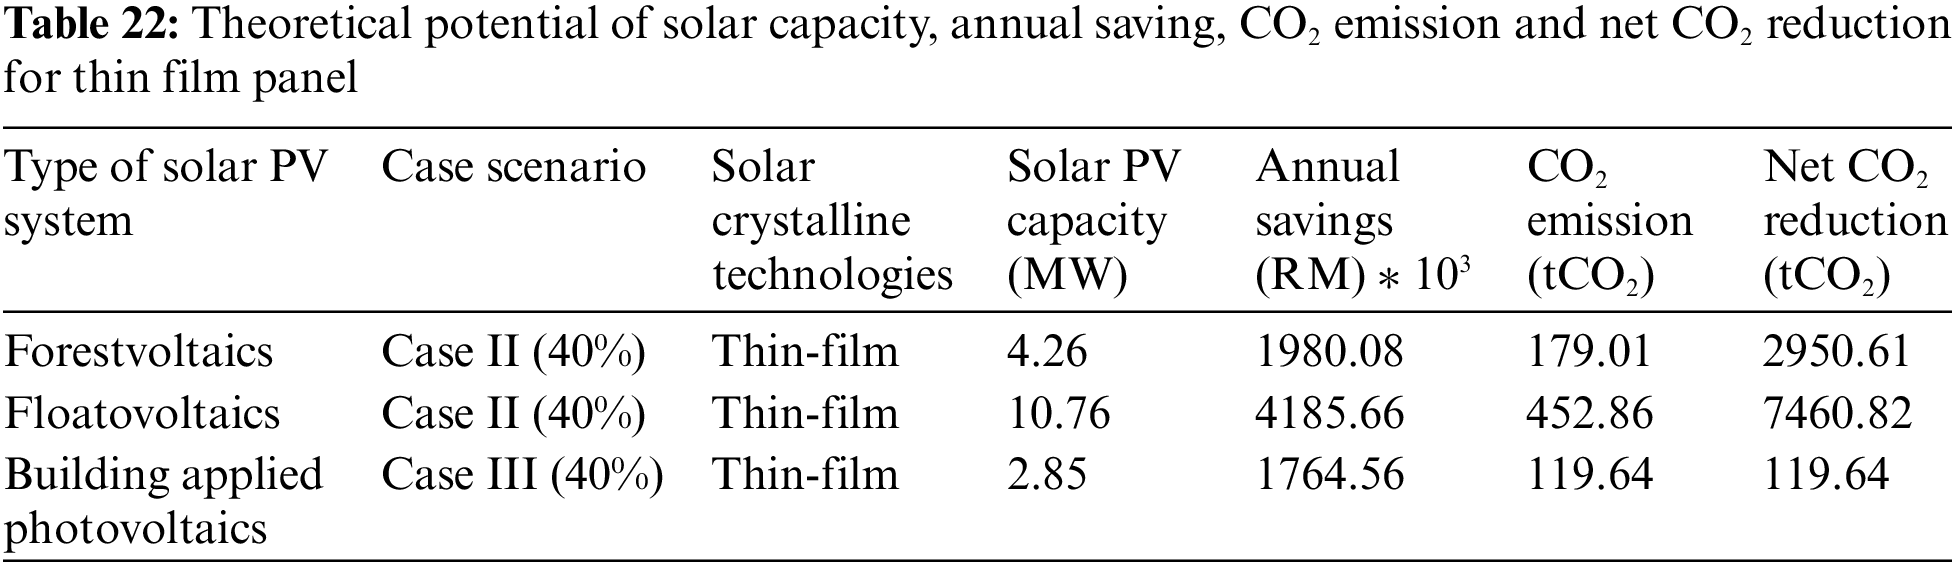
The theoretical potential of solar capacity is depicted in Tables 21 and 22, showcasing solar capacity in megawatts (MW) for different scenarios. These scenarios include floating (323.06 MW), forests (12.77 MW), and buildings (8.54 MW), all utilizing monocrystalline solar panels in Case III (80%). Moving on to annual savings, the highest value is attributed to monocrystalline solar panels in Case III (80%). For the floating scenario, annual savings amount to RM 18,842.07 * 103, while for the forest and building scenarios, the values are RM 37,268.55 * 103 and RM 7418.82 * 103, respectively. However, CO2 emissions from PV plants are at their lowest for all scenarios, specifically with amorphous thin-film solar panels in Case II (40%). The floating scenario emits 452.86 tCO2, while forest and building scenarios emit 179.01 tCO2 and 119.64 tCO2, respectively. Similarly, net CO2 emissions reductions follow the same pattern. For the floating, forest, and building scenarios, net CO2 emissions reductions are 7460.82 tCO2, 2950.61 tCO2, and 119.64 tCO2, respectively, with the use of amorphous thin film solar panels. In Table 23, a polycrystalline solar panel with a scenario of Case I (60%) is utilized across all three scenarios. Here is a breakdown of the results:

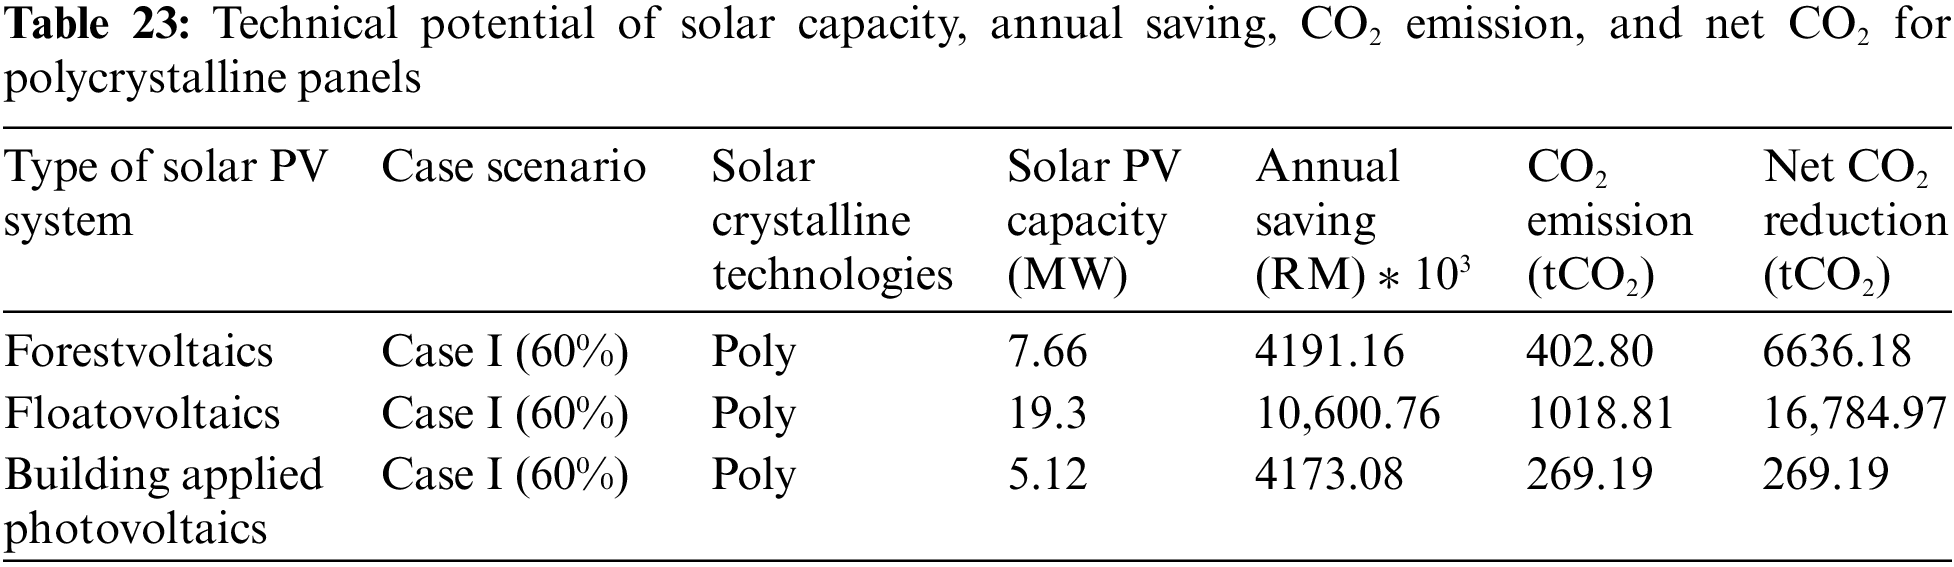
Floating Scenario: This scenario exhibits the highest potential solar capacity of 19.38 MW and the highest annual savings of RM 10,600.76 * 103. However, it also records the highest CO2 emissions from the floating PV plant, totalling 1018.81 tCO2. Despite this, it achieves the highest net CO2 emissions reduction of 16,784.97 tCO2.
Forest Scenario: With a potential solar capacity of 7.66 MW, this scenario has the lowest among the three. Its annual savings amount to RM 4191.16 * 103. However, it registers the highest CO2 emissions from the forests, totalling 402.80 tCO2. Interestingly, it also shows the lowest net CO2 emissions reduction at 6636.18 tCO2.
Building Scenario: Here, the potential solar capacity is the lowest at 5.12 MW, with annual savings of RM 4173.08 * 103. CO2 emissions from the PV plant in this scenario amount to 269.19 tCO2, and the net CO2 emissions also stand at 269.19 tCO2.
These results highlight the varying outcomes across different scenarios, with the floating scenario demonstrating both the highest potential solar capacity and annual savings but also the highest CO2 emissions. On the other hand, the forest scenario exhibits the lowest potential solar capacity but also the highest CO2 emissions from the forests. The building scenario, while having the lowest potential solar capacity, presents relatively lower CO2 emissions compared to the other scenarios.
This study investigated the feasibility of installing solar PV systems at the University Malaysia Pahang Al Sultan Abdullah (UMPSA) Pekan campus. We explored three scenarios with land coverage percentages of 40%, 60%, and 80%, analyzing the potential for forest photovoltaics, floatovoltaics, and building-applied PV (BAPV).
Optimum Scenarios for Each Coverage Ratio:
60% Scenario: Polycrystalline solar panels emerged as the optimal choice for this scenario, offering a balance between high solar PV capacity (due to extensive forest area) and good annual savings (achieved with floatovoltaics, RM 4173.08 ∗ 103). BAPV in this scenario resulted in the lowest CO2 emissions (269.19 tCO2) due to the smaller rooftop area covered.
40% Scenario: Thin film solar panels were most suitable here. Floatovoltaics offered the highest capacity (10.76 MW) and annual savings (RM 4185.66 ∗ 103) as predicted by Helioscope simulations. BAPV, due to its lower capacity, resulted in minimal net carbon dioxide reduction.
80% Scenario: Monocrystalline solar panels performed best. Floatovoltaics again offered the highest capacity (32.3 MW), while forest photovoltaics yielded the most significant annual savings (RM 372,685.55 ∗ 103). However, BAPV still produced the lowest CO2 emissions and net carbon dioxide reduction.
Practical Applications and Limitations:
The study provides valuable insights for implementing solar PV systems in forests, lakes, and buildings, particularly at UMPSA Pekan. However, it is important to acknowledge limitations. Our reliance on assumptions and simulation data introduces uncertainties. Future improvements should address real-world variations to enhance system reliability.
Overall, this research offers valuable data on the potential of forest photovoltaics, floatovoltaics, and BAPV for solar energy generation, annual cost savings, and CO2 emission reduction at UMPSA Pekan.
Acknowledgement: The authors would like to thank the UMPSA Research and Innovation Department for the Post Graduate Research Scheme and the Center for Research in Advanced Fluids and Processes, which aim for research in renewable energy.
Funding Statement: The authors are grateful for the financial support provided by Universiti Malaysia Pahang Al Sultan Abdullah (www.umpsa.edu.my, accessed 10 April 2024) through the Doctoral Research Scheme (DRS) to Mr. Rittick Maity and the Postgraduate Research Scheme (PGRS220390).
Author Contributions: Conceptualization, Rittick Maity, Kumarasamy Sudhakar and Muhammad Khairul Imran bin Ahmad Shuhaimi; Resources,Muhammad Khairul Imran bin Ahmad Shuhaimi; Writing—original draft, Rittick Maity; Supervision, Kumarasamy Sudhakar and Amir Abdul Razak; Funding acquisition, Kumarasamy Sudhakar; Writing—editing, Rittick Maity and Kumarasamy Sudhakar. All authors reviewed the results and approved the final version of the manuscript.
Availability of Data and Materials: Data and material sharing are not applicable.
Conflicts of Interest: The authors declare they have no conflicts of interest to report regarding the present study.
References
1. N. Manoj Kumar, K. Sudhakar, and M. Samykano, “Techno-economic analysis of 1 MWp grid connected solar PV plant in Malaysia,” Int. J. Ambient Energy, vol. 40, no. 4, pp. 434–443, May 2019. doi: 10.1080/01430750.2017.1410226. [Google Scholar] [CrossRef]
2. F. Minelli, I. Ciriello, F. Minichiello, and D. D’Agostino, “From net zero energy buildings to an energy sharing model-The role of NZEBs in renewable energy communities,” Renew Energy, vol. 223, pp. 120110, Mar. 2024. doi: 10.1016/j.renene.2024.120110. [Google Scholar] [CrossRef]
3. F. Hasheminia, Y. Bahari, A. Rajabpour, and S. Arabha, “Elucidation of thermo-mechanical properties of silicon nanowires from a molecular dynamics perspective,” Comput Mater Sci., vol. 200, pp. 110821, Dec. 2021. doi: 10.1016/j.commatsci.2021.110821. [Google Scholar] [CrossRef]
4. G. Kadim and R. Masrour, “First-principles investigation of electronic and optical properties of Fe doped in CsBrO3 for enhanced photocatalytic hydrogen production,” Int. J. Hydrogen Energy, vol. 47, no. 61, pp. 25522–25530, Jul. 2022. doi: 10.1016/j.ijhydene.2022.06.008. [Google Scholar] [CrossRef]
5. D. B. Um, “Exploring the operational potential of the forest-photovoltaic utilizing the simulated solar tree,” Sci Rep, vol. 12, no. 1, pp. 134, Dec. 2022. doi: 10.1038/s41598-022-17102-5. [Google Scholar] [PubMed] [CrossRef]
6. B. Janapati, N. R. Pulivarthi, S. R. Sura, J. Balaji, P. N. Rao and S. S. Rao, “Solar tree with different installation positions of photovoltaic module—Part 2,” J. Green Eng., vol. 10, no. 9, pp. 4639–4656, 2020. [Google Scholar]
7. F. Hyder, K. Sudhakar, and R. Mamat, “Solar PV tree design: A review,” Renew. Sustain. Energy Rev., vol. 82, pp. 1079–1096, 2018. doi: 10.1016/j.rser.2017.09.025. [Google Scholar] [CrossRef]
8. Q. S. Rocha, R. A. Munis, R. B. G. da Silva, E. W. Z. Aguilar, and D. Simões, “Photovoltaic solar energy in forest nurseries: A strategic decision based on real options analysis,” Sustainability, vol. 15, no. 5, pp. 3960, Mar. 2023. doi: 10.3390/su15053960. [Google Scholar] [CrossRef]
9. A. Goswami, P. Sadhu, U. Goswami, and P. K. Sadhu, “Floating solar power plant for sustainable development: A techno-economic analysis,” Env. Prog. and Sustain Energy, vol. 38, no. 6, pp. e13268, Nov. 2019. doi: 10.1002/ep.13268. [Google Scholar] [CrossRef]
10. D. Sen, P. Sharma, and B. Muni, “Design parameters of 10 KW floating solar power plant,” Int. Adv. Res. J. Sci., vol. 2, no. 1, 2015. doi: 10.17148/IARJSETP10. [Google Scholar] [CrossRef]
11. C. D. Zomer, M. R. Costa, A. Nobre, and R. Rüther, “Performance compromises of building-integrated and building-applied photovoltaics (BIPV and BAPV) in Brazilian airports,” Energy Build., vol. 66, pp. 607–615, 2013. doi: 10.1016/j.enbuild.2013.07.076. [Google Scholar] [CrossRef]
12. F. Minelli, D. D. Agostino, M. Migliozzi, F. Minichiello, and P. D. Agostino, “PhloVer: A modular and integrated tracking photovoltaic shading device for sustainable large urban spaces—Preliminary study and prototyping,” Energies, vol. 16, no. 15, pp. 5786, Aug. 2023. doi: 10.3390/en16155786. [Google Scholar] [CrossRef]
13. W. Zhang, Y. Zhang, Z. Li, Z. Zheng, R. Zhang and J. Chen, “A rapid evaluation method of existing building applied photovoltaic (BAPV) potential,” Energy Build., vol. 135, no. 11, pp. 39–49, Jan. 2017. doi: 10.1016/j.enbuild.2016.11.012. [Google Scholar] [CrossRef]
14. P. Reddy, M. V. N. Surendra Gupta, S. Nundy, A. Karthick, and A. Ghosh, “Status of BIPV and BAPV system for less energy-hungry building in India—A review,” Applied Sciences, vol. 10, no. 7. pp. 2337, Apr. 01, 2020. doi: 10.3390/app10072337. [Google Scholar] [CrossRef]
15. A. Pestisha, Z. Gabnai, A. Chalgynbayeva, P. Lengyel, and A. Bai, “On-farm renewable energy systems: A systematic review,” Energies, vol. 16, no. 2. pp. 862, 2023. doi: 10.3390/en16020862. [Google Scholar] [CrossRef]
16. E. Bellini, “Solar tree-based photovoltaic plants for mountainous areas,” 2022. Accessed: May 21, 2024. [Online]. Available: https://www.pv-magazine.com/2022/07/29/solar-tree- based-photovoltaic-plants-for-mountainous-areas/ [Google Scholar]
17. Y. Zhang and Q. S. Jia, “Operational optimization for microgrid of buildings with distributed solar power and battery,” Asian J. Control, vol. 19, no. 3, pp. 996–1008, May 2017. doi: 10.1002/asjc.1424. [Google Scholar] [CrossRef]
18. Y. Farja and M. Maciejczak, “Economic implications of agricultural land conversion to solar power production,” Energies, vol. 14, no. 19, pp. 6063, Oct. 2021. doi: 10.3390/en14196063. [Google Scholar] [CrossRef]
19. R. Maity, K. Sudhakar, A. Abdul Razak, A. Karthick, and D. Barbulescu, “Agrivoltaic: A strategic assessment using SWOT and TOWS matrix,” Energies, vol. 16, no. 8, pp. 3313, Apr. 2023. doi: 10.3390/en16083313. [Google Scholar] [CrossRef]
20. G. Scarascia-Mugnozza, H. Oswald, P. Piussi, and K. Radoglou, “Forests of the Mediterranean region: Gaps in knowledge and research needs,” For. Ecol. Manage., vol. 132, no. 1, pp. 97–109, 2000. doi: 10.1016/S0378-1127(00)00383-2. [Google Scholar] [CrossRef]
21. A. Ameray, Y. Bergeron, O. Valeria, M. Montoro Girona, and X. Cavard, “Forest carbon management: A review of silvicultural practices and management strategies across boreal, temperate and tropical forests,” Curr. For. Rep., vol. 7, no. 4, pp. 245–266, Dec. 01, 2021. doi: 10.1007/s40725-021-00151-w. [Google Scholar] [CrossRef]
22. O. Ahmed and M. Tariq Iqbal, “Design of a solar water pumping system for Sukkur, Pakistan,” Mar. 2023. Accessed: Jan. 11, 2024. [Online]. Available: https://www.researchgate.net/publication/366200933 [Google Scholar]
23. A. K. Roy and S. Dutta, “Solar water pumping system design and analysis—A numerical study at Dum Dum, Kolkata,” in Appl. Comput. Mech. Engi., 2023, pp. 187–200. doi: 10.1007/978-981-19-6032-1_15/COVER. [Google Scholar] [CrossRef]
24. W. Lytle et al., “Conceptual design and rationale for a new agrivoltaics concept: Pasture-raised rabbits and solar farming,” J. Clean. Prod., vol. 282, no. 6, pp. 124476, 2021. doi: 10.1016/j.jclepro.2020.124476. [Google Scholar] [CrossRef]
25. Water Supplies Department, “Dedications in application of renewable energy,” 2023. Accessed: Jun. 17, 2024. [Online]. Available: https://www.wsd.gov.hk/ecoexpoasia2023/index-en.html#ss3 [Google Scholar]
26. S. Rangaraju, P. Le Vo Ho Chi, and K. Vinh Nguyen, “Harvest the sun on water: A review on floating photovoltaic solution for Vietnam,” 2021. Accessed: Dec. 15, 2023. [Online]. Available: https://www.researchgate.net/publication/349947866 [Google Scholar]
27. A. Sahu, N. Yadav, and K. Sudhakar, “Floating photovoltaic power plant: A review,” Renew. Sustain. Energy Rev., vol. 66, pp. 815–824, Dec. 01, 2016. doi: 10.1016/j.rser.2016.08.051. [Google Scholar] [CrossRef]
28. A. Allouhi et al., “PV water pumping systems for domestic uses in remote areas: Sizing process, simulation and economic evaluation,” Renew. Energy, vol. 132, no. S1, pp. 798–812, Mar. 2019. doi: 10.1016/j.renene.2018.08.019. [Google Scholar] [CrossRef]
29. M. Temiz and N. Javani, “Design and analysis of a combined floating photovoltaic system for electricity and hydrogen production,” Int. J. Hydrogen Energy, vol. 45, no. 5, pp. 3457–3469, Jan. 2020. doi: 10.1016/j.ijhydene.2018.12.226. [Google Scholar] [CrossRef]
30. C. N. Wang, N. A. T. Nguyen, T. T. Dang, and J. Bayer, “A two-stage multiple criteria decision making for site selection of solar photovoltaic (PV) power plant: A case study in Taiwan,” IEEE Access, vol. 9, pp. 75509–75525, 2021. doi: 10.1109/ACCESS.2021.3081995. [Google Scholar] [CrossRef]
31. M. Cullinane, F. Judge, M. O'Shea, K. Thandayutham, and J. Murphy, “Subsea superconductors: The future of offshore renewable energy transmission?” Renew. Sustain. Energy Rev., vol. 156, pp. 111943, Mar. 01, 2022. doi: 10.1016/j.rser.2021.111943. [Google Scholar] [CrossRef]
32. S. Bernet, “Recent developments of high power converters for industry and traction applications,” IEEE Transact. Power Elec., vol. 15, no. 6, pp. 1102–1117, Nov. 2000. doi: 10.1109/63.892825. [Google Scholar] [CrossRef]
33. Brian, “Off-grid or on-grid PV systems: Which to choose?” 2022. Accessed: Jun. 17, 2024. [Online]. Available: https://www.maysunsolar.com/off-grid-or-on-grid-pv-systems/ [Google Scholar]
34. E. Biyik et al., “A key review of building integrated photovoltaic (BIPV) systems,” Eng. Sci. Technol. Int J., vol. 20, no. 3, pp. 833–858, 2017. doi: 10.1016/j.jestch.2017.01.009. [Google Scholar] [CrossRef]
35. D. H. W. Li, S. K. H. Chow, and E. W. M. Lee, “An analysis of a medium size grid-connected building integrated photovoltaic (BIPV) system using measured data,” Energy Build., vol. 60, no. 7, pp. 383–387, 2013. doi: 10.1016/j.enbuild.2013.02.007. [Google Scholar] [CrossRef]
36. P. Denholm, “Solar energy and capacity value solar energy can provide valuable capacity to utilities and power system operators coincidence of solar energy with electricity demand patterns,” 2023. Accessed: Nov. 15, 2023. [Online]. Available: https://www.nrel.gov/ [Google Scholar]
37. E. A. Alsema, N. H. Reich, W. G. J. H. M. Van Sark, and E. Nieuwlaar, “CO2 emissions of PV in the perspective of a renewable energy economy,” 2007. Accessed: Nov. 4, 2023. [Online]. Available: https://www.researchgate.net/publication/228769572 [Google Scholar]
Cite This Article
 Copyright © 2024 The Author(s). Published by Tech Science Press.
This work is licensed under a Creative Commons Attribution 4.0 International License , which permits unrestricted use, distribution, and reproduction in any medium, provided the original work is properly cited.
 Downloads
 Citation Tools