
 Submit a Paper
 Propose a Special lssue
 Open Access
ARTICLE

Enhancing Autonomy Capability in Regional Power Grids: A Strategic Planning Approach with Multiple Autonomous Evaluation Indexes
1 Planning and Assessment Center Department, State Grid Henan Economic Research Institute, Zhengzhou, 450000, China
2 Key Laboratory of Modern Power System Simulation and Control & Renewable Energy Technology, Ministry of Education, Northeast Electric Power University, Jilin, 132012, China
3 Development Planning Department, State Grid Henan Electric Power Company, Zhengzhou, 450000, China
4 Innovation Development Research Center, State Grid Shanghai Energy Internet Research Institute Co., Ltd., Shanghai, 201210, China
5 State Grid Simulation Center, China Electric Power Research Institute Co., Ltd., Beijing, 100192, China
* Corresponding Author: Junhui Li. Email:
Energy Engineering 2024, 121(9), 2449-2477. https://doi.org/10.32604/ee.2024.051244
Received 01 March 2024; Accepted 24 May 2024; Issue published 19 August 2024
 View Full Text
 Download PDF
Abstract
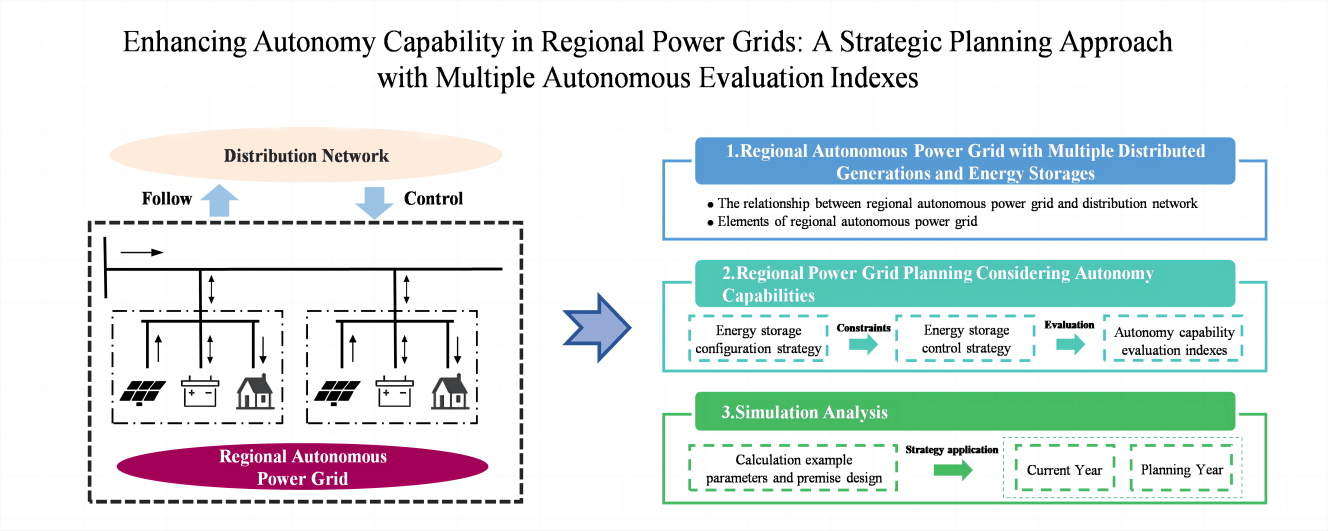
After the integration of large-scale Distributed Generation (DG) into the distribution network, the randomness and volatility of its output result in a reduction of spatiotemporal alignment between power generation and demand in the distribution network, exacerbating the phenomenon of wind and solar power wastage. As a novel power system model, the fundamental concept of Regional Autonomous Power Grids (RAPGs) is to achieve localized management and energy autonomy, thereby facilitating the effective consumption of DGs. Therefore, this paper proposes a distributed resource planning strategy that enhances the autonomy capabilities of regional power grids by considering multiple evaluation indexes for autonomy. First, a regional Energy Storage (ES) configuration strategy is proposed. This strategy can select a suitable reference value for the upper limit of ES configuration based on the regional load and DG output to maximize the elimination of source load deviations in the region as the upper limit constraint of ES capacity. Then, a control strategy for regional ES is proposed, the charging and discharging reference line of ES is set, and multiple autonomy and economic indexes are used as objective functions to select different proportions of ES to control the distributed resources of the regional power grid and establish evaluation indexes of the internal regional generation and load power ratio, the proportion of power supply matching hours, new energy consumption rate and tie line power imbalance outside the region to evaluate changes in the regional autonomy capabilities. The final simulation results show that in the real regional grid example, the planning method in the planning year in the region of the overall power supply matching hour ratio and new energy consumption rate increased by 3.9% and 4.8% on average, and the power imbalance of the tie line decreased by 7.8% on average. The proposed planning approach enables the maximization of regional autonomy while effectively smoothing the fluctuation of power exchange between the regional grid and the higher-level grid. This presents a rational and effective planning solution for the regional grid, facilitating the coordinated development between the region and the distribution network.Graphic Abstract
Keywords
Under the guidance of the “dual carbon” policy, China’s distributed energy resources have developed rapidly. As of the end of 2023, the installed capacity of renewable energy has reached 965 million kilowatts, accounting for 34.56% of the country’s total power generation. However, due to the uncertainty of DG output [1–3], when it is connected to the distribution network on a large scale, it will bring great challenges to the reliable and efficient operation of the distribution network [4–6], resulting in a reduction in the source-load spatiotemporal matching of the distribution network, and lead to the intensification of the abandonment of wind and light in the distribution network, and the subsequent decline in the consumption rate of new energy [7–9], affecting the economic and reliable operation of the power system. To solve a series of problems caused by DG on the distribution network, the current mainstream method is to introduce distributed energy storage (DES) to assist in regulating it. However, due to the complex structure of the distribution network, which is connected to multiple power sources and supplies power to multiple areas, multiple factors need to be considered when configuring ES. Therefore, selecting the optimal DES planning scheme considering multiple factors in the distribution network is an urgent issue that needs to be addressed.
The planning of DES is closely associated with the operational performance of the distribution network, and numerous scholars have conducted relevant research on the planning of DES in distribution networks considering various influencing factors. Reference [10] starts from the perspective of reducing the cost of ES configuration in the distribution network and proposed a multi-time scale capacity configuration optimization method for ES equipment deployment. Based on the uncertainty of photovoltaic (PV) power generation, reference [11] uses kernel density estimation to fit the distribution of the maximum capacity demand of the energy storage system (ESS), and calculates the power and capacity of the ES unit at different confidence levels, proposing the optimal ES configuration of PV power plants. Based on Monte Carlo simulation, reference [12] establishes a statistically significant ES configuration for deviation loads during wind farm operation, using indexes such as the net present value NPV over the entire lifespan and the payback period PBP. In reference [13], the objective functions are set to minimize the system’s lifecycle cost and minimize the loss of renewable energy, utilizing a normalized Gaussian constraint method to determine the optimal configuration of ES. Reference [14] proposes a high-proportion PV distribution network ES configuration optimization method that considers source load imbalance clustering. Reference [15] considering tiered carbon trading and time-of-use electricity prices. Different ES planning schemes are proposed for various flexibility enhancement stages. Reference [16] proposes a dual-layer capacity optimization model for wind-solar-battery bundled dispatch systems, taking into account ES lifespan considerations. The upper layer aims to minimize the total system cost, while the lower layer optimizes capacity configuration to minimize typical daily dispatch costs. In reference [17], a DES configuration method is proposed to maximize the benefits of distributed photovoltaic (DPV) energy distribution and storage, thereby promoting the integration of DPVs throughout the region. Reference [18] uses the empirical mode decomposition algorithm to decompose the target power of a multi-unit hybrid ESS and obtain the optimal capacity configuration of ES units. Reference [19] introduces a dual-functional control method for grid planning of vehicle fuel cells. This planning strategy effectively reduces harmonic pollution and significantly enhances the stability and reliability of the grid.
In current research, only a few scholars have introduced the concept of RAPG into the configuration and control of ESSs. RAPG serves as a necessary complement to distribution networks, aiming to achieve energy self-sufficiency within a region. This concept contributes to maximizing the economic benefits of distributed energy resources and ensuring the continuous safe and reliable operation of distribution networks. In reference [20], a peak shaving scheme for ES in regional power grids is proposed, which takes into account multiple evaluation metrics, enhancing the economic efficiency and reliability within the regional grid.
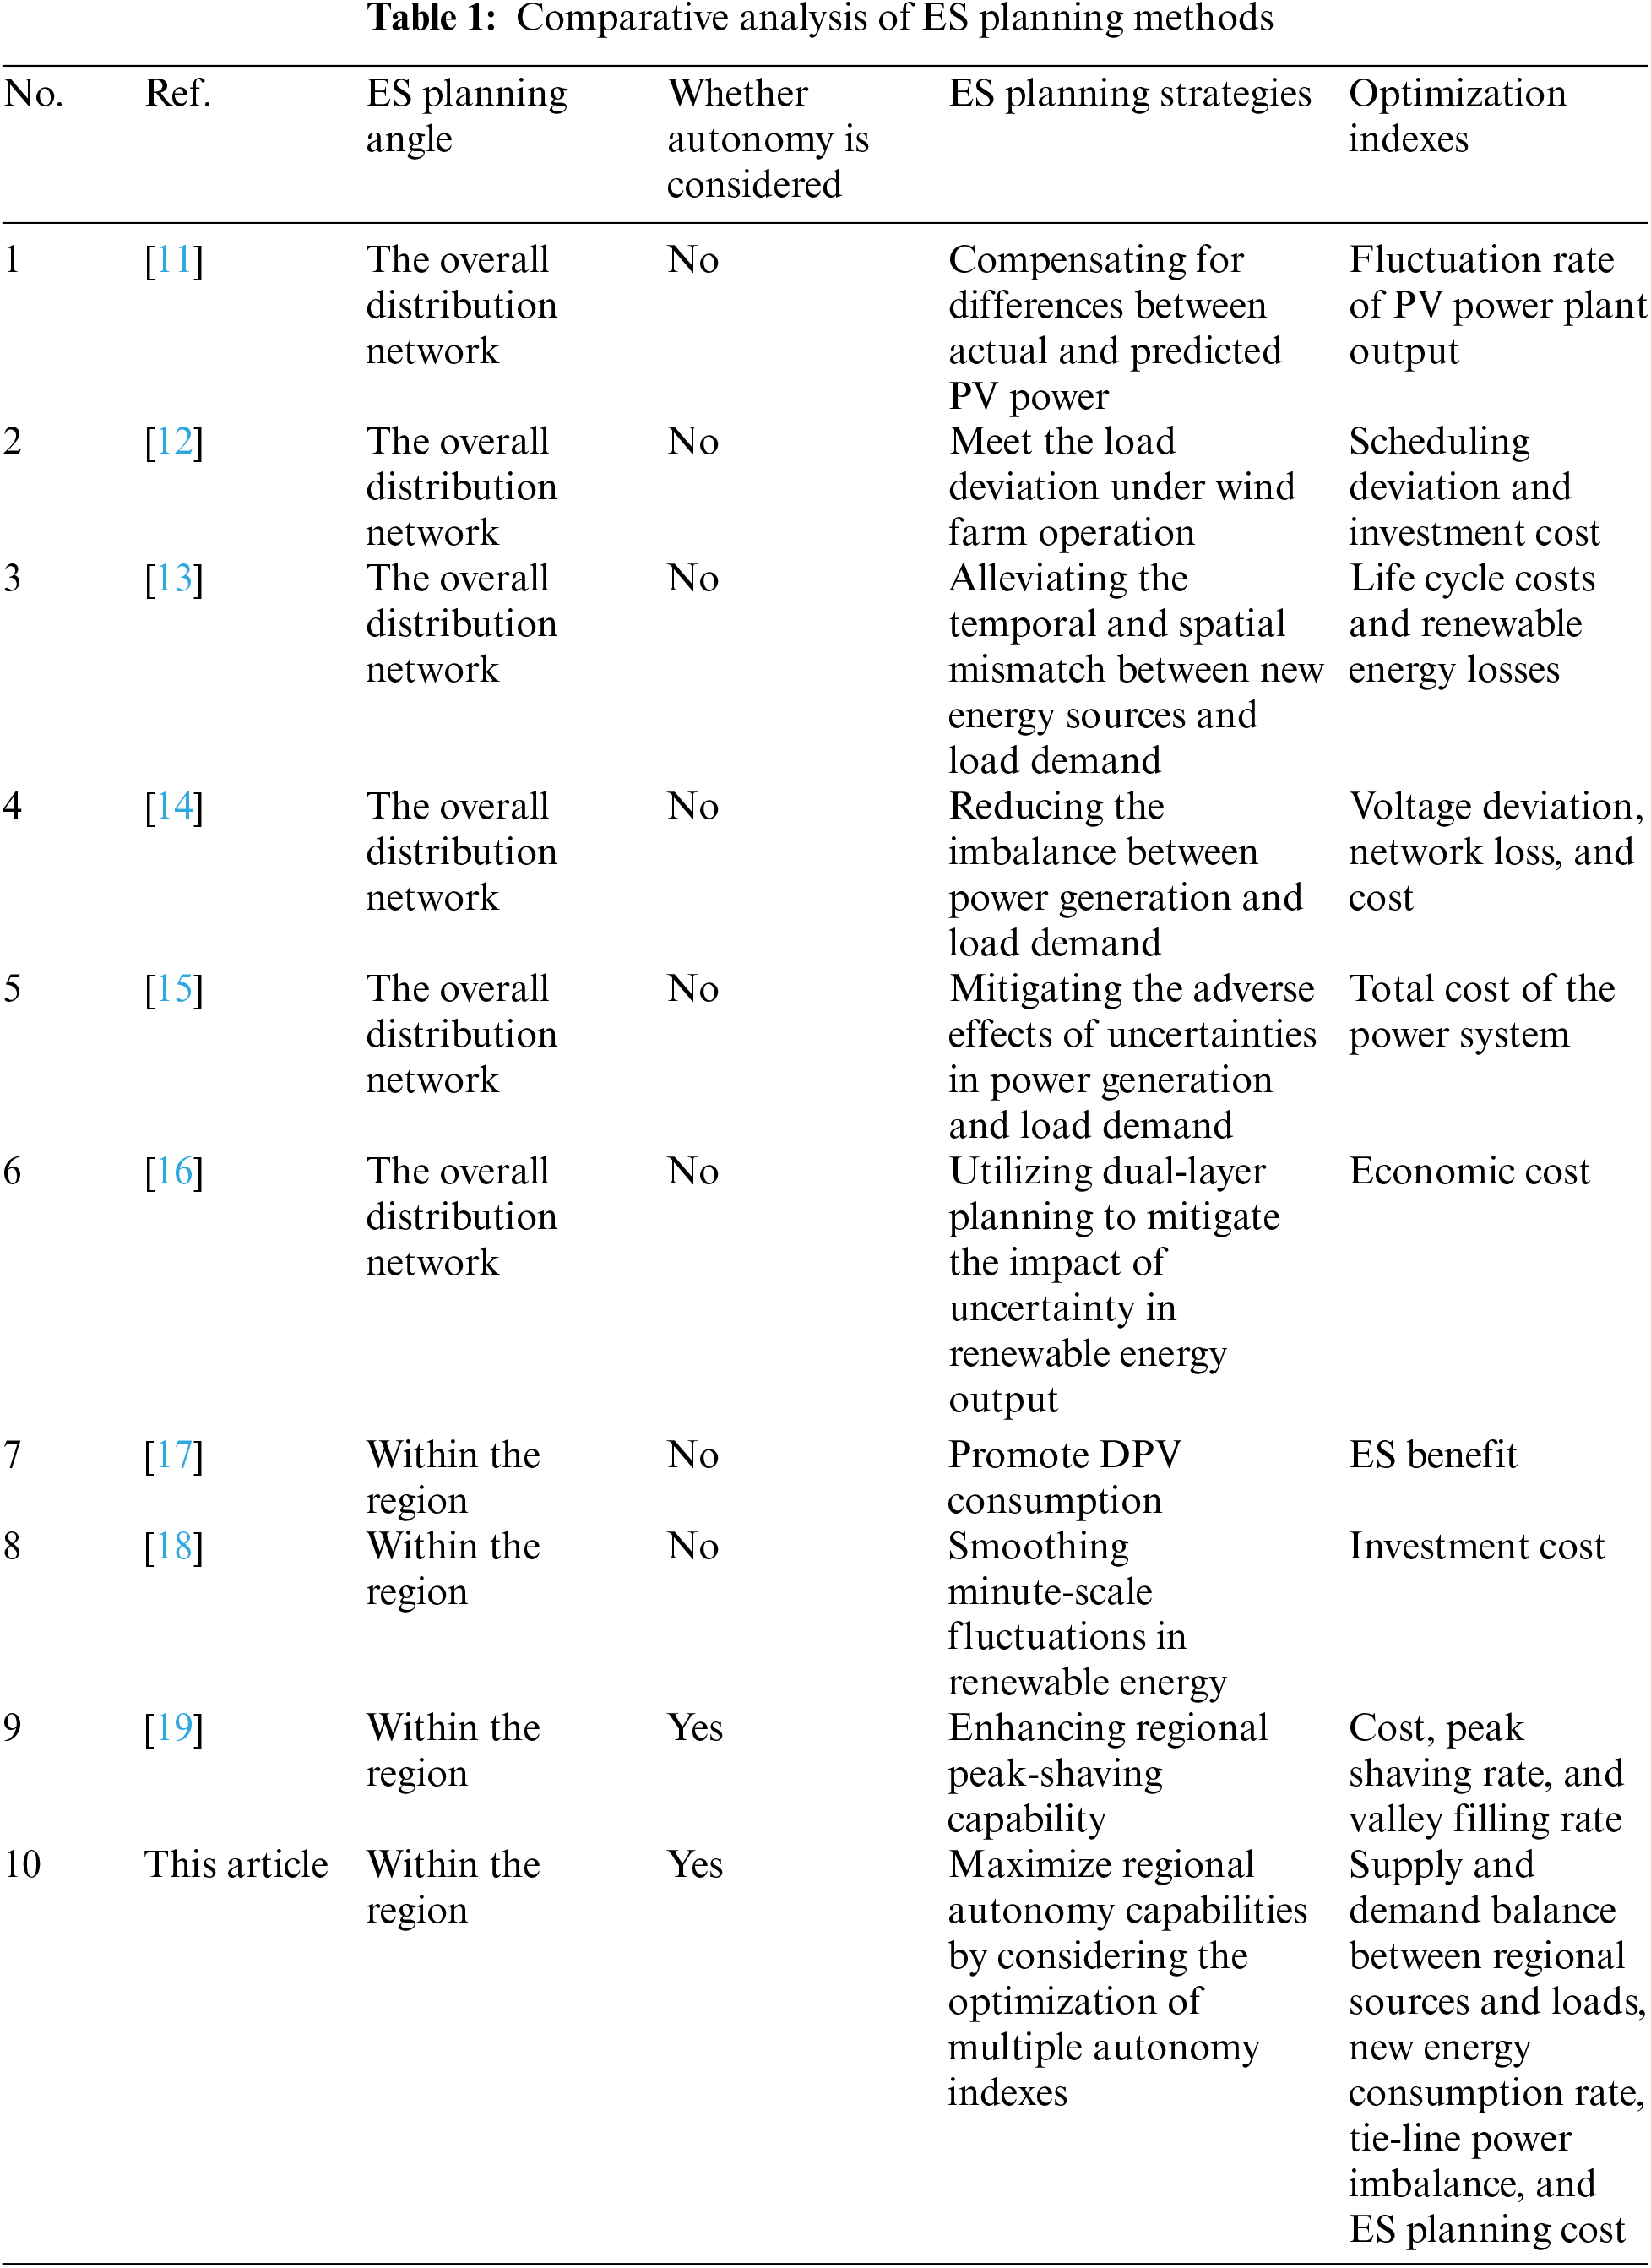
As shown in Table 1, in the existing research on ES planning methods, a relatively mature ES planning system has been developed, mostly considering various factors from the perspective of the overall distribution network. However, different regions possess distinct resource characteristics and operational capabilities. By fully considering the energy distribution and load demand factors within each region, it is possible to optimize the grid structure and ES layout more effectively, thereby achieving a more efficient and flexible energy supply system. Therefore, research focusing on ES planning from the perspective of different regional characteristics to enhance regional autonomy is crucial for improving the consumption of distributed power sources and the security and reliability of distribution networks.
Whether the ES planning strategy can solve a series of problems caused by the integration of large-scale distributed power sources into the distribution network, most domestic and foreign scholars have verified its effectiveness by establishing evaluation indexes currently. Reference [21] designs an overall evaluation framework, proposes comprehensive evaluation indexes, and promotes the optimal configuration of power system resources. Reference [22] studies the evaluation index system of distribution network configuration schemes under different operating conditions and constructs indexes such as power supply capacity, power supply reliability, voltage quality, and economy to provide reasonable suggestions for adjusting the power grid structure. Reference [23] considers and proposes new reliability flexibility indexes for high-proportion new energy power systems and applies the Monte Carlo method to evaluate the reliability flexibility indexes under high-proportion new energy sources. Reference [24] explains the problems caused by the high penetration rate of new energy, proposes indexes such as system balance and adjustment capabilities, system safety margin, and system operation cost, and provides an evaluation system for whether the power system operates safely and stably. Reference [25] uses three major indexes such as grid strength, grid efficiency, and grid low carbon to form the main evaluation system of regional power grids, and uses the entropy method to evaluate and analyze regional power grid development indexes. In the current research, the overall evaluation index of the distribution network has been considered relatively comprehensively, which mainly includes power supply reliability, system safe operation capability, and system operation cost. However, few kinds of literature comprehensively consider autonomy indexes such as supply and demand balance indexes, source-load spatiotemporal matching indexes, new energy consumption rates, and tie line power imbalance rates in the electricity dimension from the perspectives of different regions.
In summary, Table 1 analyzes the application of ES technologies in integrating large-scale distributed power sources into the distribution grid. Most studies focus on the overall distribution grid, overlooking the importance of regional grid ES planning in enhancing the overall safety of the distribution network and neglecting the autonomous characteristics of regions. Regarding the establishment of evaluation criteria, references [21–25] predominantly consider the overall benefits of the distribution grid, failing to adequately address the varying power operation conditions within individual sub-regions.
Therefore, in response to the above problems, the main purpose of this study is to maximize regional autonomy through ES planning under the consideration of multiple autonomy evaluation indexes while taking into account the coordinated development of the distribution network. Due to a series of adverse effects brought by DG, according to the situation of distributed resources in different areas of the distribution network, this paper can maximize the regional autonomy capability and economic benefits through the proposed regional power grid autonomy improvement strategy and evaluation system. It promotes the balance of power supply and demand in the region and the effective consumption of DG, and can effectively smooth the interactive fluctuation rate of tie-line power between the regional power grid and the upper-level power grid, and promote a more coordinated development between the region and the distribution network. The highlights of this paper hold three points:
1. This paper proposes an ES configuration strategy based on distributed resources in regional power grids. This configuration strategy can effectively target the situation of distributed resources in different regional power grids obtain reference values suitable for the upper limit of configuration in each region, and reduce the calculation amount of capacity selection optimal solution during ES control.
2. An ES control strategy is proposed to improve regional autonomy. This control strategy constructs an ES charge and discharge reference line. Through the control of ES, the power of the tie line can be stabilized on the reference line to the greatest extent, and at the same time, the source-charge balance within the region can be balanced and improve the economic benefits of the planning scheme.
3. This paper constructs multiple regional autonomy evaluation indexes, the construction of the autonomy index in this paper fully considers the evaluation of changes in autonomy capabilities within the region and also takes into account the evaluation of interactive fluctuations between the region and the upper-level power grid. Specifically, it encompasses indexes such as regional generation and load power ratio, the proportion of hours with matching regional power supply, the rate of new energy consumption at a regional level, tie-line power imbalance, and other evaluation indexes.
The remainder of this paper is organized as follows: Chapter 2 mainly analyzes the structure of RAPG. Chapter 3 designs an optimization method for RAPG planning proposes ES configuration and control strategies to maximize the regional autonomy capability; and constructs an autonomy evaluation index to evaluate the effectiveness of RAPG planning. Chapter 4 uses the calculation example system to analyze the results obtained.
2 RAPG with Multiple DGs and ESs
To reduce the influence of high-permeability DG access on the distribution network, this paper establishes the distribution network structure diagram including the RAPG, as shown in Fig. 1 below. The RAPG described in this paper is a special form that appears after the load and storage elements of the source network of the distribution power grid have developed to a certain extent. It refers to the local autonomous system with clear physical boundaries and self-balance, self-management, and self-adjustment capabilities, which can fully perceive the elements of power, power grid, load, and ES. Internal self-management through the control center, external and power grid dispatching based on the power exchange curve or cumulative exchange of electricity for regulation and management, showing “external single controllability, internal close autonomy.” The RAPG mainly includes DGs, ESs, and conventional loads. Define Ps as the amount of power supplied by the upper-level power grid to the distribution network. Ps ≥ 0 means that the power flow direction is the reference direction in the figure. Ps < 0 means that the power in the distribution network is sent back to the upper-level power grid.
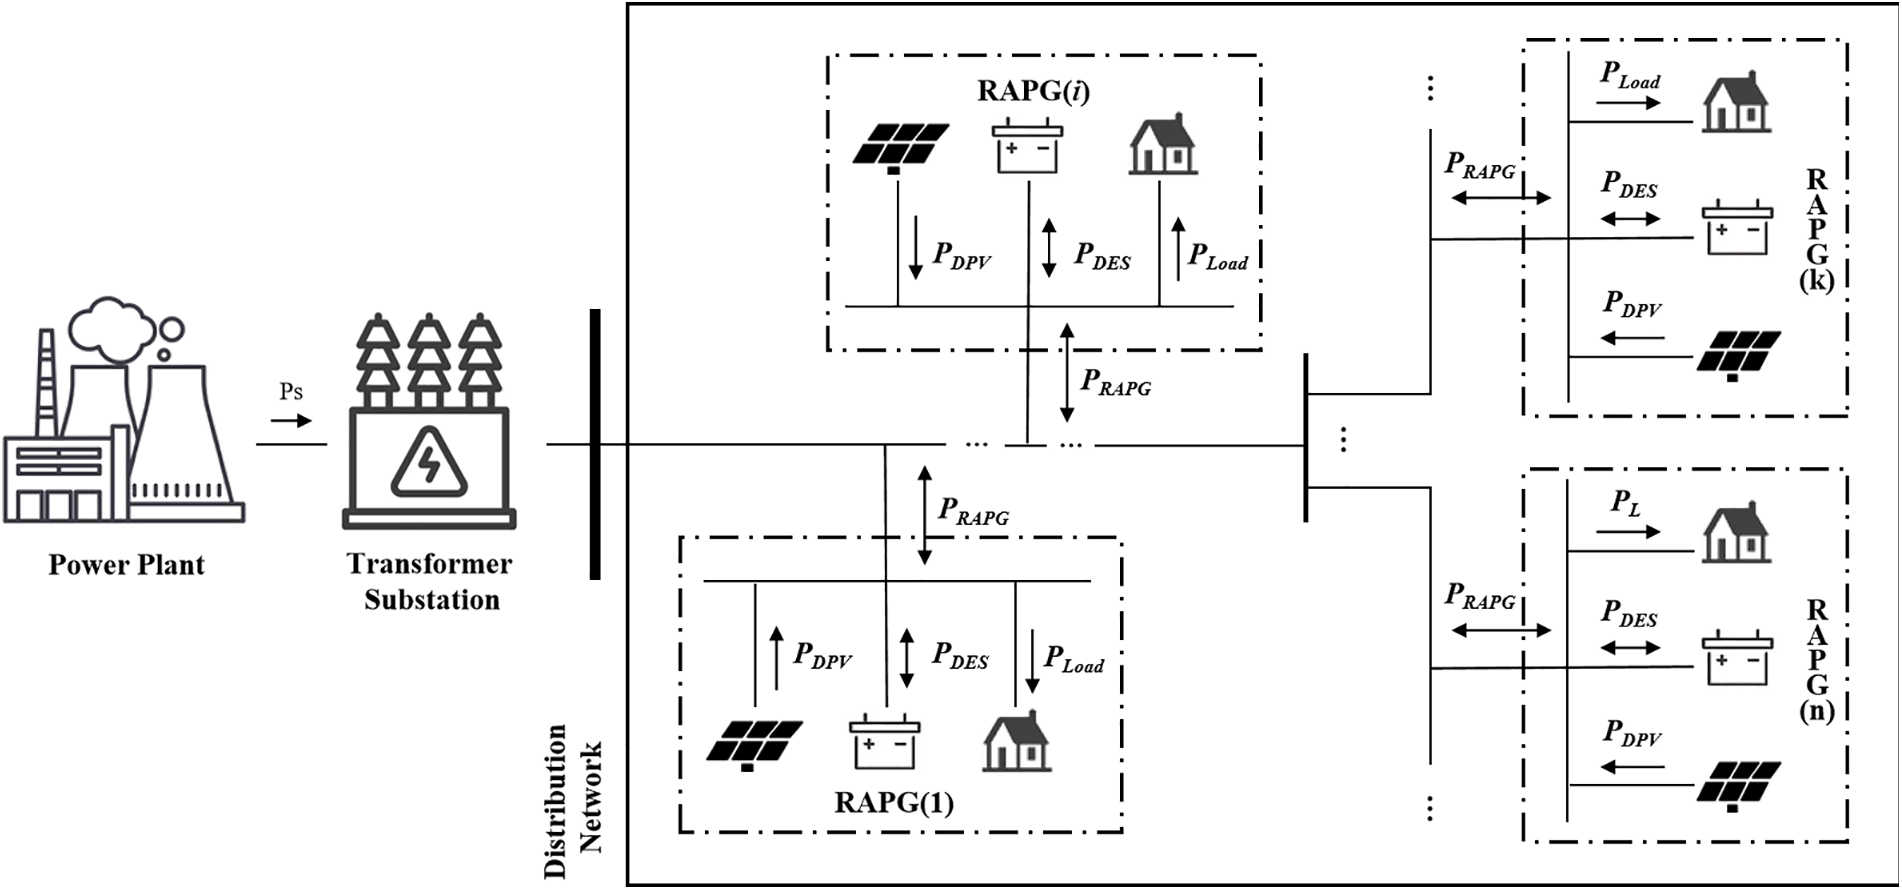
Figure 1: Schematic diagram of the distribution network and RAPG
In most traditional distribution networks, all nodes within them are load nodes, which provide energy from the upper-level power grid, and the power flow direction is unidirectional. In the new power system model where DPVs are connected to the distribution network in large numbers, some of the load nodes will become power supply nodes during specific periods, and power will be sent back to the upper-level power grid. Moreover, since DPVs are connected to many scattered nodes in the distribution network, using DES to centrally control all DPVs in the distribution network is not only difficult to operate but also difficult to meet the required control time scale due to the hysteresis of power transmission. Therefore, it is necessary to adopt a RAPG operation mode to ensure the balance of supply and demand in the region, consume the reversed power locally as much as possible, and reduce the flow on the tie line.
Based on factors such as the geographical location and load characteristics of the distribution network, loads, DG supplies, and ES are classified into different RAPGs. The colored dotted box in Fig. 1 shows different RAPGs after division. According to the net load characteristics of different RAPGs and DG supply configurations, it is necessary to rationally plan the RAPG and design DES planning and optimization strategies. This will enhance the level of regional autonomy. To determine the optimal planning strategy for ES, it is necessary to establish evaluation criteria to measure the planning effect of RAPGs.
3 Regional Power Grid Planning Considering Autonomy Capabilities
At present, when large-scale DGs are connected to the distribution network, reasonable planning of resources in the RAPG is an effective means to solve a series of problems caused by it. Planning for RAPGs includes a variety of means. This paper considers the regional power grid planning architecture diagram of multiple autonomy indexes as shown in Fig. 2 below.
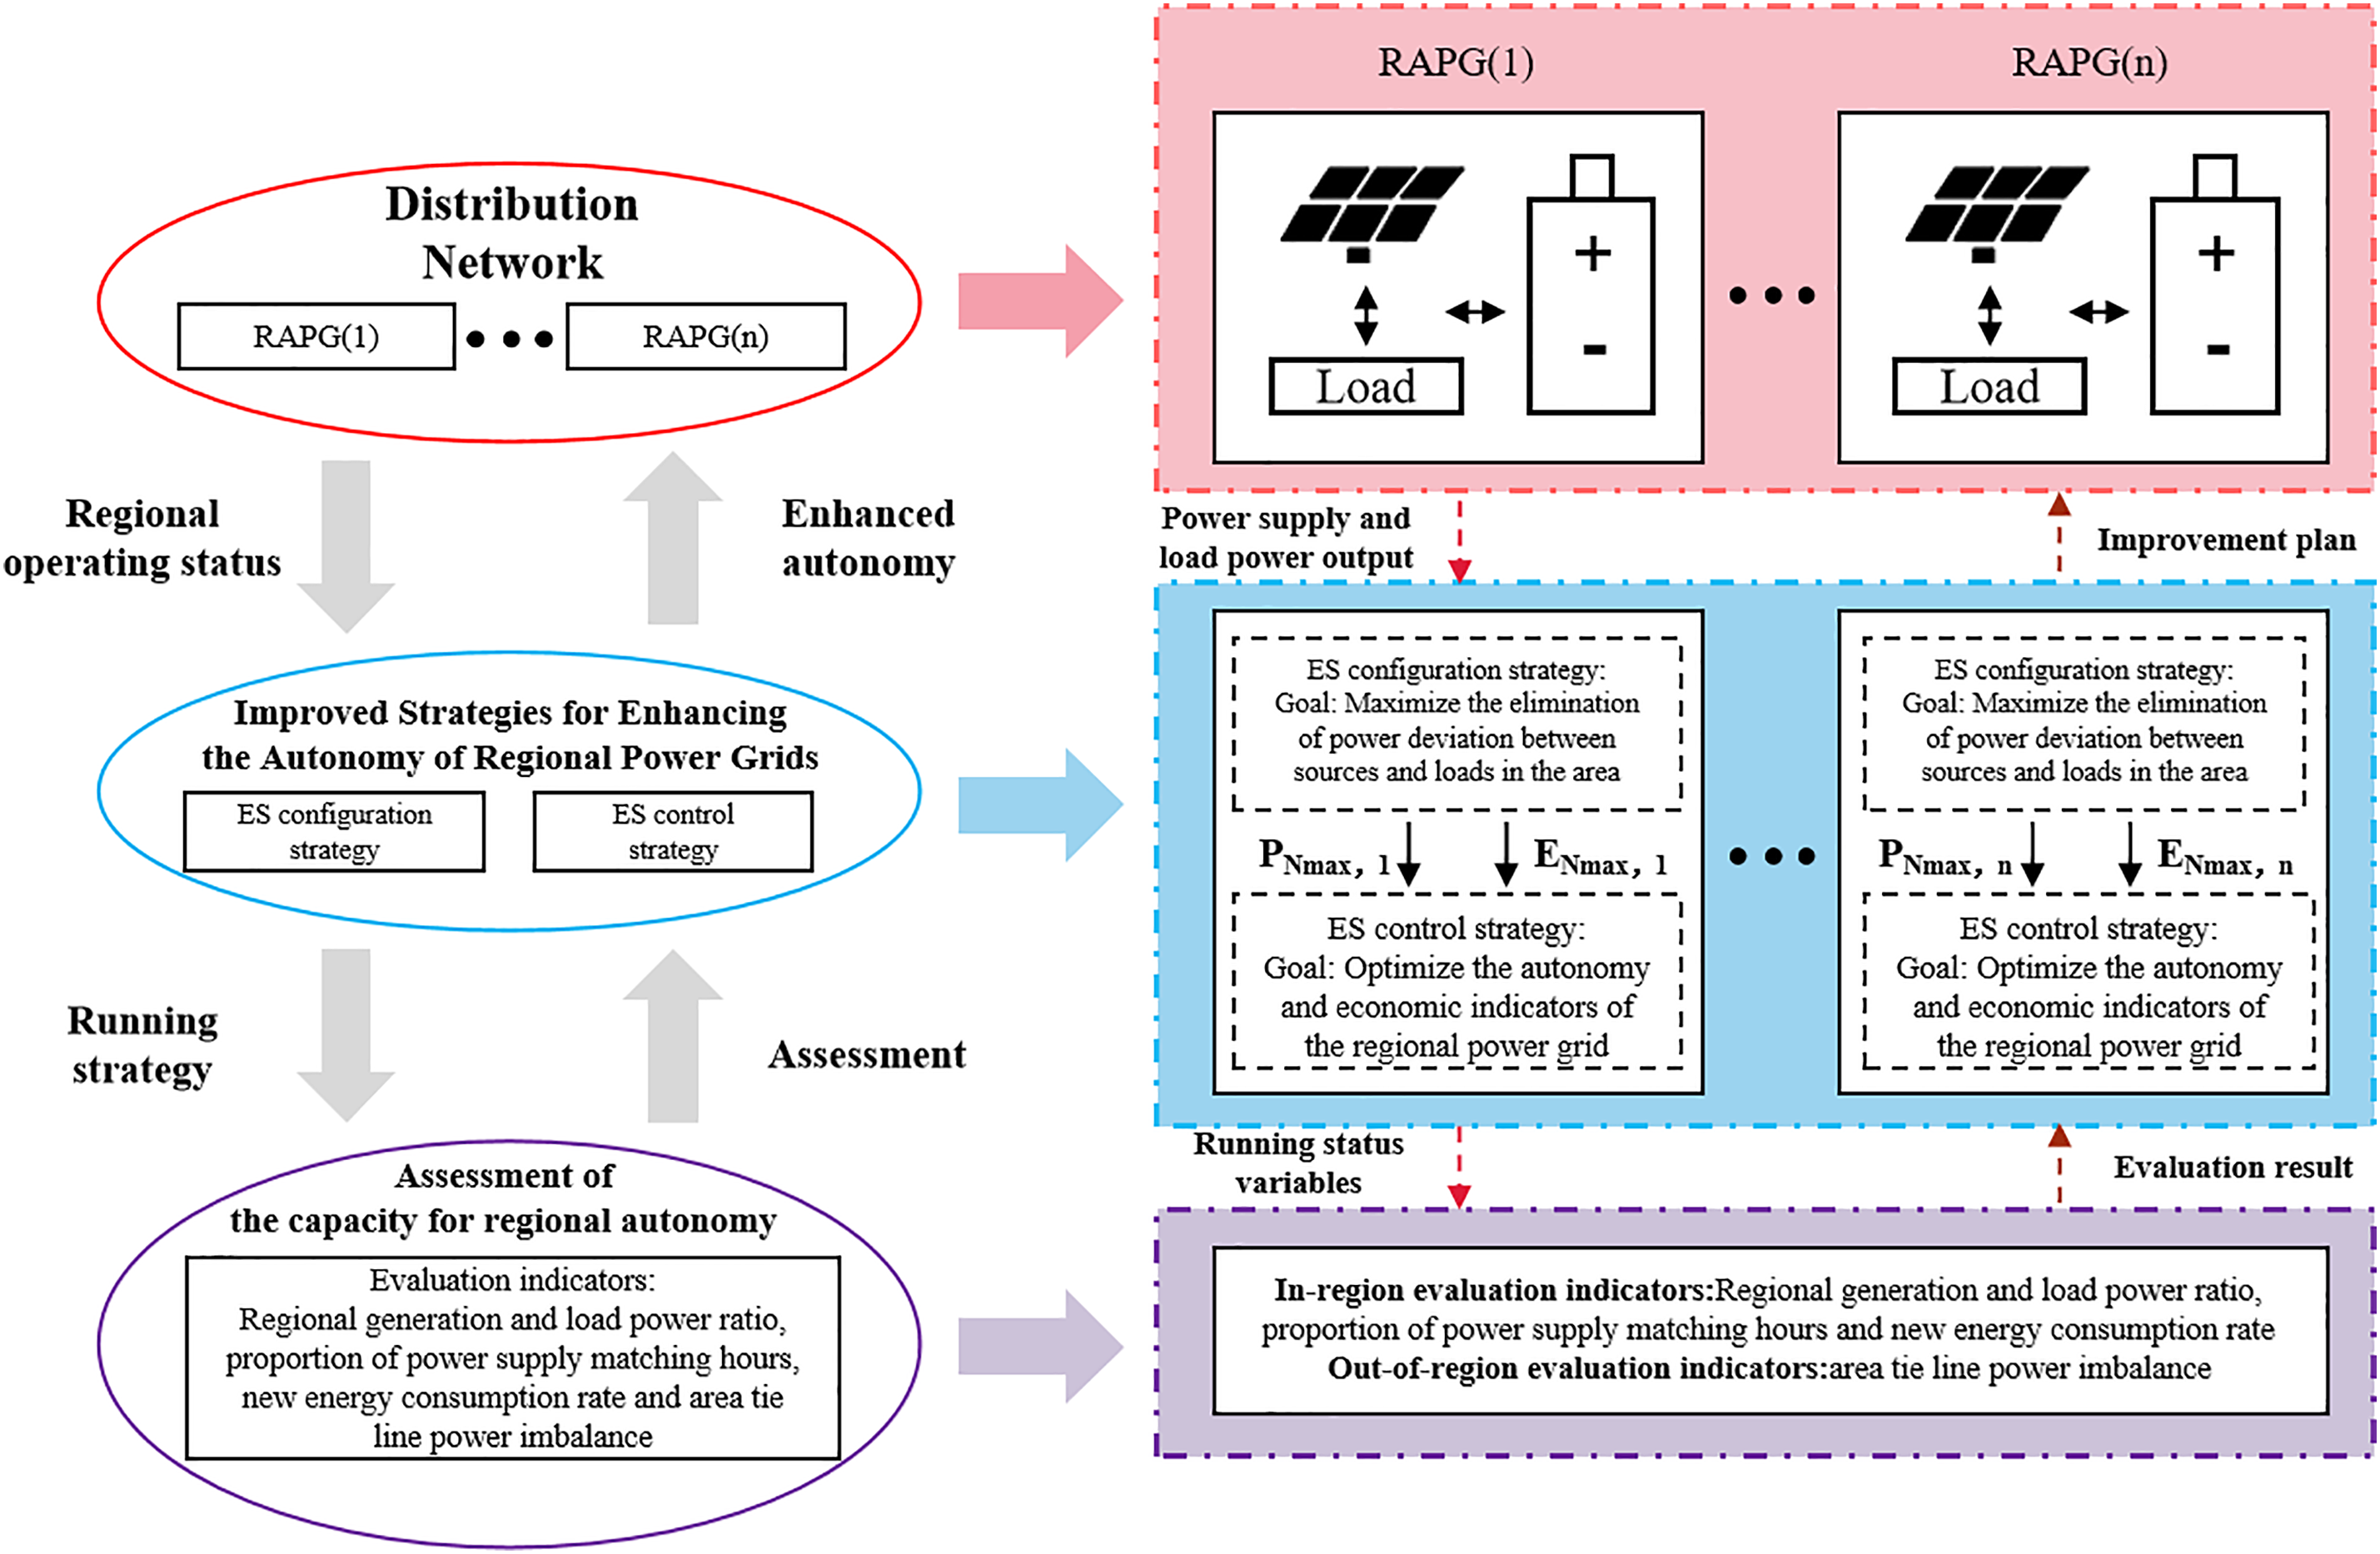
Figure 2: Regional power grid planning architecture diagram considering multiple autonomy indexes
The regional power grid planning established in this paper considering the improvement of autonomy capabilities specifically includes the following functions:
1. Regional power grid autonomous capability enhancement strategy. Specifically including the configuration and control strategy of ES, the formulation of the strategy can effectively promote the configuration and utilization of resources to meet the power needs of different regions, through the strengthening of autonomous capabilities, can better understand and master the changes and characteristics of regional power demand, to better optimize the configuration and configuration of resources, reduce costs, improve efficiency.
2. Assessment of regional self-government capacity. The evaluation indexes of the degree of autonomy such as regional generation and load power ratio, the proportion of power supply matching hours, the power imbalance of the tie line, and the consumption rate of new energy are established to evaluate the autonomy capability of the RAPG before and after the planning. The construction of the autonomy evaluation indexes can effectively measure the autonomous ability of the regional resource configuration and operation management. To evaluate the autonomy capability of the RAPG, understand the shortcomings and problems of the RAPG in terms of autonomy, guide the formulation and implementation of improvement measures, and promote the power grid to a more autonomous, intelligent, reliable, and sustainable development direction.
3.1 Regional Power Grid Autonomous Capability Enhancement Strategy
RAPG emphasizes the full utilization of local resources and can achieve independent energy management and flexible scheduling. The improvement of regional power grid autonomy is an effective means to solve the adverse effects brought by large-scale access to DGs:
1. According to the situation of distributed resources in different regions, a regional ES configuration strategy is proposed. The strategy selects the reference value of the upper limit of the appropriate ES configuration according to the regional load and DPV output, to maximize the elimination of the source charge deviation in the region. The upper limit constraint EN max of ES capacity is obtained.
2. Proposed a control strategy for regional ES, setting reference lines for ES charging and discharging, with the ES capacity EN max as an upper limit constraint. Multiple autonomy indicators and regional planning economic indicators were selected as objective functions and different proportions of ES were chosen to control the distributed resources of the regional power grid. Evaluation indicators such as the regional generation and load power ratio, the proportion of power supply matching hours, the power imbalance of the tie line, the new energy consumption rate, and ES planning costs were established to assess changes in regional autonomy capability. This aims to maximize the enhancement of regional power grid autonomy capability, promote on-site integration of new energy sources, improve the economic efficiency of regional power grid planning, enhance the safety and stability of distribution network operation, and promote coordinated development with distribution networks.
3.1.1 ES Configuration Strategy
The primary objective of this section is to identify the optimal ES configuration that can effectively minimize power source and load deviations within the regional power grid. This will be achieved by constructing a difference curve between the source and load, the optimal ES configuration will serve as a reference upper limit for ES configuration. Additionally, it will act as a constraint condition to guide the ES control strategy, thereby providing valuable insights for determining an appropriate proportion of ES configuration in subsequent steps. The building model of the ES configuration strategy is as follows:
(1) Objective function
In the part of ES configuration, the purpose of this paper is to maximize the elimination of the source load deviation value in the region. The formula is established as follows:
where PG(t) is the active power output of the power supply at time t in the region, and QL(t) is the load demand at time t in the region.
(2) Maximum rated charge and discharge power PN max and maximum rated capacity EN max
The rated charge and discharge power of ES PN max is related to the pre-charge and discharge of the source-charge difference curve, and the formula is as follows:
where Pc max is the maximum value of the source load difference not less than 0, and Pd max is the minimum value of the source load difference not more than 0.
The rated capacity EN max of ES is related to the integral curve of the source-load difference curve, and the formula is as follows:
where E(t) is the source charge difference integral curve, Emax is the maximum electric energy that can be stored by the ES device in the state of full energy, and Emin is the maximum electric energy that can be discharged by the ES device in the state of discharge.
The ES configuration strategy proposed in this paper can maximize the elimination of the source load deviation value, but since the ES cost and its economy are not considered, this configuration strategy is used as a reference value for the upper limit of ES configuration, and is used as a constraint condition to restrict the ES control strategy, providing a reference basis for the configuration of a certain proportion of ES, and reduce the amount of computation and time under the ES control strategy.
According to the ES configuration strategy, the upper limit of ES configuration obtained by maximizing the elimination of source-load difference is taken as the constraint condition, and different proportions of ES are selected to control the resources of the regional power grid, to maximize the autonomous capability and economic benefits of the RAPG. The evaluation indexes of autonomous capability are mainly described in Section 3.2. Specifically, it includes the regional generation and load power ratio, the proportion of power supply matching hours, the power imbalance of the tie line, and the new energy consumption rate. The construction method of the regional ES control strategy is as follows:
1. Objective function: Targeting optimal regional power grid autonomy indicators and planning economic efficiency, the best configuration ratio is selected within the constraints of the ES configuration upper limit.
2. Charge and discharge reference line of ES: To better improve regional autonomous capability, The charge reference line B(t) (non-negative value) functions to align the difference between the power source and load with the reference line through ES charging, effectively smoothing out power imbalances in the tie line. The role of the discharge reference F(t) (non-positive) for ES, is for the part where the source load difference is greater than the reference value, the ES discharges the small load; on the other hand, for the part where the source load difference is less than the reference value, the source load difference is gentle to the reference line value through the discharge of the ES. This approach not only improves the proportion of power supply matching hours and promotes new energy consumption but also smooths out power imbalances in tie lines while enhancing regional autonomous capability. In this study, we select as our charge and discharge reference values B(t) and F(t), respectively, based on daily averages from pre-charge and pre-discharge periods.
3. The ES operation strategy model is constructed as follows:
Based on the above, the regional autonomy enhancement strategy established in this section, the process diagram for RAPG planning considering multiple autonomy assessment indexes is shown in Fig. 3. The algorithmic process of this strategy in this paper is outlined in the following steps:
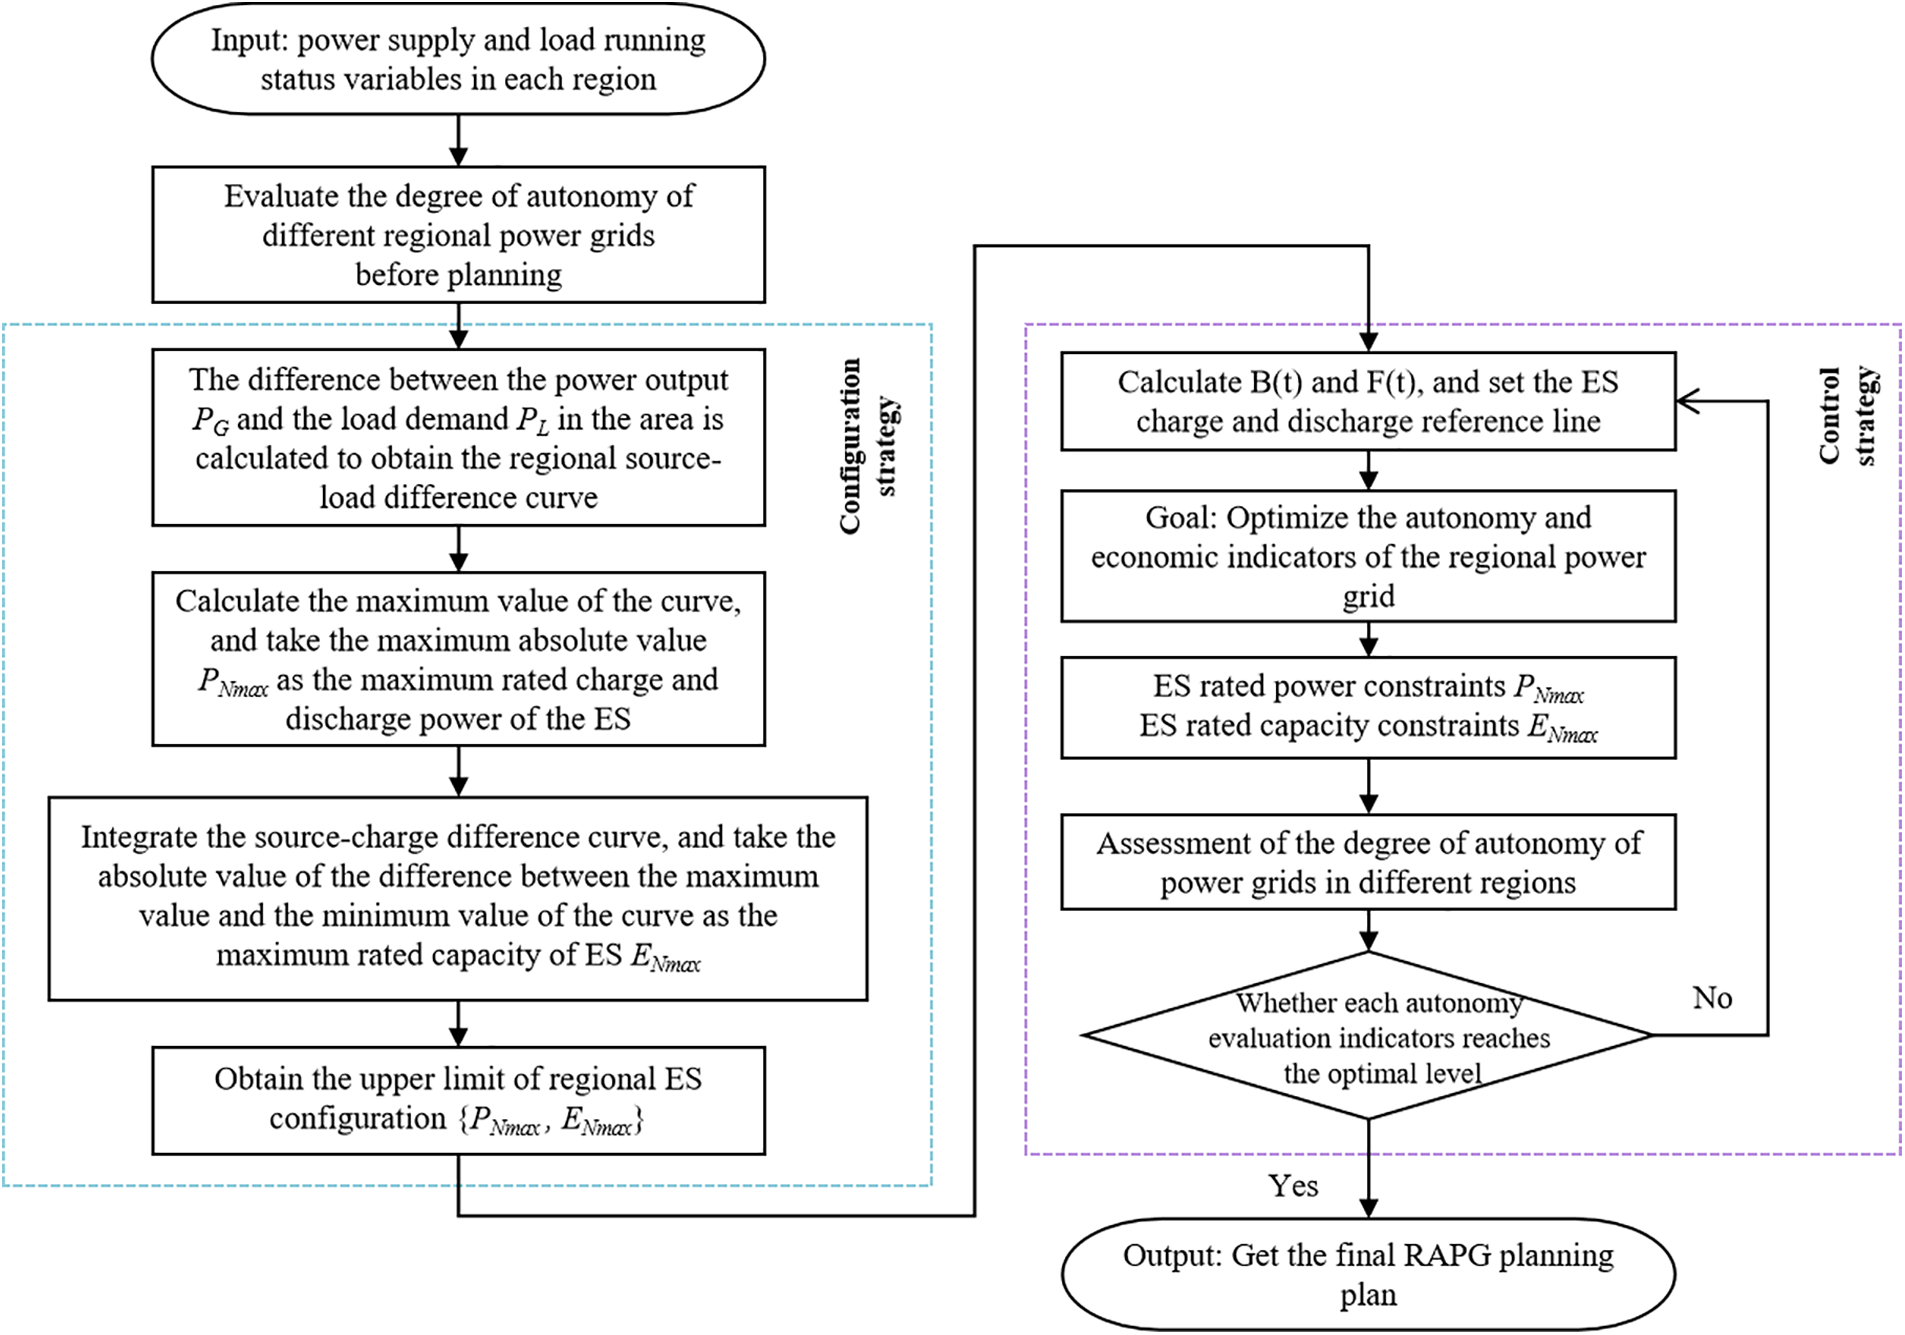
Figure 3: RAPG planning framework
Step 1: The annual load demand QL(t) and DPV output data PG(t) within the region are statistically compiled. Subsequently, the annual regional tie line power curve GL(t) is derived using Eq. (1). Utilizing Eqs. (8)–(11), the regional self-sufficiency indexes including the regional generation and load power ratio F1, the proportion of power supply matching hours F2, the power imbalance of the tie line F3, and the new energy consumption rate F4 are computed. These indexes serve as indicators of regional autonomy capability, enabling a preliminary assessment of the region’s self-sufficiency level.
Step 2: Utilizing the tie line power curve GL(t) obtained from Step 1, tailored to the varying scenarios of distributed resources within different regions of the grid, reference values [PNmax, ENmax] suitable for regional configuration upper limits are determined. This approach not only streamlines the selection of optimal capacity during ES control but also reduces computational complexity. Initially, based on the charge and discharge power curve GL(t1) of the ESS on the first day, the maximum absolute value between the maximum charge value P1cmax and the minimum discharge value P1dmax, as determined by Eqs. (2) and (3), is selected. This value is considered the maximum rated charge-discharge power capacity
Step 3: Based on the ES configuration PNmax and ENmax obtained from Step 2 as upper limit constraints, control of the ES within the region is conducted. Firstly, calculate the reference line for ES charging and discharging based on the power curve of the tie lines, with the selection of its values as the average value B(t) of daily pre-charging and the average value F(t) of daily pre-discharging. According to Eqs. (6) and (7), if GL(t) > B(t), the ES is charged to smooth the tie line power to B(t). If 0 > GL(t) > F(t), the ES discharges for the parts with smaller absolute values of source-load deviation to balance the source-load deviation to zero, thereby improving the duration of power supply matching. If GL(t) < F(t), the ES discharges to smooth the tie line to F(t).
Step 4: Following the ES control in Step 3, a reassessment of the autonomy capability and economic indicators within the region is conducted based on Eqs. (8)–(14). Considering the constraints imposed by the ES configuration, the effectiveness of ES control is determined. The performance of each configuration is evaluated to ascertain whether all indicators collectively reach their optimal values. If optimization is not achieved, Step 3 is repeated with different ES configurations. Conversely, if optimization is achieved, the resulting output is considered the optimal planning solution.
To determine the optimal planning strategy for ES, the following evaluation criteria are established to measure the planning effect of RAPGs:
(1) The regional generation and load power ratio. It can reflect whether the power supply in the region can meet the load requirements in terms of the quantity of electric charge dimension and whether there is too much quantity of electric charge in the region to be deployed, to be one of the evaluation indexes of power dimension autonomy capability. Its calculation formula is as follows:
where QG is the annual energy generation of the region; QL indicates the annual power demand of the load in the area.
(2) The proportion of power supply matching hours. To reflect whether the power supply in the region can meet the load demand in terms of power dimension, the period when the power output in the region is not less than the load demand is taken as the effective power supply matching period, and its proportion is calculated as one of the autonomous evaluation indexes of power dimension. Its calculation formula is as follows:
where NP is the number of hours that the annual power output is not less than the load required; NT indicates the total number of hours in a year.
(3) Tie line power imbalance index. To reflect the fluctuation of the power of the tie line sent out or received in the region, this index is used as a reference, to effectively plan the resources in the region and reduce the scheduling pressure of the power system. Its calculation formula is as follows:
where GL(t) is the value of the power of the tie line at a certain time; u(GLn) is the average power of the tie line at n total times.
(4) Regional new energy consumption rate indexes. It reflects the consumption of new energy in the region and takes this index as a reference to rationally plan the resources in the region and improve the autonomous capability of the region.
where SN is the actual annual consumption of new energy in the region; ST is the actual total electricity generated by new energy in the region throughout the year.
(5) The cost index for regional ES planning serves as a crucial metric reflecting the economic viability of regional strategic planning. Utilizing this index as a reference facilitates the rational configuration of resources within the region, thereby enhancing its economic efficiency.
where Cinv is the equal annual value investment cost of DES; CM is the operation and maintenance cost of DES; CE is the unit capacity configuration cost of ES; CP is the unit power configuration cost of ES; PB and EB are the rated capacity and power of ES, respectively; y is the service life of DES; r is the discount rate; Cm is the operation and maintenance cost of storage per unit of power generation, and EY.DES is the annual power generation of ES devices.
4.1 The Design of the Simulation System
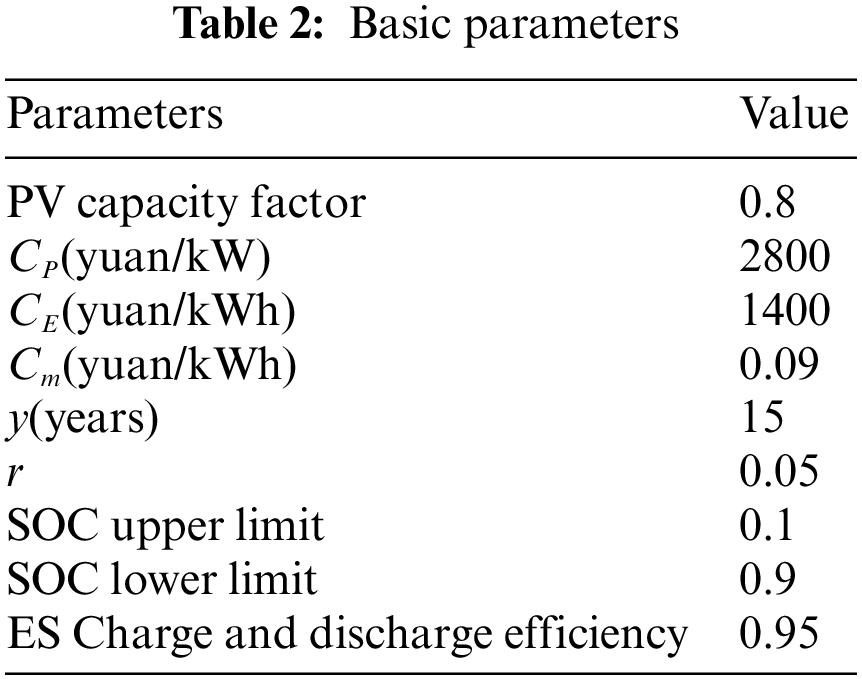
To verify the effectiveness and superiority of the regional planning strategy proposed in this paper, the regional power grid of a county in northern China is taken as an example, and the actual operation data of 8760 h of the distribution grid in the county for the whole year are used to simulate and analyze the regional power grid through MATLAB2022b software, and the basic parameters related to DG, ES, etc., are shown in Table 2.
According to the actual calculation example, the county is divided into 8 regional grids: Yang Liu (YL), Luo Shi (LS), Liu Kong Zhao (LKZ), Qiao Cheng (QC), Tuo Zhan (TZ), Zhang Huang Hua (ZHH), Lao Cheng (LC), and Ji Ju Qu (JJQ). Each regional grid contains 6, 15, 13, 12, 4, 15, 4, and 24 operating data of 10 kV load public lines, respectively. The installed capacity of DG supply in each region is shown in Table 3. By evaluating the autonomy capabilities of each region in the Current Year, the operation status of the autonomy indexes in each region was obtained, as shown in Fig. 4, which also includes the specific division between regions.
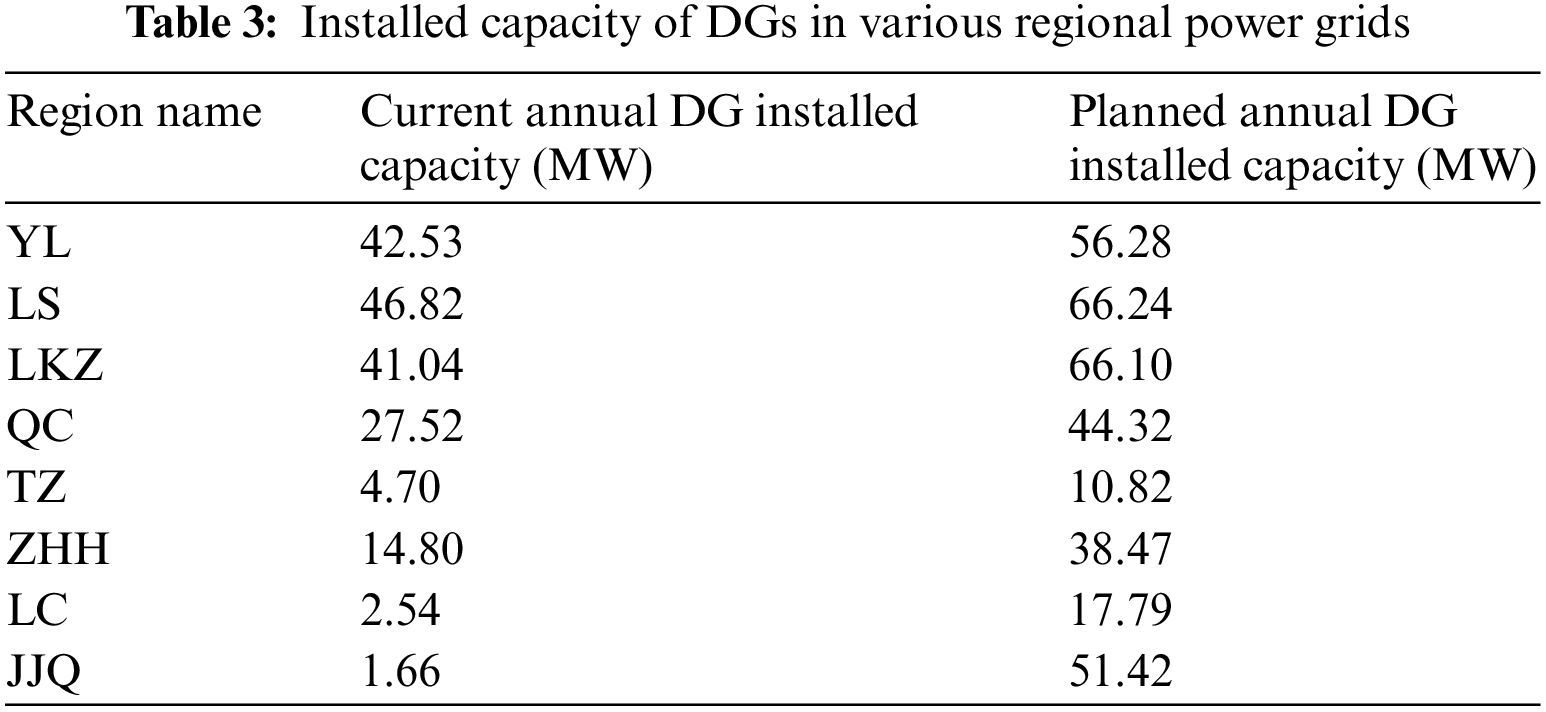
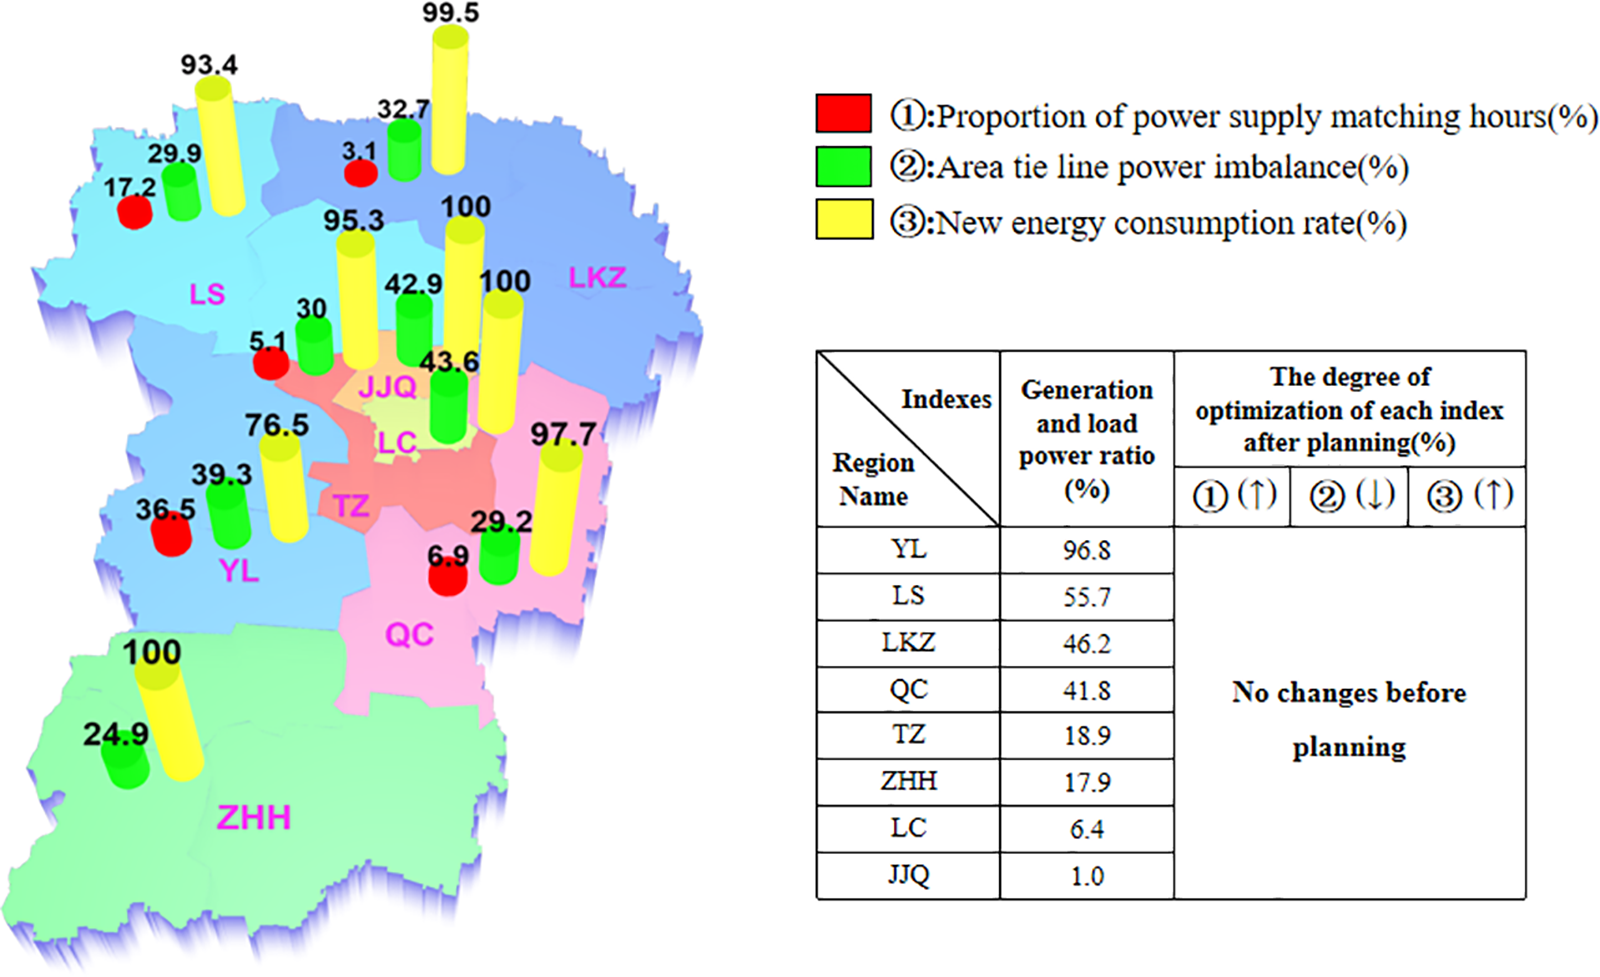
Figure 4: The degree of autonomy and regional division of each region in the Current Year before planning
Utilizing the aforementioned case study system, this paper formulates corresponding RAPG planning schemes for both the current year and five years into the planning horizon of the county-level regional grid. The installed capacity of distributed power sources in each region for the current year and the future five years are outlined in Table 3. To validate the advantages of the proposed regional planning strategies, two planning approaches are constructed for comparative analysis of the regional planning outcomes.
Strategy 1(S1): Implements the regional grid planning approach outlined in Section 3.1 of this paper, which considers enhancing the autonomous capability of regional grids through the consideration of multiple autonomy and economic factors.
Strategy 2(S2): Differs from S1 by not setting a baseline for ES pre-charging and discharging. ES is controlled with a capacity-first approach, aiming to maximize the reduction of regional source-load imbalances to fulfill regional supply-demand equilibrium.
4.2 Analysis of Simulation Results of Each Region in the Current Year
4.2.1 Autonomy Ability Evaluation
To better plan the grid layout of each region, an initial evaluation is conducted on the operational characteristics of each region in the Current Year of the example. Multiple evaluation indexes, including regional generation and load power ratio, the proportion of power supply matching hours, tie-line power imbalance, and new energy consumption rate in each region are calculated, and the operating conditions of each region are obtained as shown in Fig. 4.
To better illustrate the autonomy levels of various types and scales of regional power grids, detailed presentations of key indexes for each grid are provided, as shown in Table 4 below. Regarding the autonomy indexes in the table, higher values of the regional source-load electricity ratio and proportion of matching supply hours indicate a stronger self-sufficiency capability for the respective grid. Lower values of tie-line power imbalance denote a more balanced internal power distribution within the grid and greater coordination with the higher-level grid. Additionally, a higher rate of new energy consumption signifies a higher level of integration of renewable energy sources within the regional grid.
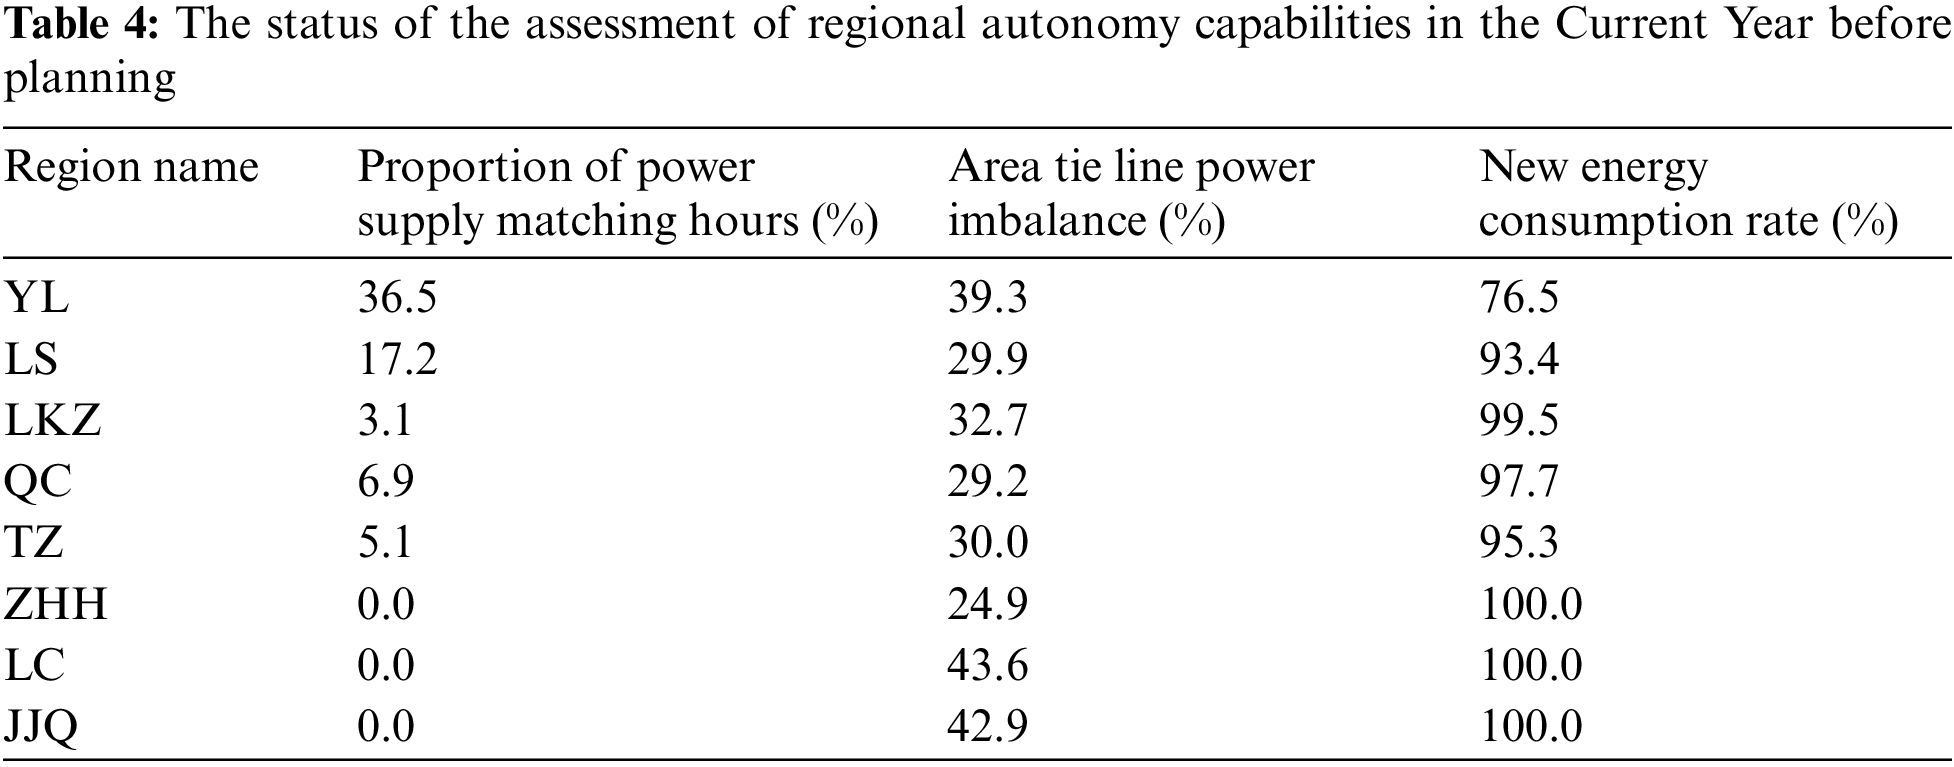
It can be seen from Fig. 4 and Table 4 that for Yang Liu and Luo Shi grids where the regional generation and load power ratio is higher than 50%, the proportion of power supply matching hours is higher than that of other grids. In terms of electricity, it can better meet the self-sufficiency of the region; however, in terms of tie-line power imbalance and new energy consumption rate, compared with other grids, the tie-line power curve fluctuates more, and the consumption rate of new energy is low. It is necessary to formulate appropriate regional planning strategies, focusing on increasing the new energy consumption rate in the region and reducing the imbalance of tie-line power, to maximize regional autonomy.
For grids such as Liu Kong Zhao and other grids where the regional generation and load power ratio are less than 50%, although new energy has a high consumption rate, it cannot meet the self-sufficiency of the region in the power dimension. Therefore, more power needs to be transferred from the tie line, but the power fluctuation of the tie line is more obvious, and the dispatching pressure of the system is relatively large. Therefore, it is necessary to formulate corresponding regional planning strategies to focus on reducing the dispatch pressure of tie-line power.
For the Zhang Huang Hua, Lao Cheng, and Ji Ju Qu grids, the proportion of power supply matching hours of power supply and the new energy consumption rate in the area is 0% and 100% respectively, indicating that the new energy in the area is fully consumed. There is no excess new energy power that can be used, and the Current Year has no obvious significance for the planning of these areas. Therefore, the focus is on analyzing the Planning Years of these areas and proposing regional planning plans after DG supply and load growth.
According to the above analysis, it can be seen that different regions have different degrees of autonomy capability based on their own resource characteristics and operating capabilities. Therefore, it is necessary to formulate different regional power grid autonomy capability enhancement strategies for each region to enhance the overall regional autonomy capability.
4.2.2 Enhanced Autonomy Capability
Taking the Luo Shi grid within the county as an example, we begin by conducting a detailed analysis of S1 proposed in this paper, which focuses on enhancing the autonomous capability of regional grids as outlined.
From the analysis data in Section 4.2.1 above, it can be seen that in the Current Year of Luo Shi Grid without ES, the proportion of power supply matching hours is 17.2%, the tie line power imbalance is 29.9%, and The new energy consumption rate is 93.4%. After configuring ES with different capacities and proportions for the grid, various evaluation indexes of the grid have been significantly improved, as shown in Fig. 5 below. This is the change curve of the proportion of power supply matching hours, tie-line power imbalance, and new energy consumption rate of the Current Year Luo Shi Grid under different configurations of ES ratios.

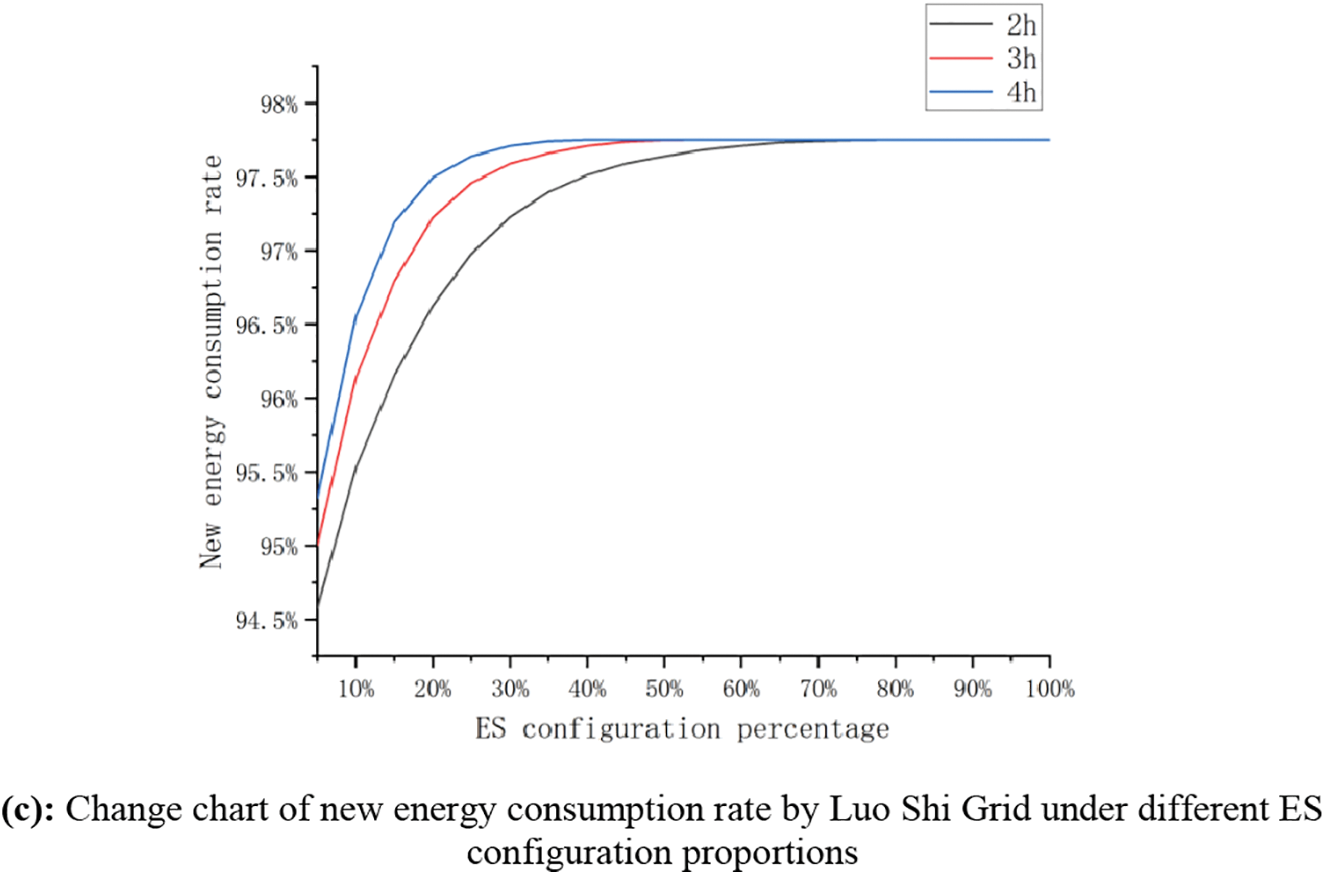
Figure 5: Changes in various evaluation indexes under different ES configuration proportions under S1
Among them, to more intuitively understand the changes in various indexes under different ES ratios, this paper defines the configuration ES ratio as the percentage of the ES-rated power to the installed capacity of DG in the region. Use this as the abscissa of the change curve of each index.
Through ES planning for the Luo Shi grid, analyzing the trends of various indicators depicted in Fig. 5 reveals that under different durations of continuous charge and discharge, as the ES ratio increases, all indicators eventually converge to the same value. Hence, different ES planning schemes achieve similar configuration outcomes, but exhibit differences in terms of economic viability. The following comparison examines the economic aspects of different planning schemes when various assessment indicators collectively reach their optimal values under different durations of continuous charge and discharge. This comparison aids in selecting the optimal ES planning scheme.
From Table 5, it is evident that although different planning schemes yield identical convergence effects in various autonomy indicators, they exhibit distinct differences in terms of economic viability. Comparative analysis from the table reveals that under Plan 3, with ES configured at 40% for 4 h, the rated power of the ESS is 18.73 MW and the rated capacity is 74.92 MWh, resulting in a cost reduction of 24.13% and 12.22% compared to Plans 1 and 2, respectively. Furthermore, under this ES configuration, all assessment indicators reach their convergence values and collectively achieve optimal performance. Consequently, the proportion of supply matching hours increases by 23.0%, the tie line power imbalance decreases to 22.9%, and the new energy consumption rate rises to 97.7%. Compared to the period before ES configuration, these improvements translate to an increase of 5.9% in supply matching hours, a reduction of 7.0% in tie line power imbalance, and an enhancement of 4.4% in the new energy consumption rate. Fig. 6 illustrates the variation in tie line power curves before and after ES configuration for a specific week throughout the year in the Luo Shi grid under this ES planning scheme.
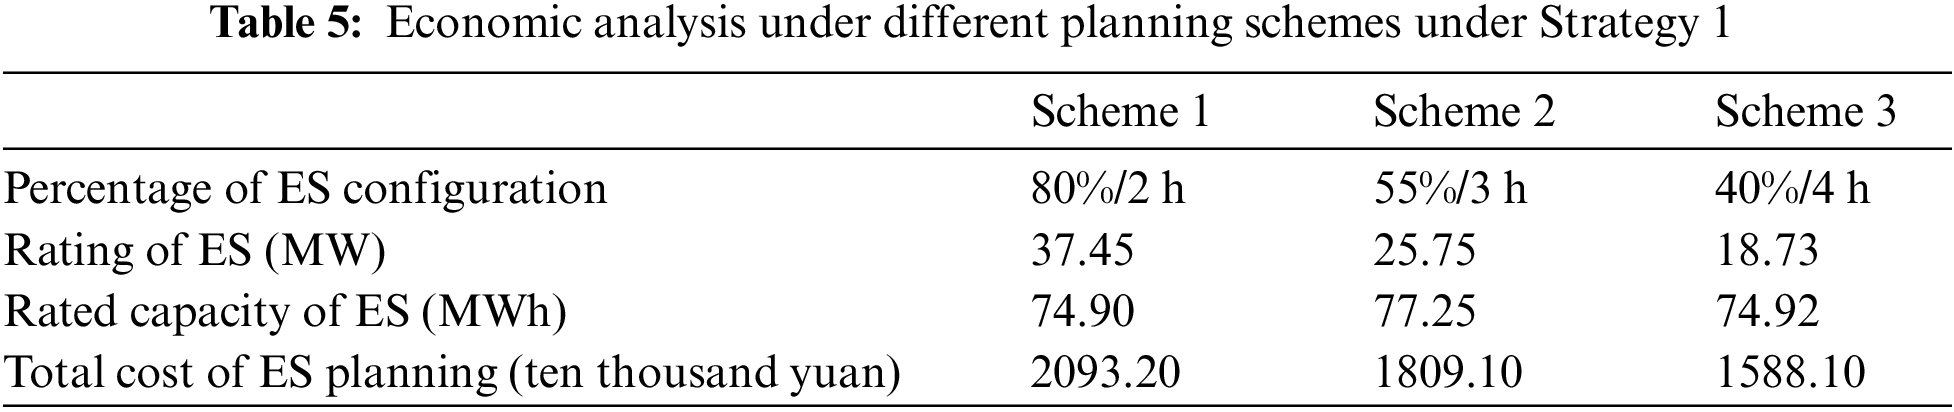

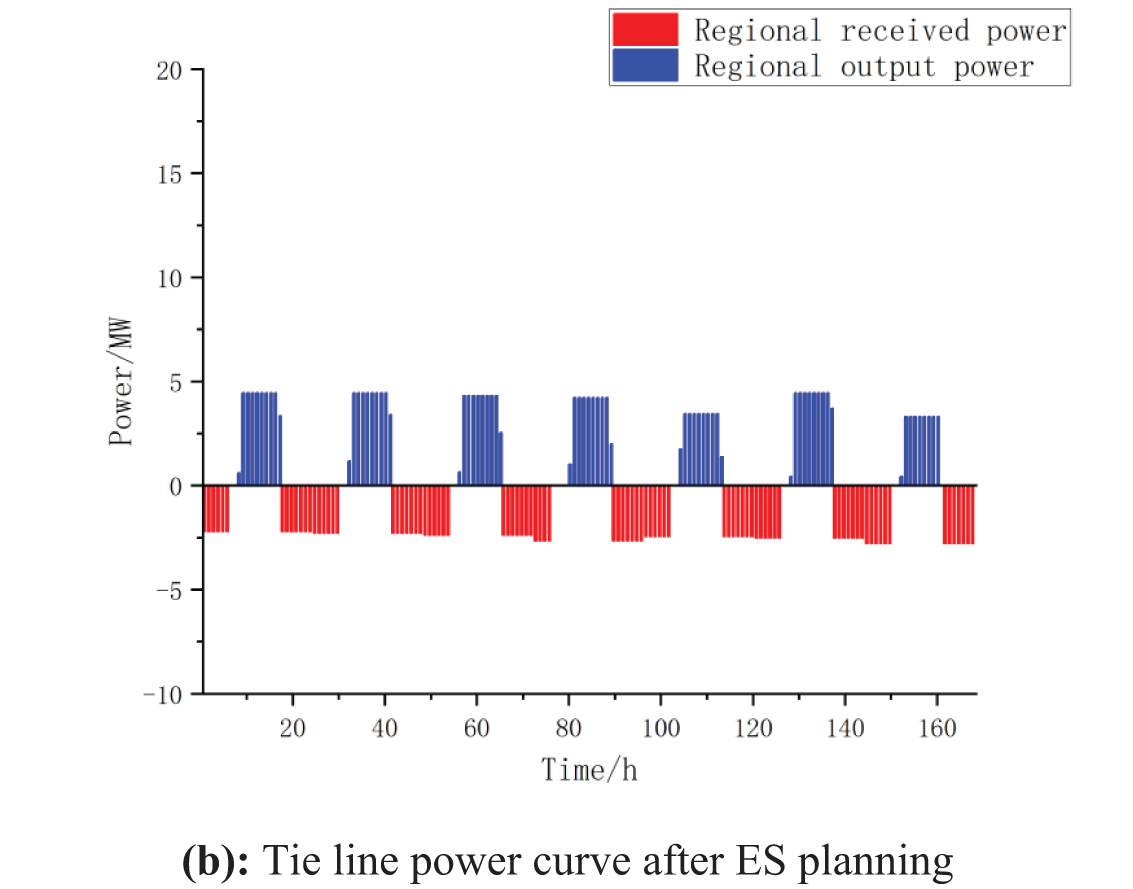
Figure 6: Change chart of tie-line power curve before and after ES configuration in Luo Shi Grid in a certain week of the year
It can be seen from the figure that through the configuration of ES, in response to the sending and receiving power in this area, the action of ES makes the power of the tie line smooth to the ES charge and discharge reference line, making the curve significantly smoother. It greatly reduces the pressure on regional dispatching, and for the smaller received power part, the ES action is used to meet the small load demand, improve the power supply matching time, and promote the on-site consumption of new energy. It is effectively verified that the ES configuration and control strategy proposed in this paper can significantly improve the autonomy capability of regional power grids.
Following the ES planning logic employed for the Luo Shi grid, different regional ES planning schemes are formulated for other grid areas. To highlight the advantages of the planning strategies proposed in this paper, ES planning S2 is configured under the same proportions as S1, facilitating a comparative analysis. The ES configuration proportions for each region within the county, along with their autonomy assessment, under S1 and S2, are presented in Table 6.
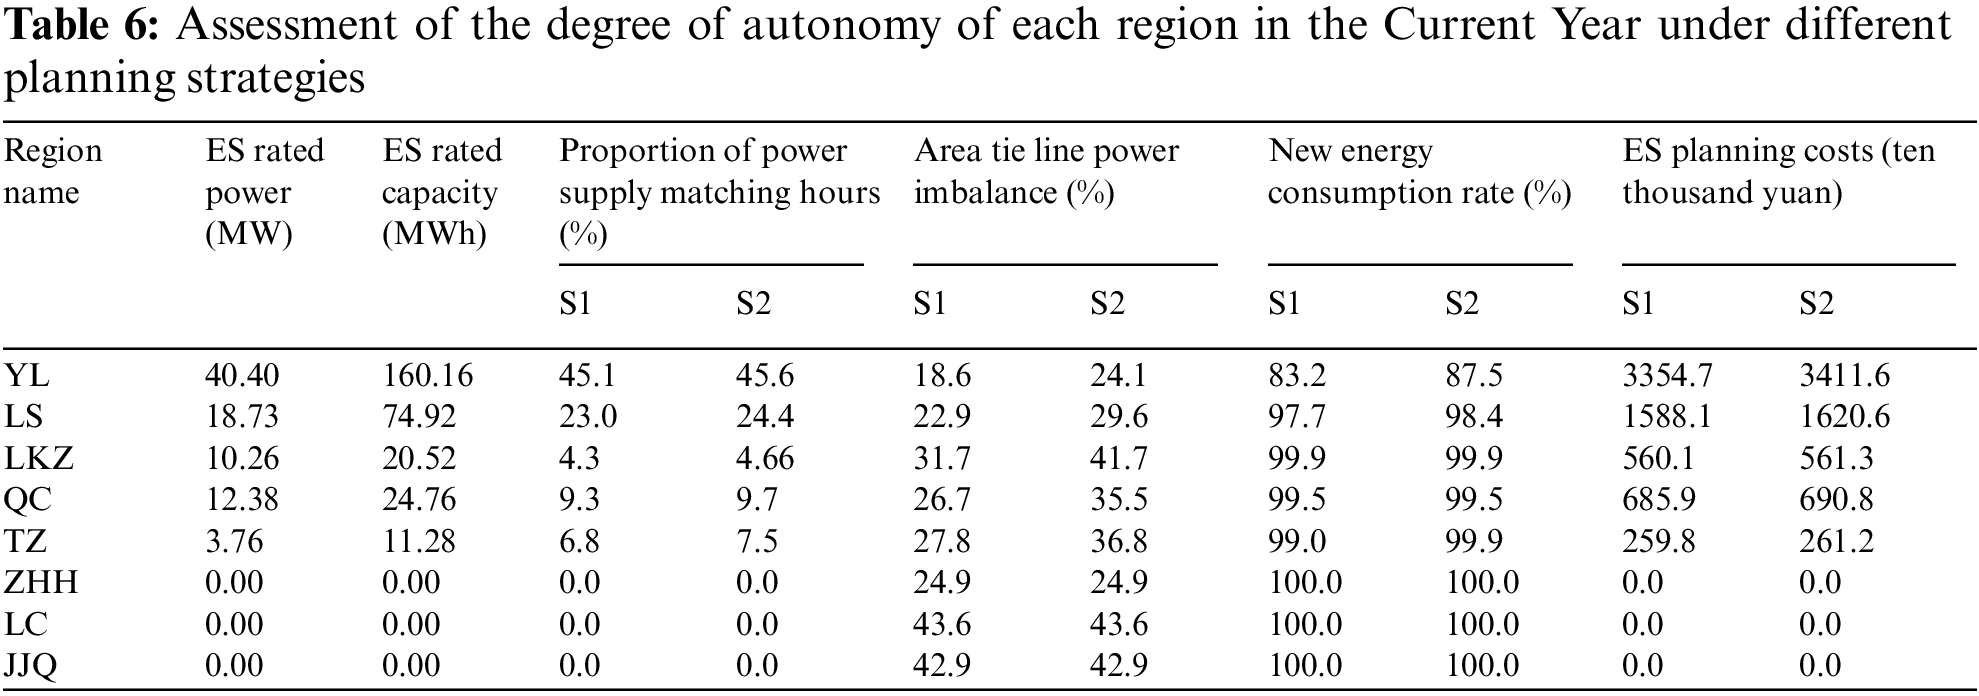
According to Table 6, upon identifying the optimal ES configuration through the planning strategies proposed in this paper, applying S2 to this configuration reveals slight enhancements in terms of supply matching hours and new energy consumption rate compared to S1. However, S2 not only fails to optimize the tie line power imbalance for the LKZ, QC, and TZ grids but also exacerbates the imbalance, hindering coordinated development with the higher-level grid. Moreover, S2 significantly lags in economic viability compared to S1. This discrepancy arises from S2’s emphasis on fulfilling the regional supply-demand balance without considering the power fluctuations on the tie lines. Consequently, S2 demonstrates limited effectiveness in enhancing the external controllability of RAPGs and exhibits lower economic feasibility. Therefore, to maximize the autonomy capability of regional grids as advocated in this paper, S1 proposed herein offers significant advantages in both enhancing regional autonomy capability and economic viability. Subsequently, a detailed analysis will be conducted on the application of S1 in regions of different scales and types.
It can be seen from Fig. 7 that through reasonable regional planning, the proportion of matching hours of power supply and the rate of new energy consumption in the county has increased by an average of 2.5% and 2.1%, and the tie line power imbalance decreased by 4.2% on average. The autonomy capabilities of multiple regional power grids have been improved, effectively reducing regional dispatch pressure, promoting local consumption of new energy, and improving the autonomy capabilities of multiple regions. From Section 4.2.1, it can be inferred that different types and scales of grids exhibit distinct operational characteristics and issues before regional planning. Therefore, the following analysis is conducted on the impacts brought about by the planning of different types and scales of regional grids in this section.
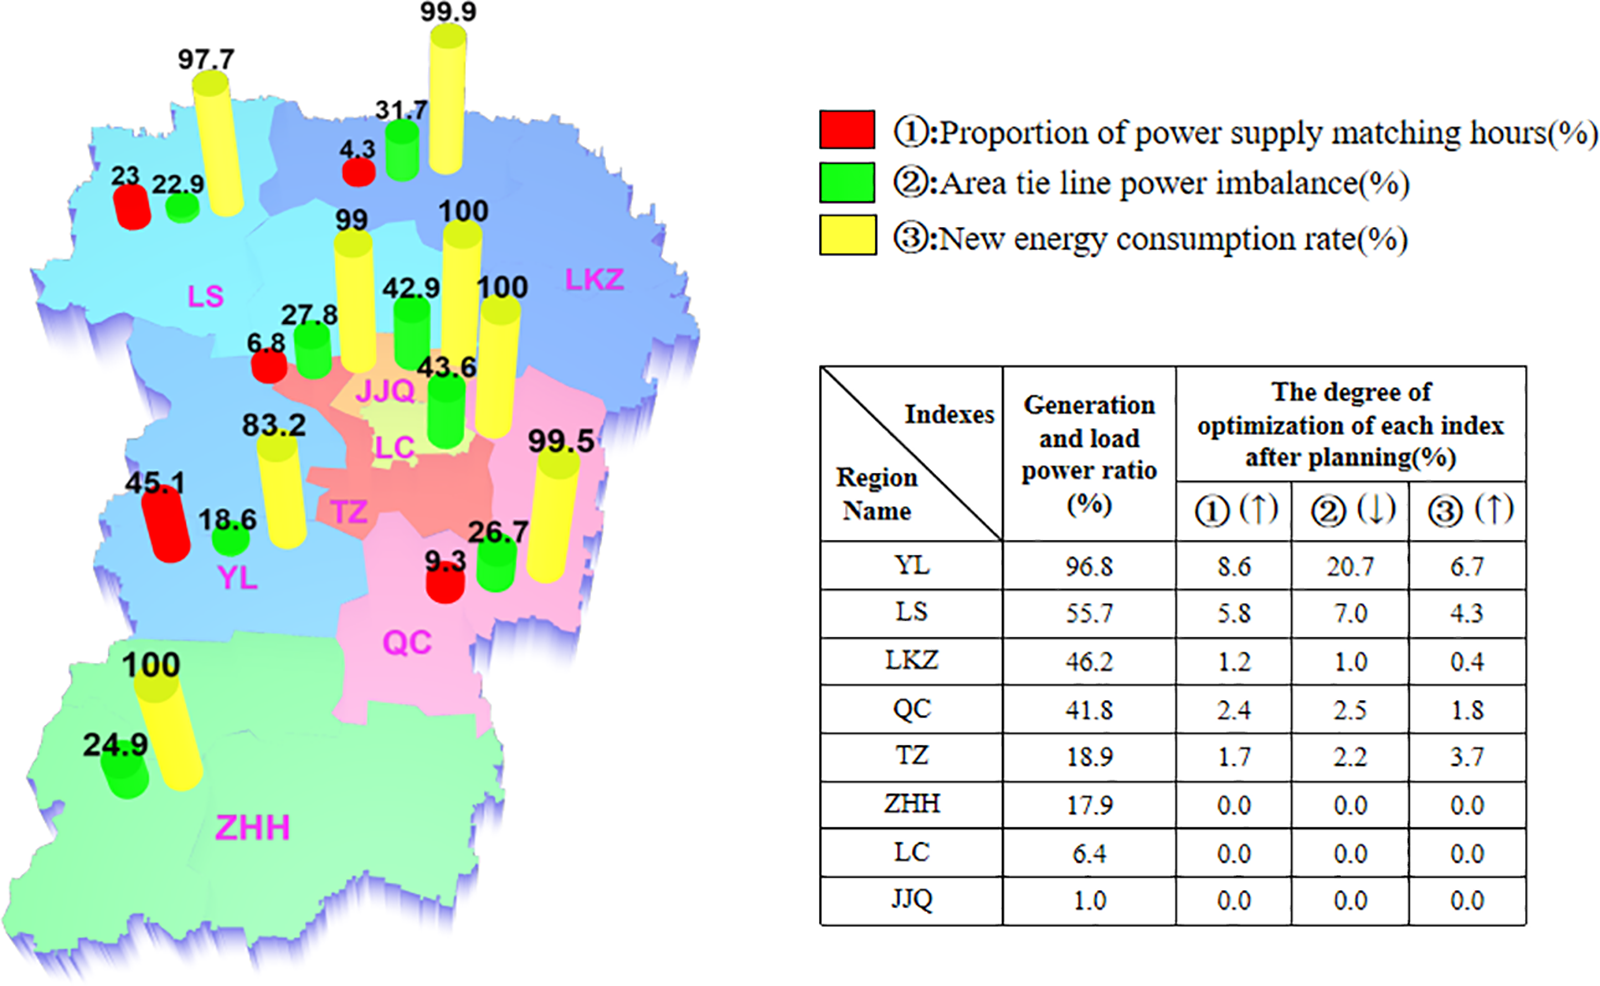
Figure 7: Improvement of autonomous capabilities in each region after regional planning in the Current Year
For the Yang Liu and Luo Shi grids, characterized by a high regional generation and load power ratio, before planning, these grids may exhibit relatively high self-sufficiency. However, they face challenges such as low rates of new energy consumption and significant power imbalances in the tie lines. Following the implementation of ES planning, the proportion of power supply matching hours for the Yang Liu and Luo Shi grids increased by 8.6% and 5.8%, respectively. Additionally, the new energy consumption rates increased by 6.7% and 4.3%, respectively. Notably, the reduction in power imbalances of the tie lines was more significant, decreasing by 20.7% and 7.0%, respectively. The proposed planning strategy not only maximizes the potential autonomy capability of this type of area, but also helps to promote the development and utilization of clean energy, providing a cleaner and more sustainable energy supply for society, and is conducive to the improvement of the quality of the surrounding environment and the protection of ecosystem health.
Grids such as Liu Kong Zhao, Qiao Cheng, and the Tuo Zhan grid, characterized by a relatively low regional generation and load power ratio, faced challenges such as low power supply matching, poor self-sufficiency, and significant fluctuations in tie-line power before planning. Post-ES planning, these grids experienced an average increase of 1.8% in the proportion of power supply matching hours and a 2.0% increase in new energy consumption rates. Simultaneously, the average reduction in tie-line power imbalances was 1.9%, thereby reducing reliance on external electricity and, crucially, alleviating scheduling pressure on these grid types. This strategy not only contributes to environmental protection and sustainable development but also significantly enhances the stability and reliability of regional power grids. Because there is no excess new energy power available for use in the grid areas of Zhang Huang Hua, Lao Cheng, and Ji Ju Qu, these areas will be analyzed with focus during the Planning Year.
4.3 Analysis of Planning Year Regional Simulation Example Results
4.3.1 Autonomy Ability Evaluation
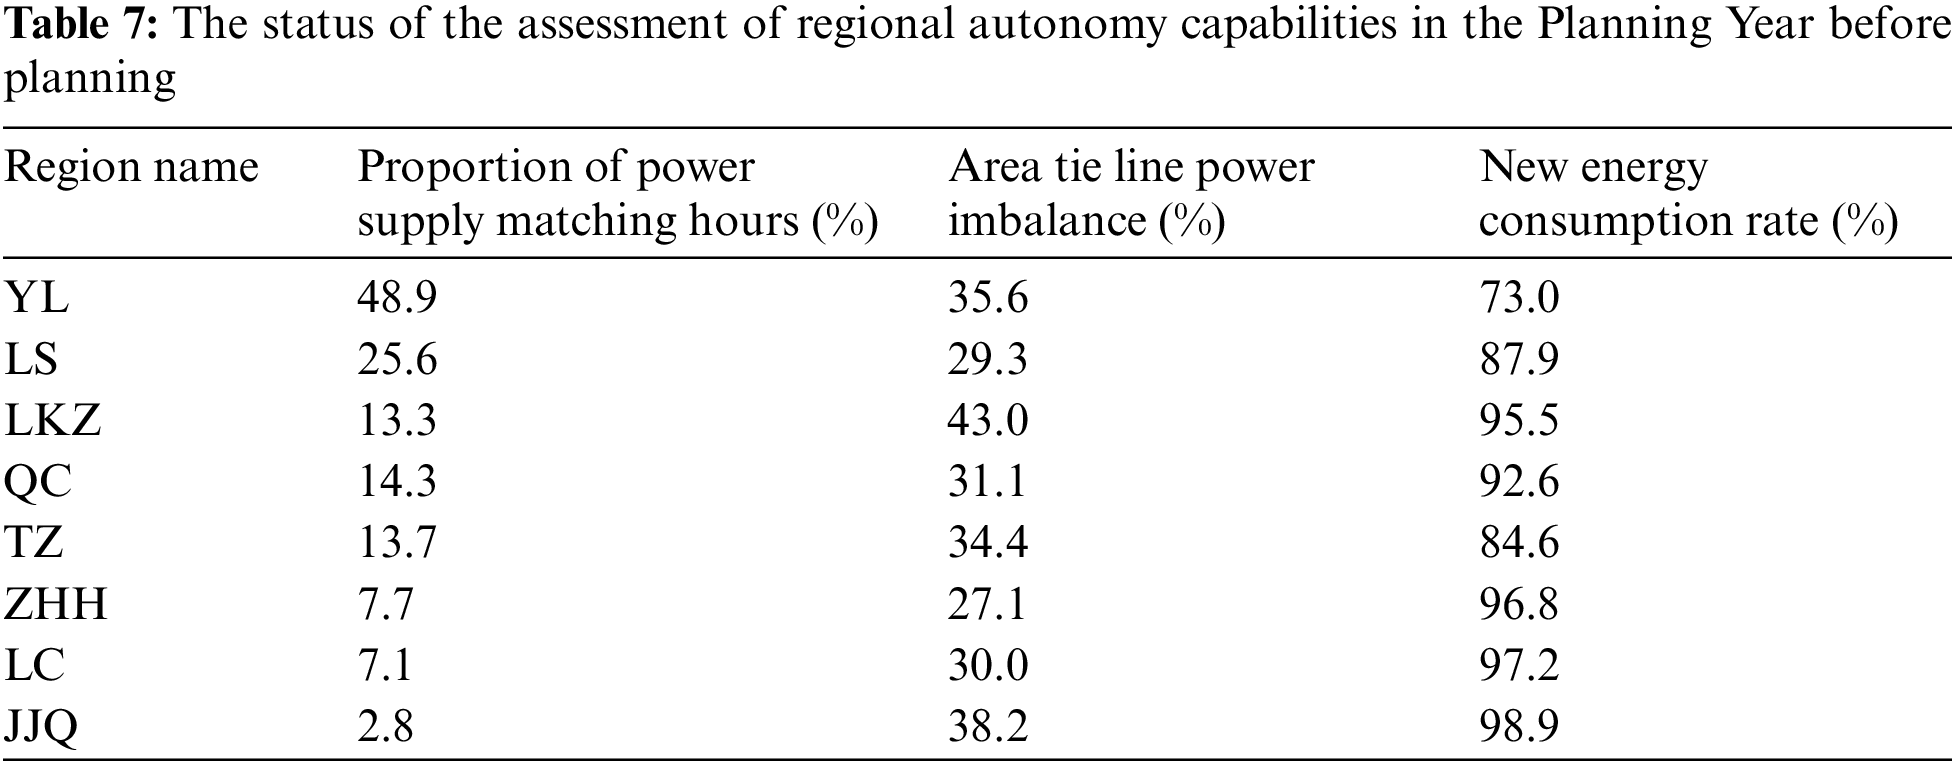
This section evaluates the operating characteristics of each region in the Planning Year of the calculation example. The DGs and loads in the Planning Year have changed. The installed capacity of DGs in each region in the Planning Year is shown in Table 3. Through the calculation of various evaluation indexes, the operating data of the regional generation and load power ratio, the proportion of power supply matching hours, tie-line power imbalance, and new energy consumption rate in each area are shown in Fig. 8 and Table 7 below.
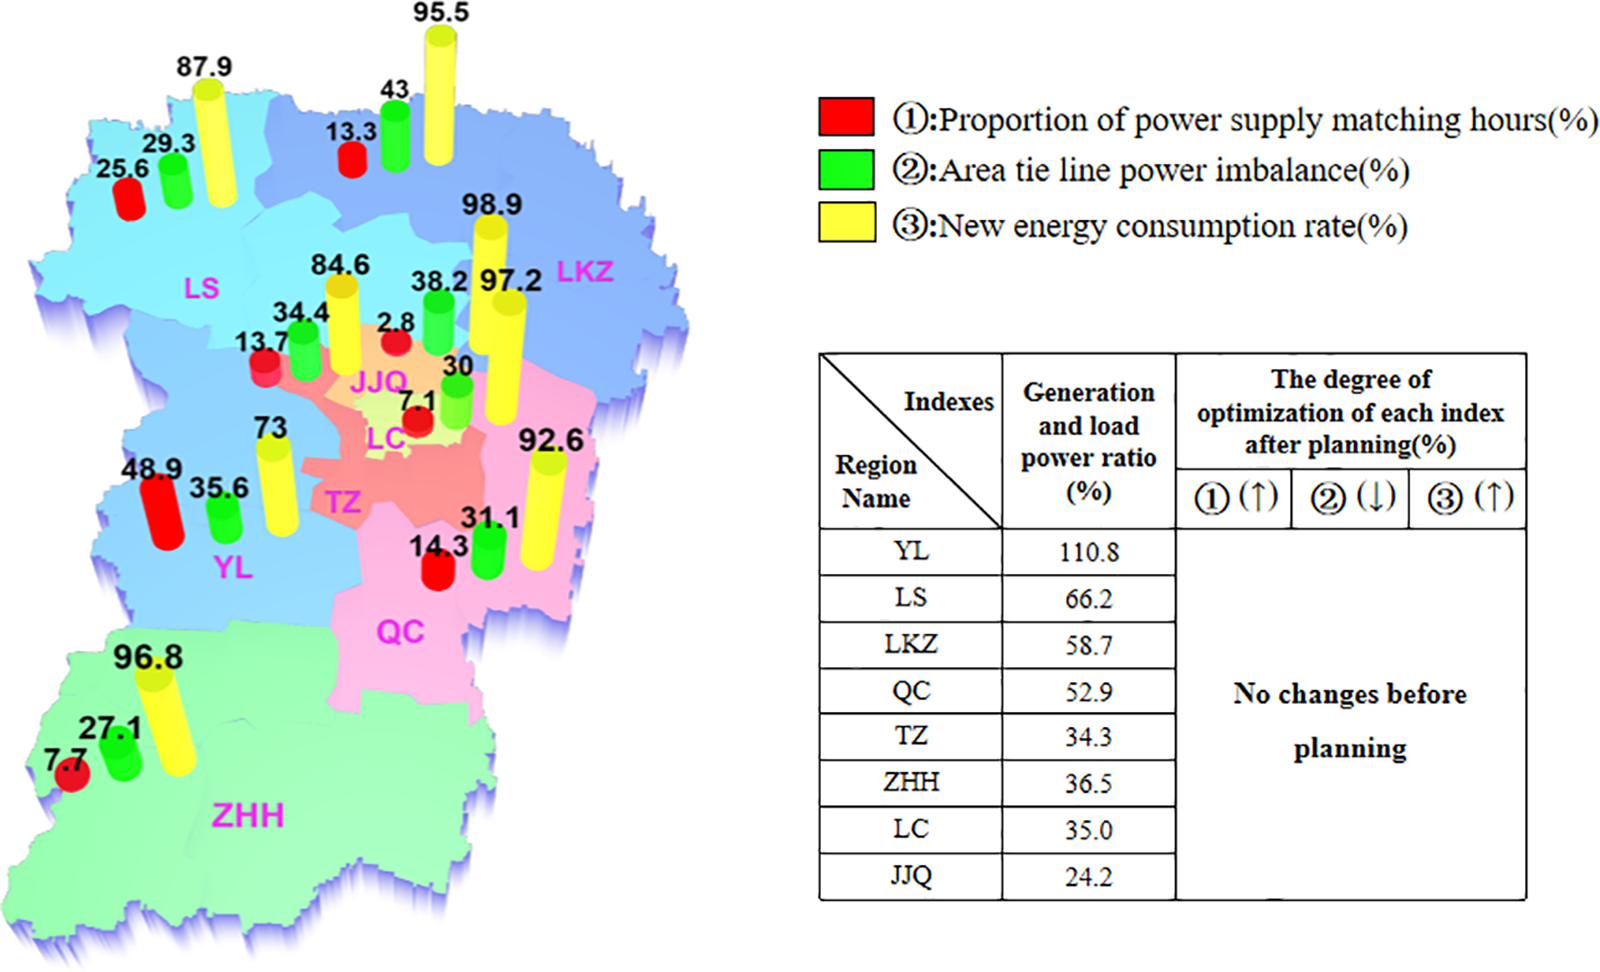
Figure 8: The degree of autonomy in the Planning Year before planning
According to the above data, it can be seen that the installed capacity and load of DGs in the Planning Year have changed. Compared with the Current Year, the regional generation and load power ratio has increased by an average of 16.7%, the proportion of power supply matching hours has increased by an average of 8.1%, and The overall average power imbalance of tie lines decreased by 0.5% and the overall average new energy consumption rate decreased by 4.5%. It shows that compared with the Current Year, the power balance in each region has improved in the planned year, which can reduce the regional dispatch pressure to a certain extent, but changes in the scale and type of regions have led to a decrease in the on-site consumption rate of renewable energy. Therefore, addressing the adverse impacts of the consumption of large-scale distributed power sources in the Planning Year, it becomes imperative to implement reasonable ES configurations and develop relevant ES control and operation strategies for different scales of regional grids within the county. This will enhance the regional autonomy capability effectively.
4.3.2 Enhanced Autonomy Capability
For the grid planning of each region in the Planning Year, formulate ES planning schemes according to the logic of ES planning for Luo Shi grids in Section 4.2.2. Through ES configuration and operation control, the level of autonomy of each grid in the county in the Planning Year is improved to varying degrees. Similarly, to highlight the advantages of the planning strategies proposed in this paper, S2 is applied to different types and scales of regional power grids under the same configuration as S1. The ES configuration shares and autonomy ratings of each region in the county in the Current Year under S1 and S2 are shown in Table 8.
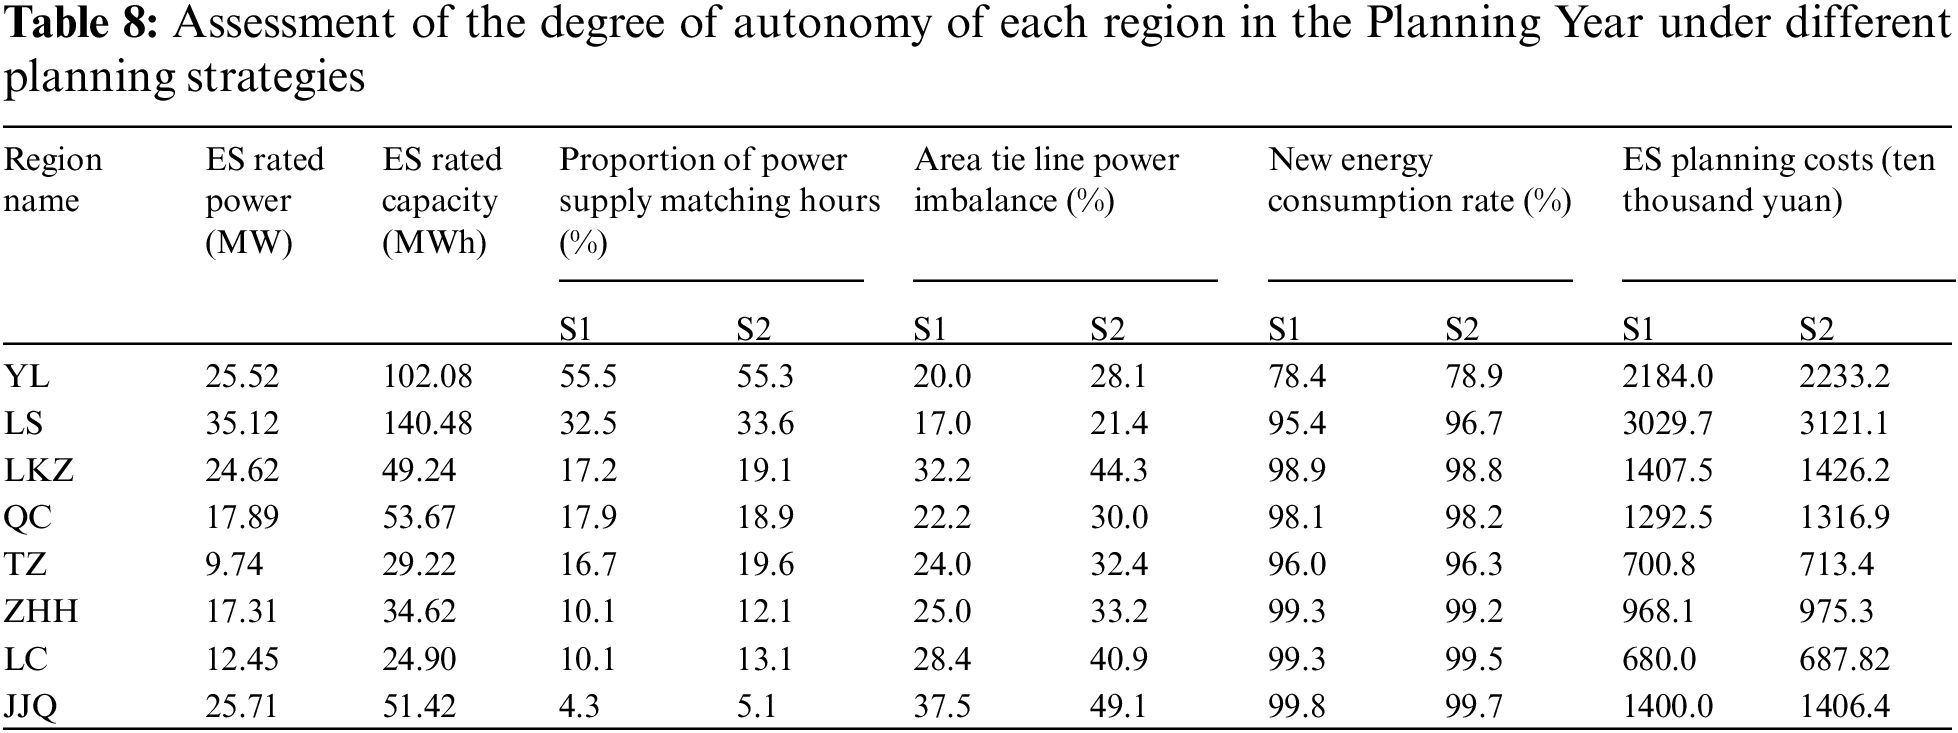
From Table 8, it is evident that, in the Planning Year, after implementing ES planning for regions of different scales and types, S1 proposed in this paper once again demonstrates superiority over S2. Although in the Current Year scenarios, S2 slightly outperforms S1 in terms of the proportion of hours with power supply matching and the new energy consumption rate, the scenarios for the Current Year witness changes in the scale and type of regions, For grids such as YL and LKZ, S2 does not optimize more effectively than S1 for these two autonomy indexes. Moreover, in terms of tie-line power imbalance and the economic feasibility of planning, S2 is far less advantageous than S1. Viewing grids like LKZ, ZHH, LC, and JJQ, planning with S2, compared to before planning, not only fails to optimize but significantly increases tie line imbalances, exacerbating the lack of coordination with the higher-level power grid, thereby hindering the autonomous development of regional power grids. This once again underscores the advantages of S1 proposed in this paper. Subsequently, a detailed analysis is focused on the application of S1 in regions of different scales and types, highlighting its effectiveness.
As can be seen from Fig. 9, by controlling the configuration of different proportions of ES in each region in the Planning Year, compared to before each region was not configured with ES, the proportion of matching hours of overall power supply in the county increased by an average of 3.9%, The new energy consumption rate increased by 4.8% on average and the tie line power imbalance decreased by 7.8% on average. From Section 4.3.1, it is evident that changes occurred in the distributed power capacity and load demand in the Planning Year, resulting in alterations in the types and scales of regional grids. Therefore, the following analysis is conducted to examine the application strategies for different types of regional grids post these changes.
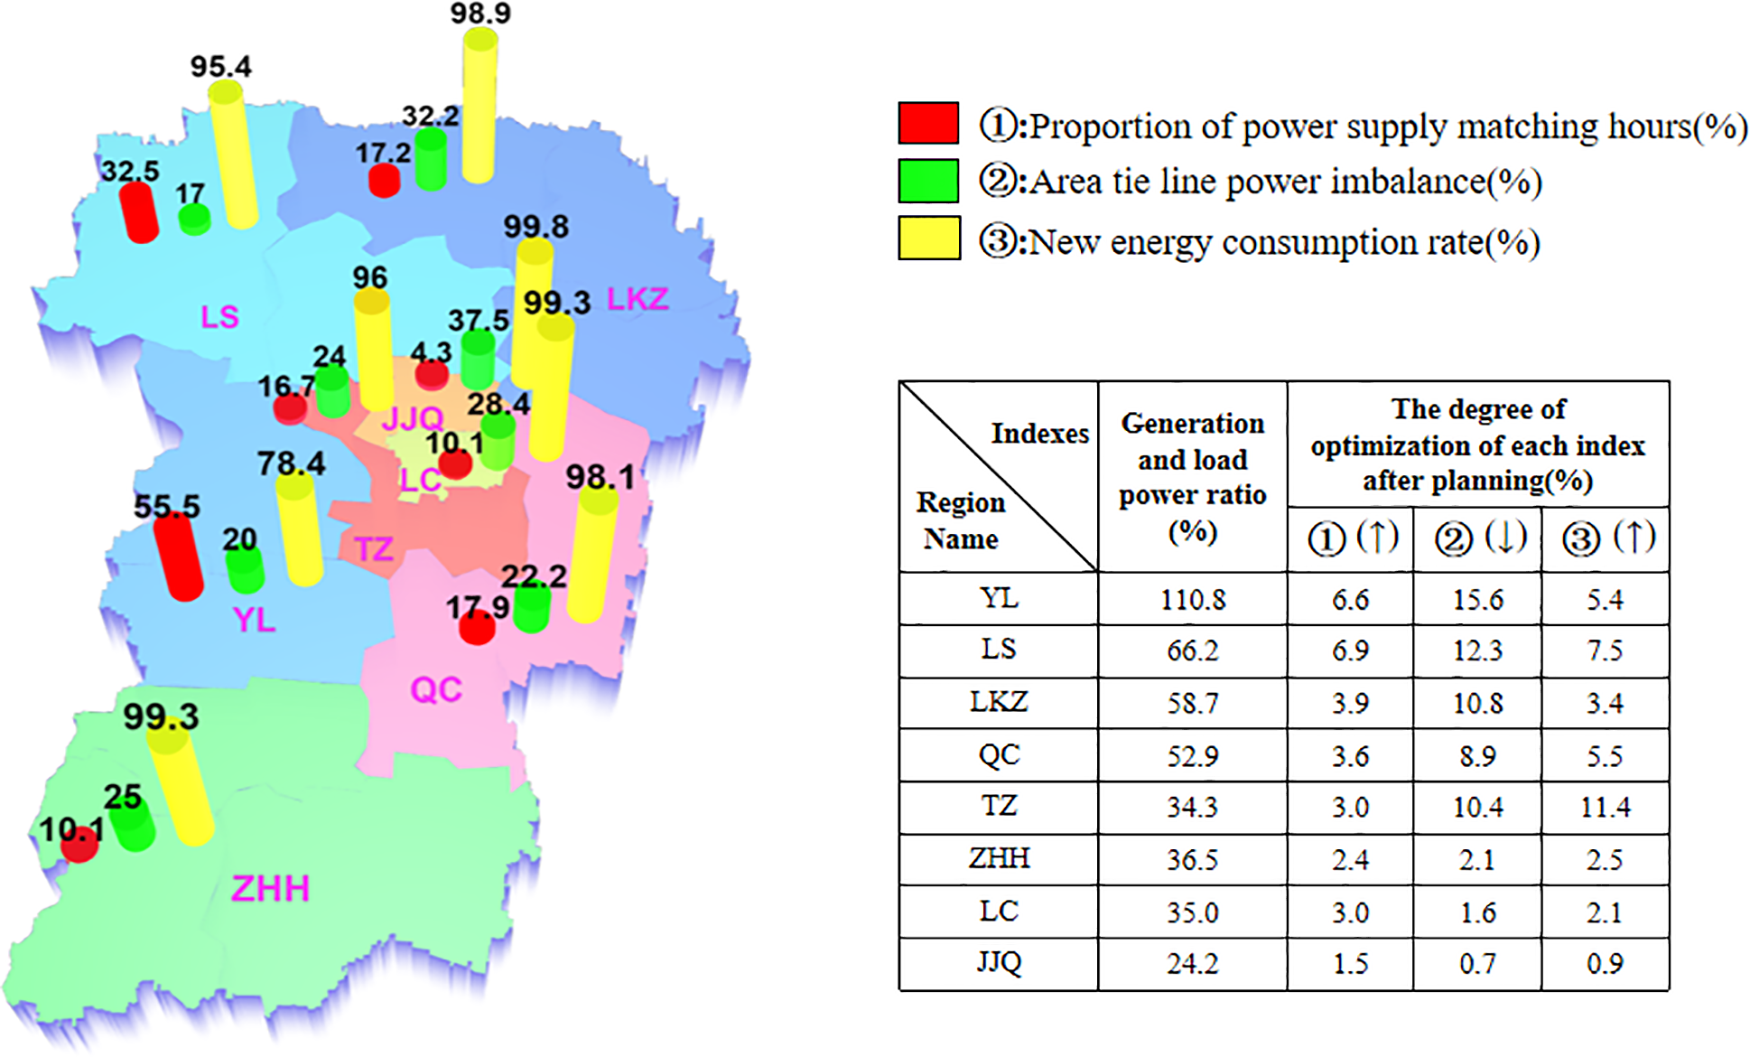
Figure 9: The degree of autonomy in the Planning Year after planning
For grids such as Yang Liu, Luo Shi, Liu Kong Zhao, and Qiao Cheng, characterized by a relatively high regional generation and load power ratio in the Planning Year, post-ES planning saw an average increase of 5.3% in the proportion of power supply matching hours and a 5.5% increase in new energy consumption rates. Simultaneously, the average reduction in the power imbalance of the tie line was 11.9%. Among these, Liu Kong Zhao and Qiao Cheng experienced a significant increase in their generation and load power ratio compared to the Current Year, becoming grids with higher proportionate ratios. For regional grids experiencing changes in scale, this strategy effectively mitigates the adverse effects of high proportionate electricity, enhancing the potential autonomy capability of such grid types to a maximum extent.
For grids such as Tuo Zhan, Zhang Huang Hua, Lao Cheng, and Ji Ju Qu, characterized by a relatively low regional generation and load power ratio in the Planning Year, post-ES planning saw an average increase of 2.5% and 4.2% in the proportion of power supply matching hours and new energy consumption rates, respectively. Simultaneously, the average reduction in the power imbalance of the tie line was 3.7%. These grids often require power input from tie-lines to maintain regional source-load balance throughout the year. Through the application of strategies, reliance on external electricity and scheduling pressure have been alleviated, enhancing the stability and reliability of the regional power grid.
In summary, the planning strategy proposed in this paper significantly enhances the self-sufficiency of the regional power grid by integrating ESSs, while also exhibiting high levels of flexibility and scalability. This strategy not only facilitates improvements in various types and scales of regional power grids in the Current Years but also enables rational and effective planning for the region in future Planning Years, thereby maximizing future regional autonomy capability. It contributes to advancing the grid towards intelligent and sustainable development.
4.3.3 Sensitivity Analysis of Planning Strategies during the Planning Year
The preceding sections outline the planning undertaken for the region five years hence. To fully illustrate the advantages of the planning strategies proposed in this paper, this section takes the planning horizon as a variable and observes the impact of different timeframes on regional autonomy and planning schemes. Taking the Luo Shi region as an example, the operational status of the region under various planning horizons is depicted in the following figure.
According to Fig. 10, with the change of planning years, the new energy and load demand in the region appears to grow, and before the ES planning, the proportion of power supply matching hours in the region appears to grow, but the degree of power balance of the tie line and the new energy consumption rate appear to decline. Through the strategy proposed in this paper for different years of regional planning, with the change of planning years, the proportion of ES configuration has a slightly increasing trend, but the planning benefits are very significant. As can be seen from the figure, the proportion of matching hours of regional power supply and the new energy consumption rate compared with the planning before a very significant increase, which greatly improves the level of autonomy capability in the region, making the region closely autonomous; in the tie line power imbalance degree has been significantly reduced, through the planning strategy greatly improves the coordination between the region and the higher-level grid, and promotes the coordinated development of the regional autonomy of the grid and the power distribution network.
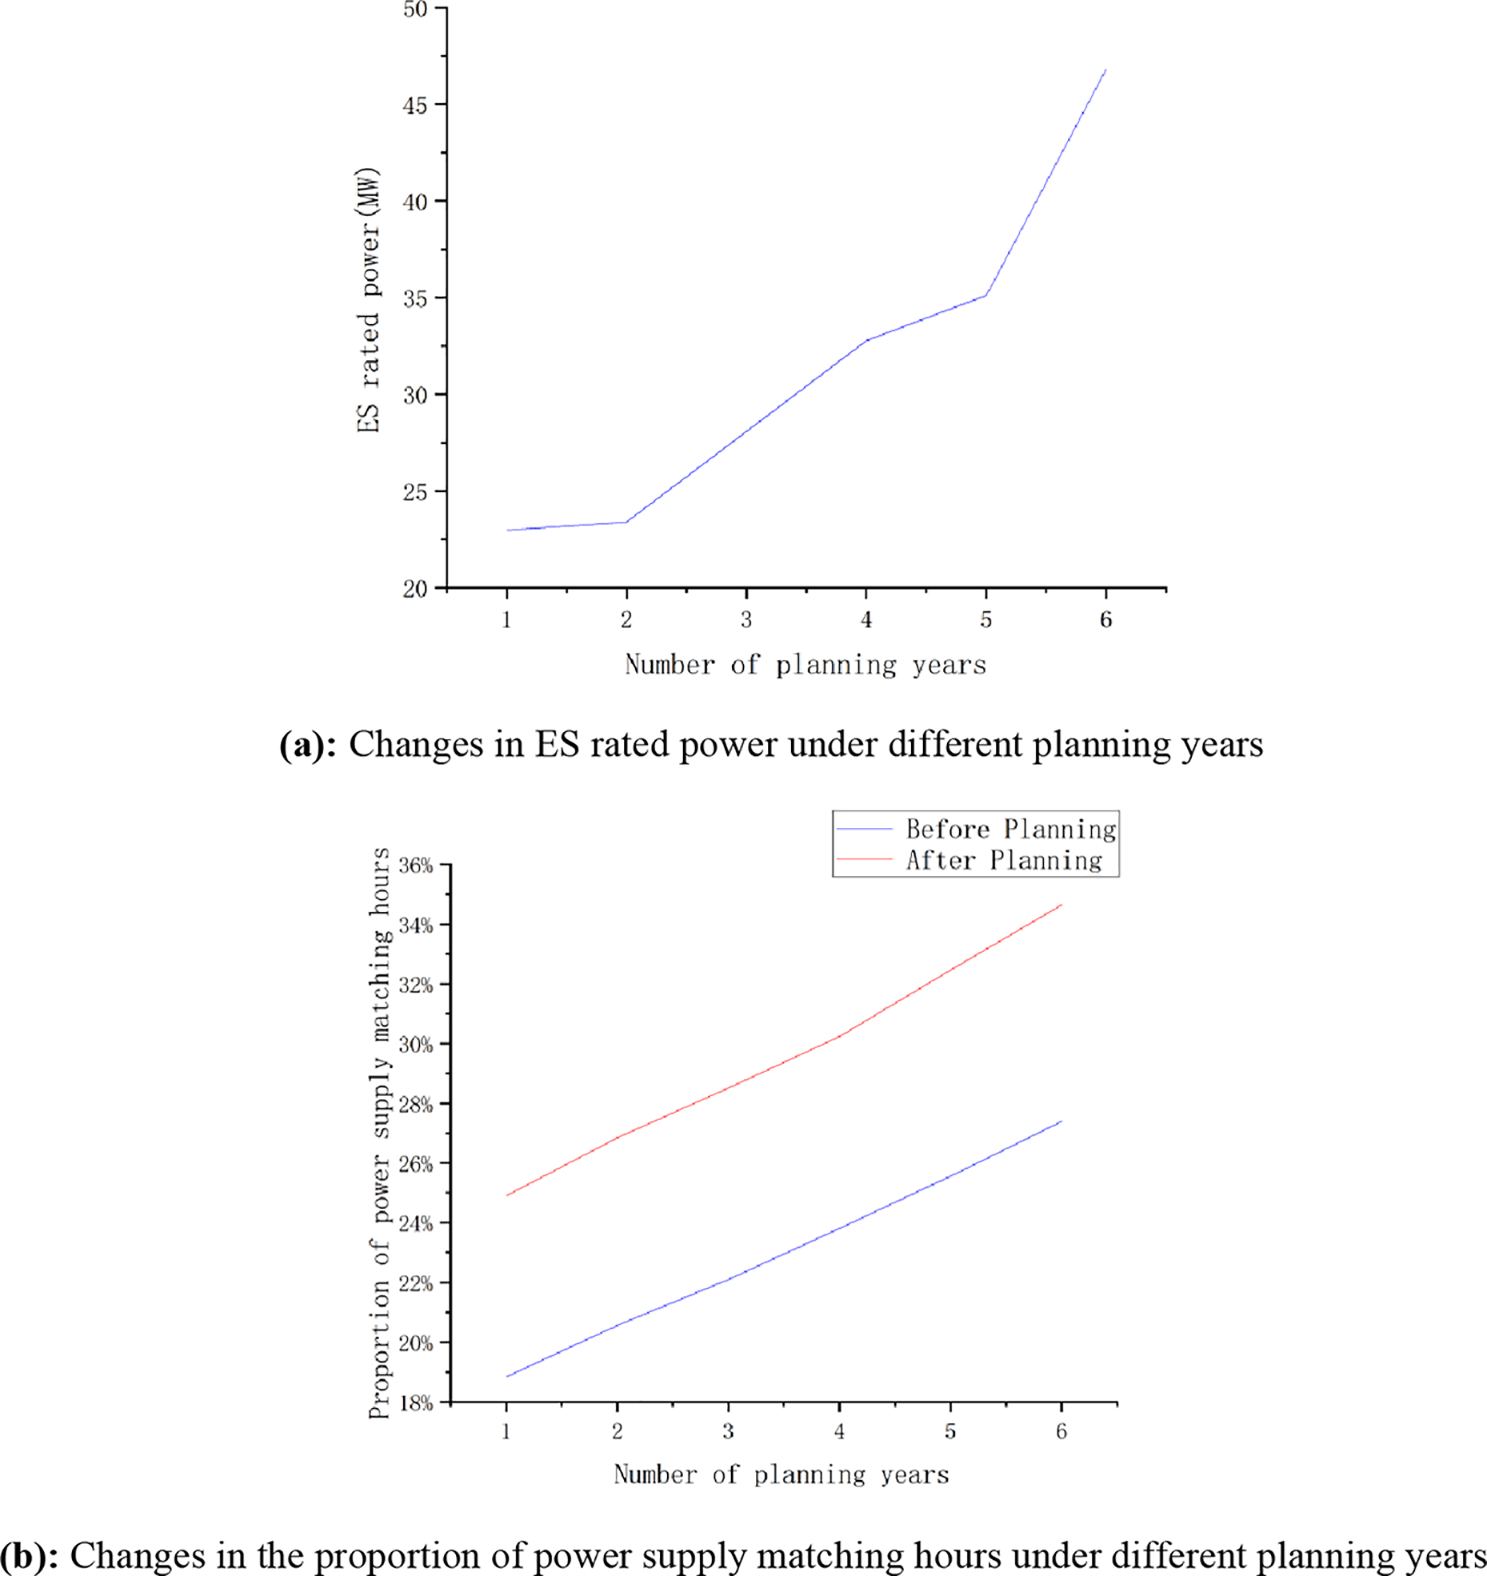
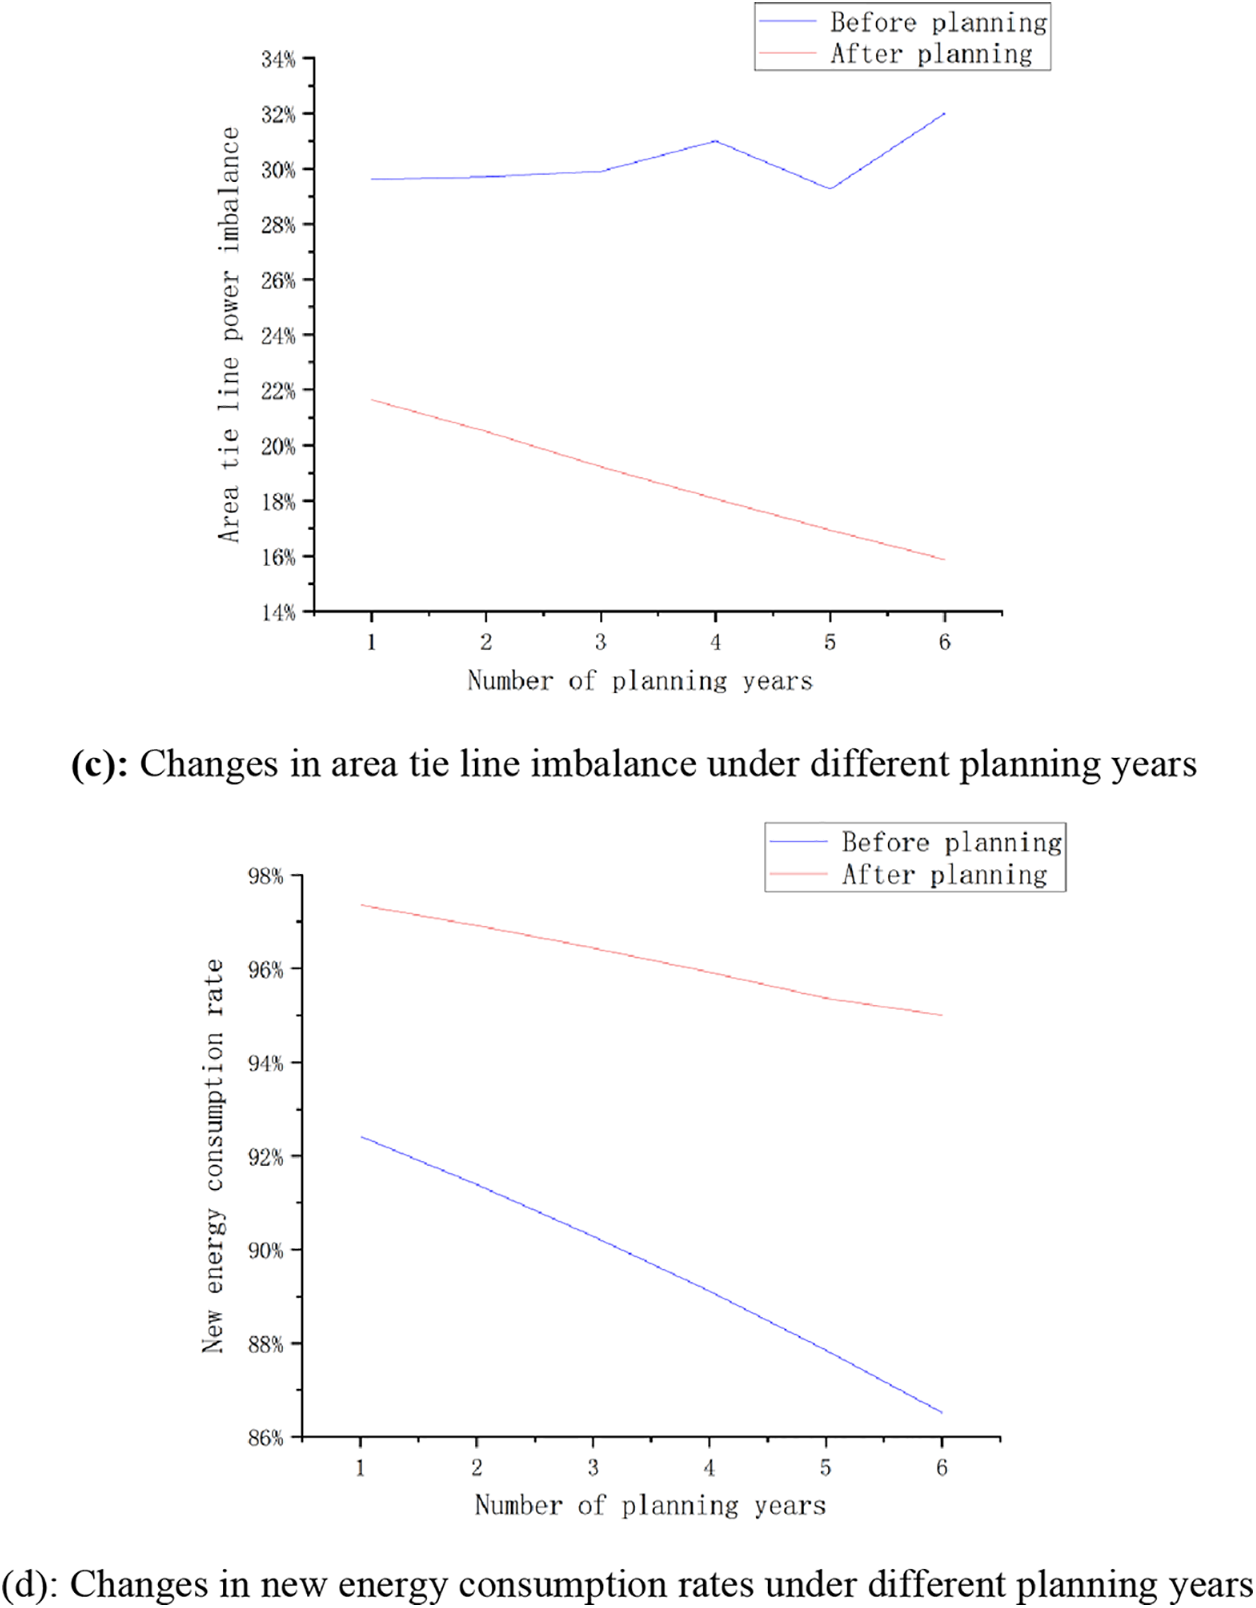
Figure 10: Changes in operating parameters under different planning years
In summary, the introduction of the planning strategy in different planning years greatly improves the autonomy capability of the area in different years, which reflects the applicability and practicality of the strategy. The introduction of the planning strategy promotes the application of clean energy, reduces carbon emissions, and improves environmental quality, thus making a positive contribution to environmental protection and sustainable development. Therefore, the adoption of this strategy is not only conducive to the optimization and upgrading of the power grid but also meets the social demand for environmentally friendly technologies, which is of great significance in promoting the development of the regional power grid in the direction of smarter, more efficient and sustainable.
To reduce the adverse effects when large-scale DGs are connected to the distribution network, this paper uses the operation mode of RAPGs and proposes a planning method to improve the autonomous capabilities of regional power grids considering multiple evaluation indexes, and through simulation verification, the following conclusions are obtained:
1. The regional power grid autonomy improvement strategy proposed in this paper, in the Current Year, through reasonable planning of the region, each region is better than the situation without applying the strategy. The county’s overall proportion of power supply matching hours and new energy consumption rate increased by an average of 2.5% and 2.1%, respectively, and the tie line power imbalance decreased by an average of 4.2%. It effectively promotes the local consumption of new energy in each region, improves the level of autonomy of each region, and reduces regional dispatch pressure.
2. During the Planning Year, DGs and loads increased. Through the planning of various regional power grids, the proportion of matching hours of overall power supply in the county increased by an average of 3.9%, the new energy consumption rate increased by an average of 4.8%, and The tie line power imbalance was reduced by 7.8% on average. It effectively improved the level of autonomy of each region in the Planning Year and proposed guiding planning plans for each regional Planning Year.
Therefore, the regional grid planning strategies proposed in this study hold significant practical significance and wide-ranging applicability. They comprehensively consider the characteristics of various types of regional grids, thereby enabling targeted optimization and improvement for grids of different types and scales, ultimately maximizing the autonomy capability of regional power grids. This contributes to reducing energy consumption, decreasing reliance on traditional fossil fuels in the power system, assisting China in achieving carbon neutrality goals, mitigating greenhouse gas emissions, enhancing ecological environmental quality, and advancing the implementation of sustainable development strategies. However, the strategy research in this study may be based on certain assumptions, such as the accuracy of load and distributed power forecasts for the Planning Year, which could influence the results. Therefore, more accurate data and models are required to validate the reliability of the results. In the future, enhancing the reliability and accuracy of data through more refined load forecasting models, new energy generation forecasting models, etc., will enhance the credibility of research results, provide more beneficial guidance for regional resource planning, and promote the implementation of a low-carbon economy and sustainable development strategies.
Acknowledgement: The authors acknowledge the reviewers for providing valuable comments and helpful suggestions to enhance the manuscript.
Funding Statement: The study was supported by the State Grid Henan Economic Research Institute Science and Technology Project “Calculation and Demonstration of Distributed Photovoltaic Open Capacity Based on Multi-Source Heterogeneous Data” (5217L0230013).
Author Contributions: The authors confirm contribution to the paper as follows: study conception and design: Jie Ma, Tong Zhao; data collection: Yuanzhao Hao, Wenwen Qin, Haozheng Yu; analysis and interpretation of results: Mingxuan Du, Yuanhong Liu, Liang Zhang; draft manuscript preparation: Shixia Mu, Cuiping Li, Junhui Li. All authors reviewed the results and approved the final version of the manuscript.
Availability of Data and Materials: The data used to support the findings of this study are available from the corresponding author upon request.
Conflicts of Interest: The authors declare that they have no conflicts of interest to report regarding the present study.
References
1. M. Barukčić, Ž. Hederić, M. Hadžiselimović, and S. Seme, “A simple stochastic method for modelling the uncertainty of photovoltaic power production based on measured data,” Energy, vol. 165, pp. 246–256, Dec. 2018. doi: 10.1016/j.energy.2018.09.134. [Google Scholar] [CrossRef]
2. M. Saric, J. Hivziefendic, T. Konjic, and A. Ktena, “Distributed generation allocation considering uncertainties,” Int. Trans. Electr. Energy Syst., vol. 28, no. 9, pp. e2585, Apr. 2018. doi: 10.1002/etep.2585. [Google Scholar] [CrossRef]
3. A. R. Jordehi, “How to deal with uncertainties in electric power systems? A review,” Renew. Sustain. Energy Rev., vol. 96, pp. 145–155, Nov. 2018. doi: 10.1016/j.rser.2018.07.056. [Google Scholar] [CrossRef]
4. A. Ehsan, M. Cheng, and Q. Yang, “Scenario-based planning of active distribution systems under uncertainties of renewable generation and electricity demand,” CSEE J. Power Energy Syst., vol. 5, no. 1, pp. 56–62, Mar. 2019. doi: 10.17775/CSEEJPES.2018.00460. [Google Scholar] [CrossRef]
5. L. Mariam, M. Basu, and M. F. Conlon, “Microgrid: Architecture, policy and future trends,” Renew. Sustain. Energ. Rev., vol. 64, no. 3, pp. 477–489, Oct. 2016. doi: 10.1016/j.rser.2016.06.037. [Google Scholar] [CrossRef]
6. R. Cossent, L. Olmos, T. Gómez, C. Mateo, and P. Frías, “Distribution network costs under different penetration levels of distributed generation,” Eur. Trans. Electrical Power, vol. 21, no. 6, pp. 1869–1888, Sep. 2011. doi: 10.1002/etep.503. [Google Scholar] [CrossRef]
7. F. Ugranli, C. Ersavaş, and E. Karatepe, “Neural network based distributed generation allocation for minimizing voltage fluctuation due to uncertainty of the output power,” in Int. Symp. Innov. Intell. Syst. Appl., IEEE, Jun. 2011, pp. 415–419. [Google Scholar]
8. D. Wei et al., “Flexibility-enhanced strategies of generations to improve the integration of renewable energy considering uncertainties,” Energy Rep., vol. 9, no. 7, pp. 1717–1725, Sep. 2023. doi: 10.1016/j.egyr.2023.04.204. [Google Scholar] [CrossRef]
9. S. R. Salkuti, “Optimal operation management of grid-connected microgrids under uncertainty,” Indones. J. Electr. Eng. Comput. Sci., vol. 16, no. 3, pp. 1163–1170, Dec. 2019. doi: 10.11591/ijeecs.v16.i3.pp1163-1170. [Google Scholar] [CrossRef]
10. X. Chen, R. Qiu, and X. Wu, “Multi-timescale capacity configuration optimization of energy storage equipment in power plant-carbon capture system,” Appl. Therm. Eng., vol. 227, pp. 120371, Jun. 2023. doi: 10.1016/j.applthermaleng.2023.120371. [Google Scholar] [CrossRef]
11. H. Zhu, R. Hou, T. Jiang, and Q. Lv, “Research on energy storage capacity configuration for PV power plants using uncertainty analysis and its applications,” Global Energy Interconnect., vol. 4, no. 6, pp. 608–618, Dec. 2021. doi: 10.1016/j.gloei.2022.01.004. [Google Scholar] [CrossRef]
12. Y. L. Wang, H. Y. Yu, X. H. Wang, F. L. Zhang, and Y. J. Huang, “Consideration of reliability and economy to Capacity Configuration of energy storage system: Case study of a large scale wind power plant in the Northwest China,” Energy Proc., vol. 152, no. 1, pp. 149–155, Oct. 2018. doi: 10.1016/j.egypro.2018.09.073. [Google Scholar] [CrossRef]
13. Z. Fan, Z. Wan, L. Gao, Y. Xiong, and G. Song, “A multi-objective optimal configuration method for microgrids considering zero-carbon operation,” IEEE Access, vol. 11, pp. 87366–87379, 2023. doi: 10.1109/ACCESS.2023.3303926. [Google Scholar] [CrossRef]
14. F. Zheng, X. Meng, T. Xu, Y. Sun, and H. Wang, “Optimization method of energy storage configuration for distribution network with high proportion of photovoltaic based on source-load imbalance,” Sustainability, vol. 15, no. 13, pp. 10628, Jul. 2023. doi: 10.3390/su151310628. [Google Scholar] [CrossRef]
15. T. Hao et al., “Optimal configuration of energy storage considering the source-load uncertainty under ladder-type carbon trading,” (in ChinesePower Syst. Protect. Control, vol. 51, no. 1, pp. 101–112, Jan. 2023. doi: 10.19783/j.cnki.pspc.220178. [Google Scholar] [CrossRef]
16. X. Wu, M. He, W. He, X. Li, P. Wang and Y. Wu, “Optimal capacity of a wind-solar-thermo-storage-bundled power transmission system considering battery life,” (in ChinesePower Syst. Protect. Control, vol. 51, no. 15, pp. 66–75, Aug. 2023. doi: 10.19783/j.cnki.pspc.221963. [Google Scholar] [CrossRef]
17. C. Liu, Z. Cheng, W. Yao, and T. Li, “Research and application of distributed energy storage and distributed photovoltaic economic optimal configuration method considering multiple constraints,” J. Phys.: Conf. Ser., vol. 2495, no. 1, pp. 012012, May 2023. doi: 10.1088/1742-6596/2495/1/012012. [Google Scholar] [CrossRef]
18. M. Gao, Z. Han, C. Zhang, P. Li, and D. Wu, “Optimal configuration for regional integrated energy systems with multi-element hybrid energy storage,” Energy, vol. 277, pp. 127672, Aug. 2023. doi: 10.1016/j.energy.2023.127672. [Google Scholar] [CrossRef]
19. M. İnci and K.Ç. Bayındır, “Single-stage vehicular fuel cell system with harmonic elimination capability to suppress distortion effects of electric vehicle parking lots,” J. Power Sources, vol. 597, no. 2, pp. 234175, Mar. 2024. doi: 10.1016/j.jpowsour.2024.234175. [Google Scholar] [CrossRef]
20. H. Zhou, P. Zhang, Y. Luo, S. Zheng, M. Qiu and K. Liao, “Evaluation index system and evaluation method of energy storage and regional power grid coordinated peak regulation ability,” Energy Rep., vol. 9, no. A, pp. 609–617, Oct. 2023. doi: 10.1016/j.egyr.2023.05.047. [Google Scholar] [CrossRef]
21. Y. Li, J. Liu, M. Huang, S. Yu, and H. Liu, “A comprehensive evaluation indicator system of source-grid-load interaction,” in 2019 IEEE 3rd Conf. Energy Internet Energy Syst. Integrat., IEEE, Nov. 2019, pp. 2043–2047. [Google Scholar]
22. X. Shi et al., “Research on energy storage configuration method based on wind and solar volatility,” in 2020 10th Int. Conf. Power Energy Syst., IEEE, Dec. 2020, pp. 464–468. [Google Scholar]
23. Z. Shi, W. Wang, L. Dong, Y. Huang, and P. Li, “Simultaneous optimization of renewable energy and energy storage capacity with the hierarchical control,” CSEE J. Power Energy Syst., vol. 8, no. 1, pp. 95–104, Jan. 2022. doi: 10.17775/CSEEJPES.2019.01470. [Google Scholar] [CrossRef]
24. Y. Zhao et al., “Evaluation method for security and economic operation of power system with high penetration of renewable energy,” in 2022 2nd Int. Conf. Elect. Eng. Control Sci., IEEE, 2022, pp. 518–522. [Google Scholar]
25. X. Xu et al., “Comprehensive evaluation of coordination development for regional power grid and renewable energy power supply based on improved matter element extension and TOPSIS method for sustainability,” Sustainability, vol. 8, no. 2, pp. 143, Feb. 2016. doi: 10.3390/su8020143. [Google Scholar] [CrossRef]
Cite This Article
 Copyright © 2024 The Author(s). Published by Tech Science Press.
This work is licensed under a Creative Commons Attribution 4.0 International License , which permits unrestricted use, distribution, and reproduction in any medium, provided the original work is properly cited.
 Downloads
 Citation Tools