
 Submit a Paper
 Propose a Special lssue
 Open Access
ARTICLE

A Two-Layer Active Power Optimization and Coordinated Control for Regional Power Grid Partitioning to Promote Distributed Renewable Energy Consumption
1 Key Laboratory of Measurement and Control of CSE, Southeast University, Nanjing, 210096, China
2 China Electric Power Research Institute, Nanjing, 210003, China
3 State Grid Shandong Electric Power Research Institute, Jinan, 250003, China
* Corresponding Author: Kun Yuan. Email:
Energy Engineering 2024, 121(9), 2479-2503. https://doi.org/10.32604/ee.2024.050852
Received 20 February 2024; Accepted 25 April 2024; Issue published 19 August 2024
 View Full Text
 Download PDF
Abstract
With the large-scale development and utilization of renewable energy, industrial flexible loads, as a kind of load-side resource with strong regulation ability, provide new opportunities for the research on renewable energy consumption problem in power systems. This paper proposes a two-layer active power optimization model based on industrial flexible loads for power grid partitioning, aiming at improving the line over-limit problem caused by renewable energy consumption in power grids with high proportion of renewable energy, and achieving the safe, stable and economical operation of power grids. Firstly, according to the evaluation index of renewable energy consumption characteristics of line active power, the power grid is divided into several partitions, and the inter-zone tie lines are taken as the optimization objects. Then, on the basis of partitioning, a two-layer active power optimization model considering the power constraints of industrial flexible loads is established. The upper-layer model optimizes the planned power of the inter-zone tie lines under the constraint of the minimum peak-valley difference within a day; the lower-layer model optimizes the regional source-load dispatching plan of each resource in each partition under the constraint of the minimum operation cost of the partition, so as to reduce the line over-limit phenomenon caused by renewable energy consumption and save the electricity cost of industrial flexible loads. Finally, through simulation experiments, it is verified that the proposed model can effectively mobilize industrial flexible loads to participate in power grid operation and improve the economic stability of power grid.Keywords
With the deepening of China’s energy transition, renewable energy, especially wind and solar energy, has become an important part of China’s power system, providing strong support for achieving the goals of “carbon peak” and “carbon neutrality” [1,2]. However, the intermittency, fluctuation, and uncertainty of renewable energy also bring great challenges to the operation of power systems [3], such as power balance, grid security and stability, power quality, etc. To solve these problems, it is necessary to improve the flexibility of power system from multiple perspectives [4], to adapt to the characteristics of renewable energy, to enhance the consumption capacity of renewable energy, to reduce the related problems caused by renewable energy consumption, and to realize the effective utilization of renewable energy.
At present, there are many solutions proposed for the problem of renewable energy consumption, such as increasing energy storage devices [5], expanding cross-regional transmission capacity, optimizing the dispatching strategy of generating units [6], etc. Among them, power grid partitioning [7] and load-side management [8] are two solutions with high potential and value. Power grid partitioning refers to dividing the power grid into several relatively independent regions, aggregating a certain proportion of renewable energy, energy storage, load, and other resources within each region, and realizing the autonomous consumption and autonomous operation within the region through the coordinated control of source-grid-load-storage. The regions exchange limited electric energy through tie lines [9], to improve the coordination and stability of the whole power grid [10]. The advantage of power grid partitioning is that it can effectively reduce the scale and complexity of the power grid, reduce the impact of renewable energy fluctuation on the power grid, and improve the reliability and security of the power grid. Load-side management refers to guiding power users to adjust their electricity plans and behaviors according to the operation status of the power system and market signals, by using price signals or incentive mechanisms, so as to change the load of electricity demand [11]. The advantage of load-side management is that it can effectively utilize the power regulation ability of power users, realize the interactive regulation of load and power grid, and increase the flexibility and economy of the power system [12,13].
The scheme of combining load-side management and power grid partitioning has many advantages, such as fully utilizing the flexible resources of the demand side, realizing the interactive regulation of load and power grid, increasing the flexibility and economy of the power system, and effectively reducing the scale and complexity of power grid, reducing the impact of renewable energy fluctuation on the power grid, and improving the reliability and security of power grid. Therefore, many scholars have conducted research in this area. Zhao et al. [14] proposed a comprehensive partitioning index combining supply-demand balance, response speed and modularity, to improve the ability of distributed generation to participate in power grid frequency control; Wu et al. [15] established a combined prediction model considering generalized demand-side response resources, according to the different characteristics of response load and traditional load, which has better load resource prediction performance; Asgharzadeh et al. [16] proposed a hierarchical partitioning dynamic regulation architecture, and established a standardization system for the hierarchical partitioning dynamic regulation architecture, to cope with the high proportion of clean energy access, the high requirements of demand-side load resource management and power system supply-demand balance, and promoted the development of new type of power load management; Shi et al. [17] proposed a bi-level programming method for optimizing the allocation of electric vehicle charging stations considering wind power generation, which optimized the station profit and the grid loss from two perspectives, and considered the impacts of crypto-currency mining and demand side management, it used scenario-based uncertainty analysis and genetic algorithm to solve the problem, and the results showed that the method could effectively reduce the grid loss and increase the station profit. References [14–17] showed that there are few studies on the participation of industrial flexible loads in renewable energy consumption, and most of them ignore the line over-limit phenomenon caused by renewable energy consumption. Industrial flexible loads can not only provide larger regulation amplitude and faster response speed, but also realize the minimization of electricity cost according to the price signal of the power market, without affecting production. Applying the idea of load-side management and power grid partitioning to participate in power system optimization to the use of industrial flexible loads to participate in the optimization of high-proportion renewable energy power grid transmission line active power, can effectively improve the line over-limit problem caused by renewable energy consumption.
Additionally, in the array of strategies to enhance the flexibility of power systems and the integration of new energy sources, energy storage systems emerge as a pivotal technology. Capable of storing surplus energy from new energy production and releasing it during peak demand or shortages, these systems play a vital role in balancing grid loads and bolstering system stability. While not the central focus of this paper, energy storage systems are acknowledged for their critical function in demonstrating the influence of diverse resources on grid operations. Thus, in our discourse on new energy assimilation solutions, we will pay particular attention to the role of energy storage systems, delving into their potential to support the operation of grids with a substantial proportion of new energy.
Therefore, this paper introduces industrial flexible loads as an important demand-side resource into the power grid partitioning scheme of renewable energy consumption, and establishes a two-layer active power optimization model based on industrial flexible loads for high-proportion renewable energy power grid partitioning, to achieve the safe, stable and economical operation of power grid. Firstly, this paper proposes an evaluation index of renewable energy consumption characteristics of line active power, and partitions the power grid according to this index. Then, on the basis of partitioning, a two-layer active power optimization model considering the power constraint of industrial flexible loads is established. The upper-layer model optimizes the planned power of the inter-zone tie lines under the constraint of the minimum peak-valley difference within a day; the lower-layer model optimizes the regional source-load dispatching plan of each resource in each partition under the constraint of the minimum operation cost of the partition, so as to reduce the line over-limit phenomenon caused by renewable energy consumption and save the electricity cost of industrial flexible loads. Finally, through simulation on the IEEE33-node distribution network, once the power system receives the signal that the transmission line will be over-limited by forcing the consumption of renewable energy with large fluctuation, various flexible resources (including industrial flexible loads) will be dispatched to participate in the load-side management of power system to achieve the safe and stable operation of power grid. The simulation results show that using industrial flexible loads to participate in power system renewable energy consumption can not only effectively solve the line over-limit problem, improve the flexibility of the power system, but also improve the economy of the power system to some extent.
2 A Method of Power Grid Active Power Partitioning Considering Renewable Energy Consumption
2.1 Evaluation Index of Renewable Energy Consumption Characteristics
Line weight refers to the importance of lines in the power grid topology of the power system. Considering the influence of voltage level on line power flow, the power transmission size between node
In the formula:
Line transmission efficiency is an important indicator to measure the quality and performance of transmission lines, and one of the important indicators to evaluate the merits of transmission lines. The transmission efficiency of line l in the dispatching period is defined as:
In the formula:
This paper considers the power flow distribution characteristics of power grids with a high proportion of renewable energy, combines the line transmission efficiency
In the formula:
According to Eq. (4), lines with higher
2.2 Power Grid Partitioning Evaluation Indicators
In order to evaluate the quality of the power grid partitioning results, modularity is introduced as an evaluation indicator. Modularity
In the formula:
Modularity
In addition to the power grid partitioning results, the rationality of the resource distribution and quantity in each partition should also be considered. Considering the background of industrial flexible loads participating in renewable energy consumption, this paper sets the following partitioning criteria to further evaluate the power grid partitioning results and improve the rationality of the partitioning results. The partitioning criteria are as follows:
First: Each partition should have at least one conventional power generation unit node to provide electric energy.
Second: The topology structure of each partition power grid needs to be clearly decomposed, but it does not include the situation of single node or very few nodes forming a partition after disconnecting the edge with the largest renewable energy consumption characteristic index.
2.3 Power Grid Partitioning Algorithm Based on Renewable Energy Consumption Index
Traditional power grid partitioning is mostly based on regional orientation, and inter-regional tie lines only bear the function of power transfer between regions. Traditional inter-regional tie lines are not necessarily the most optimal objects. By using renewable energy consumption indicators, we can find out the lines that have strong correlation ability but low transmission efficiency in the power grid, and use them as inter-regional tie lines. By finding and setting multiple inter-regional tie lines, we can realize the regional partitioning of the power grid, and use the modularity
The specific partitioning algorithm process is shown in the Fig. 1.
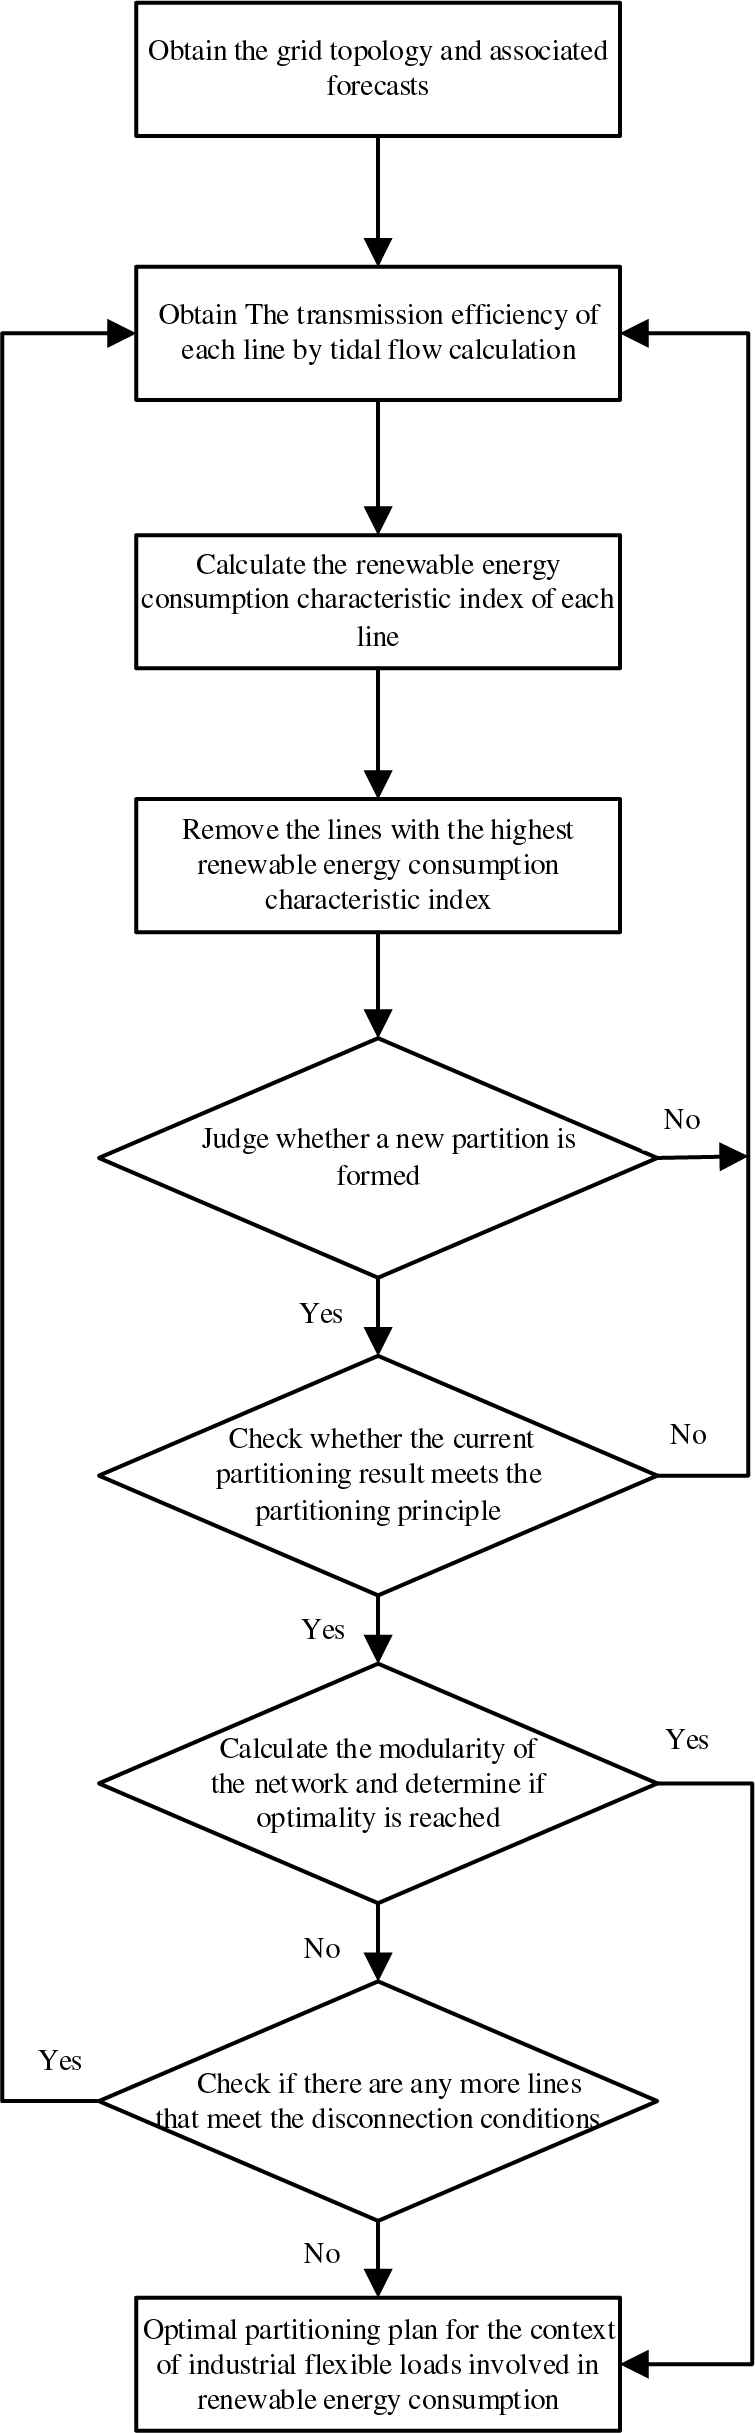
Figure 1: Flow of partitioning algorithm
The algorithm process is explained as follows:
Step 1: Abstract the actual power grid into a complex network model, obtain the power grid topology structure, and simplify it appropriately;
Step 2: Obtain the power generation plan value, renewable energy output forecast value, power consumption forecast value, line power fluctuation amplitude value, and transmission efficiency of the regional power grid;
Step 3: Calculate the renewable energy consumption characteristic index
Step 4: If a new partition is formed, calculate the modularity of the network; if no new partition is formed, return to step 3;
Step 5: Check whether the current partitioning result meets the partitioning principle, if it meets, the partitioning is considered feasible, otherwise merge the adjacent partitions and return to step 2;
Step 6: Determine whether the network partitioning is completed, if completed, record the modularity obtained after removing the line each time;
Step 7: Find the maximum modularity, and the corresponding partitioning result is the optimal partitioning plan for the context of industrial flexible loads involved in renewable energy consumption.
3 Two-Layer Active Power Optimization Model for Tie-Line Based on Power Grid Partitioning
This paper proposes a two-layer cyclic optimization model for a power grid dispatching plan that conforms to the partitioning structure, based on the premise of partitioning based on renewable energy consumption characteristic index, to optimize the transmission power of inter-zone tie-line, by incorporating industrial flexible loads with fast response speed and large regulation range into the regulation category, to cope with the high requirements of response speed and operation stability of power system caused by the drastic output change of renewable energy.
The upper-layer model solves the planned power of the inter-zone tie-line that satisfies the minimum peak-valley difference within a day under the transmission limit of the line, and transmits the planned power of the inter-zone tie-line as the regulation indicator to the lower-layer partitions. The lower-layer model optimizes the regional source-load dispatching plan according to the upper-layer regulation indicator and the dispatching cost of each resource actually owned by the local partition, and transfers the actual dispatching plan of the regional source-load to the upper-layer model. The upper-layer model optimizes the planned power of the inter-zone tie-line according to the planned power of the tie-line in the lower layer, and repeats the cycle until the final regional source-load dispatching plan is obtained, which can meet the renewable energy consumption requirements of the global level and the local level of the partition as much as possible, and ensure the safe and stable operation of the power system.
In summary, the two-layer active power optimization model for tie-line based on power grid partitioning is shown in Fig. 2, where
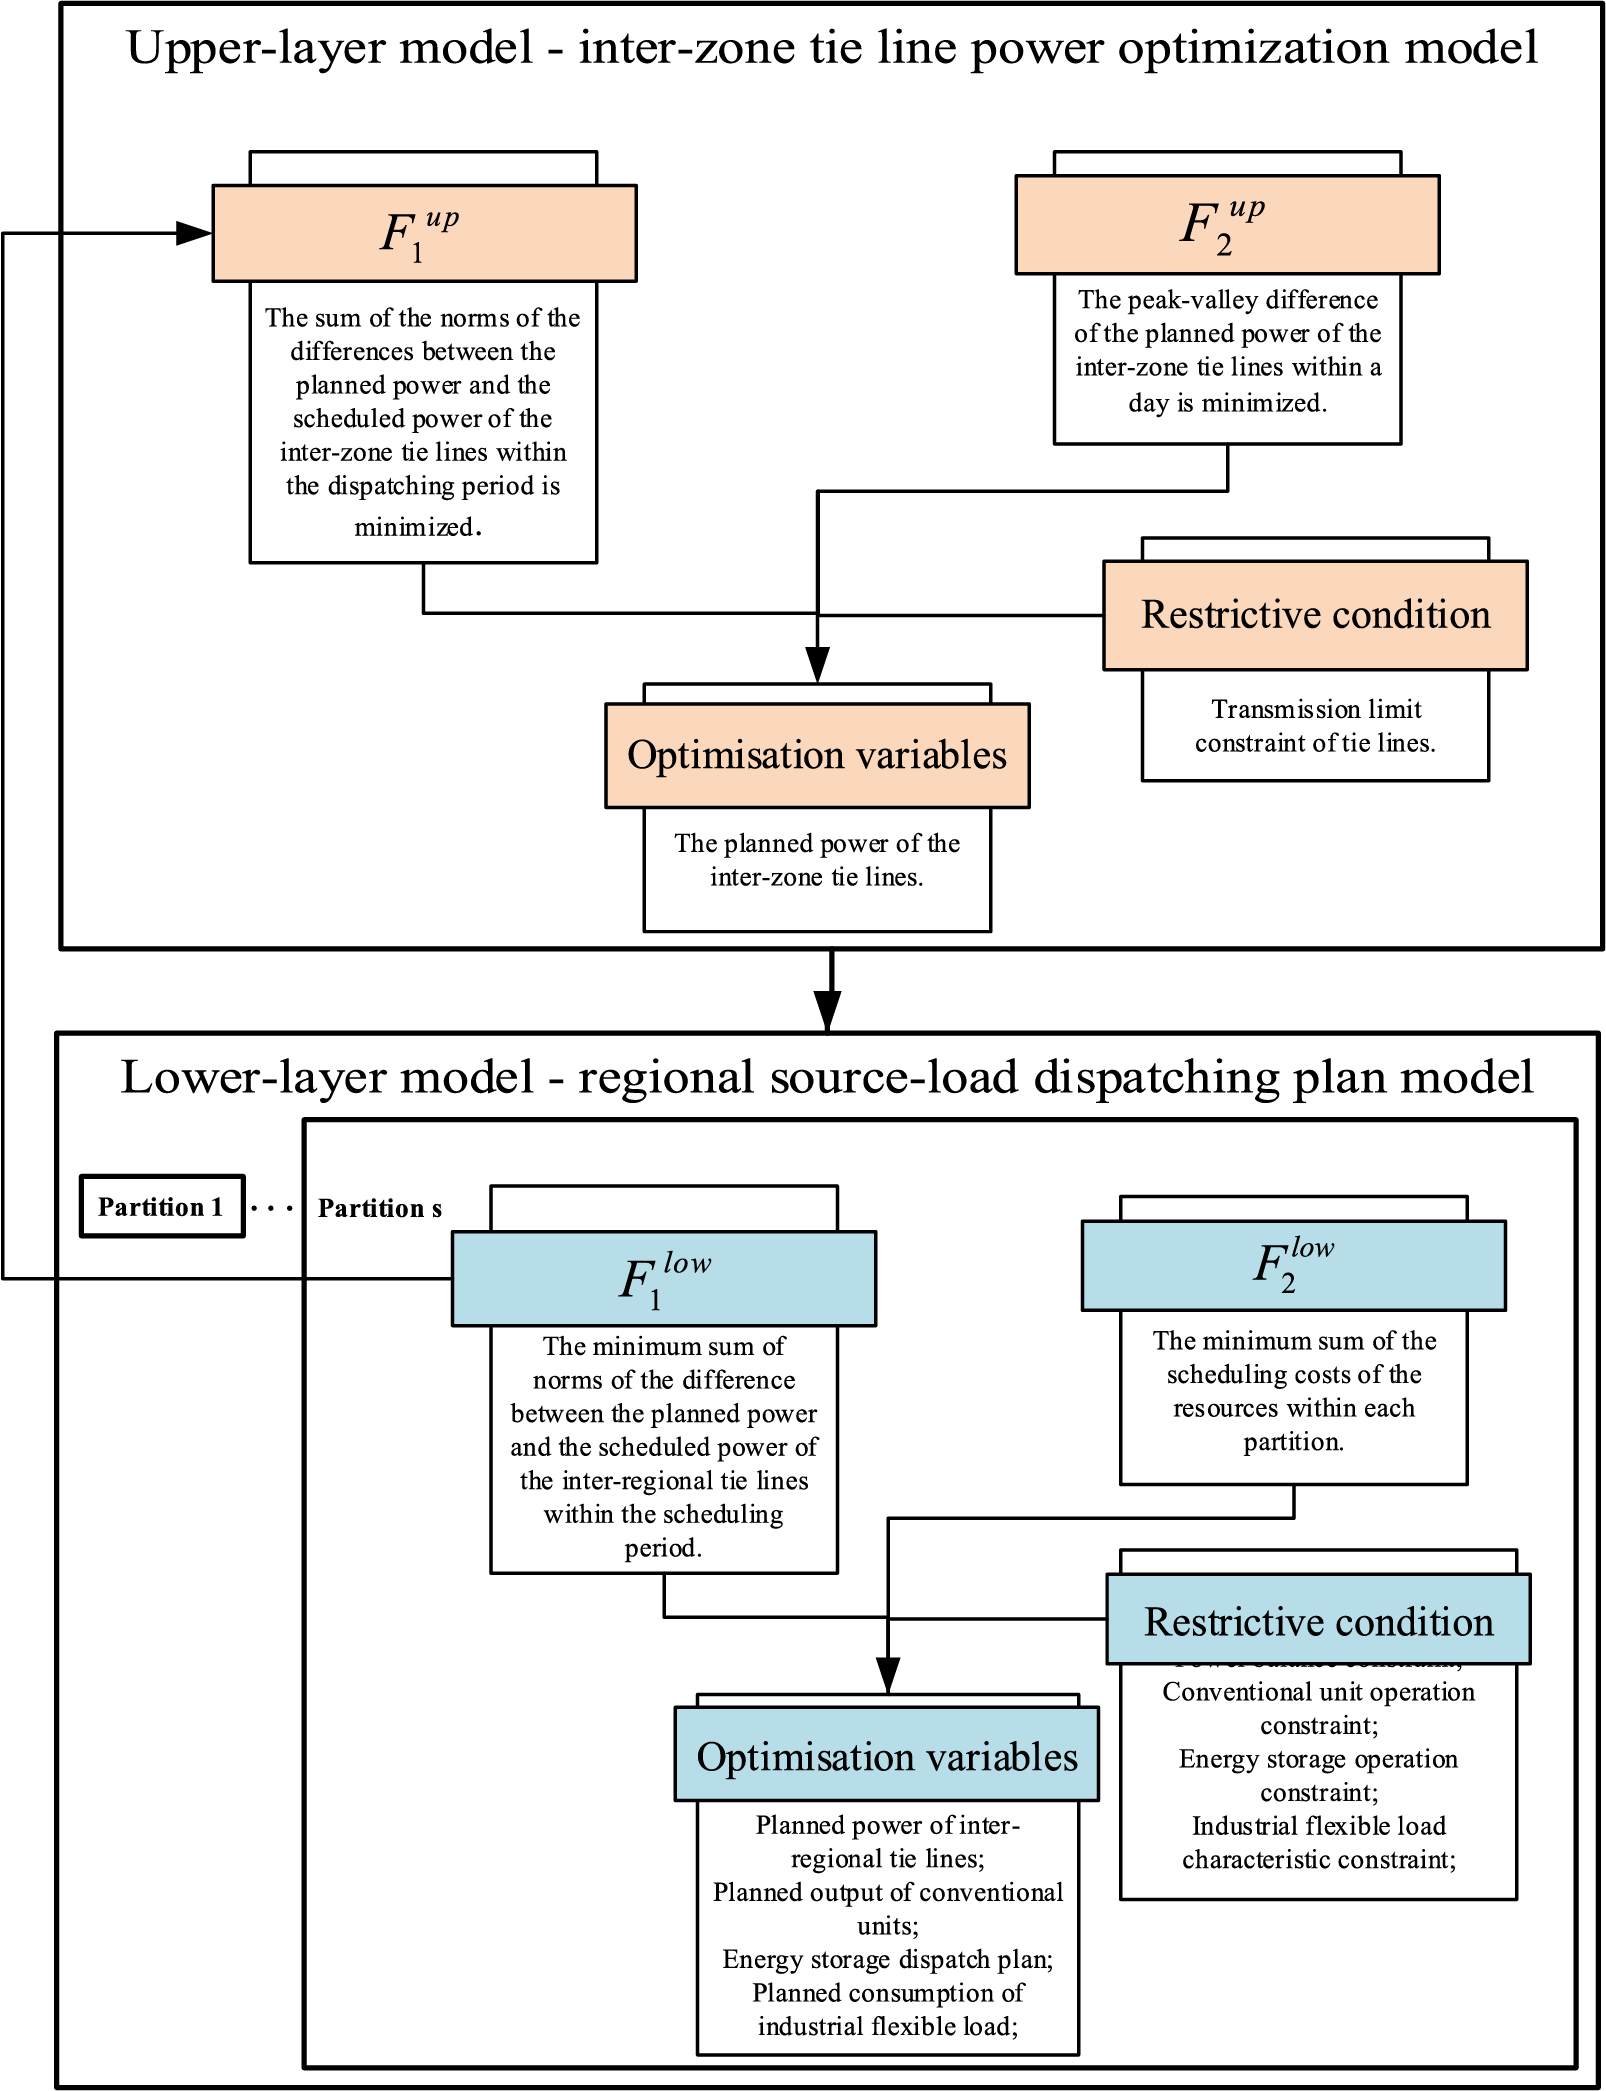
Figure 2: Bilayer optimization model structure diagram of tie lines
3.2 Power Constraint Condition of Industrial Flexible Loads
The electricity cost in the production of industrial flexible loads users accounts for a large proportion of the production cost. Reducing the electricity cost is beneficial for industrial flexible loads users to have an advantageous position in the industry competition. The daily load of industrial flexible loads users has a certain degree of adjustability. By changing the production process and processing technology, the load in a certain period can be transferred to a high power generation period of renewable energy, and a certain peak-shaving subsidy can be given, which can fully exert the peak-shaving enthusiasm of industrial flexible loads users [18,19]. According to the characteristics of industrial flexible loads users, this paper considers the regulation ability and operation constraints of industrial flexible loads. The power constraint condition of industrial flexible loads is shown in Eqs. (11) to (14).
The upper and lower limits of output are the range that industrial flexible loads can adjust. Exceeding this range may cause production interruption or safety hazards. Industrial flexible loads need to ensure the normal production of industry, and avoid affecting the process quality or causing equipment damage due to power regulations.
Therefore, the upper and lower limits of output satisfy:
In the formula:
The process and demand of industrial production determine the operation state and regulation range of industrial load, and different processes and demands have different requirements and limitations on the regulation rate of load [20]. Industrial flexible loads need to control their regulation rate to ensure the normal production of industry, and avoid affecting the process quality or causing equipment damage due to power regulation. Industrial flexible loads need to control their regulation rate, so that they can vary within the upper and lower limits of output, and meet the process requirements of industrial production.
Therefore, its regulation rate satisfies:
In the formula:
The number of starts is the number of start-ups and shut-downs of industrial flexible loads in a certain period of time, reflecting the frequency of use and load change of industrial equipment. Industrial flexible loads need to meet the requirements of the number of starts to ensure the life and reliability of industrial equipment, and avoid excessive wear or failure of equipment due to power regulation. If the number of starts is too high, it may accelerate the aging and damage of industrial equipment; if the number of starts is too low, it may cause the idling and waste of industrial equipment.
The number of start-ups and shut-downs satisfies:
In the formula:
The total amount of operation is the total output of the industrial flexible loads in a certain period of time, reflecting the scale and efficiency of industrial production. Industrial flexible loads need to meet a certain total amount of operation to ensure the planning and economy of industrial production and avoid increasing production costs or reducing output due to power regulation. If the total amount of operation is too low, it may affect the progress and quality of industrial production; if the total amount of operation is too high, it may increase the energy consumption and cost of industrial production.
The total amount of operation satisfies:
In the formula:
The planned power of the tie lines in the upper-layer optimization results should be as close as possible to the planned power of the tie lines in the source-load scheduling plan of each region in the lower-layer. The minimum Euclidean norm of the difference between the planned power of the tie lines and the scheduled power of the tie lines is used as the first objective function of the upper-layer optimization model.
In addition, the upper-layer optimization considers the possibility of line over-limit and other problems caused by the fluctuation, randomness, and intermittency of renewable energy, and tries to achieve the consumption of renewable energy as much as possible. The minimum Euclidean norm of the peak-valley difference of the planned power of the tie lines within the day is used as the second objective function of the upper-layer optimization model.
The objective function of the upper-layer optimization model is:
In the formula:
The restrictive condition is that the planned power of the tie line is within the stable transmission power range of the line, that is:
In the formula:
The smaller the peak-valley difference of the planned power of tie line in the dispatching cycle, the higher the matching degree of power grid load and renewable energy output, the better the renewable energy can be consumed and utilized, the more stable the power grid load changes, the smaller the operation pressure of power system, the lower the peak-shaving capacity demand, the lower the investment and operation and maintenance cost of conventional power generation units, which is conducive to improving the operation efficiency and economy of power system, and improving the development level and utilization rate of renewable energy [21].
The scheduled power of the tie lines in the source-load scheduling plan of each region in the lower-layer optimization model should be as close as possible to the planned power of the tie lines in the upper-layer optimization structure. The minimum Euclidean norm of the difference between the scheduled power of the tie lines and the planned power of the tie lines is used as the first objective function of the lower-layer optimization model.
The lower-layer optimization model aims to satisfy the power grid’s consumption of renewable energy as much as possible, and achieve the requirements of power grid security and stability, while reducing the cost of power grid resource scheduling within the partition, and improving the resource utilization and social benefits of the power grid. The sum of the resource scheduling costs within each partition is used as the second objective function of the lower-layer optimization model.
In the formula:
The calculation formulas for each cost are:
In the formula:
In the power system, regional power grid optimization scheduling is an important task, which involves how to reasonably allocate power resources, and arrange the output plan of each resource while satisfying various constraints, to achieve the goals of maximizing economic benefits, minimizing environmental impacts, and improving power grid security. However, in practical problems, these goals are often conflicting and need to balance and compromise among multiple objectives. Therefore, it needs to find a set of non-inferior solutions, that is, the
In this paper,
In the formula:
The operation constraints of conventional power units, wind-solar hybrid units, and flexible energy storage in the region are given in references [23–25].
4 Optimization Model Solving and Case Analysis
The topology of a regional power grid system with multiple types of resources such as wind farms, photovoltaic power stations, flexible energy storage, etc., is shown in Fig. 3. The topology of the power grid system after invoking industrial flexible loads resources to participate in grid regulation is shown in Fig. 4. This paper takes IEEE33-node distribution network as the simulation test system, which is a typical radial network model, consisting of 33-nodes and 32 loads, including 10 transformers and 3 cables. Each load data is generated based on the actual power system statistics, and the rated voltage value of each node is 12.47 KV. In order to be more in line with the background of the increasing proportion of renewable energy generation resources in the new power grid, considering the impact of different types of resources, as shown in Table 1, this paper adds the following resources to the system:

Figure 3: Topology of IEEE33-node distribution network before adding industrial flexible loads
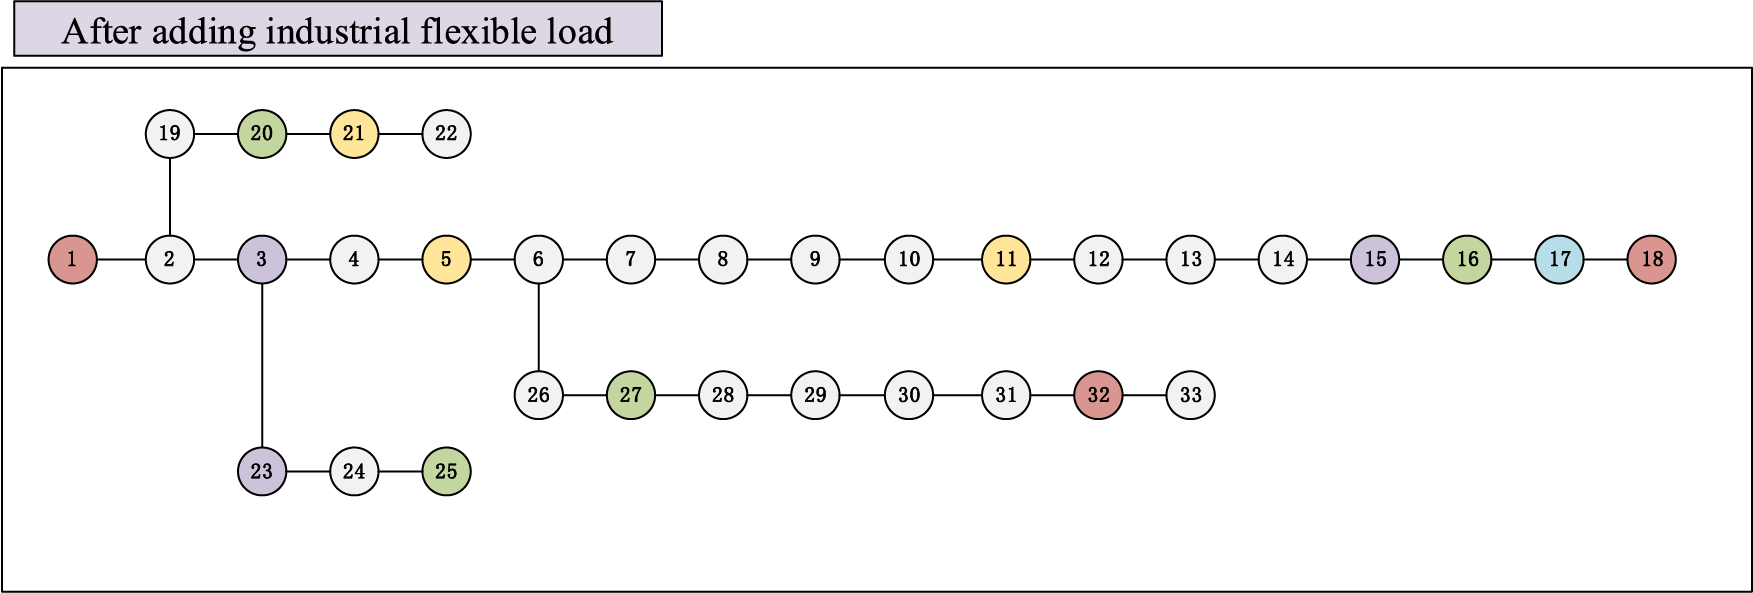
Figure 4: Topology of IEEE33-node distribution network after adding industrial flexible loads
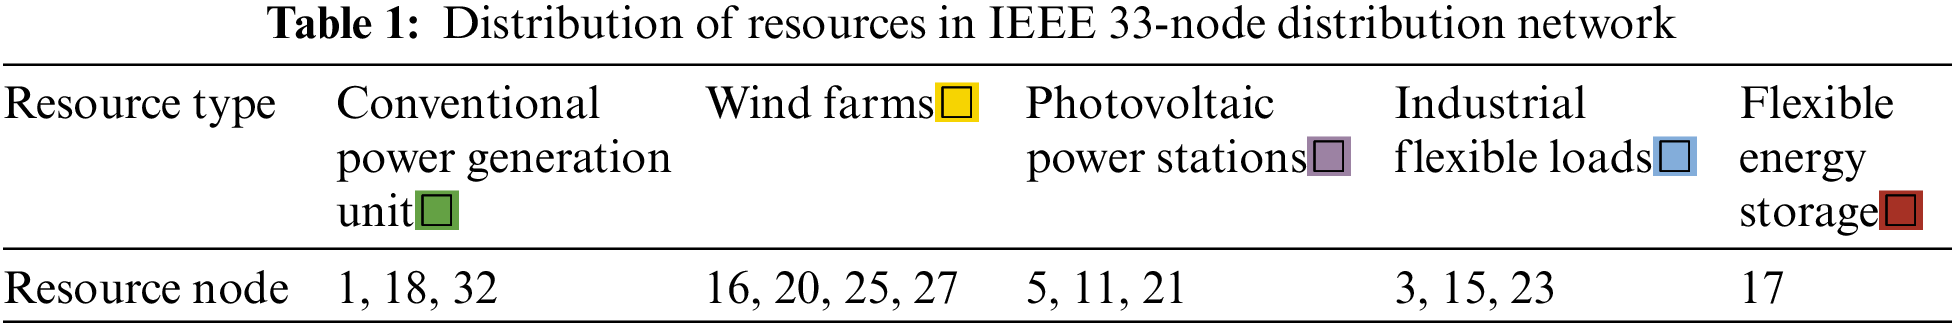
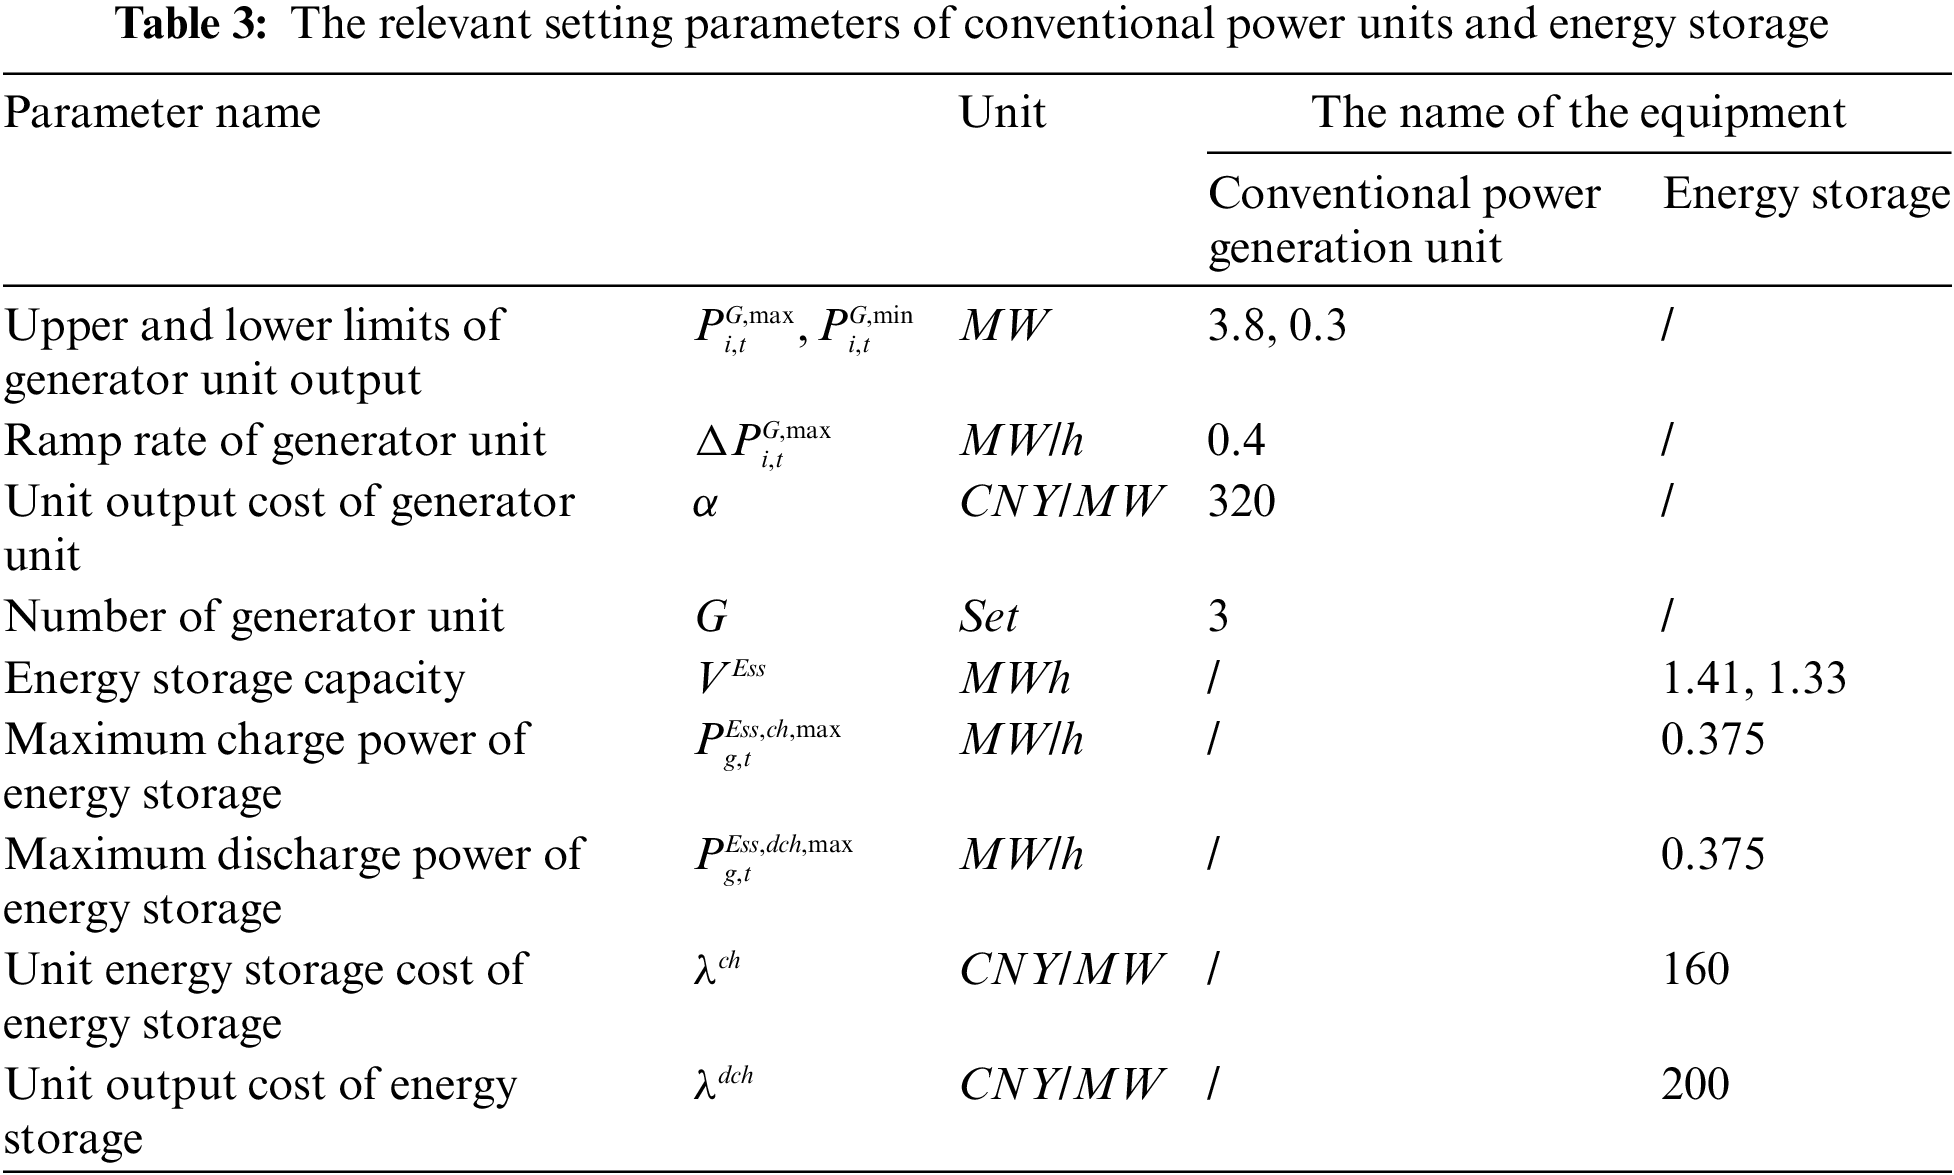
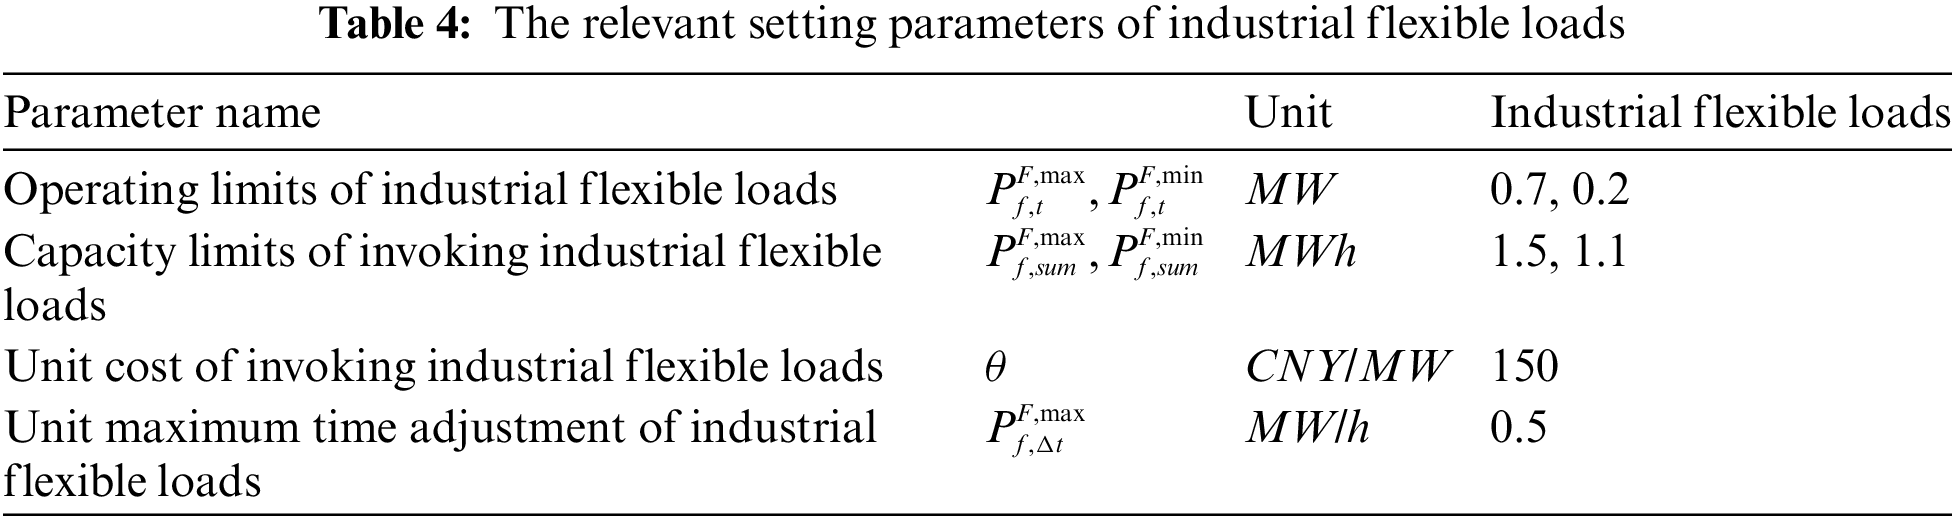
3 equivalent power sources of conventional power generation units, located at nodes 1, 18, and 32, respectively, whose output can be adjusted according to the demand of the power grid, and their active and reactive power output ranges are [0.3, 4] MW and [−3, 3] MVar, respectively. 7 equivalent power sources of renewable energy, including 4 wind power units, located at nodes 16, 20, 25, and 27, respectively, whose active power output is determined by the random variation of wind speed, reactive power output is zero, and their output can be regarded as random disturbance, and another 3 photovoltaic power units, located at nodes 5, 11 and 21, respectively, whose active power output is determined by the random variation of solar radiation, reactive power output is zero, and their output can be regarded as a random disturbance. 3 industrial flexible loads, located at nodes 3, 15, and 23, respectively, whose active power demand can be invoked at any time within a day, and the total amount of each industrial flexible loads node can be invoked in the range of 1.1–1.5 MW, and their demand can be regarded as a controllable active load. 2 flexible energy storage units, located at node 17, whose maximum capacities are 1.33 and 1.41 megawatt-hours, respectively, whose active and reactive power output can be adjusted according to the state or optimization objective of the power grid, and their output can be regarded as controllable resources.
IEEE33-node distribution network is a common power system example, used to test and verify some analysis and optimization methods of distribution network. It consists of 33 nodes and 37 branches. The topology of IEEE33-node without invoking industrial flexible loads is shown in Fig. 3.
The topology of IEEE33-node after adding industrial flexible loads is shown in Fig. 4.
In this paper, the resource nodes of the IEEE33-node distribution network are set in Table 1.
4.1 Results of the Grid Partitioning
The partitioning algorithm in this paper is applied to the IEEE33-node distribution network, and the renewable energy consumption indicators given by Eqs. (1) to (4) are used. After the power flow calculation in
The relationship between modularity
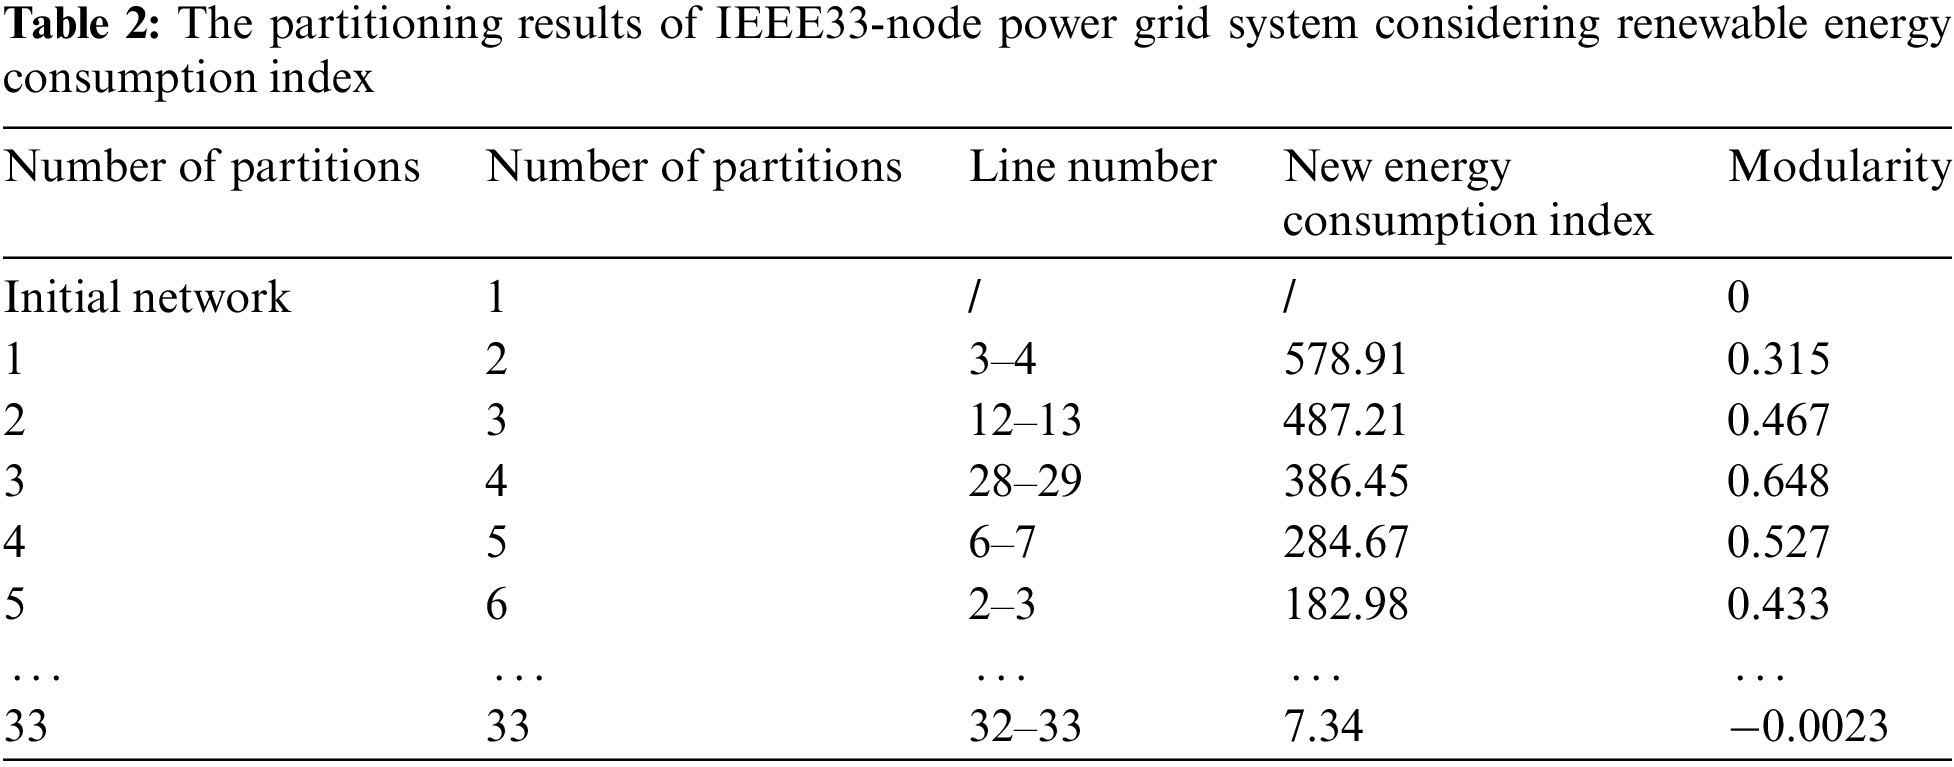
As shown in Fig. 5, this section adopts the power grid partitioning algorithm considering renewable energy indicators, and divides the 33-node distribution network into four regional power grids, among which region 1 is the power generation side resource concentration distribution region, and regions 2, 3, 4, and 5 also contain conventional power sources and daily loads. The top ten tie lines ranked by renewable energy consumption indicators are shown in Table 2. It is worth noting that lines 3–4 is one of the most important and the largest renewable energy consumption indicators among them, because it is the only channel for the power generation side resource concentration distribution region 1 to send power to other regions, but it low power transmission efficiency, which wastes renewable energy and brings greater peak-shaving pressure to other regions; tie lines 12–13 and 28–29 are set as virtual disconnection tie lines because there are more non-daily load resources in the region, which will have a lot of power exchange, large peak-valley difference, and easy to cause local power over-limit in cross-regional dispatching, which will affect the stable and safe operation of the power grid, so it is advisable to carry out comprehensive energy optimization configuration within the regional power grid, to achieve the best economic benefits under the guarantee of stable and safe operation of the power grid.
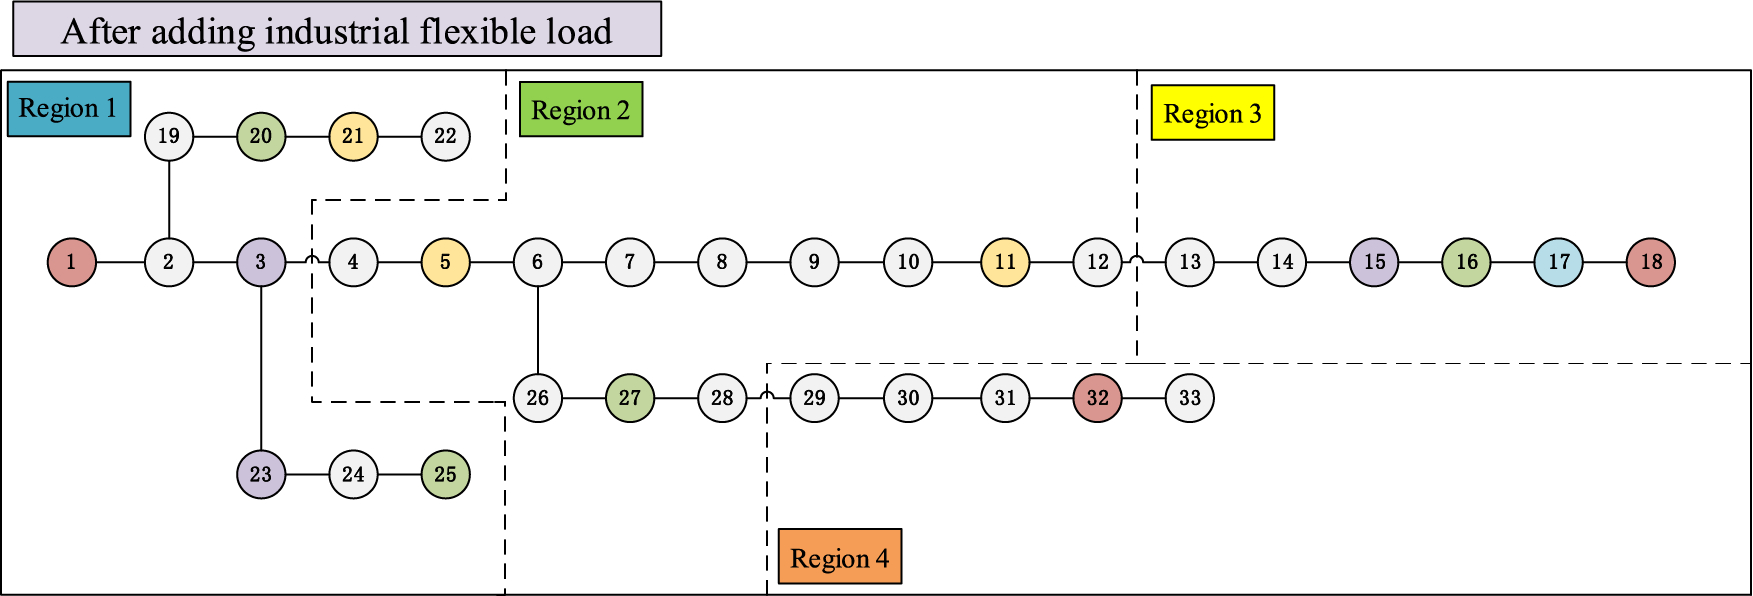
Figure 5: IEEE33-node distribution network partitioning results
4.2 Basic Parameterization for Model Solving
This section does not focus on the problem of renewable energy output prediction, but uses historical data and mathematical models to simulate the photovoltaic output and daily load curves, and perform economic dispatch of the regional power grid. The regional power grid topology structure described in the previous section is adopted, and a practical regional power grid system in the central region of China is referred to. A typical summer day is taken as a complete scheduling period, with 1 h as a time period, and a total of 24 time periods within a scheduling period. It includes the photovoltaic, wind power, and conventional load output prediction curves as shown in Fig. 6, which shows that the average expected power of the region is 209.1 MW.
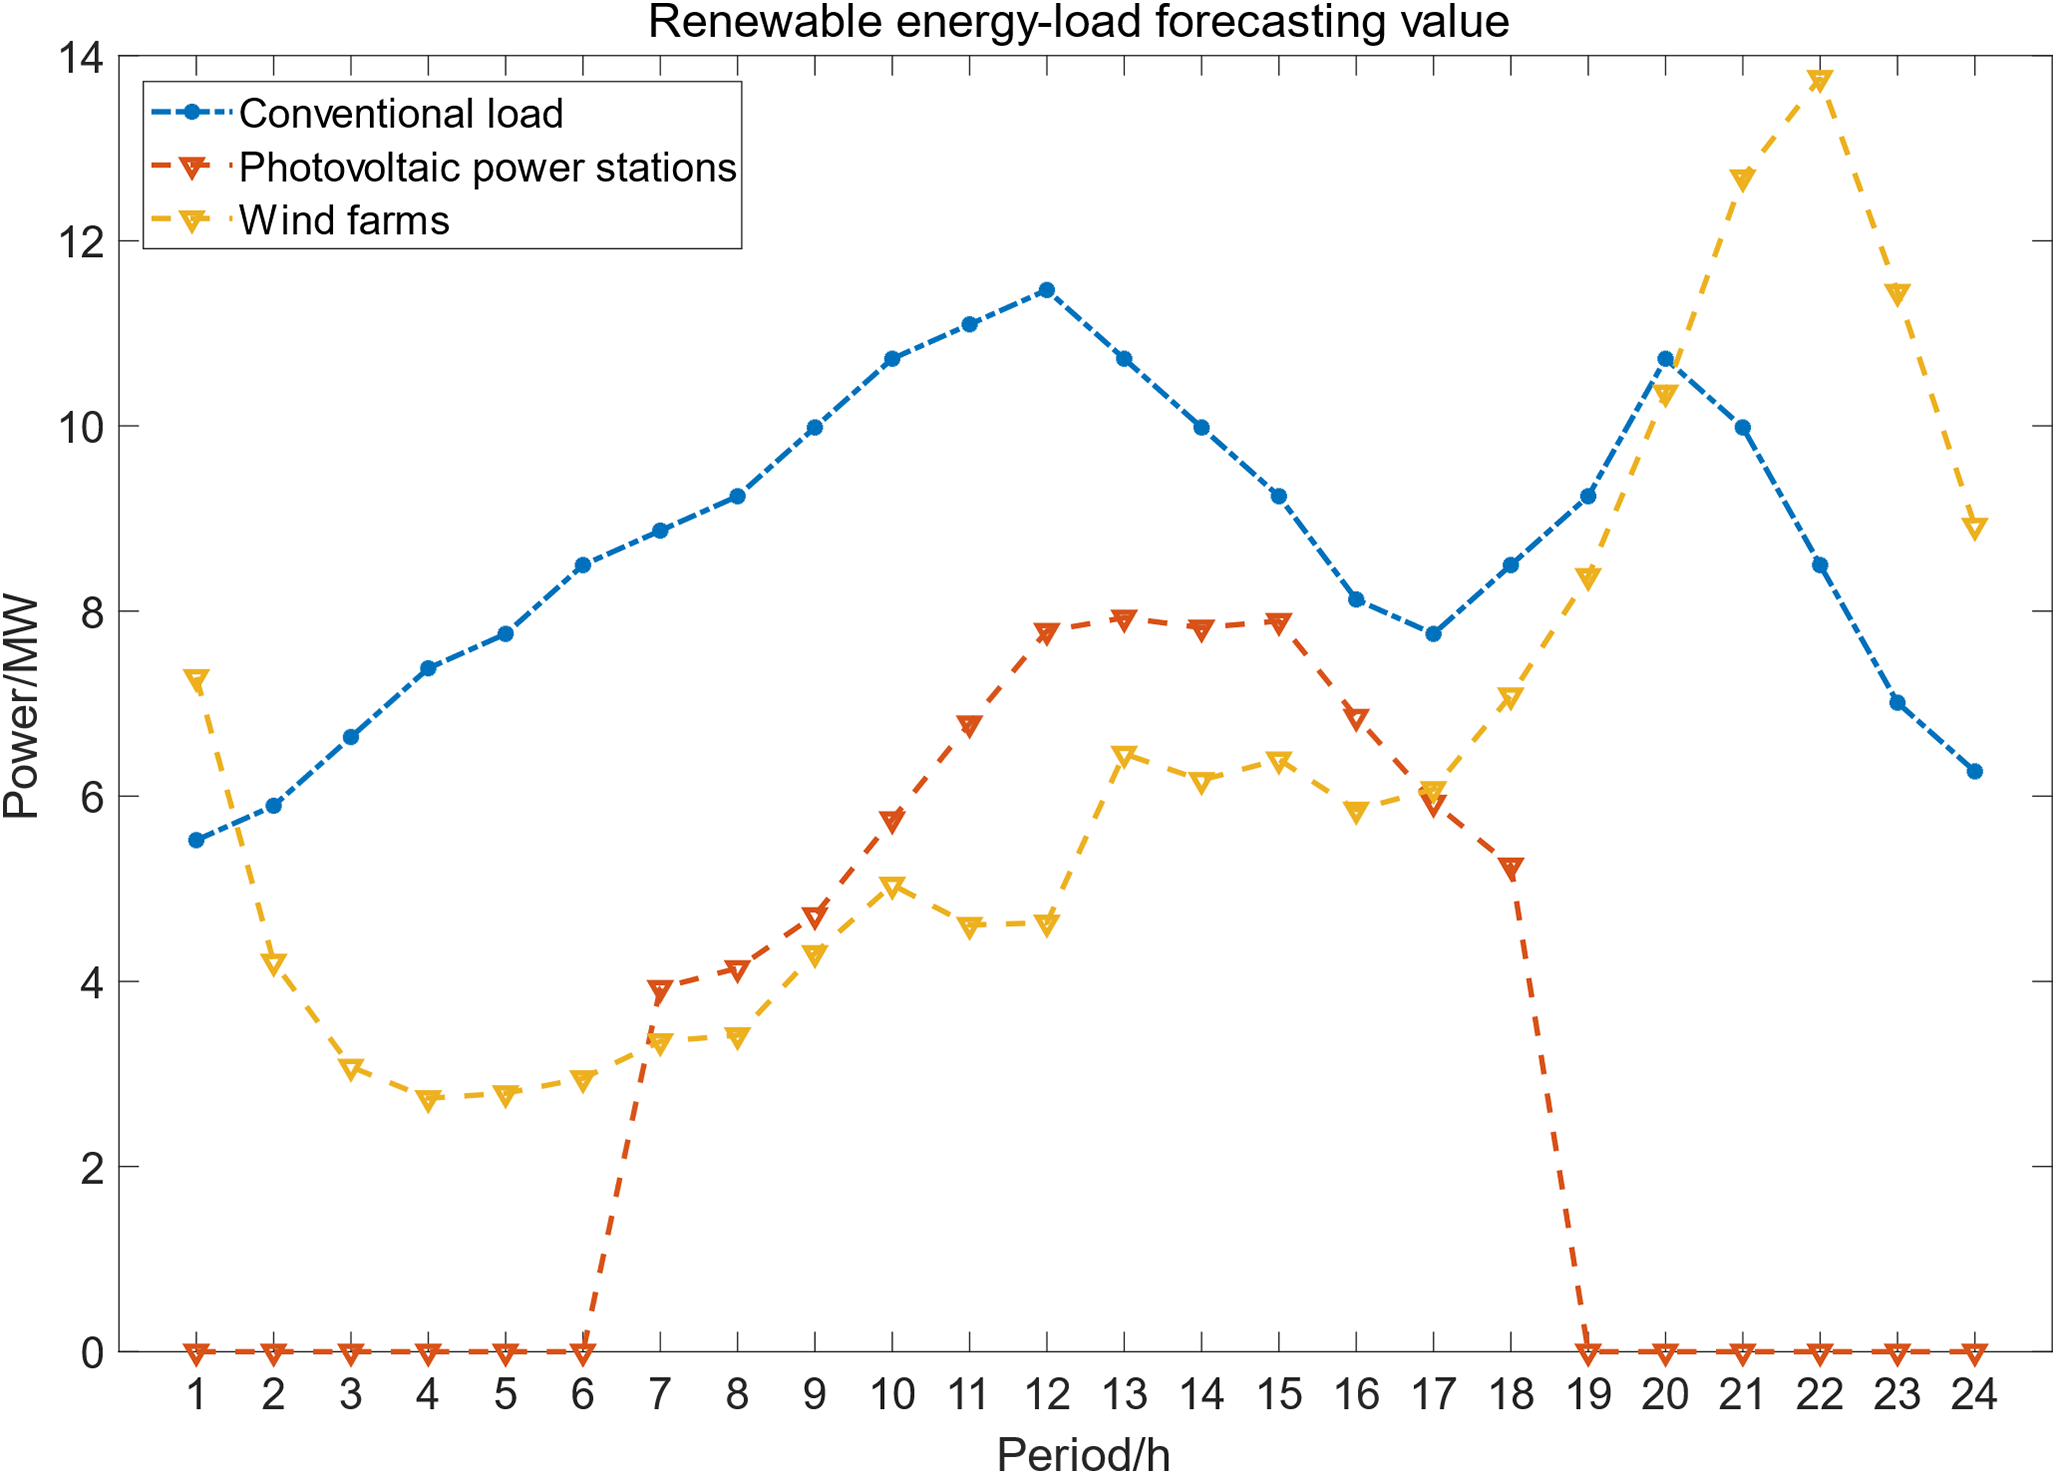
Figure 6: Renewable energy-load forecasting value
This paper adopts the day-ahead economic dispatch for the regional power grid, with a time interval of 1 h. As shown in Fig. 7, the time-sharing extra consumption cost refers to the price that the power system needs to compensate for the renewable energy generation that exceeds the system regulation capacity under the time-of-use pricing mechanism. The time-sharing extra consumption cost is conducive to encouraging renewable energy generation enterprises to optimize their operation modes, improve the absorption level of renewable energy, and promote the energy transition and carbon neutrality goals. Therefore, this section also considers the time-sharing extra consumption cost to stimulate the users’ participation in demand response.
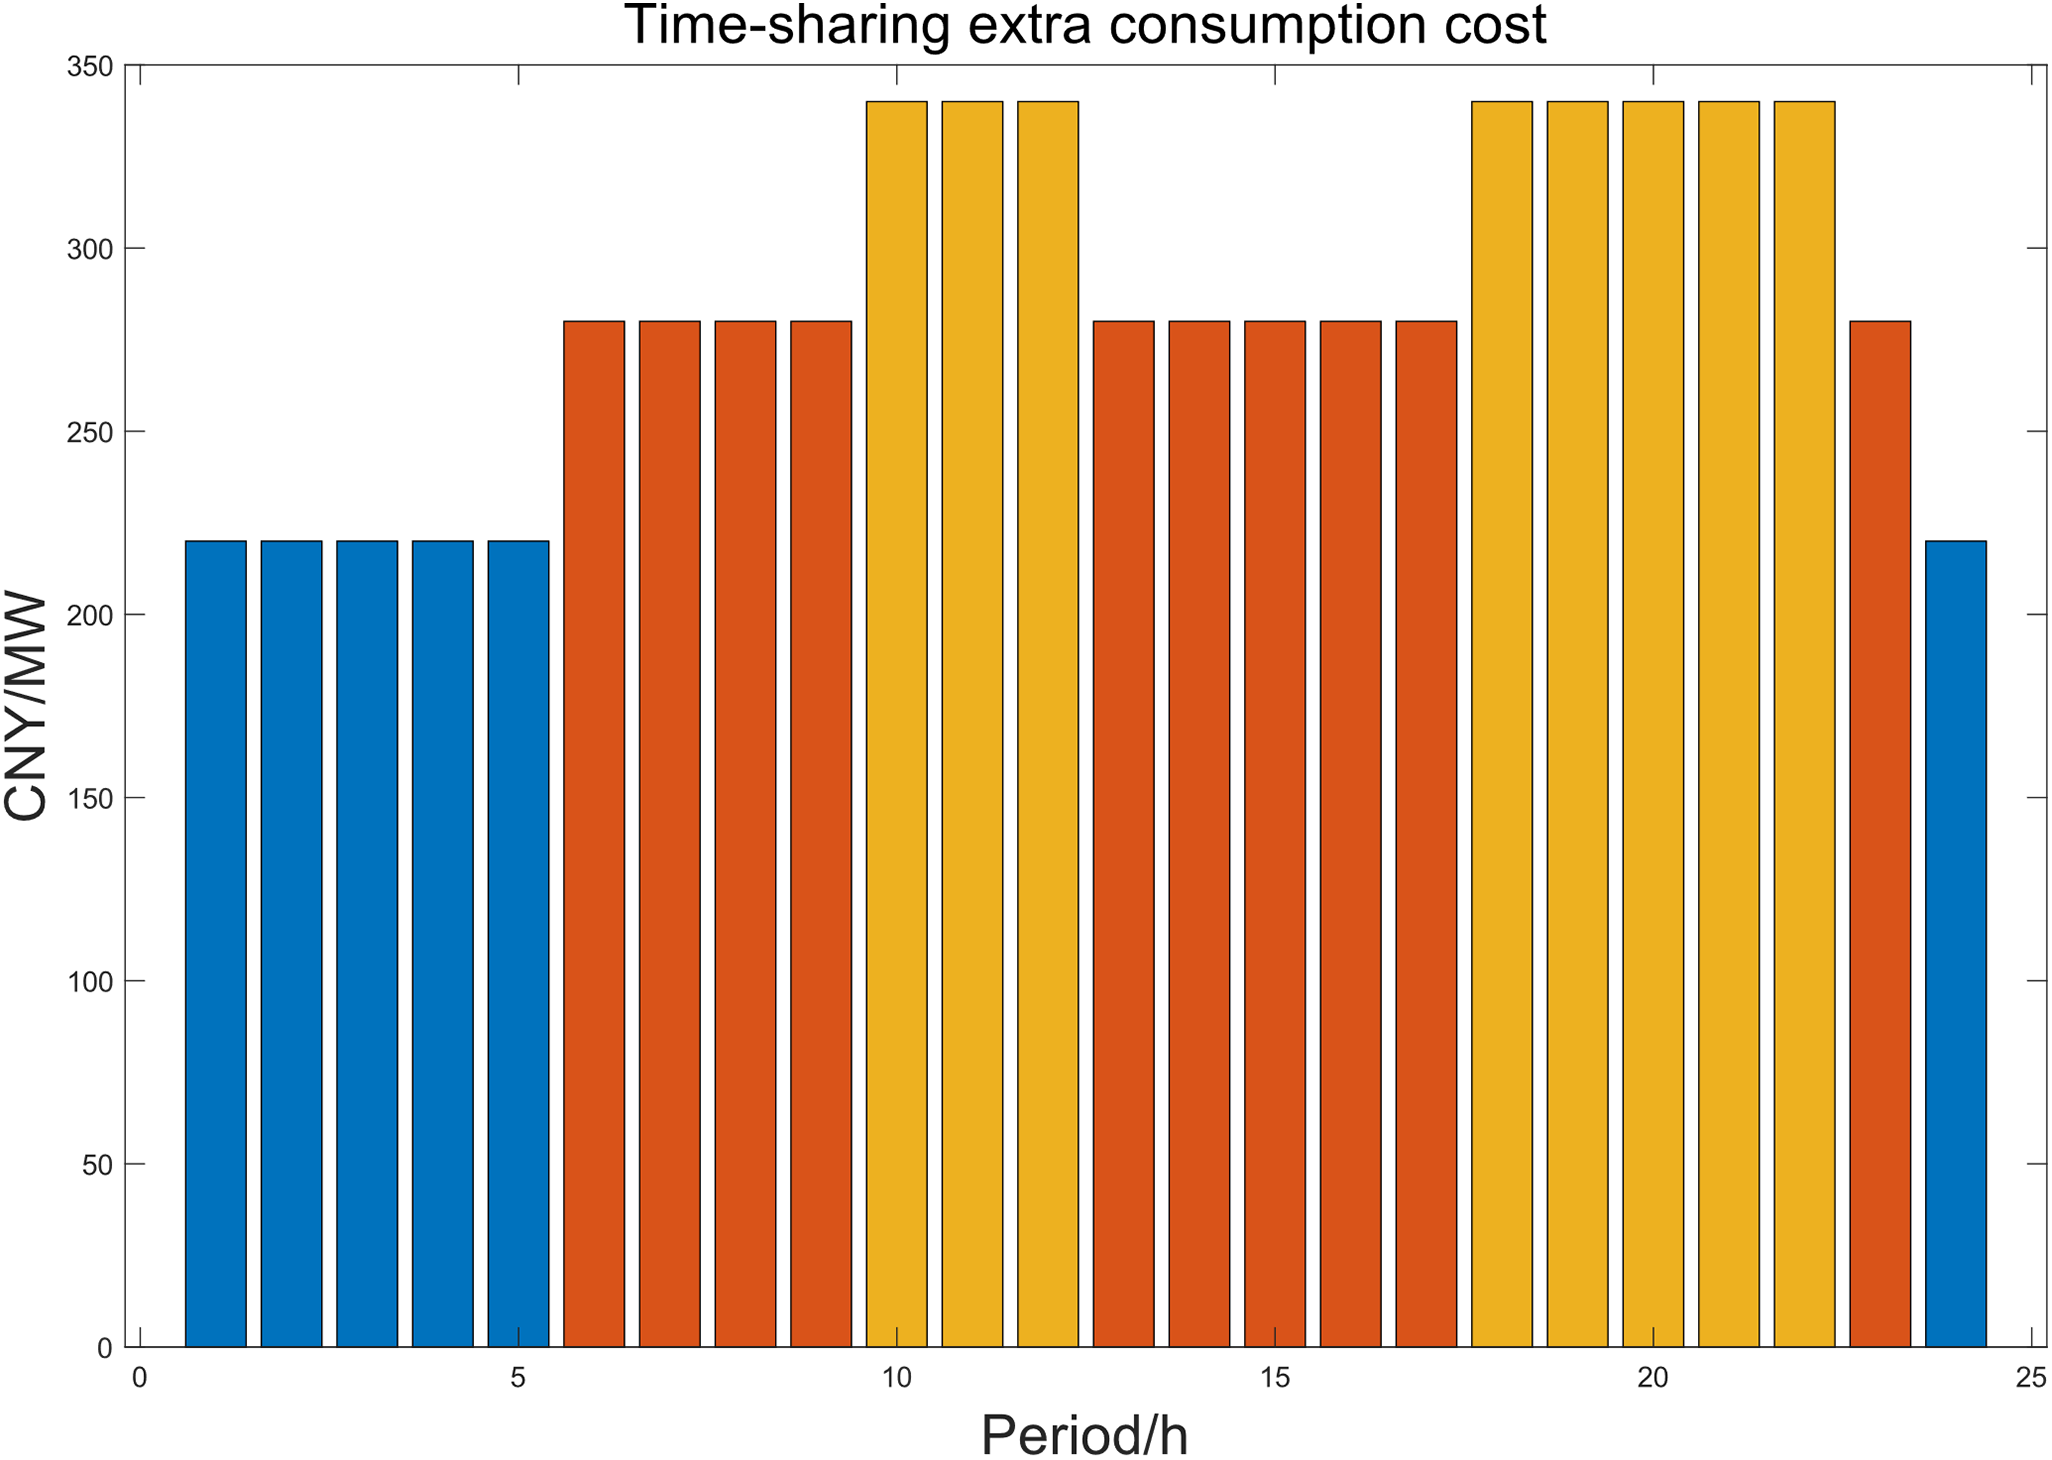
Figure 7: Time-sharing extra consumption cost
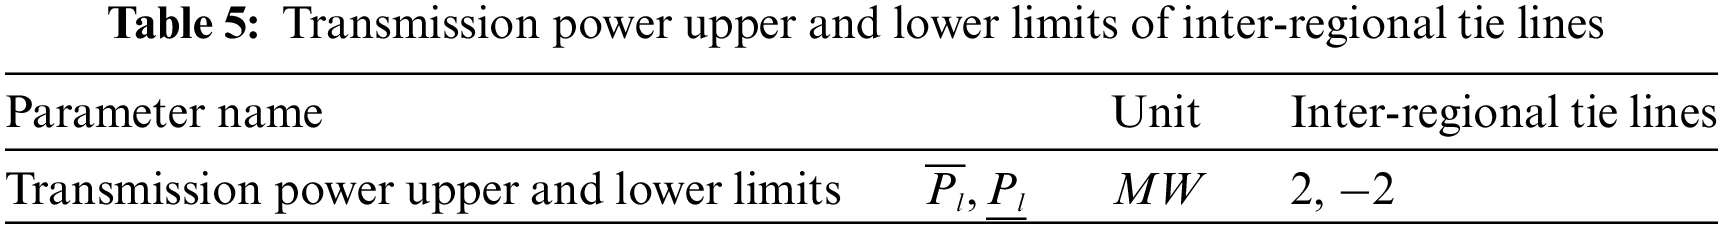
In addition, the relevant setting parameters of conventional power units and flexible energy storage groups are shown in Table 3, the relevant parameters of industrial flexible loads are shown in Table 4, and the upper and lower limits of transmission power of inter-regional tie lines are shown in Table 5.
In order to analyze and compare the effectiveness of different types of demand response resources participating in coordinated dispatching strategies, the following two scenarios are designed:
Scenario 1: Industrial flexible loads do not participate in optimal dispatching, and the regional power grid relies only on conventional generator sets and flexible energy storage for dispatching.
Scenario 2: Under the guidance, flexible energy storage and industrial flexible loads participate in the optimal dispatching of the regional power grid in an orderly manner to achieve renewable energy consumption.
4.3 Simulation Results Analysis
This paper aims to analyze the impact of industrial flexible load participation in response to the stable, economic, and secure operation of the regional power grid, and constructs two different simulation scenarios, considering the cases of industrial flexible load participation and non-participation in regional power grid optimal dispatching. In the simulation process, the objective of the lower-layer regional power grid optimal dispatching is to minimize the operation cost of the power grid, while satisfying the load demand and power grid security constraints. The simulation results before the addition of industrial flexible loads are shown in Fig. 8 and the line over-limit situation at that time is shown in Fig. 9, the simulation results after the addition of industrial flexible loads are shown in Fig. 10, the comparison of the power grid operating costs before and after the addition of industrial flexible loads is shown in Fig. 11, and the simulation results of the addition of industrial flexible loads using traditional methods are shown in Fig. 12.
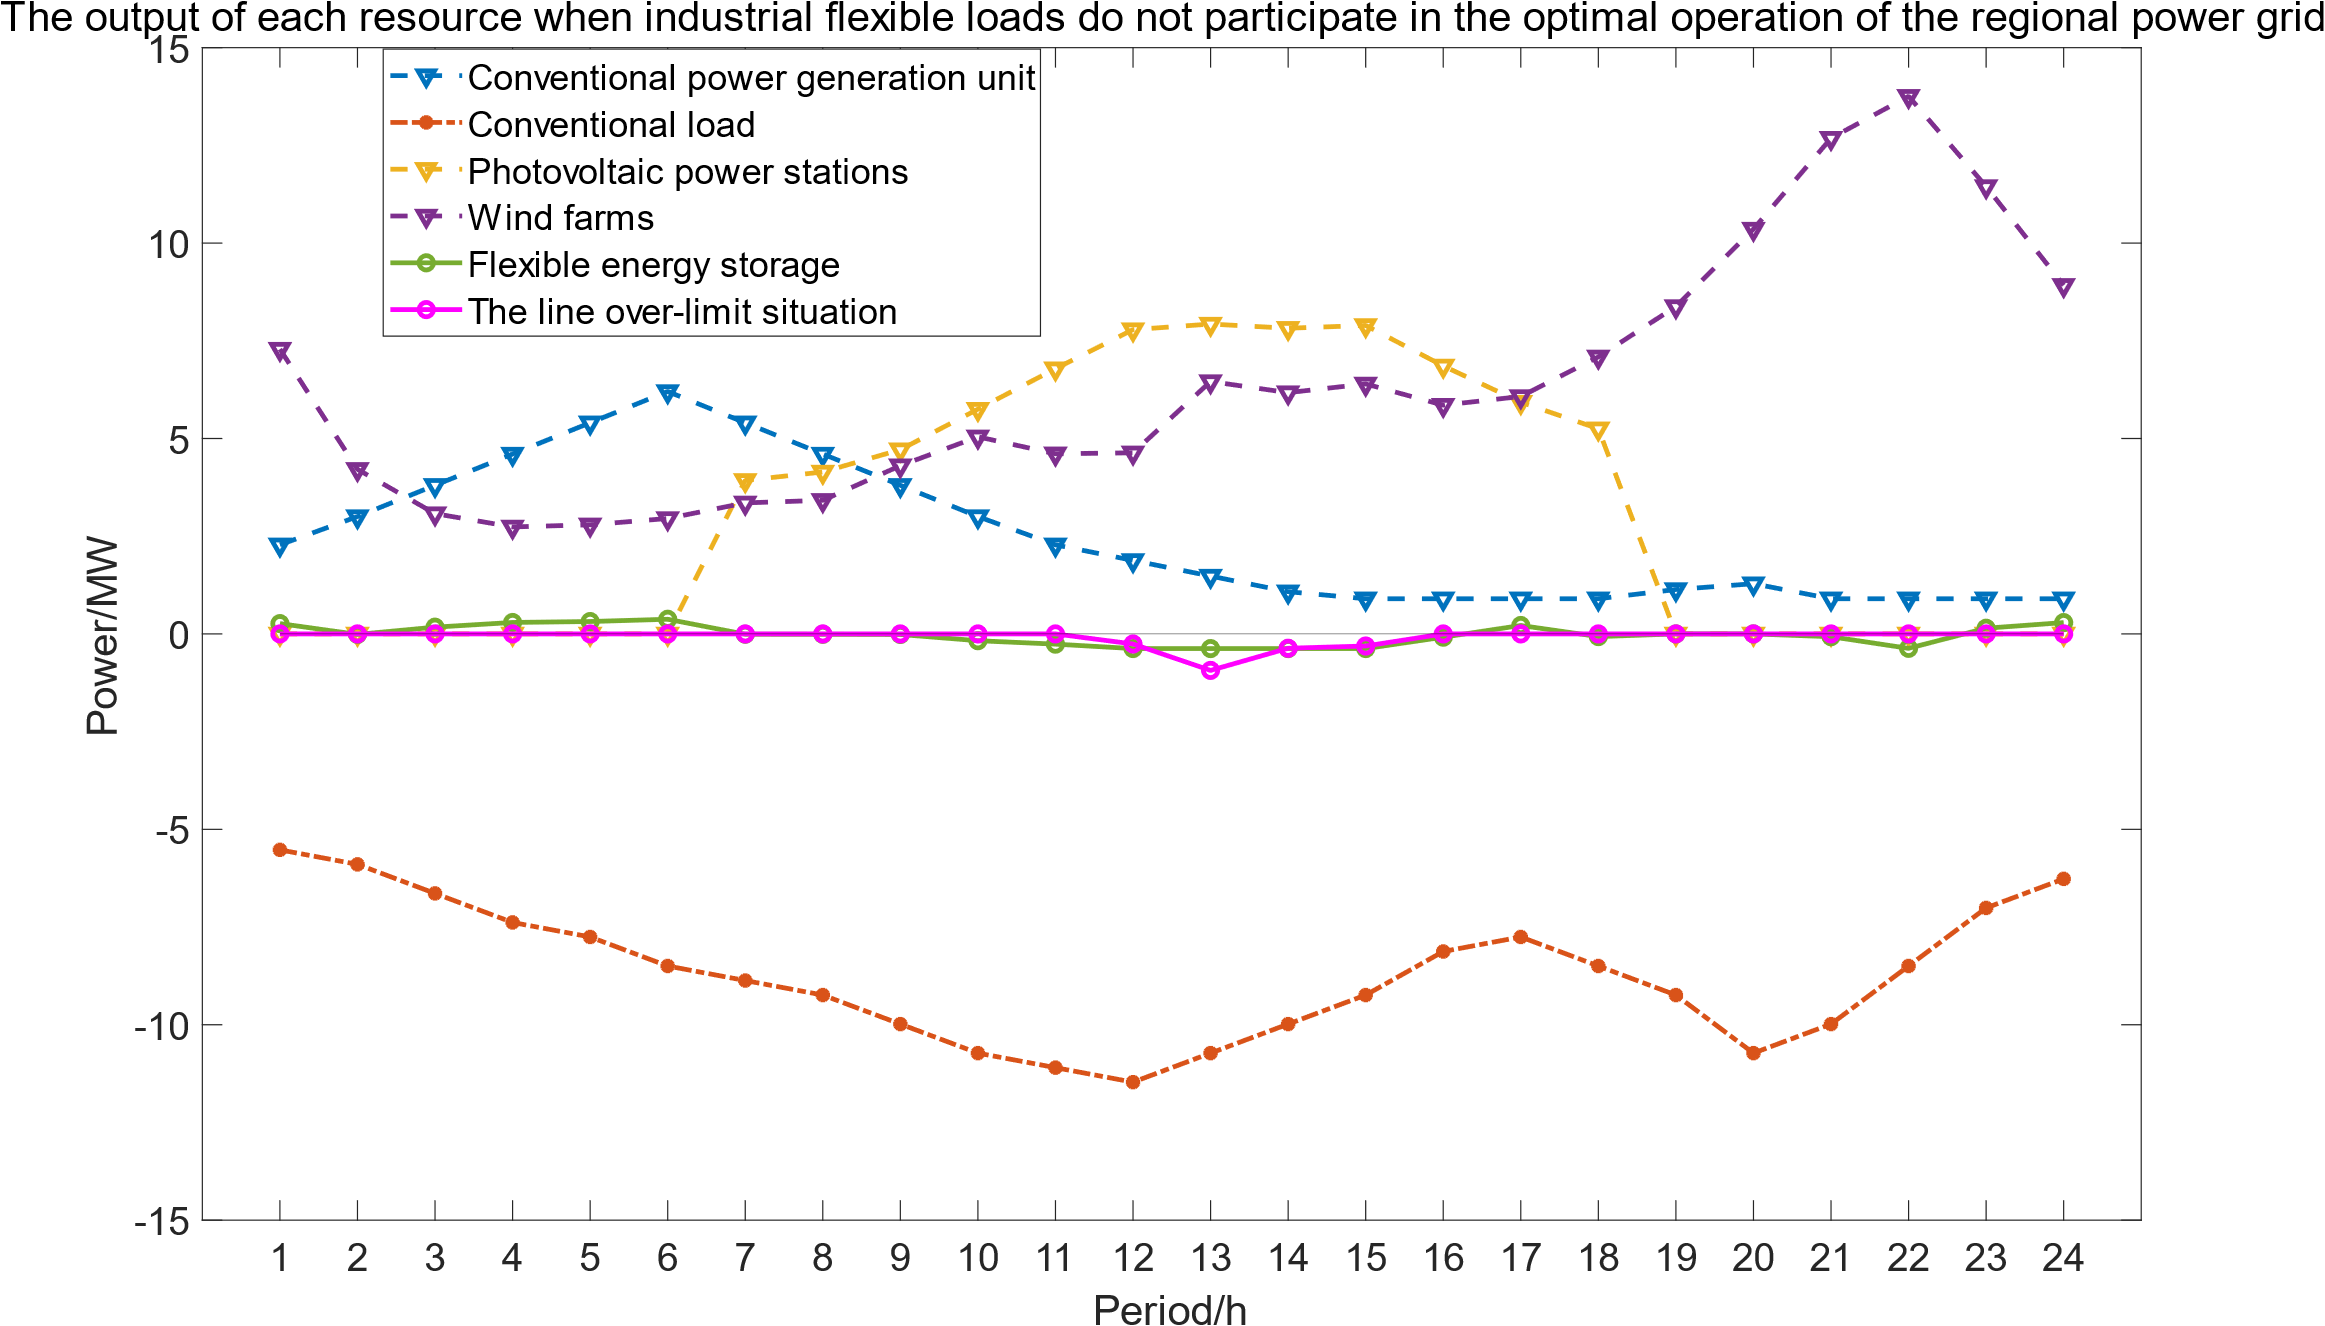
Figure 8: The output of each resource when industrial flexible loads do not participate in the optimal operation of the regional power grid
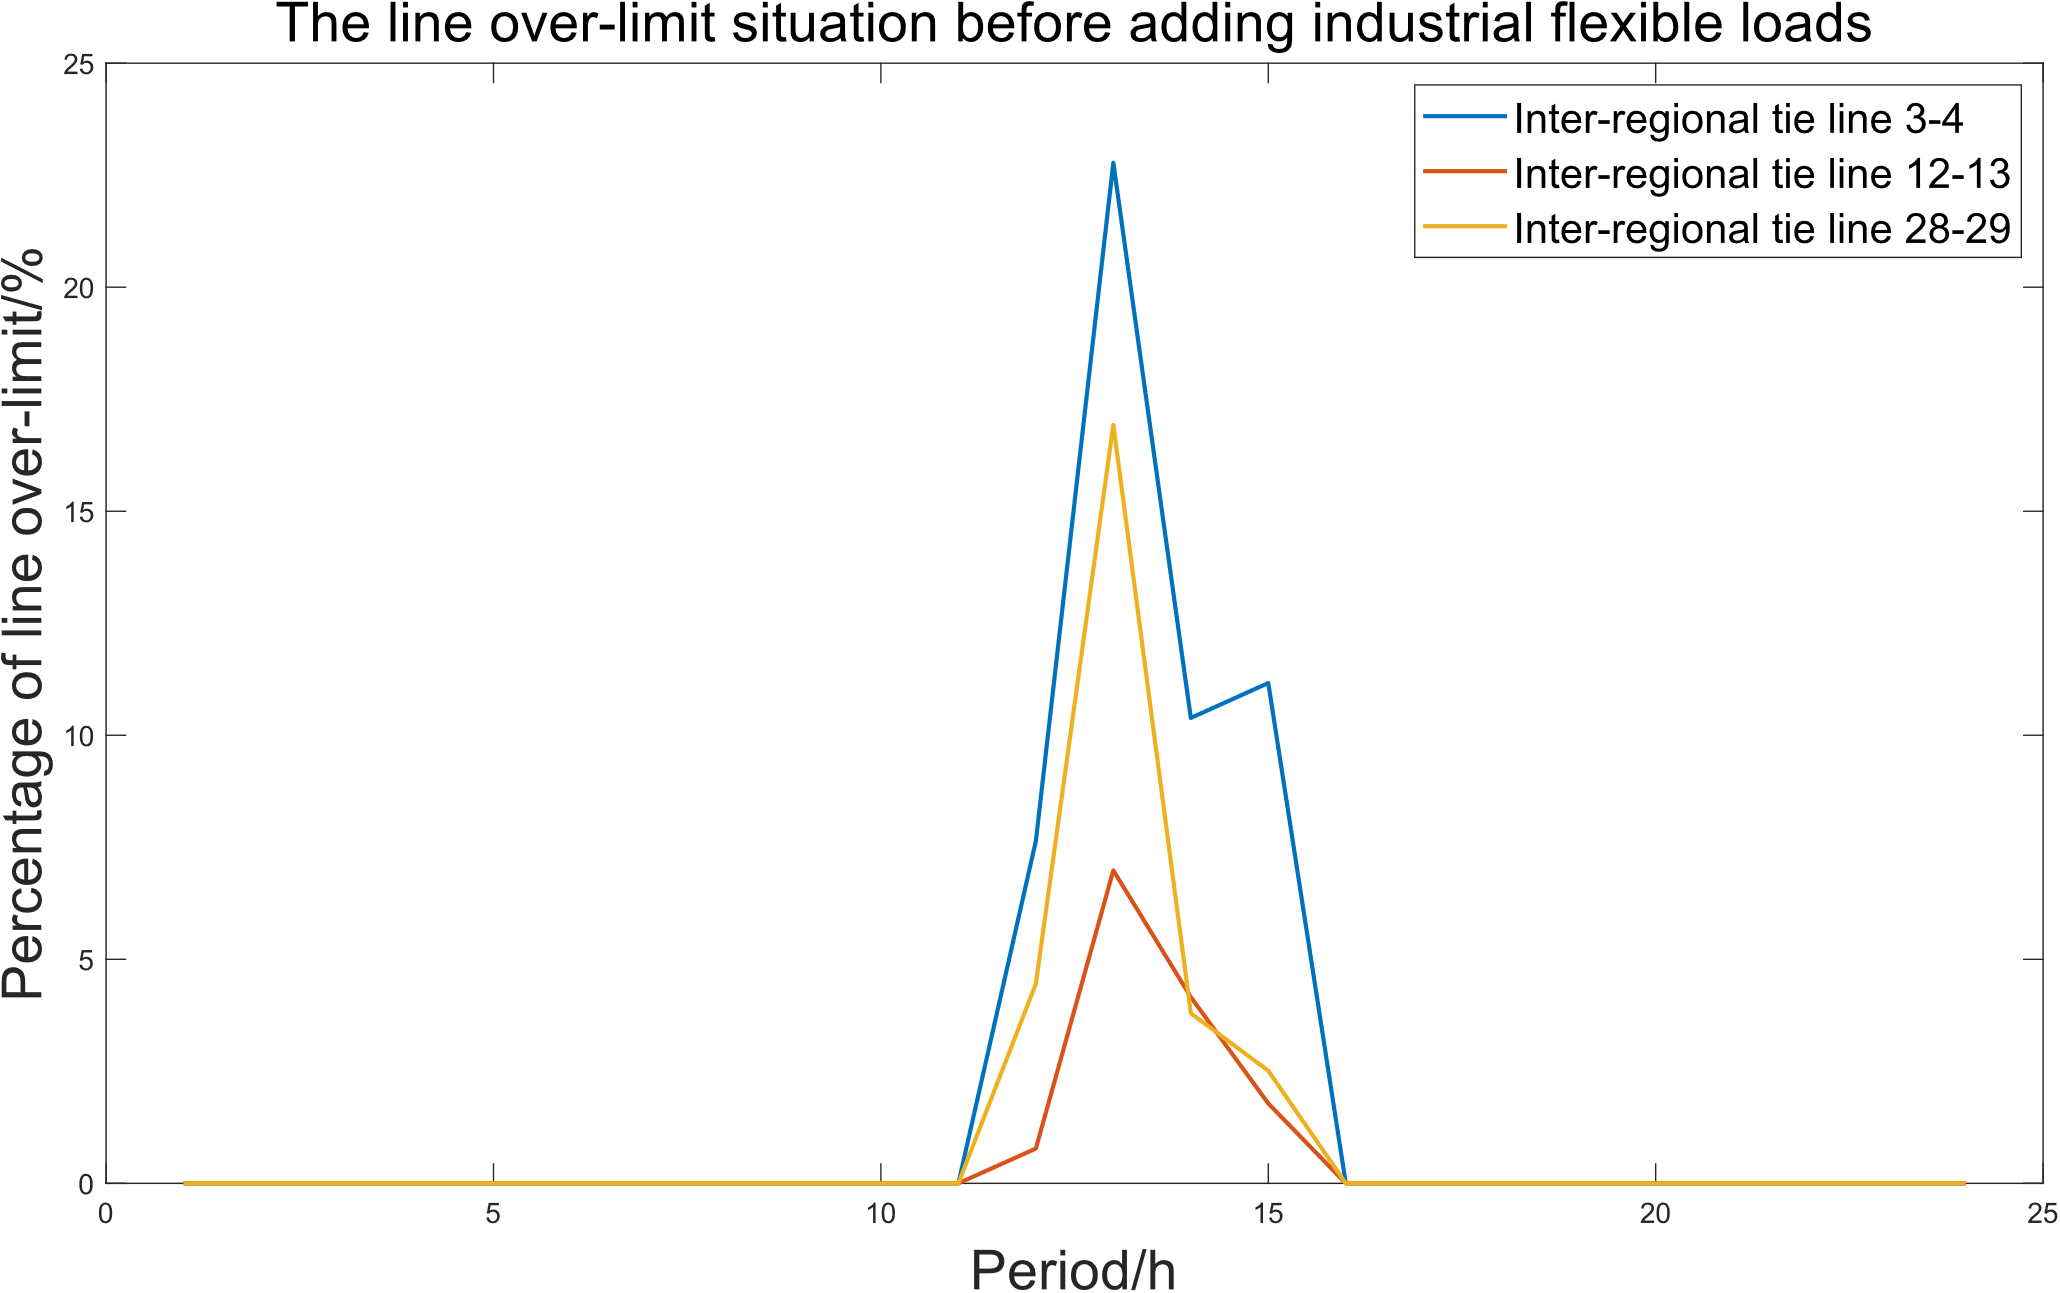
Figure 9: The line over-limit situation before adding industrial flexible loads
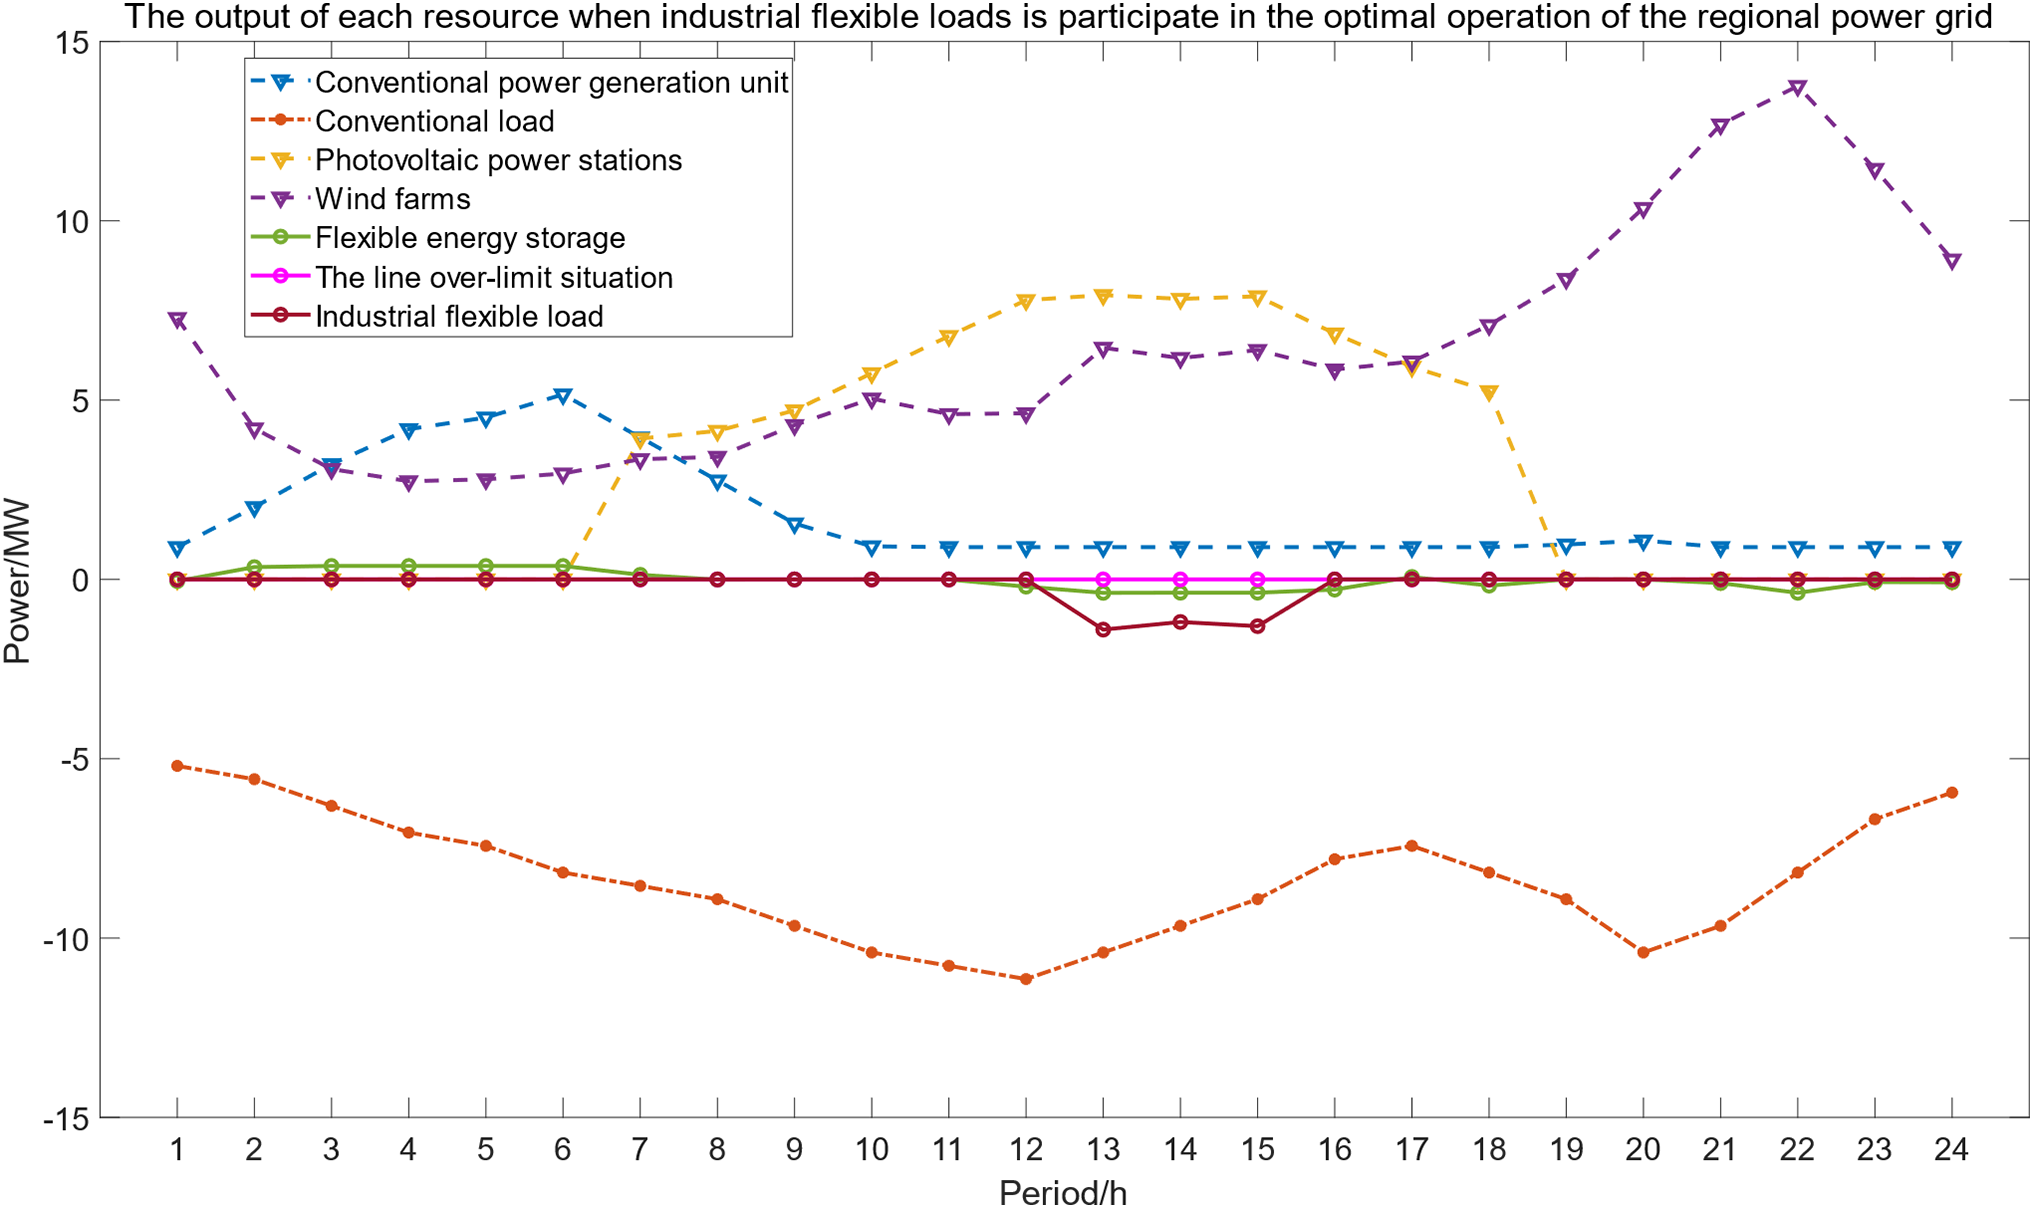
Figure 10: The output of each resource when industrial flexible loads participate in the optimal operation of the regional power grid
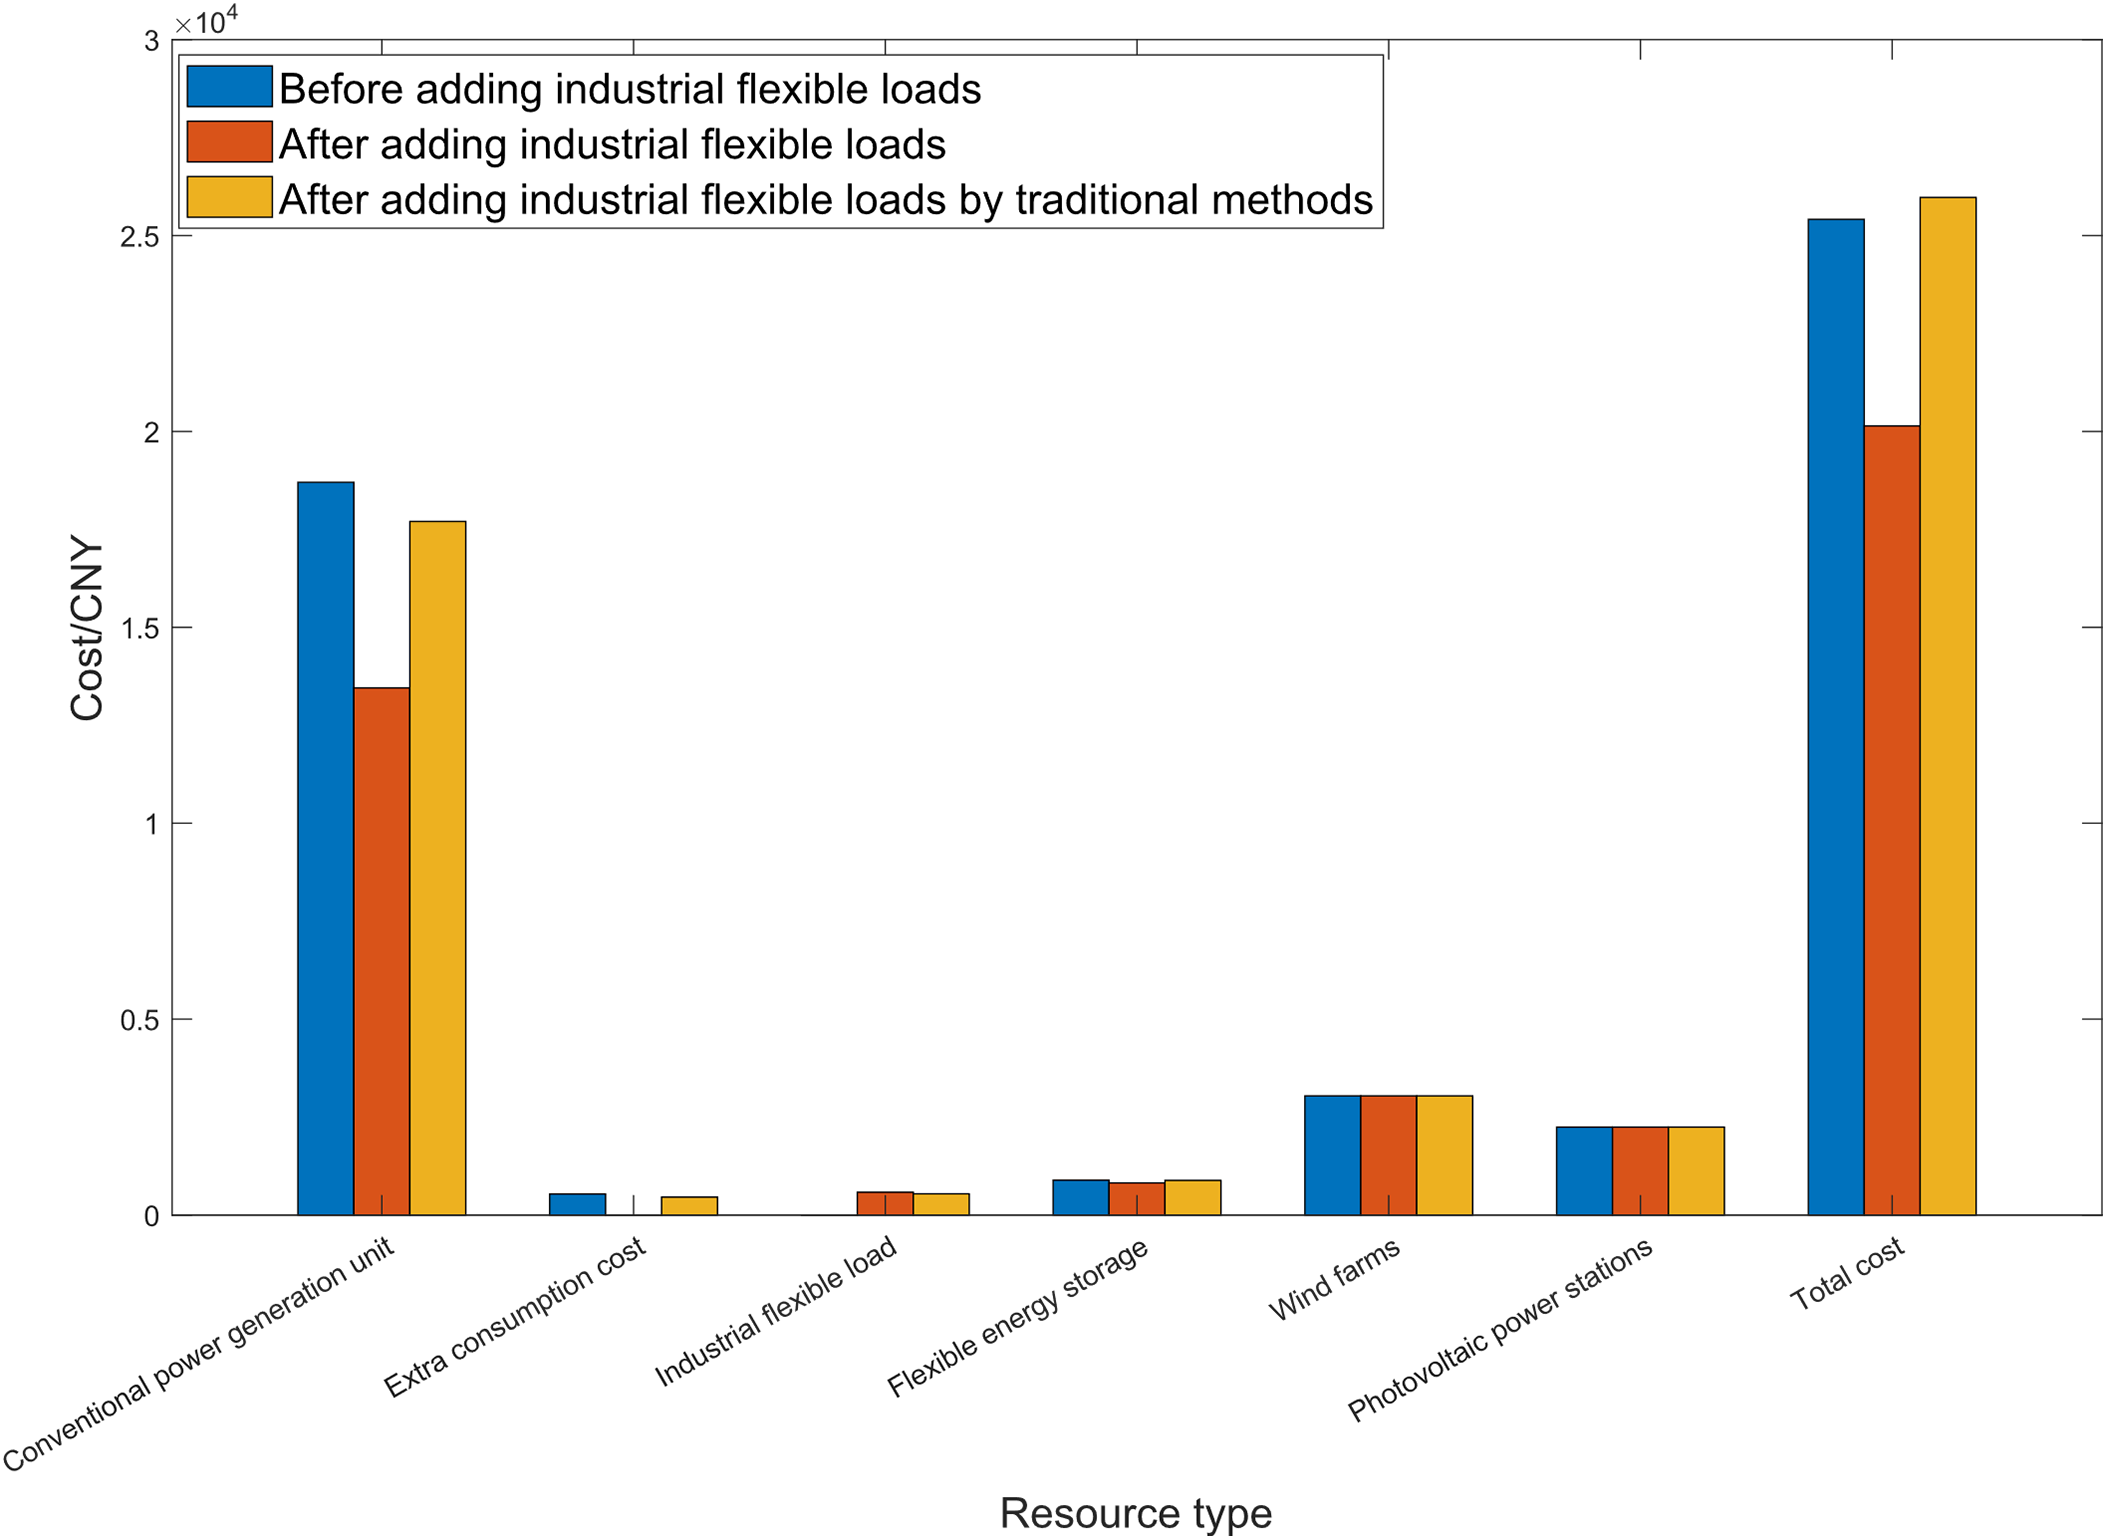
Figure 11: Comparison of the power grid operating costs before and after the participation of industrial flexible loads using the method in this paper vs. after the participation using traditional methods
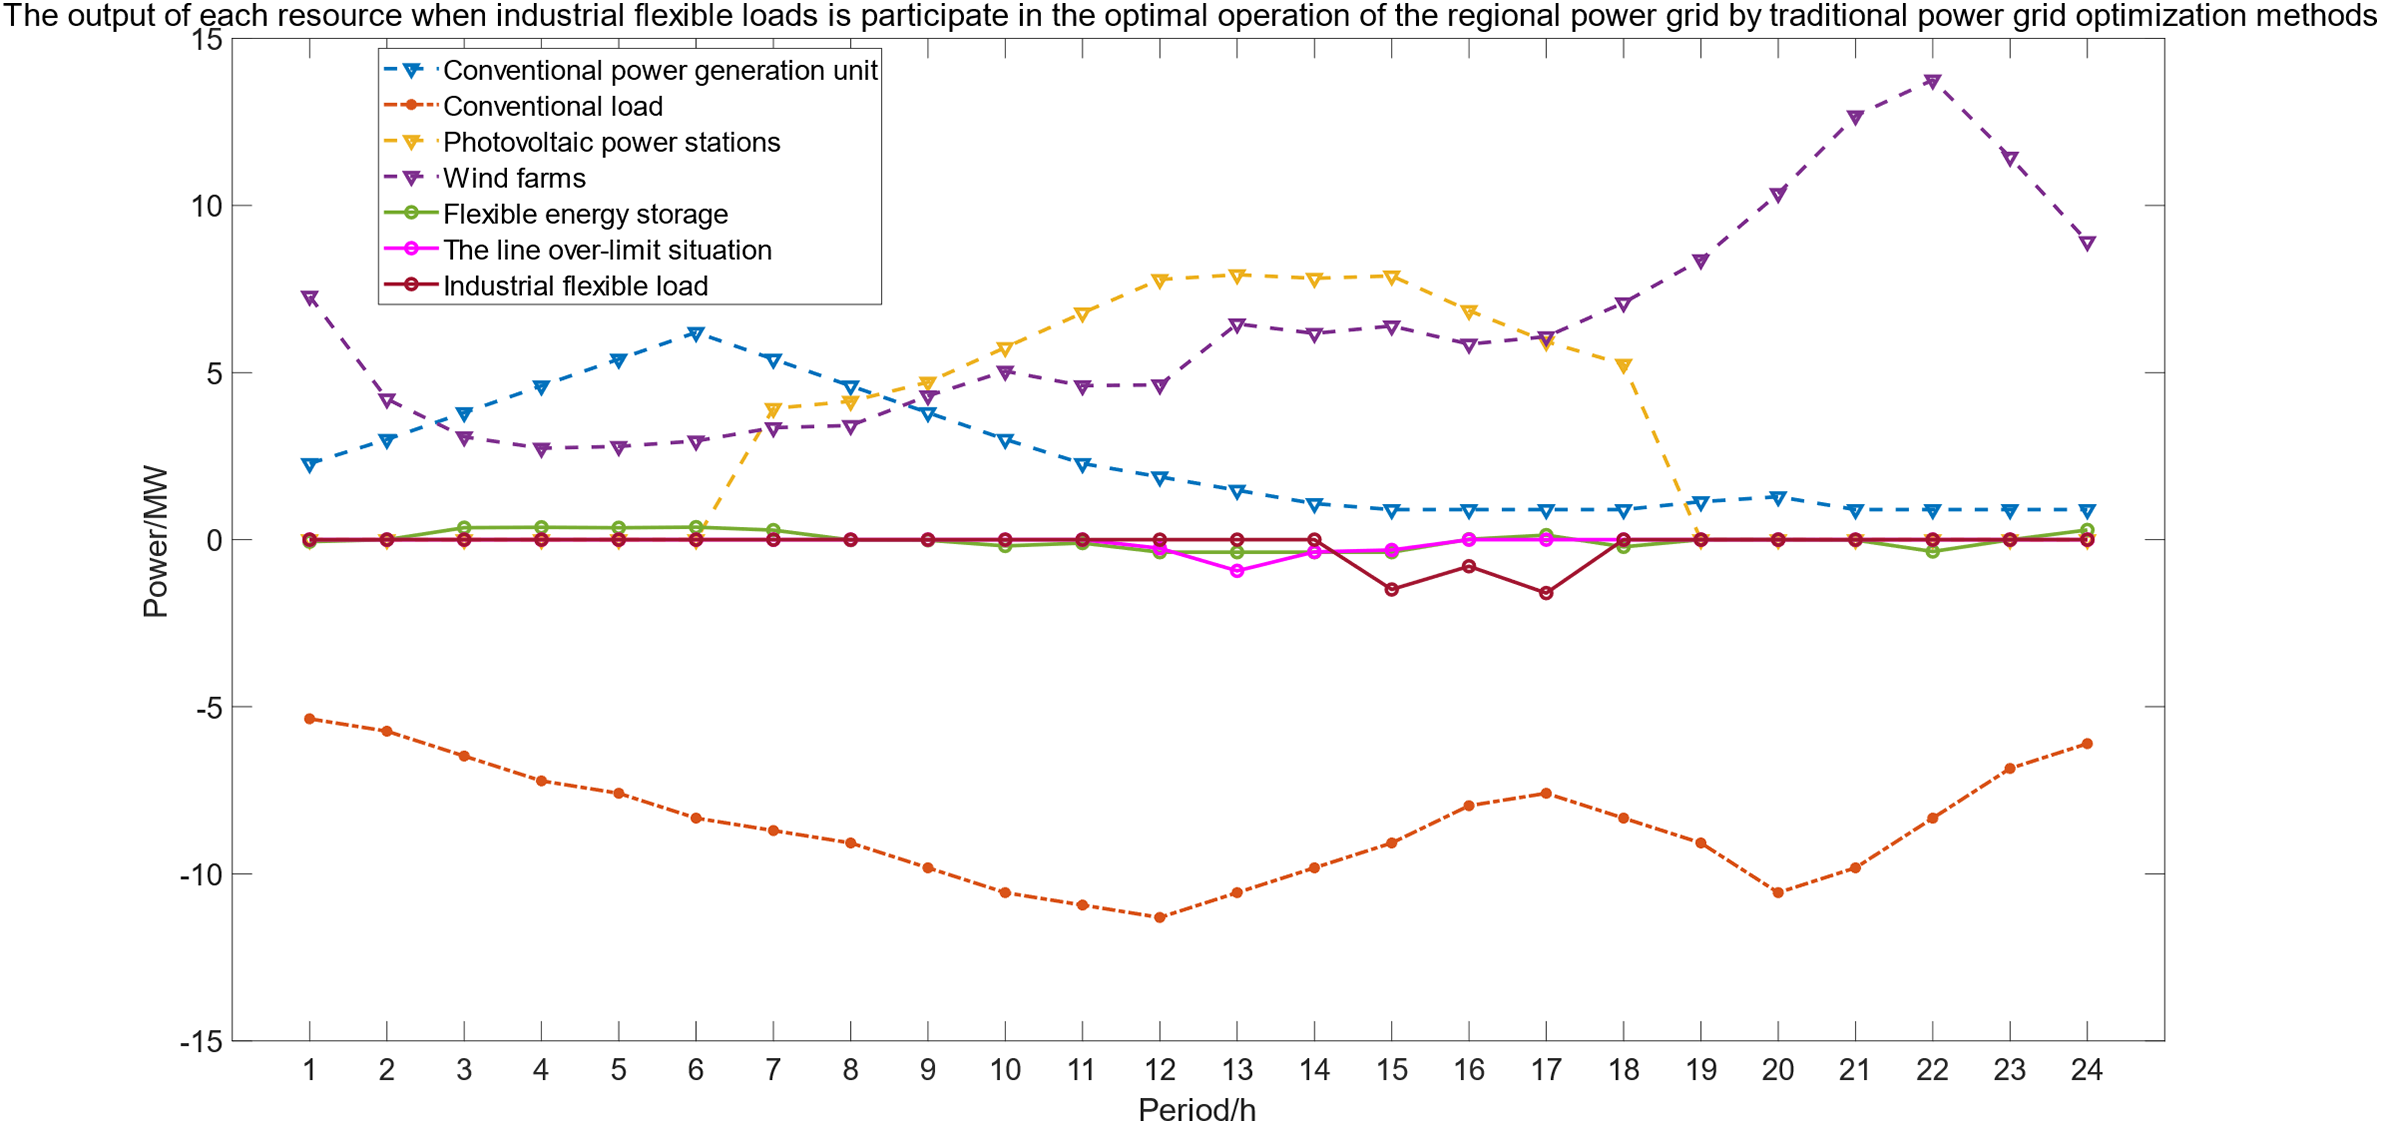
Figure 12: The output of each resource when industrial flexible loads participate in the optimal operation of the regional power grid by traditional power grid optimization methods
In scenario 1, the regional power grid optimal dispatching relies only on conventional power units and flexible energy storage resources to meet the load demand. As can be seen from Fig. 8, during the period from 9:00 to 16:00, the wind power output gradually increases, and the photovoltaic power output is also in a high state, which makes the power of conventional power units decrease, and the flexible energy storage starts to charge, and begins to absorb excess renewable energy output. However, during the period from 11:00 to 16:00, the wind power output fluctuates, and the photovoltaic power output reaches the peak of the day, far exceeding the conventional load demand of the region. Due to the limited charging power of flexible energy storage, and the limited ramp rate of conventional power units, it is probably impossible to reduce the power generation significantly in a short time. In this case, the regional power grid, in order to absorb the excess wind and solar power, appears serious line over-limit phenomenon, as shown in Fig. 9, in this scenario, the power over-limit percentage of the inter-regional tie lines 3–4 is the highest at 13:00, reaching 23.49%, and the power over-limit percentage of the inter-regional tie lines 12–13 and 28–29 also appear during this period, which means that the power of the regional power grid is unbalanced, and the stability and economy will be greatly affected. As shown in Fig. 11, the measure of forcibly absorbing the excess wind and solar power will also greatly increase the cost of maintaining the stable and secure operation of the regional power grid.
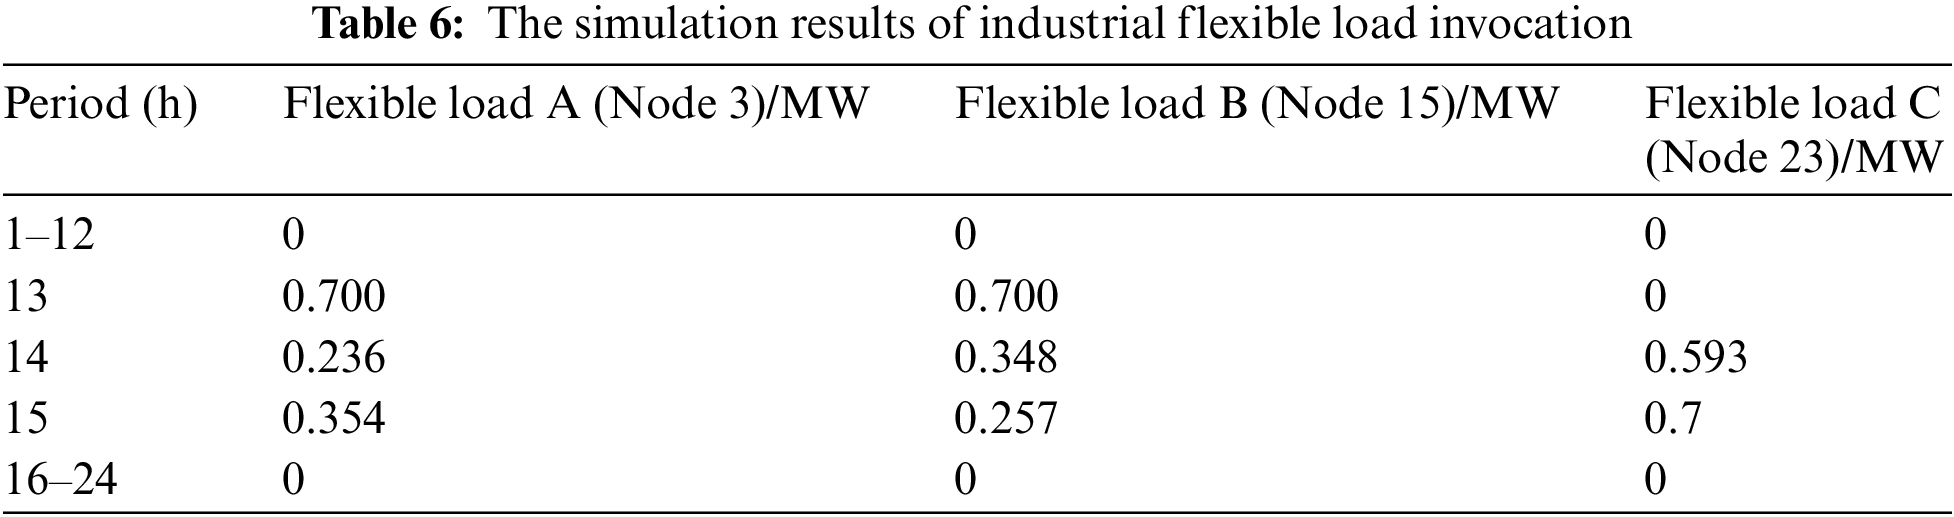
In scenario 2, the regional power grid introduces industrial flexible loads to participate in the optimal dispatch, and adjusts the electricity consumption period of industrial flexible loads to respond to the load demand for renewable energy consumption. Compared with scenario 1, the total load of the regional power grid remains unchanged, and the industrial flexible loads that were originally distributed in various periods of the day are concentratedly called to participate in the renewable energy consumption in the regional power grid from 11 to 16 o’clock when the renewable energy output is excessive. Through optimal dispatch, the renewable energy output is fully utilized, and the line over-limit situation caused by the excess wind and solar power in scenario 1 no longer exists, ensuring the safe and stable operation of the regional power grid. At the same time, as shown in Fig. 13, the flexible energy storage resources deliver power to the grid when the renewable energy output is low, and consume the renewable energy output by storing energy when the renewable energy output is high, which also reduces the operation cost of the grid to some extent and improves the economic performance of the safe and stable operation of the grid. In addition, as shown in Table 6, due to the concentrated call of industrial flexible loads from 13 to 15 o’clock, the total load of the rest of the periods is reduced, which in turn reduces the output demand of conventional power generation units from 1 to 10 o’clock and 19 to 21 o’clock, and reduces the generation cost of conventional power generation units, achieving the effect shown in Figs. 10 and 11, that after the industrial flexible loads participate in the regulation of the regional power grid, under the premise of ensuring the safe operation of the regional power grid and no line over-limit, the economic benefits of the dispatch are improved.
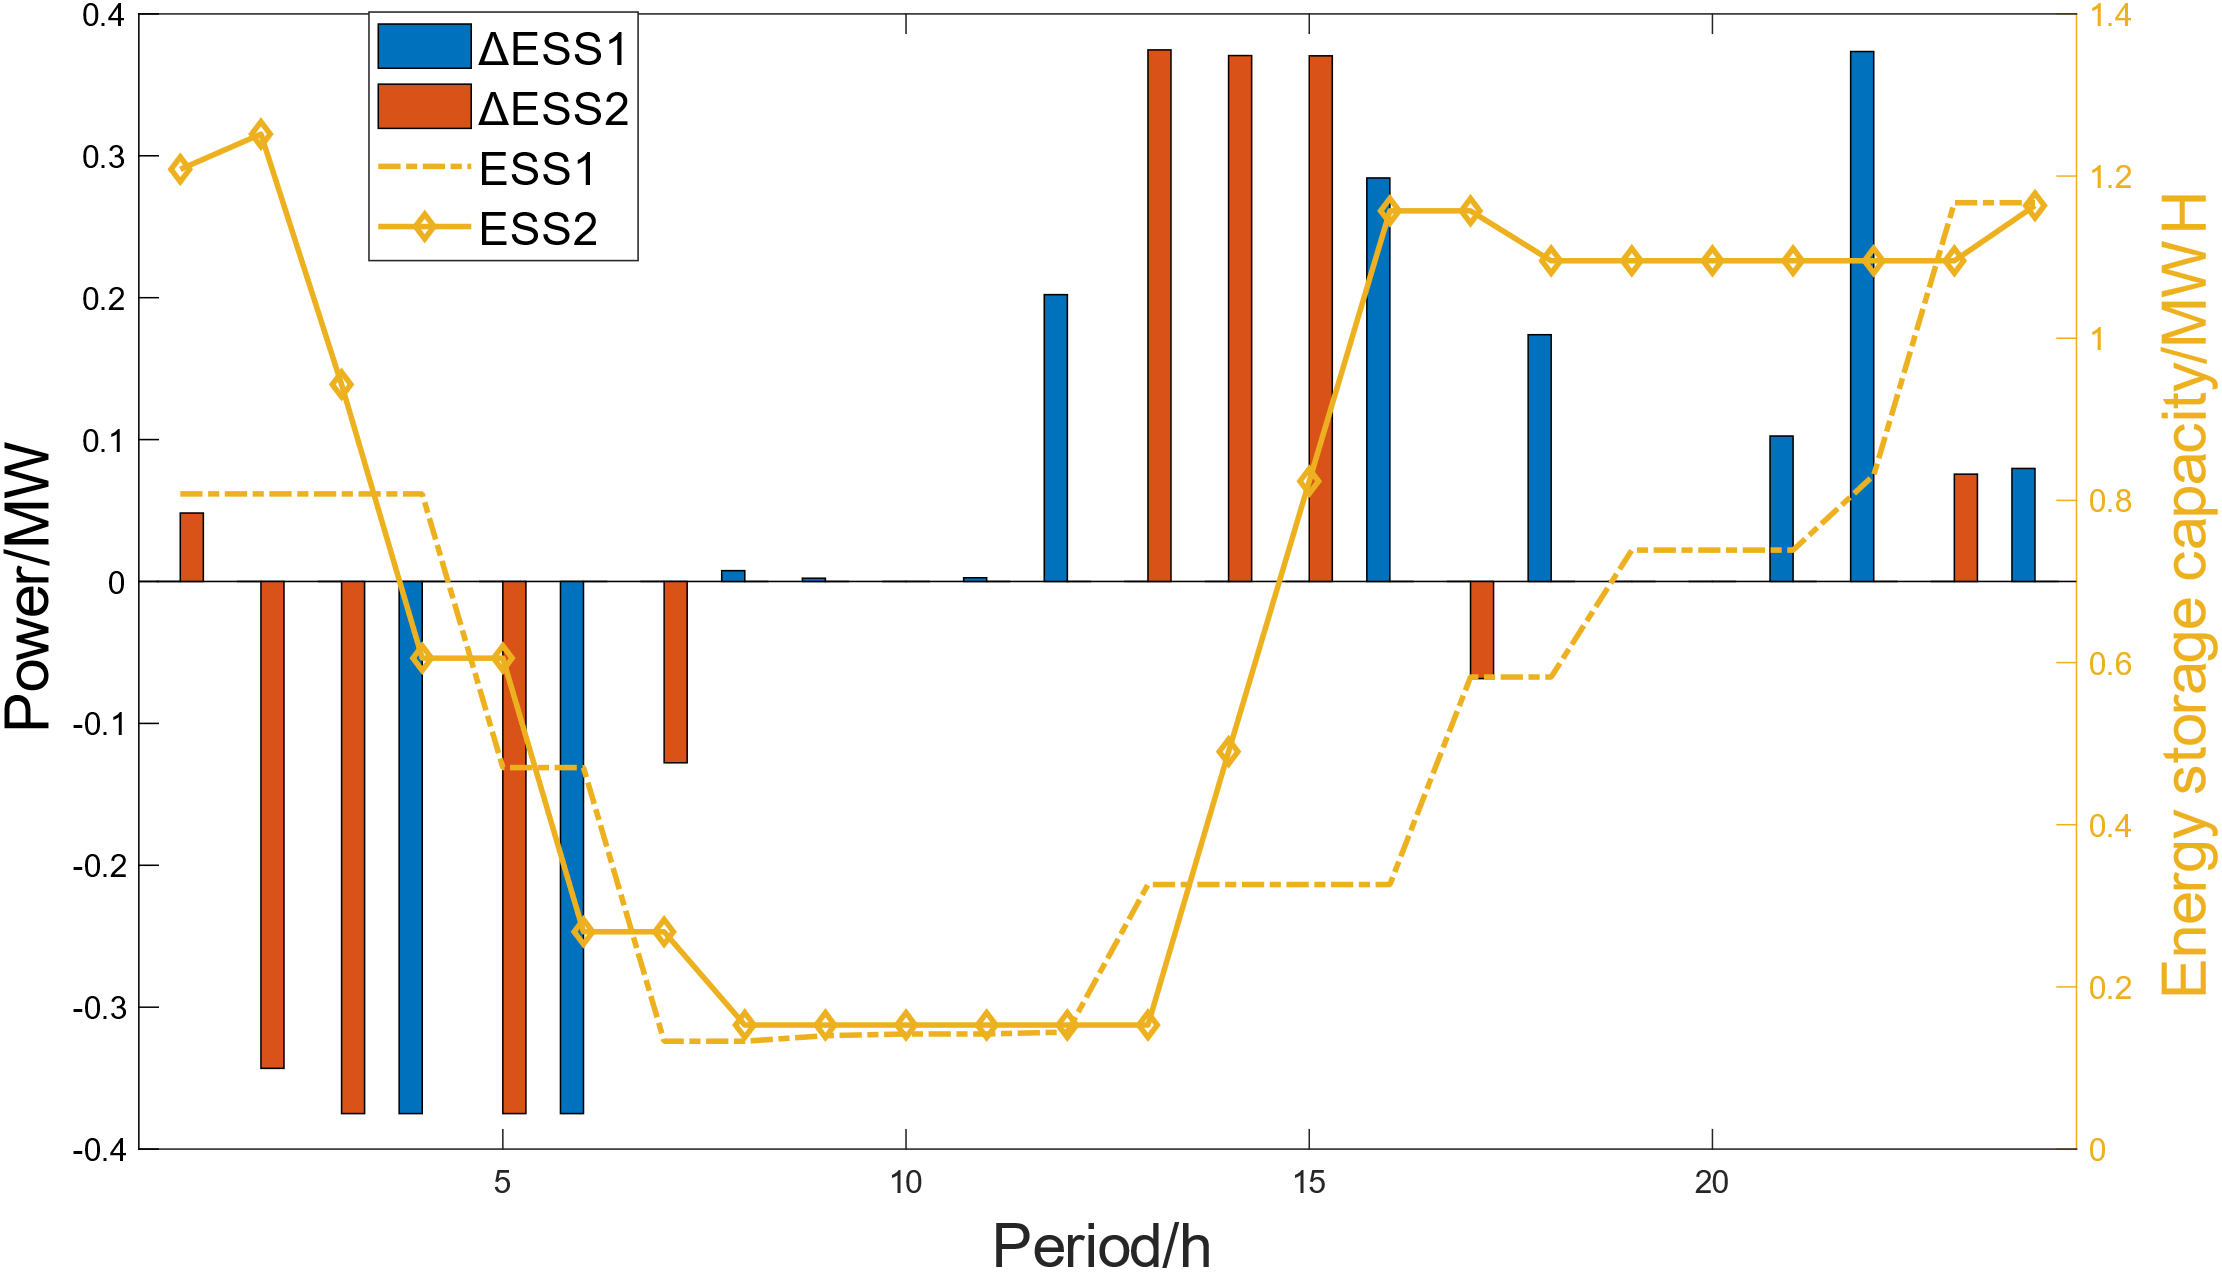
Figure 13: The simulation results of flexible energy storage invocation
As shown in Fig. 12, the simulation results after activating industrial flexible loads through traditional dispatch methods indicate that during the 11–17 time period, when the regional power grid faces the challenge of excessive renewable energy output, although traditional dispatch methods can mobilize industrial flexible loads to respond to the fluctuations of renewable energy, there is a noticeable lag in response speed compared to the method proposed in this paper. Particularly when the renewable energy output rises rapidly, this delayed response may lead to line over-limit situations, thereby triggering a series of issues. In such cases, the regional power grid might have to take emergency measures to absorb the excess wind and solar power, which not only exacerbates the severity of line over-limitation but may also significantly increase the cost of maintaining the safe and stable operation of the power grid. Therefore, the method presented in this paper demonstrates its superiority in ensuring the stability and economic efficiency of the power grid.
This paper takes the power grid operation problem with a high proportion of renewable energy as the research background, discusses the impact of industrial flexible loads on the stable, economic, and secure operation of the regional power grid, and proposes a two-layer active power optimization model for power grid partitioning considering industrial flexible loads. The main work and innovation points of this paper are as follows:
A new energy consumption characteristic evaluation index considering the active power of the line is proposed, and a partitioning scheme based on the new energy consumption characteristic evaluation index is designed, which divides the power grid into several partitions, making the power grid operation more balanced and stable within each partition.
A two-layer active power optimization model considering the power constraints of industrial flexible loads is established, which considers the regulation capacity, ability, and cost of industrial flexible loads, and designs the upper-layer model as the optimal dispatching plan of the regional power grid as a whole, and the lower-layer model as the regional source-load dispatching plan of each partition considering the cost of industrial flexible load invocation, and realizes the safe, stable and economic operation of the power grid and the saving of the total operation cost of the power grid by coordinating the objectives and constraints of the regional power grid and each partition.
A comparative experiment of industrial flexible load participation and non-participation in power system operation is designed, and through simulation analysis, the effectiveness of industrial flexible load participation in power grid regulation is verified, which shows that industrial flexible loads can effectively participate in absorbing the excess output of renewable energy, reduce the line over-limit situation that occurs when the regional power grid absorbs the excess output of renewable energy, and improve the stability and economy of the regional power grid.
This paper provides a feasible scheme for industrial flexible load participation in regional power grid optimal dispatching and provides an effective way to promote the large-scale grid connection and utilization of renewable energy. The shortcomings of this paper are that it does not consider the regulation response time and reliability of industrial flexible loads, nor does it consider the preferences and satisfaction of industrial users, which will affect the actual effect of industrial flexible load participation in demand response. Therefore, future research can explore and analyze these aspects in depth, in order to improve the feasibility and reliability of industrial flexible load participation in demand response.
Acknowledgement: This work was supported by Kaifeng Zhang’s group of the School of Southeast University. We would like to extend our heartfelt thanks to the reviewers for their insightful comments and suggestions. Their expertise and meticulous scrutiny have greatly enhanced the quality of our study. We deeply appreciate their diligent work and contribution.
Funding Statement: This work was supported by State Grid Corporation of China Project “Research and Application of Key Technologies for Active Power Control in Regional Power Grid with High Penetration of Distributed Renewable Generation” (5108-202316044A-1-1-ZN).
Author Contributions: The authors confirm their contributions to the paper as follows: Study conception and design were carried out by Wentao Li, Kaifeng Zhang and Kun Yuan; data collection was conducted by Jiantao Liu and Yudun Li; analysis and interpretation of results were performed by Wentao Li, Guoxin Ming and Kun Yuan; draft manuscript preparation was done by Wentao Li and Kun Yuan. All authors reviewed the results and approved the final version of the manuscript.
Availability of Data and Materials: Data available on request from the authors.
Conflicts of Interest: The authors declare that they have no conflicts of interest to report regarding the present study.
References
1. J. X. Long, W. Y. Chen, and Z. K. Zhang, “Opportunities and challenges from energy transition: Based on carbon neutrality strategy case study in China,” Environ. Resour. Ecol. J., vol. 7, no. 7, pp. 1–8, Nov. 2023. doi: 10.23977/erej.2023.070701. [Google Scholar] [CrossRef]
2. K. K. Wang et al., “Analysis and countermeasures of China’s green electric power development,” Sustainability, vol. 13, no. 2, pp. 708, Jan. 2021. doi: 10.3390/su13020708. [Google Scholar] [CrossRef]
3. H. Zheng, “Research on low-carbon development path of new energy industry under the background of smart grid,” J. King Saud Univ. Sci., vol. 36, no. 3, pp. 103105, Mar. 2024. doi: 10.1016/j.jksus.2024.103105. [Google Scholar] [CrossRef]
4. Y. H. Ma et al., “Research on power system flexibility enhancement method based on pre-selection of structure adjustment strategy,” Int. J. Elec. Power, vol. 157, pp. 109759, Jun. 2024. doi: 10.1016/j.ijepes.2023.109759. [Google Scholar] [CrossRef]
5. H. K. Ren, M. Ashtine, M. McCulloch, and D. Wallom, “An analytical method for sizing energy storage in microgrid systems to maximize renewable consumption and minimize unused storage capacity,” J. Energy Storage, vol. 68, pp. 107735, Sep. 2023. doi: 10.1016/j.est.2023.107735. [Google Scholar] [CrossRef]
6. S. W. Yu, S. S. Zhou, and J. P. Qin, “Layout optimization of China’s power transmission lines for renewable power integration considering flexible resources and grid stability,” Int. J. Elec. Power, vol. 135, pp. 107507, Feb. 2022. doi: 10.1016/j.ijepes.2021.107507. [Google Scholar] [CrossRef]
7. T. Yildiz, E. Acilan, and M. Gol, “A partitioning strategy for improved state estimation performance in ill-conditioned power systems with hybrid measurement set,” Electr. Pow. Syst. Res., vol. 201, pp. 107515, Dec. 2021. doi: 10.1016/j.epsr.2021.107515. [Google Scholar] [CrossRef]
8. N. Chakraborty, A. Mondal, and S. Mondal, “Efficient load control based demand side management schemes towards a smart energy grid system,” Sustain. Cities Soc., vol. 59, pp. 102175, Aug. 2020. doi: 10.1016/j.scs.2020.102175. [Google Scholar] [CrossRef]
9. M. Z. Oskouei, H. Mehrjerdi, D. Babazadeh, P. T. Baboli, C. Becker and P. Palensky, “Resilience-oriented operation of power systems: Hierarchical partitioning-based approach,” Appl. Energ., vol. 312, pp. 118721, Apr. 2022. doi: 10.1016/j.apenergy.2022.118721. [Google Scholar] [CrossRef]
10. N. Mortazavi, B. Alizadeh, A. Sahab, and S. M. S. Barzegar, “Risk-based planning and partitioning of multiple micro-grids in distribution systems,” Int. J. Elec. Power, vol. 137, pp. 107659, May 2022. doi: 10.1016/j.ijepes.2021.107659. [Google Scholar] [CrossRef]
11. A. Kumar et al., “Impact of demand side management approaches for the enhancement of voltage stability loadability and customer satisfaction index,” Appl. Energ., vol. 339, pp. 120949, Jun. 2023. doi: 10.1016/j.apenergy.2023.120949. [Google Scholar] [CrossRef]
12. J. A. Rama Curiel and J. Thakur, “A novel approach for direct load control of residential air conditioners for demand side management in developing regions,” Energy, vol. 258, pp. 124763, Nov. 2022. doi: 10.1016/j.energy.2022.124763. [Google Scholar] [CrossRef]
13. R. M. Elavarasan, S. Leoponraj, J. Vishnupriyan, A. Dheeraj, and G. G. Sundar, “Multi-criteria decision analysis for user satisfaction-induced demand-side load management for an institutional building,” Renew. Energ., vol. 170, pp. 1396–1426, Jun. 2021. doi: 10.1016/j.renene.2021.01.134. [Google Scholar] [CrossRef]
14. J. J. Zhao, J. D. Zhu, R. Jia, S. Liu, and C. Ye, “Method for cluster partition of distributed generation considering flexible supply and demand balance and response speed,” in 2021 3rd Int. Conf. Smart Power Internet Energy Syst. (SPIES), Shanghai, China, Sep. 2021, pp. 35–38. [Google Scholar]
15. J. Wu, G. L. Qian, Y. F. Sun, J. Y. Qian, B. L. Pan, and J. T. Yue, “Load forecasting combination model considering demand response resources,” in 2023 4th Int. Conf. Inf. Sci., Parallel Distrib. Syst. (ISPDS), Guangzhou, China, Jul. 2023, pp. 235–238. [Google Scholar]
16. F. Asgharzadeh, V. S. Tabar, and S. Ghassemzadeh, “Stochastic bi-level allocation of electric vehicle charging stations in the presence of wind turbines, crypto-currency loads and demand side management,” Electr. Pow. Syst. Res., vol. 220, pp. 109383, Jul. 2023. doi: 10.1016/j.epsr.2023.109383. [Google Scholar] [CrossRef]
17. K. Shi, D. Z. Li, S. He, L. Wang, and Y. X. Yi, “A layered-divisional dispatching method for balancing supply and demand of power grid by considering demand side resources,” Modern Electric Power, vol. 35, no. 1, pp. 66–70, Feb. 2018. [Google Scholar]
18. J. Cui et al., “Demand response method considering multiple types of flexible loads in industrial parks,” Eng. Appl. Artif. Intel., vol. 122, pp. 106060, Jun. 2023. doi: 10.1016/j.engappai.2023.106060. [Google Scholar] [CrossRef]
19. Z. W. Wen and G. B. Gu, “Analysis on impact of high energy-consuming enterprise in exploitation of renewable energy,” in 2017 20th Int. Conf. Electric. Mach. Syst. (ICEMS), Sydney, NSW, Australia, Aug. 2017, pp. 1–4. [Google Scholar]
20. G. G. Dranka and P. V. Ferreira, “Load flexibility potential across residential, commercial and industrial sectors in Brazil,” Energy, vol. 201, pp. 117483, Jun. 2020. doi: 10.1016/j.energy.2020.117483. [Google Scholar] [CrossRef]
21. F. Khavari, A. Badri, and A. Zangeneh, “A tie-line power smoothing via a novel dynamic real-time pricing mechanism in MMGs,” Int. J. Elec. Power, vol. 136, pp. 107671, Mar. 2022. doi: 10.1016/j.ijepes.2021.107671. [Google Scholar] [CrossRef]
22. L. P. Zhu and W. Y. Liu, “Hierarchical optimization model of partition source-load coordination considering improvement of tie-line power,” in 2019 IEEE Sustain. Power Energy Conf. (iSPEC), Beijing, China, Nov. 2019, pp. 1010–1015. [Google Scholar]
23. D. J. Warsono, C. S. O. King, and D. A. Bradley, “Economic load dispatch optimization of renewable energy in power system using genetic algorithm,” in 2007 IEEE Lausanne Power Tech., Lausanne, Switzerland, Jul. 2007, pp. 2174–2179. [Google Scholar]
24. X. D. Li, W. J. Yang, J. Wei, R. Wang, and Y. W. Liao, “Part-load operation risk assessment of hydropower units in hydro–wind–solar hybrid system considering hydraulic characteristics,” Energy Rep., vol. 9, no. 8, pp. 332–342, Sep. 2023. doi: 10.1016/j.egyr.2023.04.284. [Google Scholar] [CrossRef]
25. H. A. Khan, M. Zuhaib, and M. Rihan, “Voltage fluctuation mitigation with coordinated OLTC and energy storage control in high PV penetrating distribution network,” Electr. Pow. Syst. Res., vol. 208, pp. 107924, Jul. 2022. doi: 10.1016/j.epsr.2022.107924. [Google Scholar] [CrossRef]
Cite This Article
 Copyright © 2024 The Author(s). Published by Tech Science Press.
This work is licensed under a Creative Commons Attribution 4.0 International License , which permits unrestricted use, distribution, and reproduction in any medium, provided the original work is properly cited.
 Downloads
 Citation Tools