
 Submit a Paper
 Propose a Special lssue
 Open Access
ARTICLE

Predicting Turbidite Channel in Deep-Water Canyon Based on Grey Relational Analysis-Support Vector Machine Model: A Case Study of the Lingshui Depression in Qiongdongnan Basin, South China Sea
1 School of Earth and Space Sciences, Peking University, Beijing, 100871, China
2 Key Laboratory of Orogenic Belts and Crustal Evolution, Peking University, Beijing, 100871, China
3 Geotechnical Physical and Mechanical Properties Laboratory, Langfang Normal University, Langfang, 065000, China
4 Heilongjiang Northeast Petroleum University Science Park Development Co., Ltd., Daqing, 163318, China
5 College of Petroleum Engineering, Northeast Petroleum University, Daqing, 163318, China
* Corresponding Authors: Li Li. Email: ; Zhandong Li. Email:
(This article belongs to the Special Issue: Carbon Reduction and Optimized Recovery Strategies for Unconventional Resource)
Energy Engineering 2024, 121(9), 2435-2447. https://doi.org/10.32604/ee.2024.050771
Received 17 February 2024; Accepted 17 May 2024; Issue published 19 August 2024
 View Full Text
 Download PDF
Abstract
The turbidite channel of South China Sea has been highly concerned. Influenced by the complex fault and the rapid phase change of lithofacies, predicting the channel through conventional seismic attributes is not accurate enough. In response to this disadvantage, this study used a method combining grey relational analysis (GRA) and support vector machine (SVM) and established a set of prediction technical procedures suitable for reservoirs with complex geological conditions. In the case study of the Huangliu Formation in Qiongdongnan Basin, South China Sea, this study first dimensionalized the conventional seismic attributes of Gas Layer Group I and then used the GRA method to obtain the main relational factors. A higher relational degree indicates a higher probability of responding to the attributes of the turbidite channel. This study then accumulated the optimized attributes with the highest relational factors to obtain a first-order accumulated sequence, which was used as the input training sample of the SVM model, thus successfully constructing the SVM turbidite channel model. Drilling results prove that the GRA-SVM method has a high drilling coincidence rate. Utilizing the core and logging data and taking full use of the advantages of seismic inversion in predicting the sand boundary of water channels, this study divides the sedimentary microfacies of the Huangliu Formation in the Lingshui 17-2 Gas Field. This comprehensive study has shown that the GRA-SVM method has high accuracy for predicting turbidite channels and can be used as a superior turbidite channel prediction method under complex geological conditions.Keywords
Nomenclature
| GRA | Grey relational analysis |
| SVM | Support vector machine |
In the expansive oil and gas basins of the South China Sea, the discovery and exploitation of geological reserves in turbidite channel sand bodies hold paramount importance [1]. Specifically, in the ultra-deep-water territories of the Qiongdongnan Basin, significant natural gas reserves are harbored within these turbidite reservoirs. A notable example is the Lingshui 17-2 Gas Field, where the majority of geological reserves are predominantly situated in turbidite formations. To date, the proven geological reserve of natural gas within the Huangliu Formation has reached an impressive 1031.26 × 108 m3, with an additional indicated geological reserve of 162.67 × 10⁸ m3, cumulating to a total of 1208.73 × 108 m3 across possible, proven, and indicated reserves. The sedimentary processes of turbidite channels within the Huangliu Formation play a critical role in the genesis of natural gas reservoirs in this deep-water sector. However, the intricate sedimentary environment and the challenges posed by deep-water exploration elevate drilling risks and costs, subsequently hampering the overall exploration efforts. Furthermore, the prediction of deep-water turbidite channels has yet to achieve significant breakthroughs, significantly impeding the exploration and development activities in the region.
Thus, the accurate and efficient prediction of the distribution characteristics of deep-water turbidite channels becomes a crucial endeavor to mitigate drilling inaccuracies and enhance production processes. Seismic attributes, recognized for their operational feasibility and unbiased predictive capabilities, have been extensively utilized in reservoir prediction endeavors [2–4]. Despite the elimination of human factors in seismic data acquisition, processing, and inversion methods, the singular use of a seismic attribute often fails to meticulously characterize the reservoir due to the sheer volume and diversity of attributes, coupled with the unpredictable and nonlinear relationships between these attributes and sedimentary formations like river channels. Consequently, identifying an effective prediction method amidst a plethora of seismic attributes to delineate deep-water turbidite channels remains a significant challenge. As per the investigation results, the current common methods for solving the nonlinearity of samples include neural networks, GRA, SVM, etc., but these methods have shortcomings such as overfitting in predicting sand bodies [5–9]. Therefore, in order to improve the prediction accuracy of turbidite channel sand bodies, the application of seismic attributes in the effective prediction of sand bodies in turbidite channels should be further explored.
Hence, to elevate the predictive accuracy of turbidite channel sand bodies, this study advocates for a deeper exploration into the synergistic application of seismic attributes in predicting turbidite channel sand bodies [10–13]. Leveraging the low sample size requirement of GRA, which facilitates optimization through relational degree, and the SVM's proficiency in managing small, nonlinear, and high-dimensional samples through dimension reduction and comprehensive consideration of influencing factors [14–17], this paper draws on the method proposed in reference [7], a seismic prediction method for deep-water turbidite channels based on GRA-SVM has been developed. This paper approach amalgamates the strengths of GRA and SVM, proposing it as an advanced method for predicting deep-water turbidite channels. Empirical evidence from its application in the Huangliu Formation of the Lingshui 17-2 Gas Field underscores its high predictive accuracy, establishing the GRA-SVM model as an invaluable tool for forecasting turbidite channels under the complex geological conditions prevalent in the deep-water domains of the South China Sea. This endeavor not only marks a significant advancement in the realm of seismic attribute application but also contributes substantially to the strategic exploration and development of oil and gas resources in challenging deep-water environments.
GRA calculates the relationship between the system and the influencing factors, aiming to determine the main factor with the closest relationship [5]. The main mechanism is to convert the variable factor value into a geometric curve and compare the shape of the curve. A higher similarity of the shape indicates a greater relational degree. With high similarity and great relational degree, the corresponding influencing factor can be concluded as the main factor of the turbidite channel. The intervals of sand bodies where a turbidite channel is drilled are set as the positive sample series of the system, and those of sand bodies where no turbidite channel is found are taken as the negative sample series. The specific process is as follows:
(1) It is assumed that the characteristic series of the system (based on known well series) are
Series participating in the comparison are
(2) Dimensionalization of influencing factors. Because the dimensions and range of many seismic attributes are different, the calculation results may seriously affect the prediction accuracy. Therefore, it is necessary to dimensionalize the attributes of the original series.
(3) Determination of the extreme value of the absolute difference between the two series. The equation for calculating the grey relational coefficient is
(4) Calculation of the relational degree. The relationship series is calculated through the below equation. A higher relational degree indicates a higher probability of responding to the attributes of the turbidite channels.
SVM is applied to nonlinear high dimension and local minima of small samples. Its principle is to construct an optimal decision function, thus mapping the training samples into a high-dimensional feature space through nonlinear mapping, converting the regression of nonlinear function into that of linear function with high-dimensional feature, and then completing the transformation process from nonlinear to linear function [9].
The sample set of attributes participating in the training is established as {xi, yi}, (i = 1, ..., n), where n is the number of spatial samples. The input of the optimized attribute sample is selected as xi, while the output of the sample is selected as yi. For the desired function,
The optimization function is defined as
Constraint condition s· t
where
The Lagrange function is established as
The dual form of the optimization method is
where
The complementary conditions corresponding to Eq. (12) are
The final regression function obtained is
Based on the above principles, a GRA-SVM model was established to achieve the method and process introduced above. The detail is shown in Fig. 1.
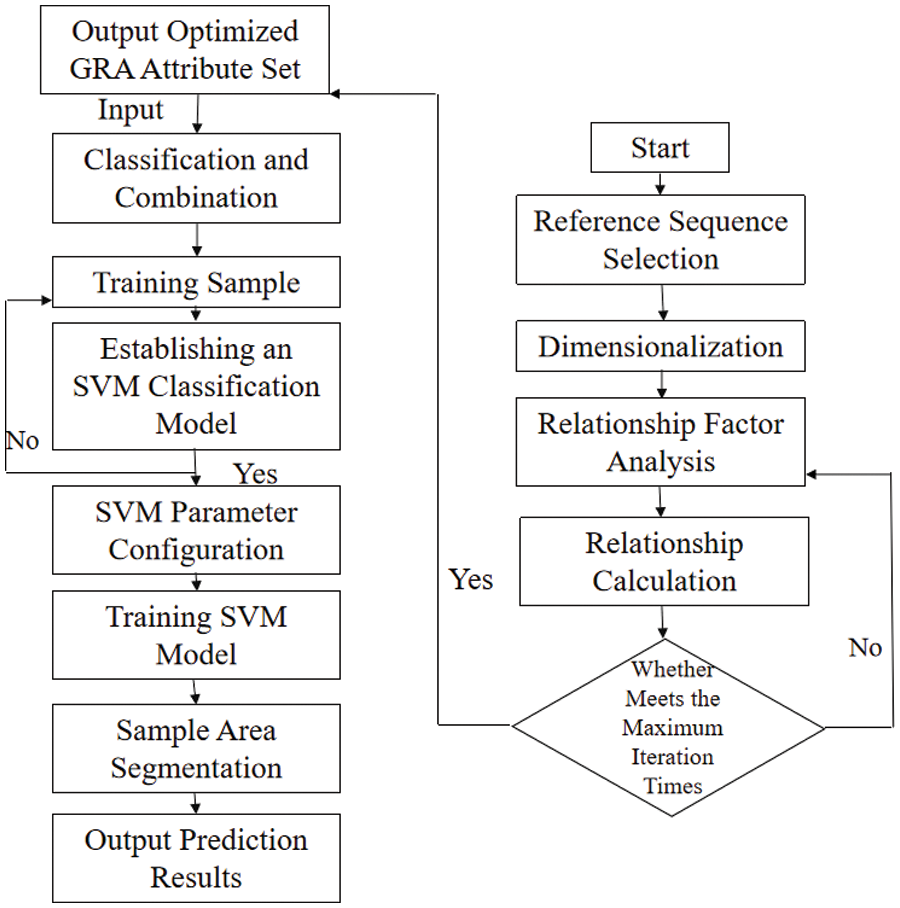
Figure 1: Technique flowchart based on GRA-SVM model
(1) Determine reference series and comparison series
According to the GRA theory, the signal that reflects the stratum attribute extracted from the seismic attribute is a gray signal, and the analysis of the attribute of the river channel and the thickness of sandstone through the seismic attribute signal is a grey system process. Combined with the seismic forward analysis results, seismic attribute signals of known wells in the experimental zone were extracted to form a reference series. Other Seismic attribute signals of the target layer were selected as the comparison series for building a response model of the seismic attribute and the thickness of sandstone.
(2) Nondimensionalize reference series and comparison series
Due to the different physical significance of each seismic attribute in the system, the dimensions of the data are not always the same, which leads to inconvenient comparison and difficulty in obtaining correct conclusions during comparison. Therefore, when GRA is conducted, data are generally required to be nondimensionalized. This study processed the original data through the average standardization approach.
(3) Calculate grey relational coefficient
For reference series X0, there are several comparison series such as X1, X2, and Xn. The relational coefficients between each comparison series and the reference series at different time points (i.e., each point in the curve) can be calculated through GRA.
(4) Sort relation order
The degree of relation between the sample and the reference series is mainly described in the greatness and ranking of the relation degree. A larger relation degree value and higher ranking indicate a greater relation degree with the reference series. On the contrary, a smaller relation degree and lower ranking indicate a lower relation degree with the reference series. This study analyzed the relation degree between sandstone thickness and seismic attributes through the GRA method, calculated the relation degree between these seismic attributes and sandstone thickness, and selected the typical attribute variables as the data samples for SVM classification and combination.
(5) Classify samples
SVM is a learning classification method under supervision. Therefore, for the given training samples, it is necessary to clarify the classification of each sample, which is either 0 or 1. In other words, each sample should be labeled with an exact category label for SVM training.
(6) Set SVM parameters
The commonly used settings for SVM parameters include the SVM type, the kernel function type, the termination conditions of the algorithm, relaxation variables, etc. The kernel function is to map the training samples to a sample set that is easier for linear segmentation. The mapping, completed through kernel functions, results in an increase in the dimension of the sample vector. As the SVM training process is an iterative solution to the quadratic optimization issue under constraint conditions, a combination of maximum iterations and allowable errors can be set as the termination condition of the algorithm to allow the algorithm to stop computing under appropriate conditions.
(7) Train SVM
As SVM is a supervised learning classification method, for the given training samples, it is necessary to clarify whether the classification of each sample is 0 or 1, or in other words, each sample needs to be labeled with an exact category label for SVM training. SVM has no limitations on the features and dimensions of the samples, which means that different features can be used as representations of training samples to participate in SVM training.
(8) Segment sample area
There is an intuitive way to judge the classification of samples in the test sample space through the above SVM model, namely, to color the space where different classifications of samples are located. Based on red, green, and blue (RGB), different color zones can represent different sample spaces. The junction of the color zones is the classification hyperplane. By this method, the sample area can be segmented.
3.1 Geological Background of the Target Area
The Lingshui Depression is located at the southeast edge of the Qiongdongnan Basin, between the central depression of Qiongdongnan Basin and Hainan Island, and it belongs to the northern lower continental slope zone of the basin. Controlled by boundary faults, the Lingshui Depression mainly develops NE-SW faults. The stratigraphic sedimentation in the Lingshui Depression is a multi-source sedimentary system, jointly controlled by the boundary faults on both sides of the depression and the antithetic faults inside the contemporaneous slope. The Lingshui 17-2 Gas Field is located in the central canyon in the northern part of the low uplift in the south of the Lingshui Depression, with a water depth of 1250–1550 m and an average effective permeability of 596 mD. It is a high-quality and large-scale deep-water gas field with high porosity, high permeability, and high hydrocarbon production. As per the historical well analysis, the Lingshui 17-2 Gas Field is a typical deep-water, high-temperature, and high-pressure gas reservoir. The formation of the Neogene Huangliu Formation-Yinggehai Formation is mainly composed of submarine fans and central canyon reservoir cap association, with lithologic traps distributed in strips along the canyon. The stratigraphic dip is small, with the closure amplitude between 83 and 215 m. The Huangliu Formation is the main gas-bearing target layer, which is divided into four layers from the bottom to the top [18], with the Gas Layer Groups I and II being the main gas-bearing sand bodies [19]. Having the largest production potential, the Gas Layer Group I is further subdivided into two sets of sand bodies, namely, the Gas Layer Group I upper and Gas Layer Group I lower. Each gas group is a different turbidite sand body cut by watercourses in the later period under isochronous deposition. The major gas layer group is mainly composed of well-sorted, argillaceous-cemented, and loose gray fine sandstone, fine siltstone, and siltstone, making it a typical deep-water turbidite sedimentary environment.
3.2 Prediction Based on GRA-SVM Model
Based on the GRA-SVM method, this study conducted practical research on the seismic geological data of the Lingshui Depression, extracting more than 60 kinds of along-layer seismic attributes, covering amplitude, phase, frequency, etc. [20]. After that, this study used the homogenization method to dimensionalize these attributes, then used the GRA method to identify the main factors of the attributes, and found the root mean square (RMS) of the amplitude. The max peak, the instantaneous frequency, and the instantaneous phase have high main relational factors (Fig. 2). This study then accumulated the top 20 attributes with the highest relational factors to obtain a first-order accumulated sequence, which was used as the input training sample of the SVM model. Then the SVM model was used to establish a prediction model and obtain the prediction results. To restore the prediction results through consecutive subtraction, the attribute prediction diagram of the main oil layer of the Huangliu Formation (Top interface S30, bottom interface S40) was ultimately obtained (Fig. 3).
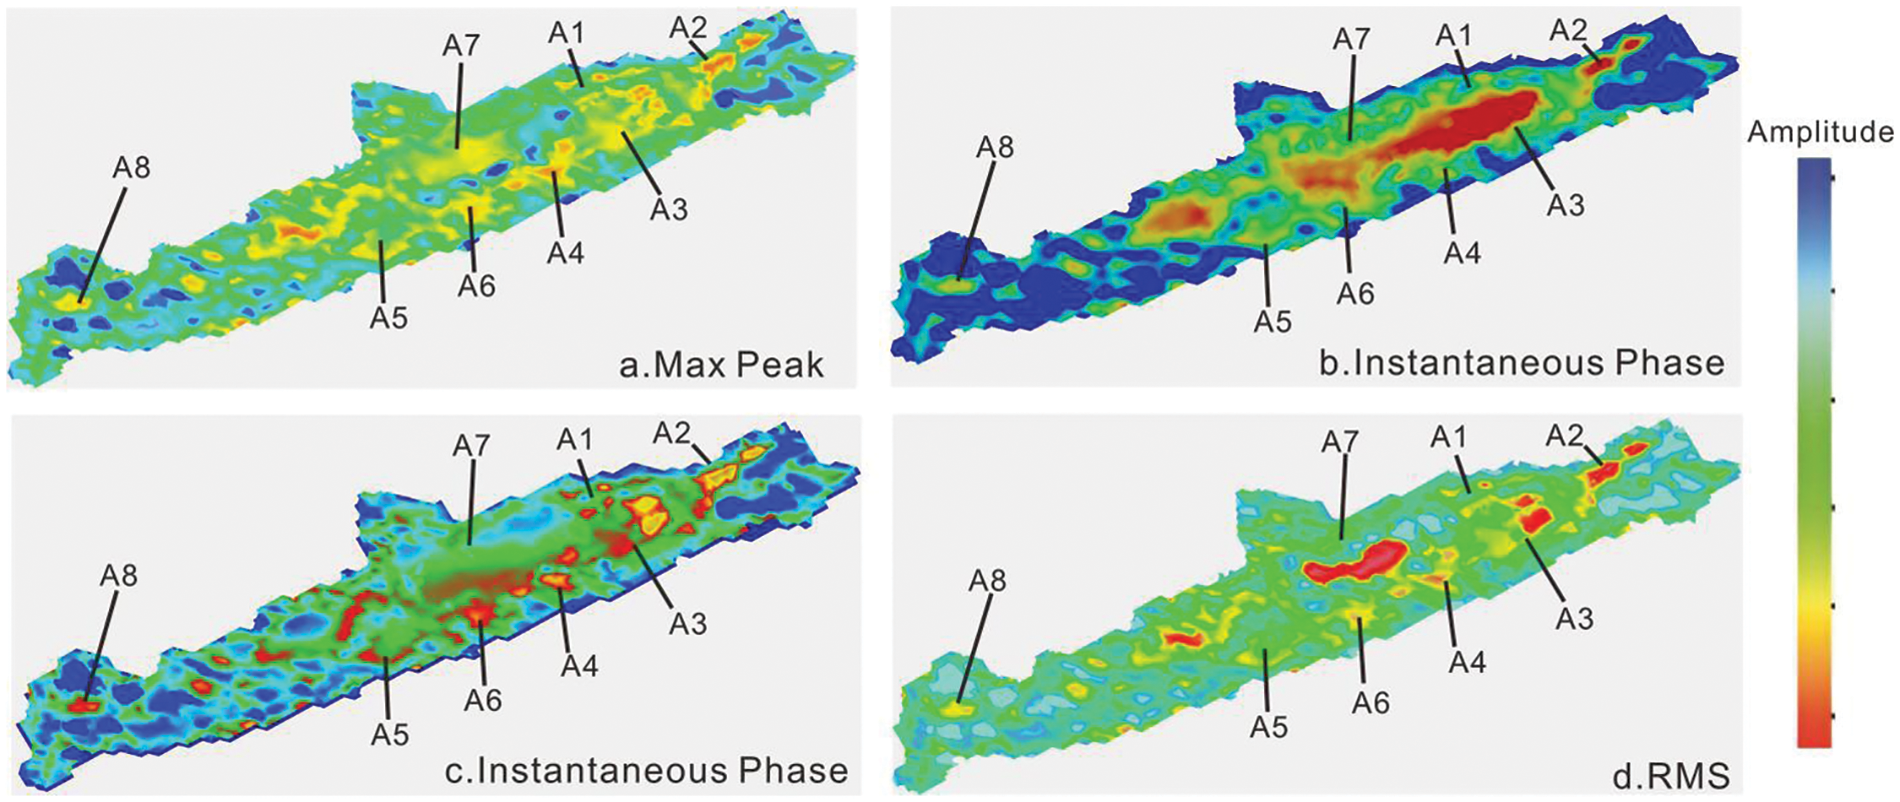
Figure 2: Seismic attribute of the Gas Layer Group I lower of Huangliu Formation in the Lingshui 17-2 Gas Field in the Lingshui Depression
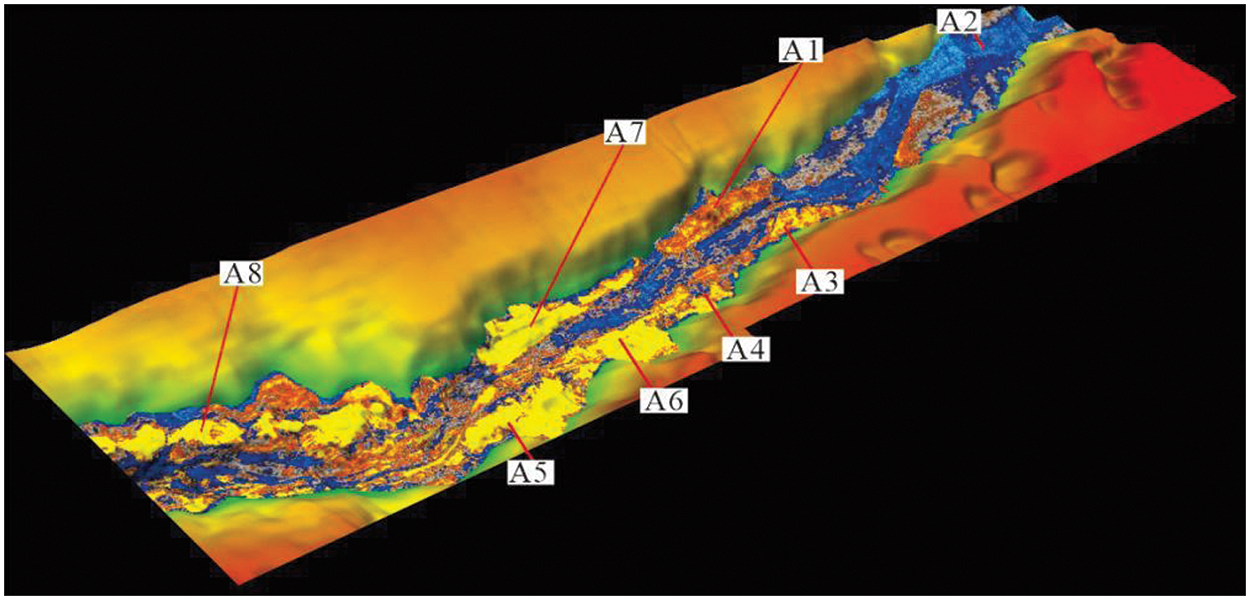
Figure 3: 3D effect graph of deep-water turbidite channels in the Gas Layer Group Ⅰ lower of Huangliu Formation in the Lingshui Depression, Qiongdongnan Basin
The Gas Layer Group I lower of the Huangliu Formation was taken as an example. Based on the GERA-SVM prediction attribute diagram, the sample area segmentation indicates the difference in sedimentation, or in other words, erosion is dominant on the left side, while sedimentation is dominant on the right side, and curved NE-SW channels can be seen clearly on the plane. As proven by the drilling results, the attribute anomaly body is the sedimentation in the deep-water turbidite channel. The channel has developed to a large scale, with a width of about 2 km and a length of 18 km on the plane. During the drilling, seven wells encountered this turbidite sedimentary body. The sandstone coincidence rate was 93% among the drilled water channels, with an average sandstone thickness of 30 m. In conclusion, a greater relationship degree of each seismic attribute indicates a higher probability of responding to the attributes of the channels, revealing that the turbidite channel method based on GRA-SVM is feasible.
3.3.1 Geophysical Characteristics
It can be seen from the through-well seismic profile (Fig. 4) that the valley of the basin is distributed narrowly and cut deeply in the longitudinal direction. The seismic profile is mainly a “V” type [21–23] close to the provenance and shows strong amplitude and good continuity, which indicates that the energy of the turbidity current is strong during this period. Due to the terrain characteristics of high in the west and low in the east, as well as the dominant erosion effect, the sedimentation at the bottom of the valley is dominated by weak amplitude and chaotic reflection. On this basis, the study speculated that this section may be covered by the sedimentation of the early stage of the turbidity current, mainly composed of residual sedimentation and debris flow sedimentation. Due to the reflection combination characteristics of geophysical wave groups, the lateral and vertical sedimentary bodies formed by turbidite channels in the research zone are developed relatively well, with a total of four stages of oblique-superimposed turbidite channels (marked as 1–4 in the figure). Similarly, the drilling result proves that the sedimentation of turbidite channels is mainly composed of a large set of light gray and gray fine sandstones. The logging GR curve generally shows a box-shaped or bell-shaped pattern, with gradually decreasing amplitude upward, and multiple positive rhythm characteristics are shown. The seismic attribute plane shows as an amplitude anomaly body, which is lenticular or strip-like and distributed on the side edge of the curved channel in the middle. Vertically, the channels from different periods develop in a progradational stacking pattern.Through geophysical methods and the rock-electric characteristics of well LS17-2-2, this study revealed that the lateral migration of the turbidite channel sand bodies at the top of this set of sand bodies was more obvious, with more small turbidite channels. These observations fully show that the plane attribute based on GRA-SVM can well depict the deep-water turbidite channels.
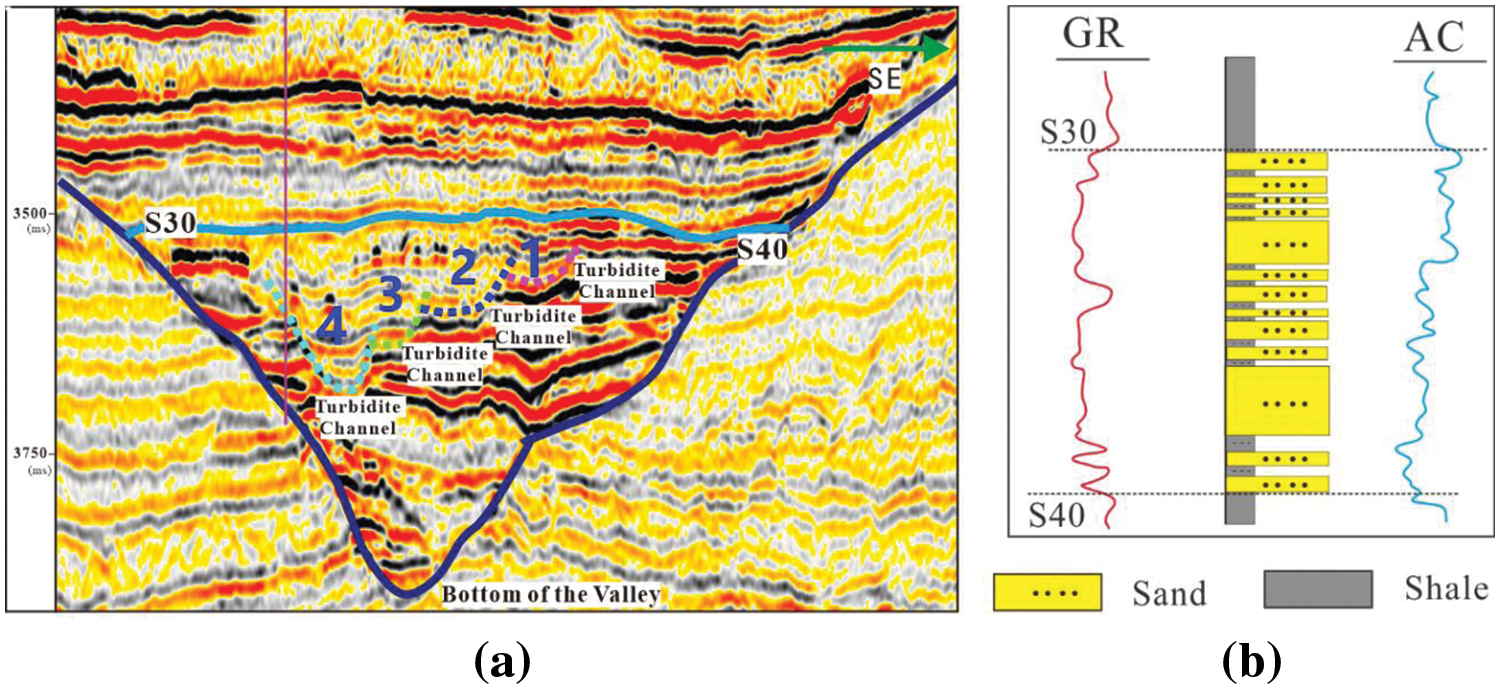
Figure 4: (a) Comprehensive map of seismic profile filling characteristics of oblique-superimposed turbidite channels. (b) Rock electricity during the well logging (Passing through LS17-2-2 well)
3.3.2 Characterization of Sedimentary Microfacies
Based on the above findings, this study utilized the GRA-SVM predicted results, combined with the historical well analysis and geophysical methods, to delineate the boundary of the sand body in the water channel [24,25]. With the help of core and logging data, this study divided the sedimentary facies of the Huangliu Formation in the Lingshui Depression [26,27]. With the Gas Layer Group Ⅰ lower of Huangliu Formation as an example, the research area is mainly a deep-water turbidite subfacies area (Fig. 5). The turbidite channel sedimentation is limited by the central canyon, which is affected by multiple provenances, including Yacheng Region, Yingdong Slope, and Vietnam in the west. Under this circumstance, thick-bedded restricted turbidite channel complexes with low-to-medium curvatures are mainly developed in this area, and sand bodies are distributed in strips along the canyon [28]. The sedimentary bodies in the turbidite channel, depicted by the GRA-SVM method, continuously migrate and accumulate laterally within the canyon, forming sedimentary units such as channel sand bodies and natural embankment complexes. The sedimentary accretionary complex is of a large scale, mainly distributed on the northeast side of the canyon. The lateral accretionary complex develops in small sheets or mounds and is distributed in a flower-like manner at both ends of the diversion channel, reflecting the typical characteristics of turbidite sedimentation in deep-water canyons [29,30]. In particular, the large-scale deep-water turbidite channel microfacies are the potential zones for future well deployment.
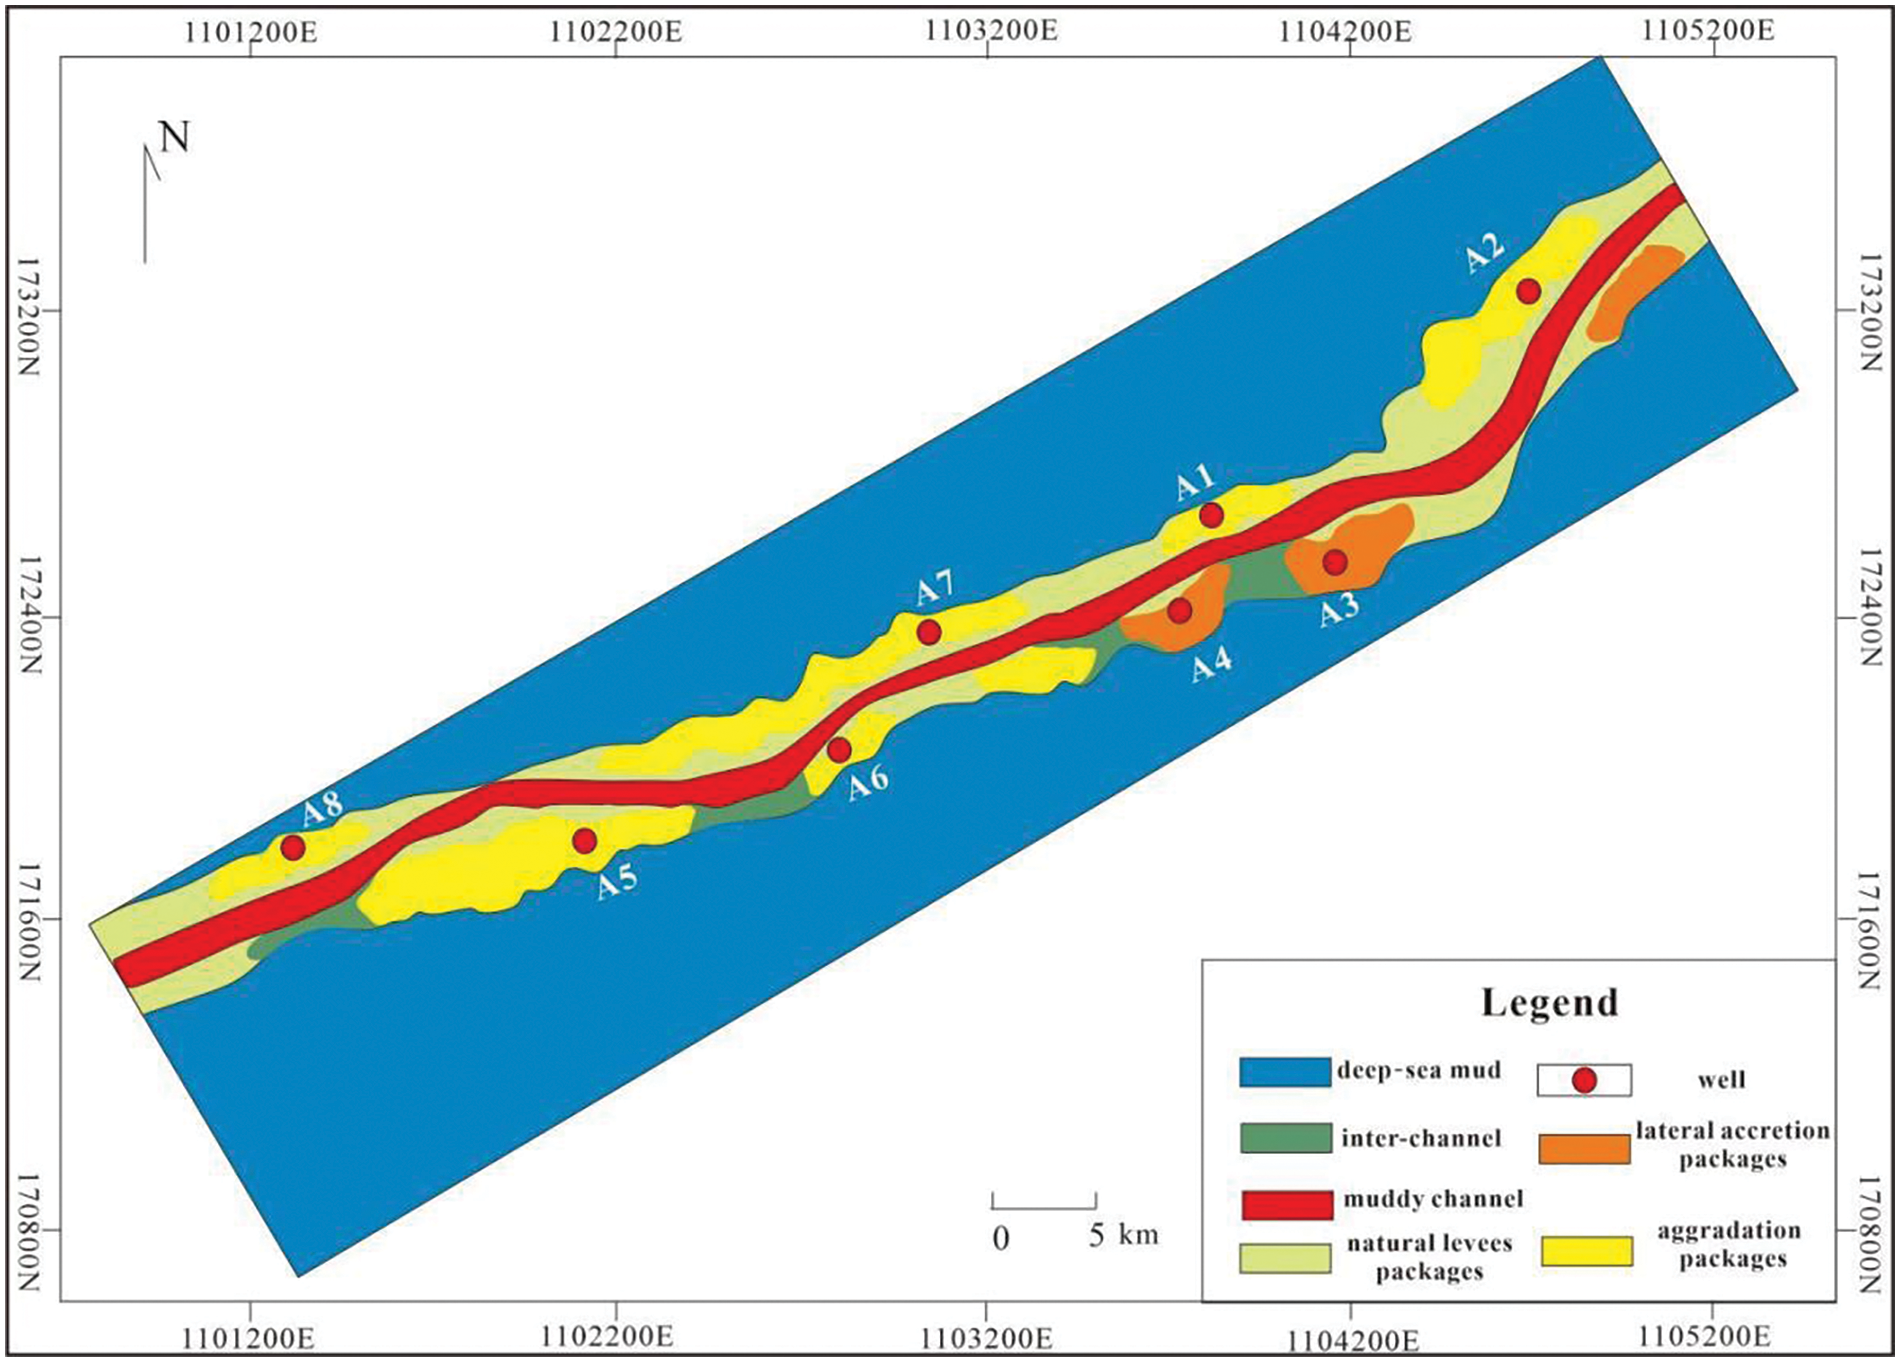
Figure 5: Sedimentary microfacies map of the Gas Layer Group Ⅰ lower of the Huangliu Formation in the Lingshui 17-2 Gas Field, Qiongdongnan Basin, South China Sea
3.3.3 Post-Drilling Validation
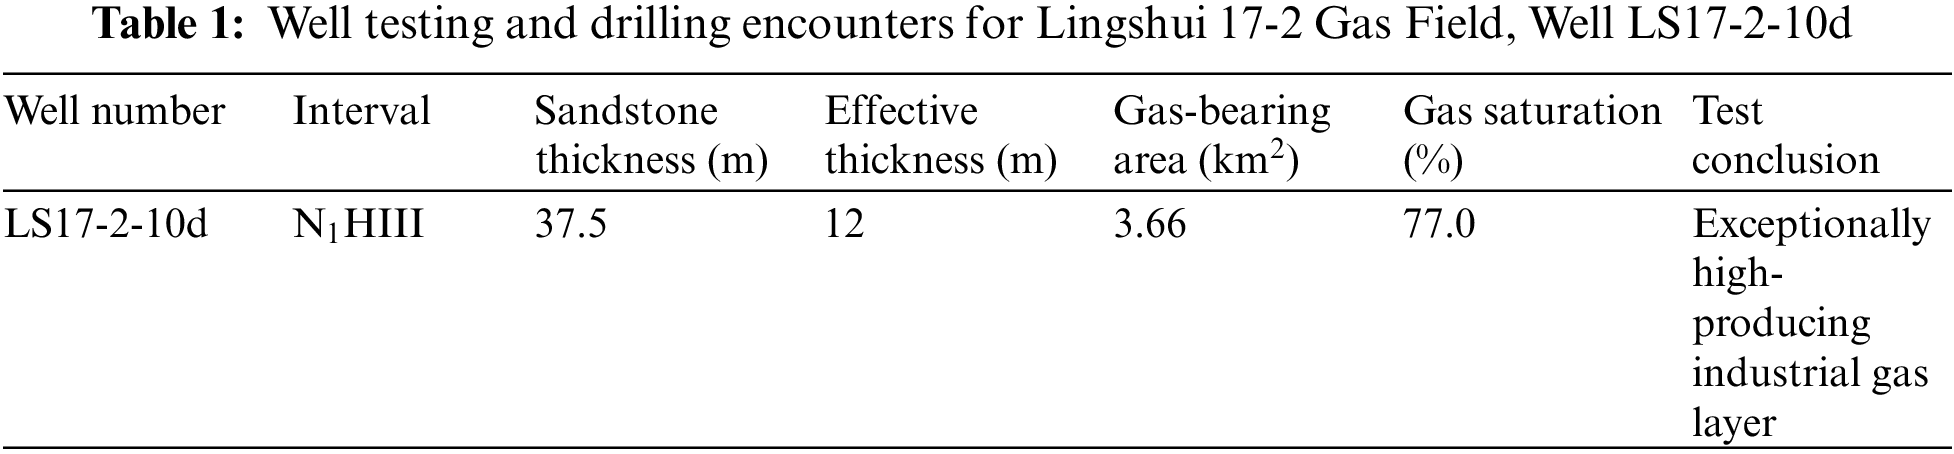
Based on the results of attribute prediction, a development well, LS17-2-10d, was drilled in the research area around the central canyon gas field and its surrounding areas to tap into unutilized reserves. This well underwent a well test analysis in the N1HIII interval using a post-pressure drawdown method (see Table 1), serving to verify the credibility of the prediction methods used. The N1HIII interval in well LS17-2-10d has a sandstone thickness of 37.5 m with an effective thickness of 12 m. The well testing concluded that it is an extraordinarily high-yielding industrial gas layer. Additionally, rock-electrical response analysis indicated that this well is situated in typical turbidite channel deposits of the Huangliu Formation. The successful design and execution of well LS17-2-10d thoroughly demonstrate the effectiveness of the employed methods for predicting deep-water turbidite channels.
To predict the channel sand body through seismic attributes, this study combines the advantages of the GRA-SVM method to establish a prediction model based on GRA-SVM for training and prediction. Through GRA, this study finds out that the RMS of the amplitude, the max peak, the instantaneous frequency, and the instantaneous phase have high main relational factors. It then selects seismic attributes through GRA as the input sample of the model and uses the Lingshui Depression as the target area for prediction. The results show that the GRA-SVM method performs well in the prediction of deep-water turbidite channels and has the advantage of low limitation for seismic attribute samples, as well as high accuracy of the prediction results. Therefore, this method is of great significance for the prediction of sand bodies in turbidite channels under complex geological conditions.
(1) The GRA model can optimize the relationship among seismic attributes well. The SVM model uses known geological data to form the training dataset and the test dataset. Therefore, by combining the known geological prior information, the GRA-SVM method can further improve the accuracy of reservoir prediction.
(2) The advantage of the GRA-SVM model in prediction lies in that it uses a variety of seismic attributes for nonlinear analysis, avoiding the premise of linear assumptions. Combining the similarities in geological body responses integrates the strengths of both, enhancing the accuracy of reservoir interpretation.
(3) Based on the prediction results of the GRA-SVM model, combined with the historical well analysis and geophysical characteristics, this study divides the sedimentary facies of the Huangliu Formation in the Lingshui Depression. The Lingshui Depression mainly develops thick-bedded restricted turbidite channel complexes with low-to-medium curvatures, where sand bodies are distributed in strips along the canyon. In particular, the sedimentary accretionary complex is relatively large and mainly distributed on the northeast side of the canyon, while the lateral accretionary complex develops in small sheets or mounds.
Acknowledgement: This study was supported by China National Petroleum Corporation-Peking University Basic Research Project and Sinopec Petroleum Exploration and Production Research Institute.
Funding Statement: The authors are grateful for Science and Technology Innovation Ability Cultivation Project of Hebei Provincial Planning for College and Middle School Students (22E50590D) and Priority Research Project of Langfang Education Sciences Planning (JCJY202130).
Author Contributions: The authors confirm contribution to the paper as follows: study conception and design: Jianghai Li, Haichen Li; data collection: Zhandong Li; analysis and interpretation of results: Jianghai Li, Zhandong Li, Haichen Li; draft manuscript preparation: Li Li, Haichen Li. All authors reviewed the results and approved the final version of the manuscript.
Availability of Data and Materials: The data that support the findings of this study are available from the corresponding author, upon reasonable request.
Conflicts of Interest: The authors declare that they have no conflicts of interest to report regarding the present study.
References
1. Q. H. Chen, M. Ceng, F. Q. Zhang, F. Leng, and H. H. Wei, “Identification of single channel in fluvial reservoir and its signification to the oilfield development,” (in ChinesePetroleum Geol. Rec. Eff., vol. 11, no. 3, pp. 13–15, Jun. 2004. [Google Scholar]
2. G. F. Li, Y. Yue, C. X. Guo, and H. Li, “Seismic attributes analysis based on model in thin interbedded layers and its application,” (in ChineseGeophy. Prospect. Petroleum, vol. 50, no. 2, pp. 144–149, Mar. 2011. [Google Scholar]
3. J. J. Zheng, Y. G. Wang, and H. J. Liu, “The application of instantaneous attenuation energy attribute in curvelet domain for reservoir identification,” (in ChineseGeophy. Prospect. Petroleum, vol. 53, no. 1, pp. 54–60, Jan. 2014. [Google Scholar]
4. H. X. Zhang, X. F. Wu, B. S. He, and M. Guo, “Time-synchroextracting of generalized S-transform and its application in fault identification,” J. Appl. Geophy., vol. 216, no. 3, pp. 105147, Sep. 2023. doi: 10.1016/j.jappgeo.2023.105147. [Google Scholar] [CrossRef]
5. L. Liu, Y. Wang, J. Wu, J. Wang, and C. Xi, “New optimized grey derivative models for grain production forecasting in China,” J. Agri. Sci., vol. 153, no. 2, pp. 257–269, Mar. 2014. doi: 10.1017/S002185961400001X. [Google Scholar] [CrossRef]
6. Z. D. Li, S. X. Zhang, J. Z. Xu, Y. K. Liu, and W. Li, “Improved modeling of channel prediction based on gray relational analysis and a support vector machine: a case study on the X pilot area in the Daqing oilfield in China,” J. Geophys. Eng., vol. 15, no. 4, pp. 1407–1418, Dec. 2017. doi: 10.1088/1742-2140/aaa2f0. [Google Scholar] [CrossRef]
7. W. Li et al., “A novel method for seismic-attribute optimization driven by forward modeling and machine learning in prediction of fluvial reservoirs,” Geoenergy Sci. Eng., vol. 227, pp. 211952, Aug. 2023. doi: 10.1016/j.geoen.2023.211952. [Google Scholar] [CrossRef]
8. W. Li et al., “Fusing multiple frequency-decomposed seismic attributes with machine learning for thickness prediction and sedimentary facies interpretation in fluvial reservoirs,” J. Petroleum Sci. Eng., vol. 177, pp. 1087–1102, Jun. 2019. doi: 10.1016/j.petrol.2019.03.017. [Google Scholar] [CrossRef]
9. L. Stright, J. Stewart, K. Campion, and S. Graham, “Geologic and seismic modeling of a coarse-grained deep-water channel reservoir analog (Black’s Beach, La Jolla, California),” Am. Assoc. Pet. Geol. Bull., vol. 98, no. 4, pp. 695–728, Apr. 2014. doi: 10.1306/09121312211. [Google Scholar] [CrossRef]
10. Q. Wang, J. Liu, X. Zhu, J. Liu, and Z. Liu, “The experiment study of frost heave characteristics and gray correlation analysis of graded crushed rock,” Cold Reg. Sci. Technol., vol. 126, no. 10, pp. 44–50, Jun. 2016. doi: 10.1016/j.coldregions.2016.03.003. [Google Scholar] [CrossRef]
11. X. L. Jia, H. Z. An, W. Fang, X. Q. Sun, and X. Huang, “How do correlations of crude oil prices co-move? A grey correlation-based wavelet perspective,” Energy Econ., vol. 49, no. 3, pp. 588–598, May 2015. doi: 10.1016/j.eneco.2015.03.008. [Google Scholar] [CrossRef]
12. M. Malvoni, M. G. D. Giorgi, and P. M. Congedo, “Data on support vector machines (SVM) model to forecast photovoltaic power,” Data Brief, vol. 9, no. 3, pp. 13–16, Dec. 2016. doi: 10.1016/j.dib.2016.08.024. [Google Scholar] [PubMed] [CrossRef]
13. A. Fatih, F. A. Mehmet, and G. James, “Developing new VO2max prediction models from maximal, submaximal and questionnaire variables using support vector machines combined with feature selection,” Comput. Biol. Med., vol. 79, pp. 182–192, Dec. 2016. doi: 10.1016/j.compbiomed.2016.10.018. [Google Scholar] [PubMed] [CrossRef]
14. H. B. Huang, R. X. Li, X. R. Huang, T. C. Lim, and W. P. Ding, “Identification of vehicle suspension shock absorber squeak and rattle noise based on wavelet packet transforms and a genetic algorithm-support vector machine,” Appl. Acoust., vol. 113, pp. 137–148, Dec. 2016. doi: 10.1016/j.apacoust.2016.06.016. [Google Scholar] [CrossRef]
15. M. Li, X. Y. Liu, and X. Liu, “Infrasound signal classification based on spectral entropy and support vector machine,” Appl. Acoust., vol. 113, no. 1, pp. 116–120, Dec. 2016. doi: 10.1016/j.apacoust.2016.06.019. [Google Scholar] [CrossRef]
16. H. M. Vahid and H. Javad, “New Hermite orthogonal polynomial kernel and combined kernels in support vector machine classifier,” Pattern Recognit., vol. 60, no. 2, pp. 921–935, Dec. 2016. doi: 10.1016/j.patcog.2016.07.004. [Google Scholar] [CrossRef]
17. M.Ö. Sahin, D. Krücker, and I. A. Melzer-Pellmann, “Performance and optimization of support vector machines in high-energy physics classification problems,” Nuclear Inst. Meth. Phy. Res. Sec. A: Accel., Spect., Detect. Assoc. Equip., vol. 838, no. 3, pp. 137–146, Dec. 2016. doi: 10.1016/j.nima.2016.09.017. [Google Scholar] [CrossRef]
18. M. Ma, G. J. Chen, G. C. Zhang, M. J. J. Rahman, and X. F. Ma, “Geochemistry and provenance of Oligocene to middle Miocene sandstones in the Qiongdongnan Basin, Northern South China Sea,” Mar. Geol., vol. 447, no. 11, pp. 106794, May 2022. doi: 10.1016/j.margeo.2022.106794. [Google Scholar] [CrossRef]
19. F. E. Maesano and C. D’Ambrogi, “Vel-IO 3D: A tool for 3D velocity model construction, optimization and time-depth conversion in 3D geological modeling workflow,” Comput. Geosci., vol. 99, no. 1, pp. 171–182, Feb. 2017. doi: 10.1016/j.cageo.2016.11.013. [Google Scholar] [CrossRef]
20. F. Anifowose, A. Abdulraheem, and A. Al-Shuhail, “A parametric study of machine learning techniques in petroleum reservoir permeability prediction by integrating seismic attributes and wireline data,” J. Pet. Sci. Eng., vol. 176, no. 4, pp. 762– 774, May 2019. doi: 10.1016/j.petrol.2019.01.110. [Google Scholar] [CrossRef]
21. W. Y. Sun, S. Y. Liu, Y. S. Li, and F. Zhou, “Research of the depth domain inversion of the seismic data: A case of depth domain inversion in Qiongdongnan Basin,” (in ChineseProg. Geophy., vol. 32, no. 4, pp. 1643–1649, Aug. 2017. doi: 10.6038/pg20170431. [Google Scholar] [CrossRef]
22. J. J. Zhang, X. Y. Yin, G. Z. Zhang, Y. P. Gu, and X. G. Fan, “Prediction method of physical parameters based on linearized rock physics inversion,” Pet. Explor. Dev., vol. 47, no. 1, pp. 59–67, Feb. 2020. doi: 10.1016/S1876-3804(20)60005-2. [Google Scholar] [CrossRef]
23. Y. J. Pan, D. W. Li, and K. A. Yang, “Comparison between the requirements of multi-well constrained conditions in deterministic inversion and stochastic inversion,” (in ChineseGeophy. Prospect. Petroleum, vol. 50, no. 4, pp. 345–349, Apr. 2011. doi: 10.3969/j.issn.1000-1441.2011.04.005. [Google Scholar] [CrossRef]
24. H. M. Li, “Reservoir characteristics and controlling factors of Mesozoic granite buried-hill in Songnan Low uplift, Qiongdongnan Basin,” Ph.D. dissertation, Jilin University, Changchun, China, 2022 (In Chinese). [Google Scholar]
25. D. L. Yue et al., “Fused spectral-decomposition seismic attributes and forward seismic modelling to predict sand bodies in meandering fluvial reservoirs,” Mar. Pet. Geol., vol. 99, pp. 27–44, Jan. 2019. doi: 10.1016/j.marpetgeo.2018.09.031. [Google Scholar] [CrossRef]
26. F. Felletti et al., “The tachrift project: Sedimentary architecture of turbidite channel-levee deposits (Tachrift Turbidite System, Taza-Guercif Basin, Tortonian, NE Morocco),” Rendiconti Online Della Societa Geologica Italiana, vol. 59, pp. 80–88, Mar. 2023. doi: 10.3301/ROL.2023.13. [Google Scholar] [CrossRef]
27. L. Liu et al., “Sedimentary architecture models of deepwater turbidite channel systems in the Niger Delta continental slope, West Africa,” Pet. Sci., vol. 10, no. 2, pp. 139–148, May 2013. doi: 10.1007/s12182-013-0261-x. [Google Scholar] [CrossRef]
28. Z. Y. Yan, W. L. Jia, J. P. Li, T. Y. Zhang, D. F. Zhang and J. F. Peng, “Source-to-sink system analysis of the meishan formation turbidite fans in the northwest of the central depression of the Qiongdongnan Basin, Southern China Sea,” in Pro. Inter. Field Explorati. Develop. Conf., IFEDC 2023, Singapore, Springer, 2023, pp. 648–666. [Google Scholar]
29. C. Li, B. Kang, X. Zhang, Y. Gao, and G. Chen, “Quantitative characterization of sand body connectivity in deepwater turbidite channel reservoir,” (in ChineseJ. Southwest Petroleum Univ., Sci. Technol. Ed., vol. 44, no. 6, pp. 10–20, Aug. 2020. doi: 10.11885/j.issn.1674-5086.2020.08.19.02. [Google Scholar] [CrossRef]
30. C. Fu et al., “Types and sedimentary genesis of barriers and interlayers in the composite turbidite sand bodies of a deep-water canyon: A case study of the Central Canyon in the Qiongdongnan Basin,” Nat. Gas Ind. B, vol. 10, no. 5, pp. 511–521, Oct. 2023. doi: 10.1016/j.ngib.2023.09.006. [Google Scholar] [CrossRef]
Cite This Article
 Copyright © 2024 The Author(s). Published by Tech Science Press.
This work is licensed under a Creative Commons Attribution 4.0 International License , which permits unrestricted use, distribution, and reproduction in any medium, provided the original work is properly cited.
 Downloads
 Citation Tools