
 Submit a Paper
 Propose a Special lssue
 Open Access
ARTICLE

Two-Stage Planning of Distributed Power Supply and Energy Storage Capacity Considering Hierarchical Partition Control of Distribution Network with Source-Load-Storage
1 Key Laboratory of Modern Power System Simulation and Control & Renewable Energy Technology, Ministry of Education (Northeast Electric Power University), Jilin, 132012, China
2 State Grid Jibei Electric Power Co., Ltd., Electric Power Research Institute, Beijing, 100045, China
* Corresponding Author: Cuiping Li. Email:
Energy Engineering 2024, 121(9), 2389-2408. https://doi.org/10.32604/ee.2024.050239
Received 31 January 2024; Accepted 18 March 2024; Issue published 19 August 2024
 View Full Text
 Download PDF
Abstract
Aiming at the consumption problems caused by the high proportion of renewable energy being connected to the distribution network, it also aims to improve the power supply reliability of the power system and reduce the operating costs of the power system. This paper proposes a two-stage planning method for distributed generation and energy storage systems that considers the hierarchical partitioning of source-storage-load. Firstly, an electrical distance structural index that comprehensively considers active power output and reactive power output is proposed to divide the distributed generation voltage regulation domain and determine the access location and number of distributed power sources. Secondly, a two-stage planning is carried out based on the zoning results. In the phase 1 distribution network-zoning optimization layer, the network loss is minimized so that the node voltage in the area does not exceed the limit, and the distributed generation configuration results are initially determined; in phase 2, the partition-node optimization layer is planned with the goal of economic optimization, and the distance-based improved ant lion algorithm is used to solve the problem to obtain the optimal distributed generation and energy storage system configuration. Finally, the IEEE33 node system was used for simulation. The results showed that the voltage quality was significantly improved after optimization, and the overall revenue increased by about 20.6%, verifying the effectiveness of the two-stage planning.Keywords
Nomenclature
| Variation of active power injected into system nodes | |
| Variation of reactive power injected into system nodes | |
| Node voltage amplitude change | |
| Node voltage phase angle change | |
| Jacobian matrix | |
| Jacobian inverse matrix | |
| Active power-voltage phase angle sensitivity matrix | |
| Reactive power-voltage phase angle sensitivity matrix | |
| Active power-voltage amplitude sensitivity matrix | |
| Reactive power-voltage amplitude sensitivity matrix | |
| The ratio of the voltage change produced by itself and node | |
| The ratio of the voltage change produced by itself and node | |
| The electrical distance between node | |
| Weights | |
| Wire resistance between nodes | |
| The voltage of node | |
| Active power of node | |
| Power factor angle | |
| Reactive power of node | |
| The maximum possible output of the wind turbine at time | |
| The maximum possible output of photovoltaic at time | |
| Admittance parameter between node | |
| Phase angle difference between node | |
| The upper and lower limits of the voltage amplitude of each node | |
| The upper and lower voltage limits of generator node | |
| Upper and lower limits of active power of generator node | |
| Upper and lower limits of reactive power of generator node | |
| Power generation costs | |
| Initial investment cost of energy storage system | |
| Operation and maintenance costs | |
| Battery fixed investment cost | |
| Generator fuel cost for power generation | |
| Generator cost factor | |
| Active output of node | |
| Cost coefficient per unit power of battery energy storage | |
| Cost coefficient of battery energy storage unit capacity | |
| Rated charging and discharging power of battery energy storage | |
| Rated capacity of battery energy storage | |
| Annual operation and maintenance cost coefficient of battery energy storage unit charging/discharging power | |
| The number of configurations of the i-th distributed power supply | |
| The installed cost of the i-th distributed power supply | |
| Discount rate | |
| The production life of the i-th distributed power supply | |
| Proceeds from the sale of scenery | |
| Low storage and high yield | |
| Wind and photovoltaic capacity | |
| Charging and discharging power of energy storage | |
| Grid-connected electricity prices for wind power and photovoltaics | |
| Energy storage state of charge lower limit | |
| Upper limit of energy storage state of charge | |
| Energy storage system power lower limit | |
| Energy storage system power upper limit | |
| The position of the ant in the i-th dimension in the iteration | |
| The minimum value of the i-th random walk | |
| The maximum value of the i-th random walk | |
| The minimum value of all dimensions of the i-th ant | |
| The minimum value of the i-th dimension random walk at the t-th iteration | |
| The maximum value of the i-th dimension random walk at the t-th iteration | |
| The position of the j-th antlion in the i-th iteration |
With the proposal of the energy goal of “2030 carbon peak and 2060 carbon neutrality” [1], the distribution network is facing new demands to adapt to the access of a higher proportion of distributed renewable power sources [2]. The energy storage system connects resources on the three sides of “source, grid, and load” with its ability to transfer electrical energy in time and space and to support power in two directions [3]. It is of great significance for building a new power system and promoting the realization of the dual-carbon strategic goal [4]. However, energy storage system has the dual attributes of load and power supply [5], and the reasonable configuration is directly related to the cost and benefit value [6]. Therefore, to make the distribution network operate more economically, safely, and reliably, and to take advantage of the energy storage system, it is necessary to carry out a two-stage optimization plan for distributed generation and energy storage system that takes into account site selection and capacity optimization and optimal dispatch.
The high proportion of distributed power supply access makes the traditional power grid planning method no longer applicable. How to reasonably plan distributed generation and energy storage system to make the power grid operation more reliable is the focus of current research [7]. Literature [8] proposes an evaluation index for system peaking adaptability, realizes energy storage capacity optimization through analytical methods, optimizes the configuration plan to reflect the characteristics of new energy, and meets the demand for energy storage location and capacity in distribution networks containing high penetration rates of new energy; Literature [9,10] proposes a wind, solar and storage joint planning method that takes into account the operation risks of the distribution network to solve the installation location and capacity of the energy storage system; Literature [11] proposes a new approach to determine the optimal location and capacity of microgrid systems for reducing non-service energy. And taking into account both reliability and investment costs, the proposed model also determines the most appropriate energy storage access capacity. Literature [12] proposes a distributed power grid optimization method using double-layer optimization design, but it mainly focused on load-side demand and did not consider the impact of distributed energy itself on the distribution network. The above literature mainly considers the coordinated planning of distributed power sources and energy storage from an economic point of view.
Literature [13] proposes a joint planning model of distributed power sources and energy storage in active distribution networks to increase the penetration rate of renewable energy in distribution networks. An improved binary particle swarm optimization algorithm based on chaos optimization was developed to solve the model and achieve optimal joint planning through alternating iterations between two levels. Using economic benefits, voltage deviation, penetration rate and wind and solar absorption as indicators, a multi-objective programming model was established and an improved multi-objective particle swarm optimization algorithm was used for verification. Literature [14] considers a two-layer model of electric-hydrogen hybrid energy storage system considering demand side response. The upper-layer model aims at minimizing net load fluctuations, maximizing user satisfaction with electricity purchase costs and comfort with electricity after considering demand side response, and derives the optimal time-of-use electricity price setting strategy based on the electricity price elasticity matrix model. The lower-layer model is based on the time-of-use electricity price strategy solved by the upper-layer model, targeting the minimum life cycle cost of the electricity hydrogen hybrid-energy storage system, the voltage fluctuation of the active distribution network, and the net load fluctuation after considering the demand side response and being connected to the electricity hydrogen hybrid-energy storage system. Through optimal planning of electricity hydrogen hybrid-energy storage system, the best balance between investment economy, active distribution network load stability and voltage quality can be achieved. Literature [15] uses a two-stage model to select and size battery energy storage systems in distribution networks. Priority is given in the first phase to meeting the flexibility needs of distribution system operators by managing congestion or supply interruptions in local networks. In the second stage, the battery energy storage system is optimized and configured to increase system revenue by providing frequency suppression backup for normal system operation, and an IEEE33 node system is used for verification.
Although the above-mentioned literature considers different focuses in the dual-layer planning of distributed generation and energy storage system, the objective functions selected are also different, mainly from the perspective of coordination of technical indicators (voltage, network loss, etc.) and economic indicators. Storage collaborative planning is used to improve the comprehensive carrying capacity of the power grid and maintain safe, efficient and stable operation of the power grid.
Due to the decentralized nature of the distributed power system, processing the distribution network system as a whole is very time-consuming in terms of calculation time. If there are too many nodes, the optimization efficiency may be low. Therefore, you can consider introducing the idea of partitioning and dividing the dispersed distributed generation into several subnets for regional voltage management. Literature [16] proposes a cluster comprehensive performance index that combines the source-storage matching degree index and the modularity index, and uses the synchronous alternating direction multiplier algorithm to solve it, and realizes the distributed optimal dispatch of the distribution network through cluster control; Literature [17] proposes a new network partitioning method based on community detection algorithm to achieve partitioned voltage control by controlling response time, and proposes optimal reactive and active power control strategies for voltage control in each cluster; Literature [18] uses an improved Fast-Newman algorithm to perform double-layer partitioning for reactive power compensation and active power compensation, making the voltage regulation results more accurate and making the combination of reactive power compensation and active power reduction more reasonable. Most of the above literature uses the method of partitioning to solve the voltage over-limit problem. The above existing distribution network partitioning methods mainly consider electrical distance indicators. The research focuses on distribution network voltage control, mainly focusing on voltage over-limit and new energy consumption, while less consideration is given to the coordinated dispatch of active power in the distribution network and the power complementarity of source and load.
Based on the above research, the innovation points of this article are as follows:
1. In view of the problem that distributed power sources are dispersed and difficult to control uniformly, this paper proposes an electrical distance structural index based on active-reactive voltage sensitivity. Not only does the partitioning result take into account the network topology, but also the impact of active/reactive power on voltage regulation sensitivity, giving full play to the power complementary characteristics of source and load;
2. In the two-stage planning of distributed generation and energy storage system, the characteristics of the post-partition distribution network are considered, and the overall optimization problem of distributed generation and energy storage system is turned into a sub-problem based on regions based on the principle that the node voltage does not exceed the limit. It reduces the impact on the optimal solution when the capacity and location change, speeds up the solution speed, and during the solution process not only keeps the node voltage from exceeding the limit, reduces the network power loss, but also optimizes the economics of the energy storage system configuration.
This paper first divides the voltage regulation areas of each distributed power supply based on the electrical distance structural index based on active-reactive voltage sensitivity. Secondly, a two-stage planning is carried out based on the partition, with minimum network loss and optimal economy. The goal is to construct a two-stage planning model and use the distance-based improved ant lion algorithm to solve it. Finally, it is solved based on the IEEE33 node example to verify the effectiveness of the two-stage planning.
2 Distribution Network Hierarchical Zoning Strategy Considering Source-Storage-Load
When a high proportion of distributed power sources are connected to the distribution network, the operating status of the distribution network will be more volatile and uncertain compared with the operating status of the traditional distribution network [19,20]. It is easy to cause reverse flow of power and cause voltage to exceed the limit. Therefore, according to the degree of impact on the voltage of each node when the distributed generation output changes, this paper proposes an electrical distance structural index that comprehensively considers active and reactive output, reasonably divides the distributed generation voltage regulation domain and determines the location and number of distributed power supply connections.
2.1 Electrical Distance Structural Index Based on Active-Reactive Voltage Sensitivity
By calculating the Newton-Raphson power flow correction equation [21] in polar coordinate form, the voltage sensitivity matrix related to active and reactive power can be obtained, the equation is:
Perform the inverse transformation of the Jacobian matrix to obtain the sensitivity matrix:
According to formula (2), the change of any node voltage has a certain relationship with the change of the injected active power and reactive power, which can be expressed as:
The sensitivity matrix between power and voltage amplitude in distribution networks often defines an important indicator of electrical distance. In this article, the electrical distance structural index comprehensively considers the influence of active and reactive power. The electrical distances
In the formula:
This paper constructs an electrical distance structural index that comprehensively considers active and reactive power, expressed as:
2.2 Method for Dividing Voltage Regulation Domains Based on Structural Indicators
Taking the maximum structural index as the goal of regional division, the distribution grid area is divided according to the three stages of initialization, node merging and area merging. The specific division process is as shown in the Fig. 1.
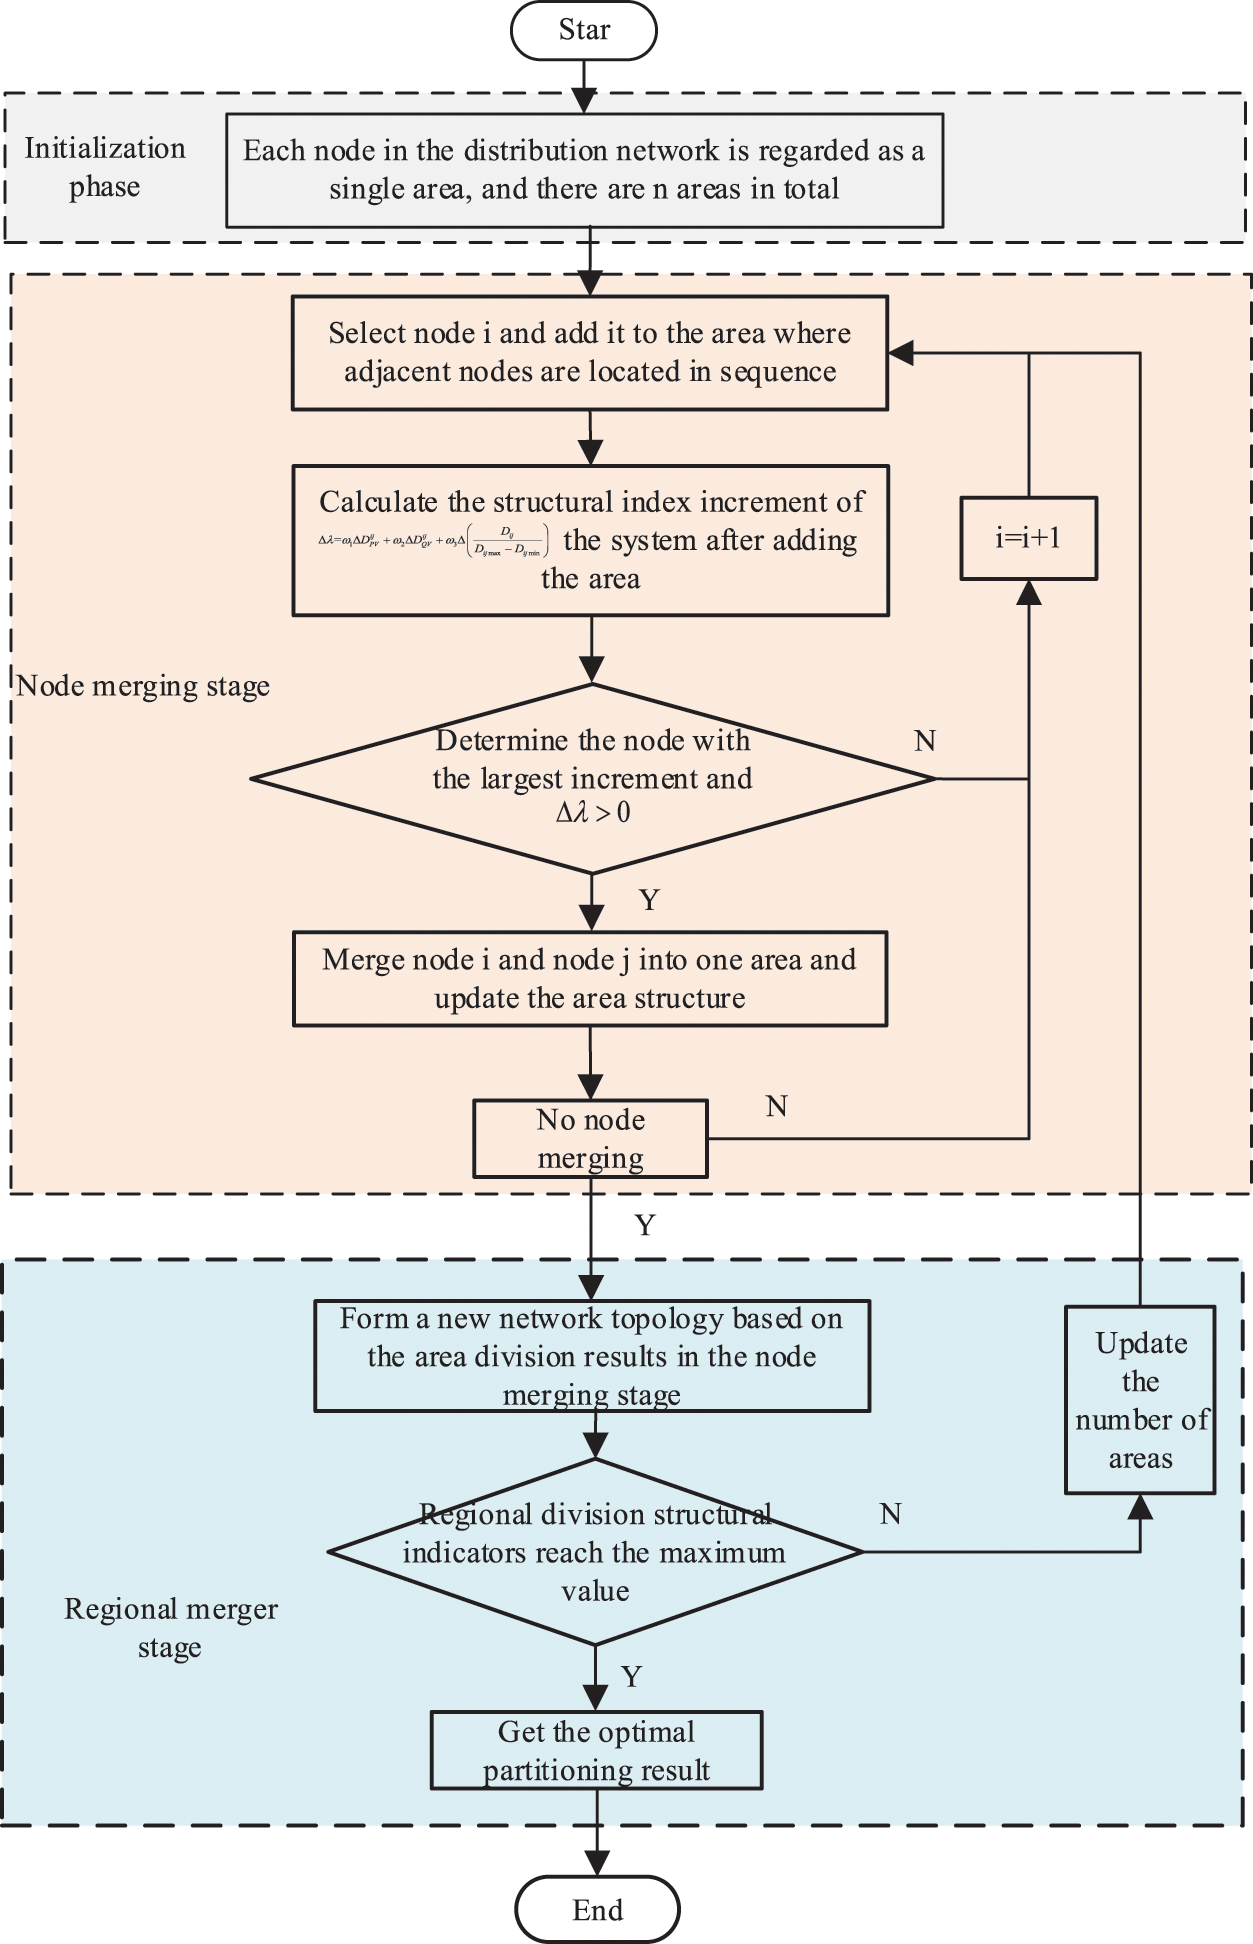
Figure 1: Regional division flow chart
First, in the initialization stage, a single node in the distribution network is regarded as a region, with a total of n regions;
Secondly, in the node merging stage, the selection node i is added to the area where the adjacent nodes are located in turn, and the node with the largest increase is calculated according to the system’s structural index increment formula, and then the node i is merged with the area and the regional structure is updated;
Finally, in the area merging stage, a new network topology is formed based on the area division results in the node merging stage. When the structural index of area division reaches the maximum, the optimal division result is obtained.
3 Distributed Power Supply-Energy Storage Two-Stage Planning Model and Solution Method
This paper carries out a two-stage planning model of distributed generation and energy storage system based on the hierarchical partitioning results obtained in the first part. The overall framework diagram is shown in Fig. 2.
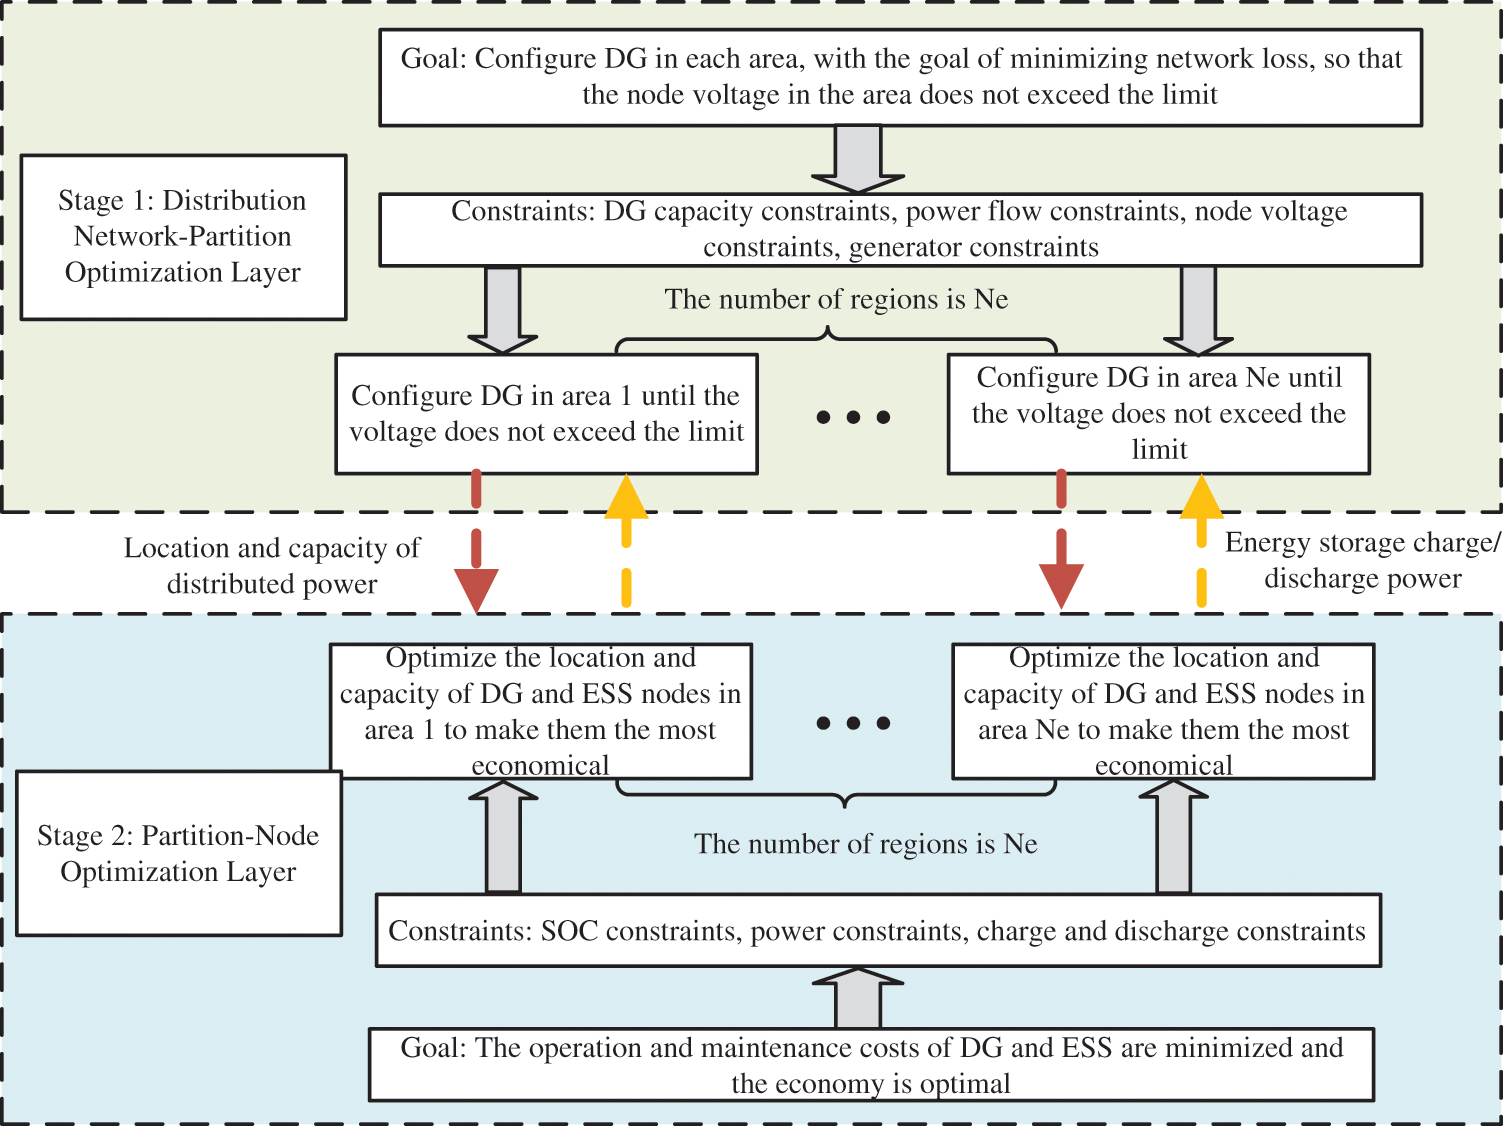
Figure 2: Overall flow chart of two-stage planning
3.1 Distributed Power Supply-Energy Storage Two-Stage Planning Model
The stage 1 planning model is the distribution network-zoning optimization layer, and its optimization results are used as the input of the next stage planning model. This part comprehensively considers the distributed power supply configuration in each area, with the goal of minimizing network loss, so that the node voltage in each area does not exceed the limit, and obtains the preliminary distributed generation capacity configuration. The first stage planning model construction method is as follows:
(1) Objective function
(2) Restrictive condition
a) Photovoltaic and wind power constraints
b) Power flow constraints
c) Node voltage constraints
d) Generator constraints
The stage 2 planning model is a partition-node optimization area, which mainly considers the economical operation of the distribution network. This article mainly considers two parts, namely, the minimum operating cost and the maximum benefit of distributed generation and energy storage system. The operating costs are divided into power generation costs, energy storage initial investment costs, operation and maintenance costs, and battery fixed investment costs; the income is mainly based on charging and discharging based on load demand and grid time-of-use electricity prices to obtain energy storage’s low storage and high discharge income and proceeds from the sale of scenery.
(1) Objective function
a) Operating costs
b) Operating income
(2) Restrictive condition
a) SOC constraints
b) Energy storage energy balance constraints
c) Energy storage charge and discharge constraints
3.2 Two-Stage Planning Solution Method
3.2.1 Two-Stage Planning Optimization Method
First, the distribution network is divided into different areas using structural indicators based on electrical distance, and the initial values of distributed power sources and loads connected to the system are set. The power flow is calculated through MATPOWER to obtain the voltage
Next, enter the two-stage planning part. In the first stage of planning, the network loss is minimized as the goal, so that the node voltage does not exceed the limit and
Based on the results obtained from the economic model in the second stage, according to the energy storage charge and discharge constraints and SOC constraints, the results obtained in the second stage and the first stage are mutually variable and target quantities, and the configuration results obtained in the first stage are corrected. After each iteration, a power flow calculation is performed to obtain the system voltage
3.2.2 Two-Stage Programming Method
This paper uses the distance-based improved ant lion algorithm to solve the problem. The random walk of ants around the ant lion walks in each dimension, ensuring the randomness of each dimension. However, the random walk will be affected by the trap set by the ant lion, so the algorithm also needs to simulate the trap of the ant lion. In this process, it is mainly controlled by the trap range of the ant lion. The search space of the ant can be expressed as:
The ants will be affected by the trap during the random walk, that is, the position of the ant lion and the size of the trap. The formula is as follows:
As the number of iterations increases, the ants gradually approach the center of the ant lion trap. Therefore, reducing the spatial range can effectively improve the convergence speed, and conduct concentrated searches near the high-quality solution range to obtain the optimal solution.
In the traditional ant lion algorithm, ants walk randomly. The distance between ants and ant lions is not considered, which will cause the algorithm to fall into a local optimal solution prematurely. Therefore, we should consider adding a distance variable so that each ant lion is surrounded by ants, and ant lions with low fitness are also surrounded by ants for random walks. Therefore, ant lions are selected in two situations during the random walk.
The first situation is that the ant is within the trap range of an ant lion. At this time, the distance factor should be added. The ant lion closest to the ant is the current optimal ant lion, and it also has the greatest ability to capture ants. If the optimal solution randomly walks to
The second case is that the ant is not within the trap range of any ant lion. In this case, there is no need to consider the distance factor. The final random walking position of the ant is:
The specific process of the distance-based antlion optimization algorithm is shown in Fig. 3.
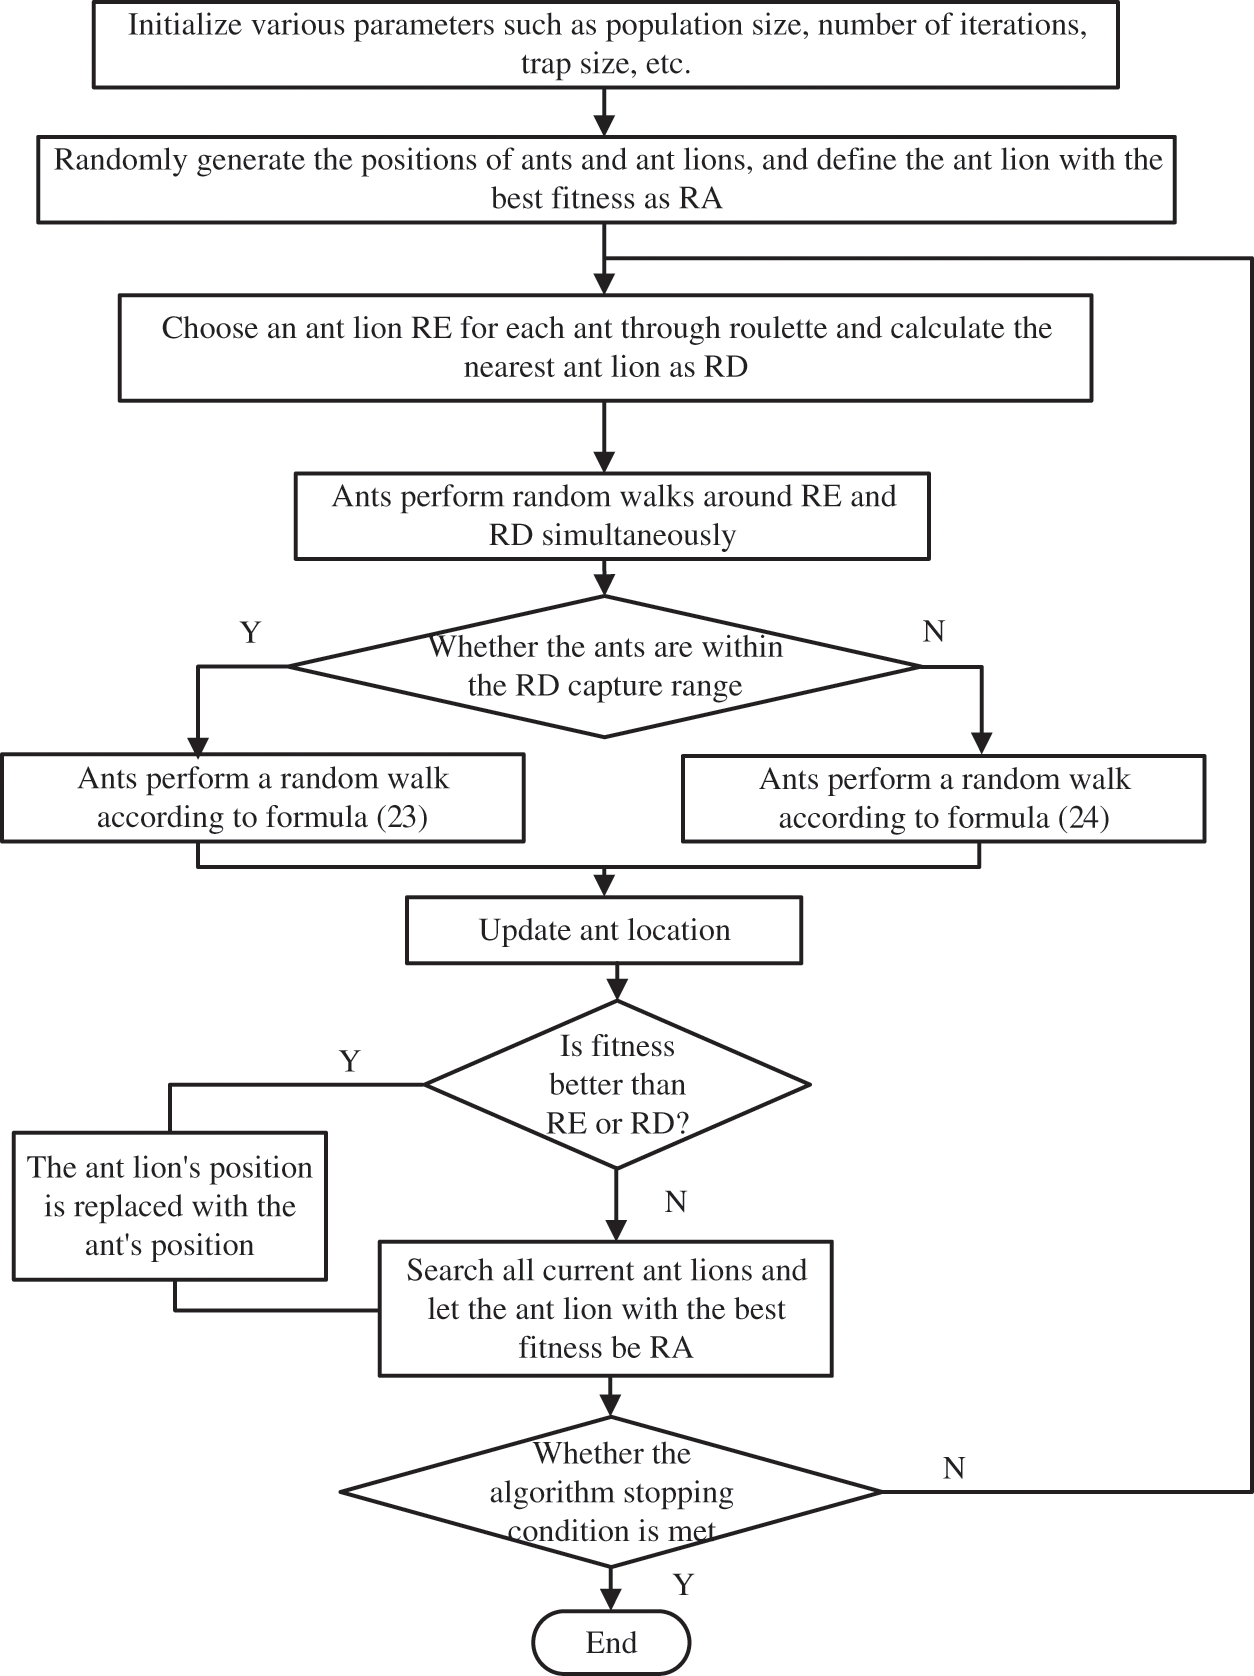
Figure 3: Distance-based antlion optimization algorithm process
4.1 Calculation Example Parameter Description
In order to verify the reliability of the two-stage planning model, the IEEE33 node system is used as the test system [22], and node 1 is the balance node. When performing power flow calculation, the system’s base voltage is 12.66 kV, the system’s base capacity is 10 MVA, the power factor is set to 0.95, and the convergence accuracy is
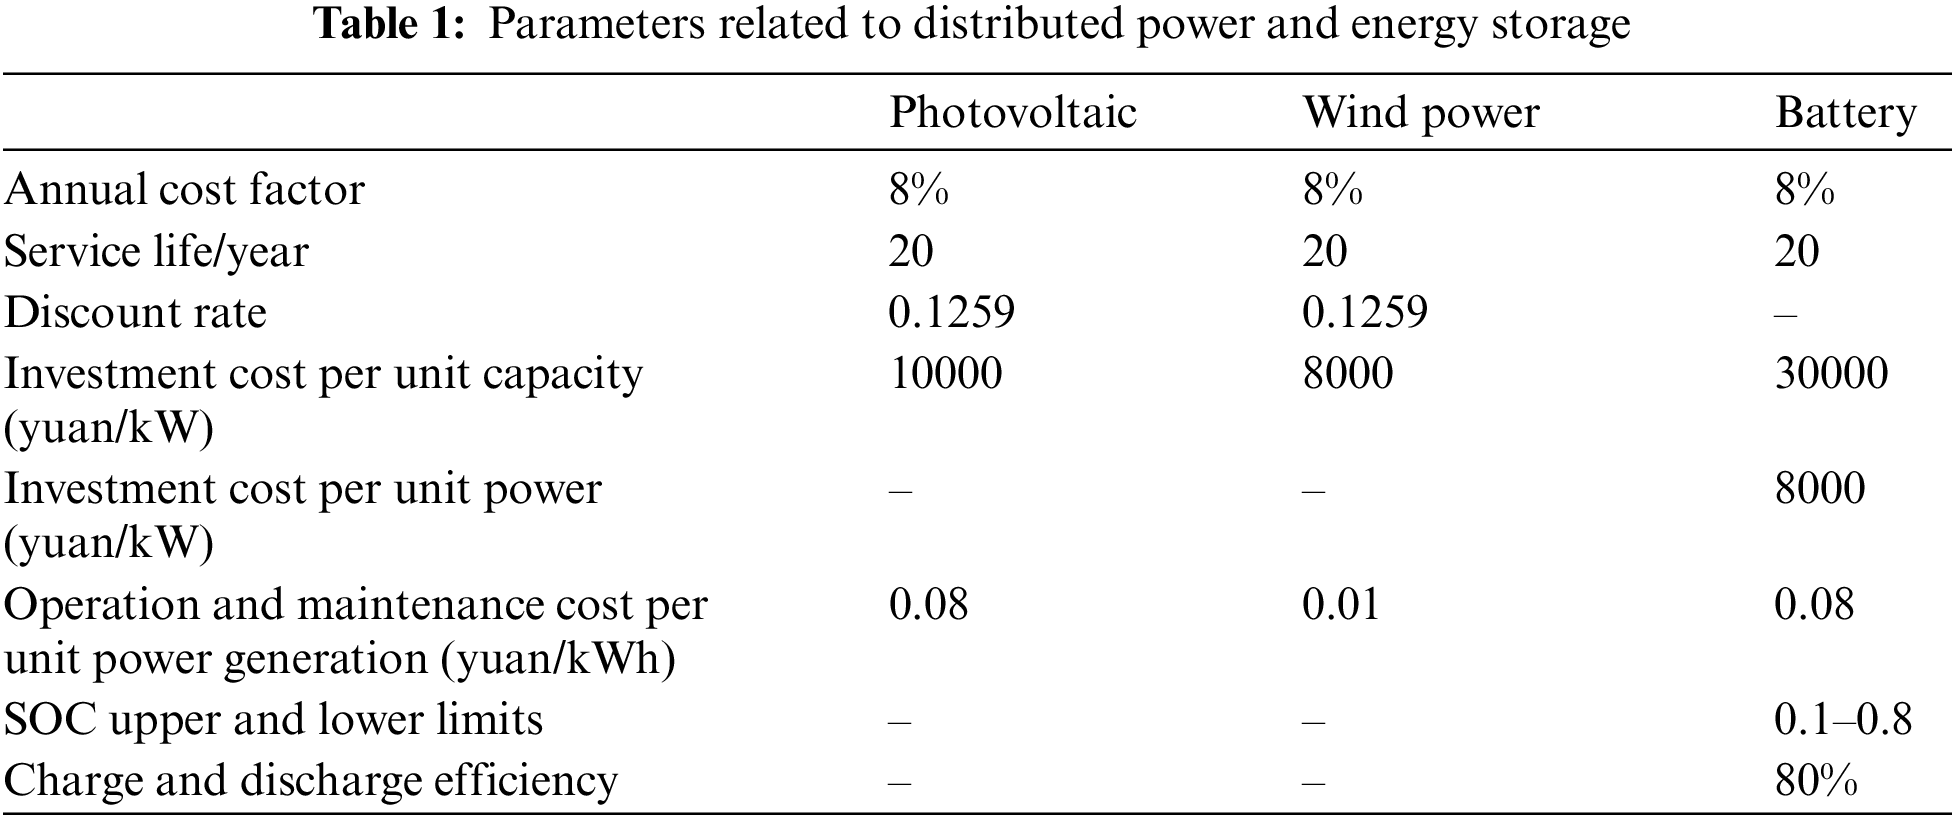
In this example, the distributed power photovoltaic simulation is based on a normal distribution with a mean of 0.5 and a standard deviation of 0.1 [23,24]. The node voltage constraint is controlled between 0.95 and 1.07 p.u. The total load distribution throughout the day is shown in Fig. 4. The economic parameters related to distributed power supply and energy storage are shown in Table 1.
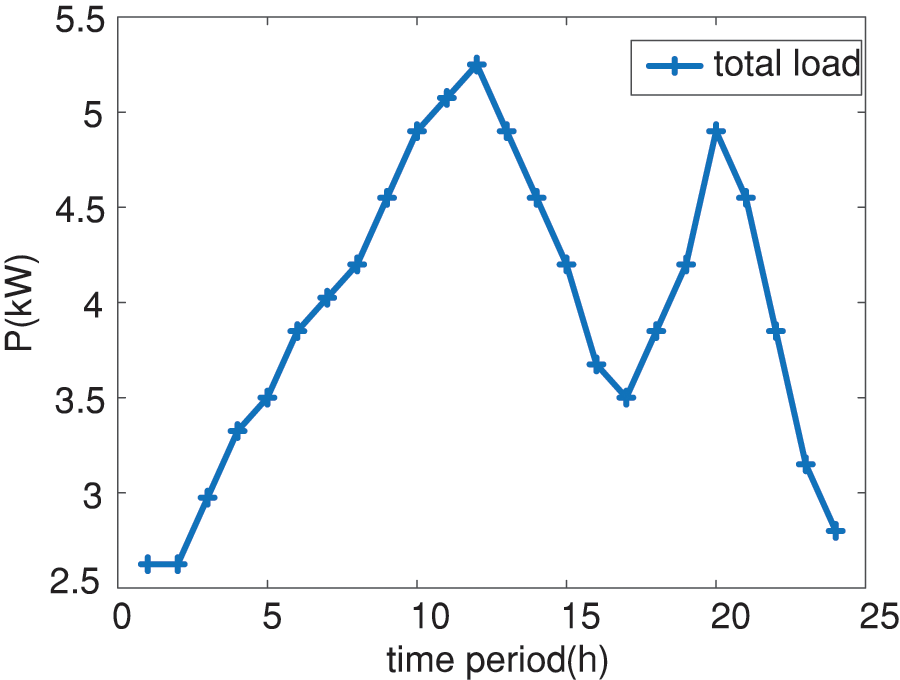
Figure 4: System total load output curve
To verify the effectiveness of the two-stage planning scheme considering the hierarchical partitioning proposed in this article, the following three planning schemes are constructed, and the configuration results of different schemes are compared and analyzed.
Option 1: Use the original single-layer planning model, with the voltage not exceeding the limit as the planning goal, and determine the access locations of distributed generation and energy storage system based on voltage sensitivity. Then plan the access capacity of each node.
Option 2: Adopt a two-stage planning model. Stage 1 aims to minimize network loss and optimize the access location and capacity of distributed generation. Stage 2 aims to optimize economic efficiency and optimize the location and capacity of energy storage system and distributed generation.
Option 3: Obtain the zoning results based on the structural indicators of electrical distance, and conduct two-stage planning based on the zoning results.
4.2 Two-Stage Planning Results and Analysis
4.2.1 Typical Scenario Analysis
First, 1,000 time-series scenery scenes are generated. Both wind power and photovoltaics conform to the normal distribution [25]. The uncertainty of wind power output is realized by simulating the uncertainty of wind speed, which satisfies the Weibull distribution [26]. Light intensity at different times throughout the day follows a Beta distribution. Then the Latin hypercube sampling method is used for sampling [27]. The scenery output after sampling is shown in Fig. 5.
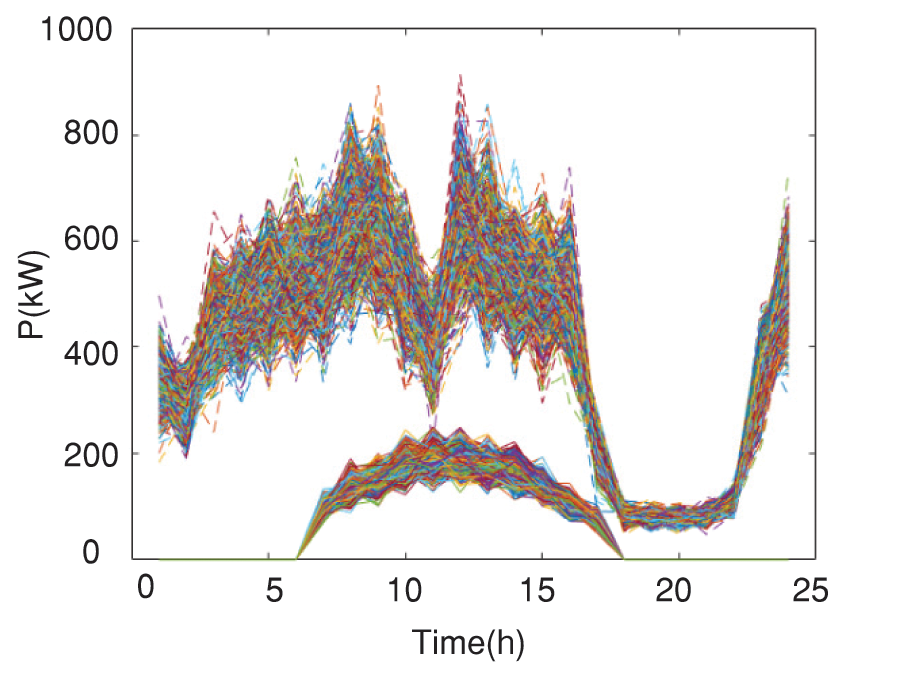
Figure 5: Scenery output scene after sampling
There are a total of 1,000 scenes after sampling. The scene reduction method is used to reduce these scenes. Determine a subset of the initial set of scenarios. And redistribute the scene probability to it, so that a certain probability distance between the probability distribution of the retained scene and the probability of the initial scene set is the shortest, thereby reducing the probability of small probability and adding it to the scene with the closest probability distance to its scene, finally get a typical scenario. And the 10 scenes with the highest probability of occurrence are retained, as shown in Fig. 6. These 10 scenes all ensure that the Euclidean distance from the original scene is the smallest and within the upper and lower limits of the extreme scene. They are also the scenes to be used in the two-stage planning.
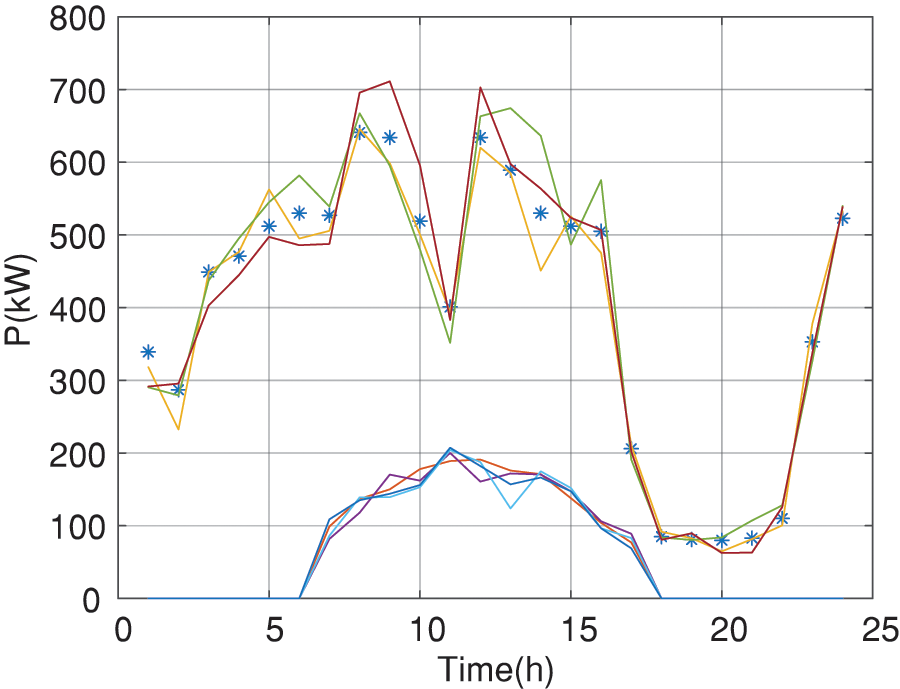
Figure 6: Scenery output scene after scene reduction
4.2.2 Comparative Analysis of Two-Stage Planning Results
a) Node voltage analysis
The distribution network is divided into regions based on the comprehensive index of electrical distance. The division structure is shown in Table 2 and Fig. 7.
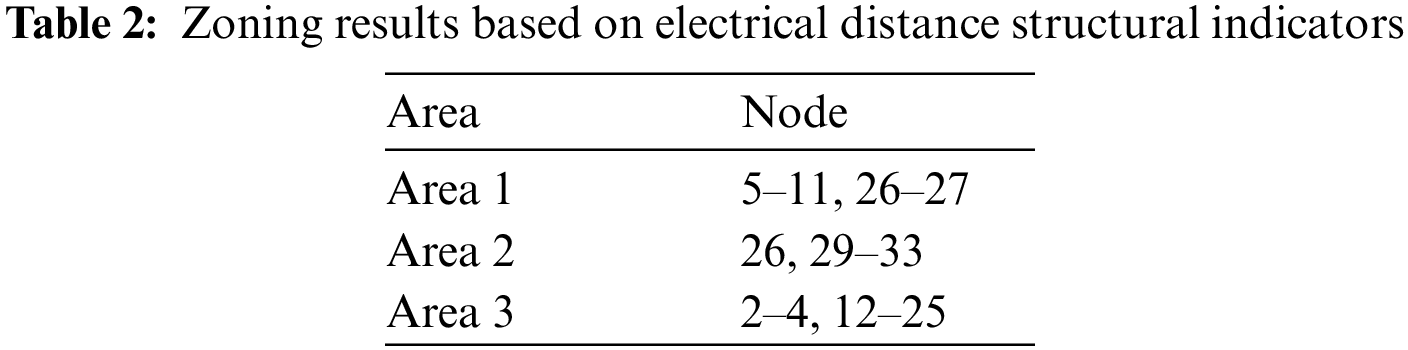
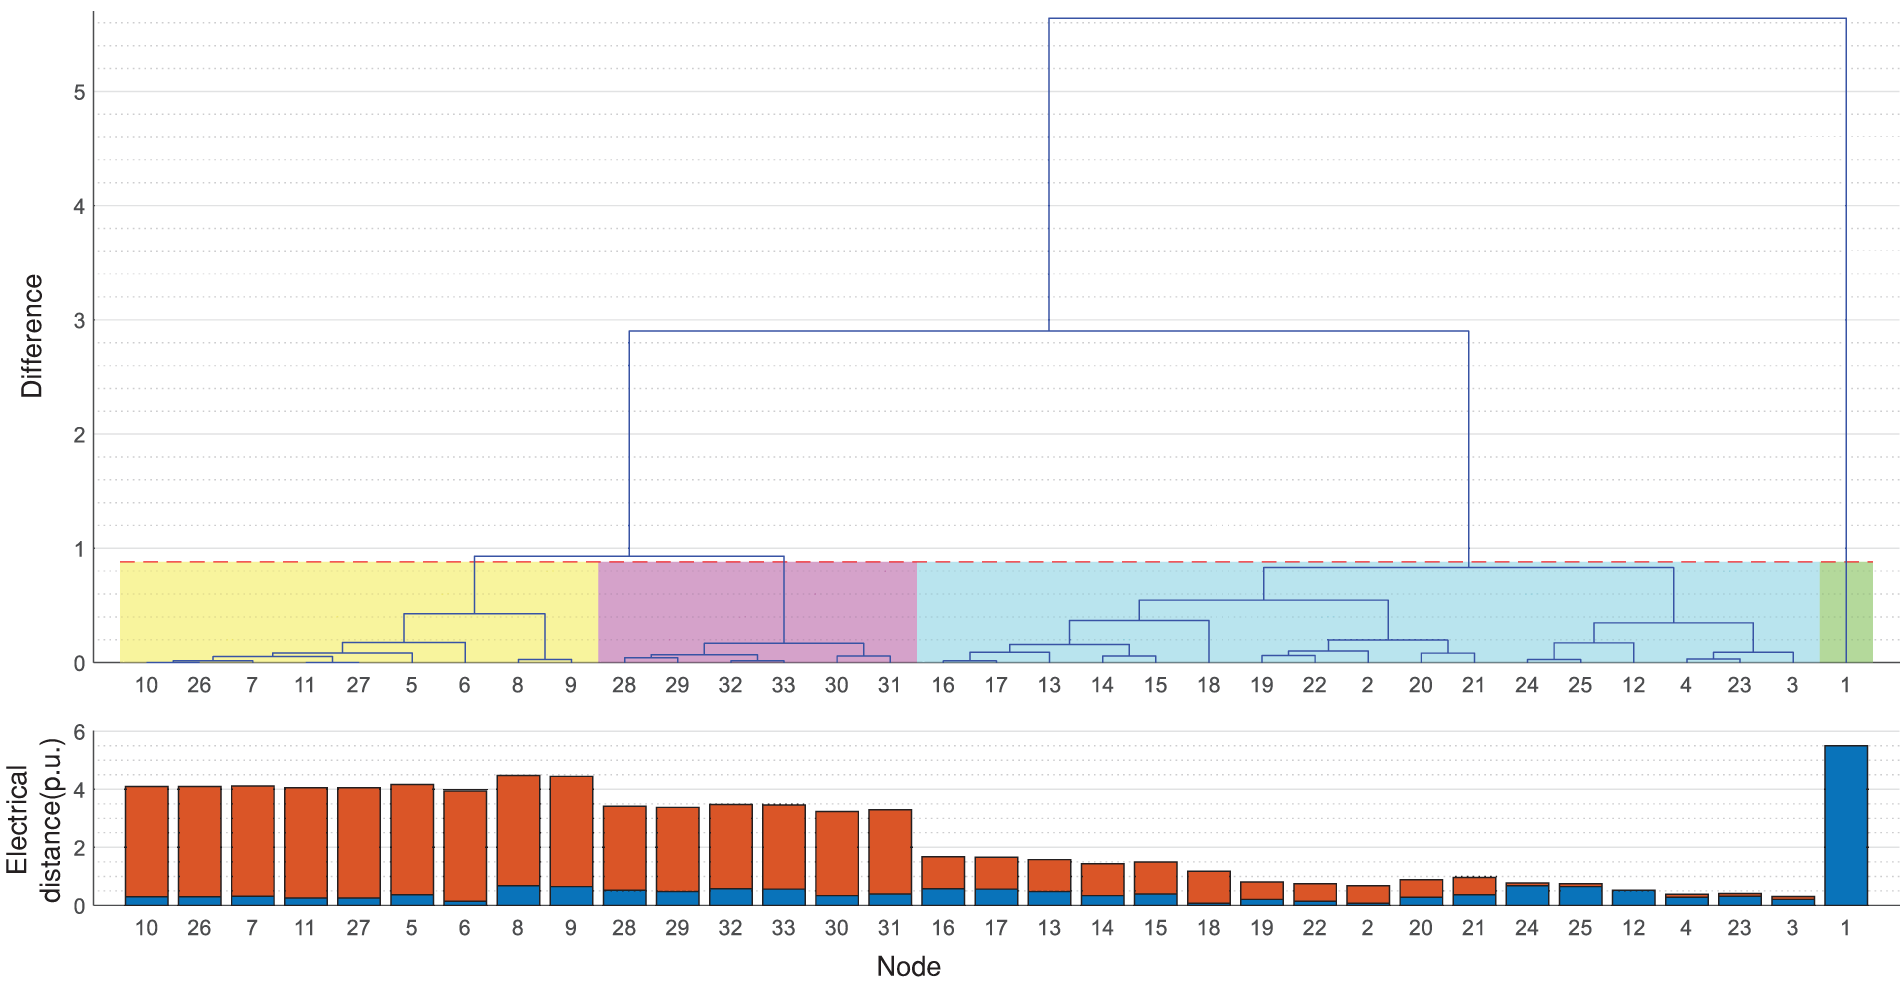
Figure 7: IEEE33 node partition results
Based on the above partitioning results, the node voltage comparison results of each scheme are shown in Fig. 8. The scenery output after partitioning is shown in Fig. 9. Comparing the system voltages of different schemes, in the single-layer planning model of Scheme 1, when the voltage exceeds the lower limit due to the access of distributed power sources, the minimum voltage is 0.941 p.u., which is lower than the 0.95 p.u. set in the calculation example. By optimizing the energy storage configuration, Scheme 2 and Scheme 3 increase their minimum voltage to 0.951 and 0.957 p.u., respectively, so that the voltage of the distribution network is within the allowable range. The voltage deviations under the three schemes are 3.69%, 2.9% and 2.23%, respectively. The voltage deviation after optimization is significantly reduced. Therefore, reasonable configuration of distributed generation and energy storage system processing in the system will regulate the node voltage of the system.
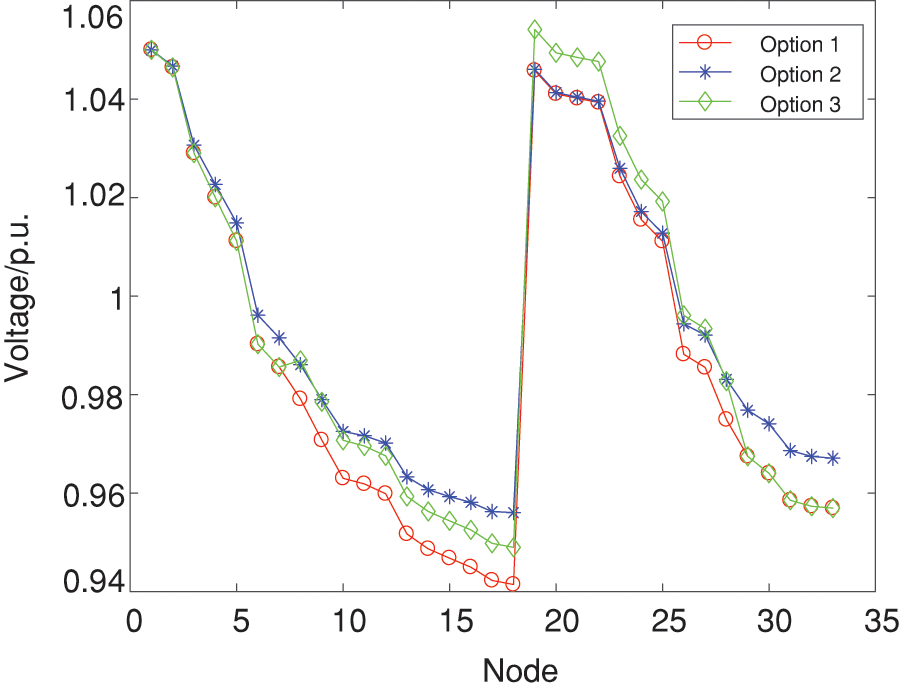
Figure 8: Voltage distribution under different schemes
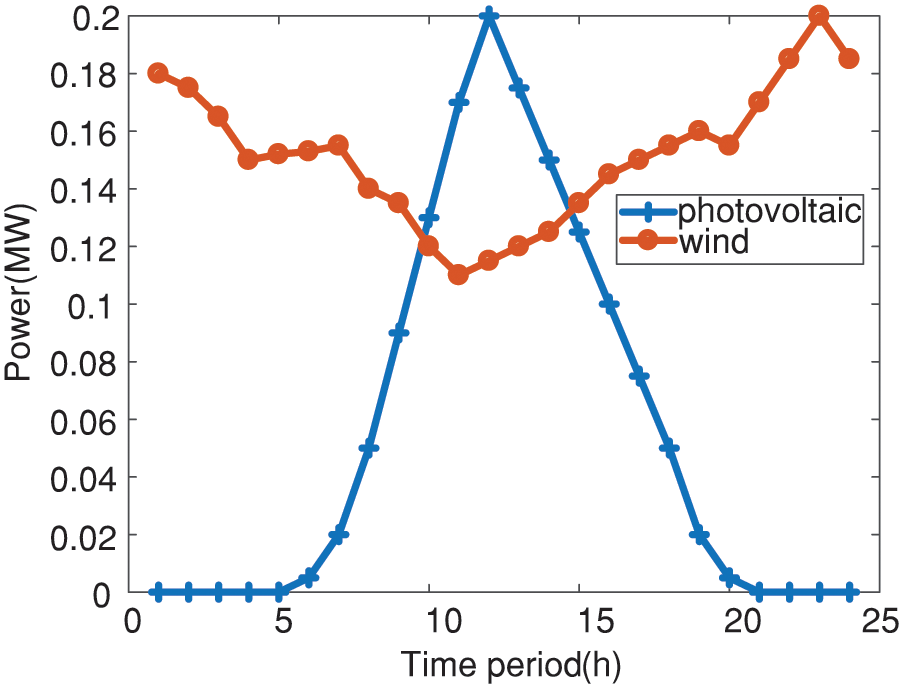
Figure 9: Scenery contribution in case of option three
b) Network loss analysis
Reducing the network loss on the line can reduce the power loss, which can not only improve the economy but also be more environmentally friendly. The network losses under different schemes are shown in Fig. 10. The average network losses under the three schemes are 0.28, 0.22 and 0.16 MW, respectively. The result after two-stage planning is 21.4% lower than the result of the single-layer planning model. The two-stage planning after partitioning is 27.2% lower than that without partitioning. The overall power loss of the distribution system has been reduced to a certain extent, which proves that two-stage planning after partitioning can further reduce network losses, save energy and reduce emissions, and is conducive to the overall stability of the system.
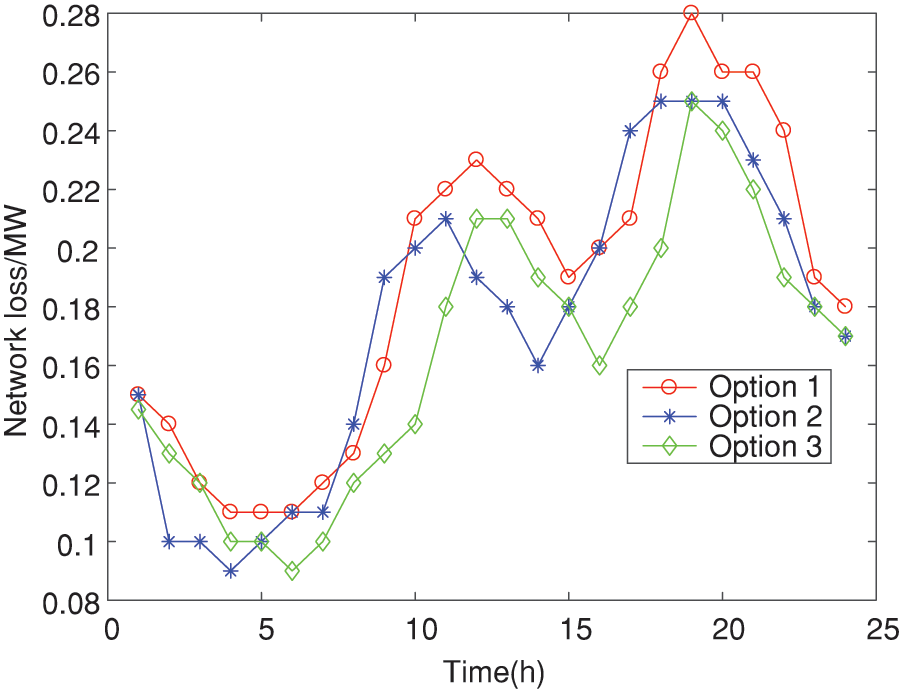
Figure 10: Network loss analysis under different solutions
c) Economic analysis
In order to facilitate the observation of the timing actions of the energy storage system, the energy storage actions of a typical day are selected for explanation in Fig. 11. Positive values represent energy storage discharge, and negative values represent energy storage charging. During the period of 8:00–17:00, in order to balance the overvoltage caused by the output of distributed power sources, the energy storage is charged at this time; the distributed power supply is in a period of low output between 0:00–8:00 and 18:00–24:00, at this time, the energy storage is discharged to meet the peak load demand.
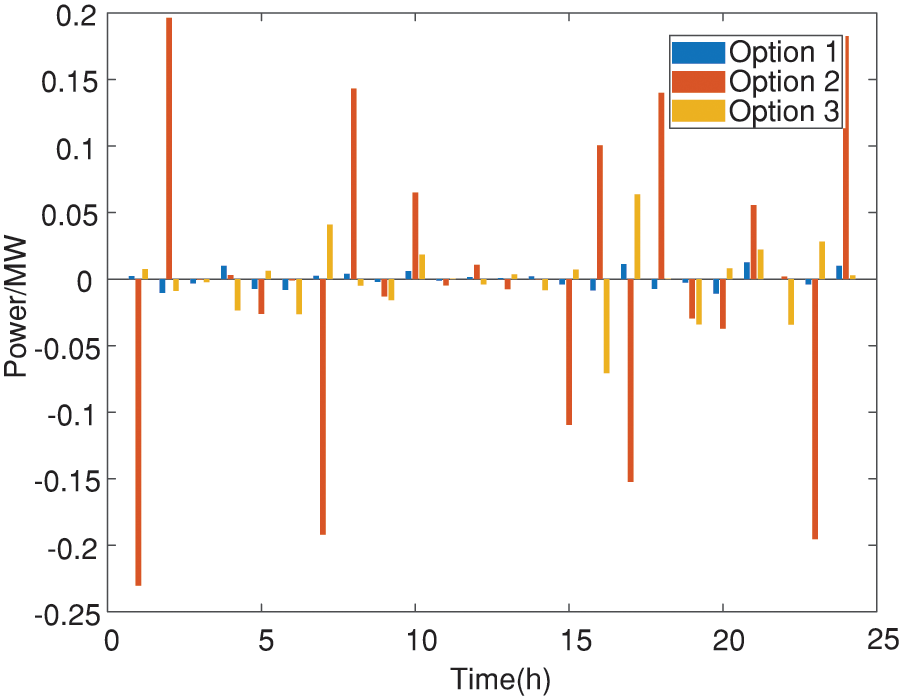
Figure 11: Energy storage actions under different schemes
The changing trend of energy storage SOC throughout the day is shown in Fig. 12. In order to prevent overcharge and overdischarge of energy storage components, according to the SOC status constraints of the energy storage system, the SOC of the energy storage is always controlled to remain between 0 and 0.8. fluctuation.
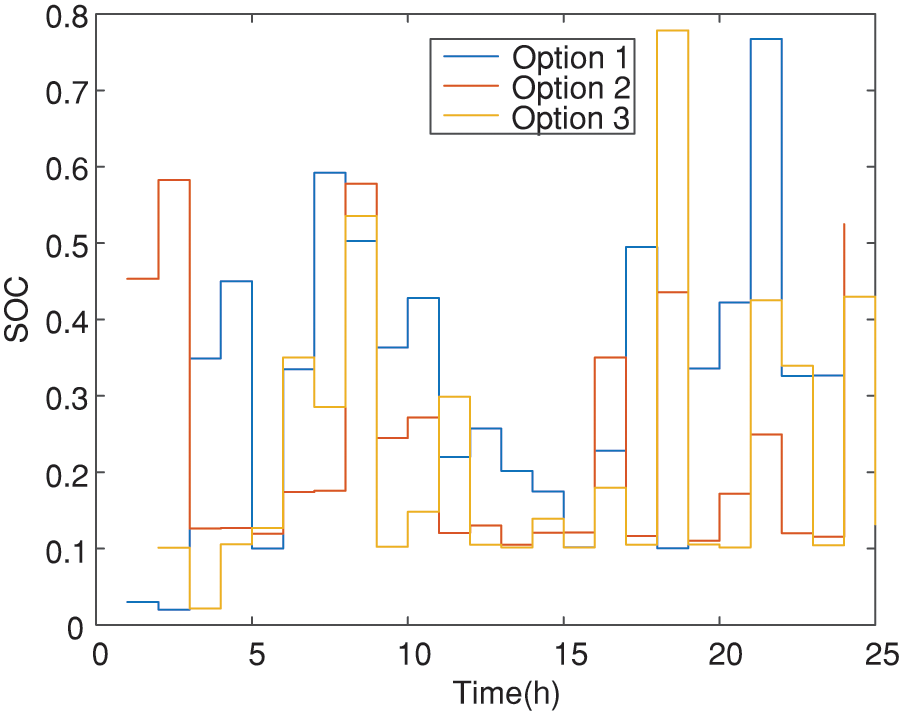
Figure 12: SOC optimization results under different solutions
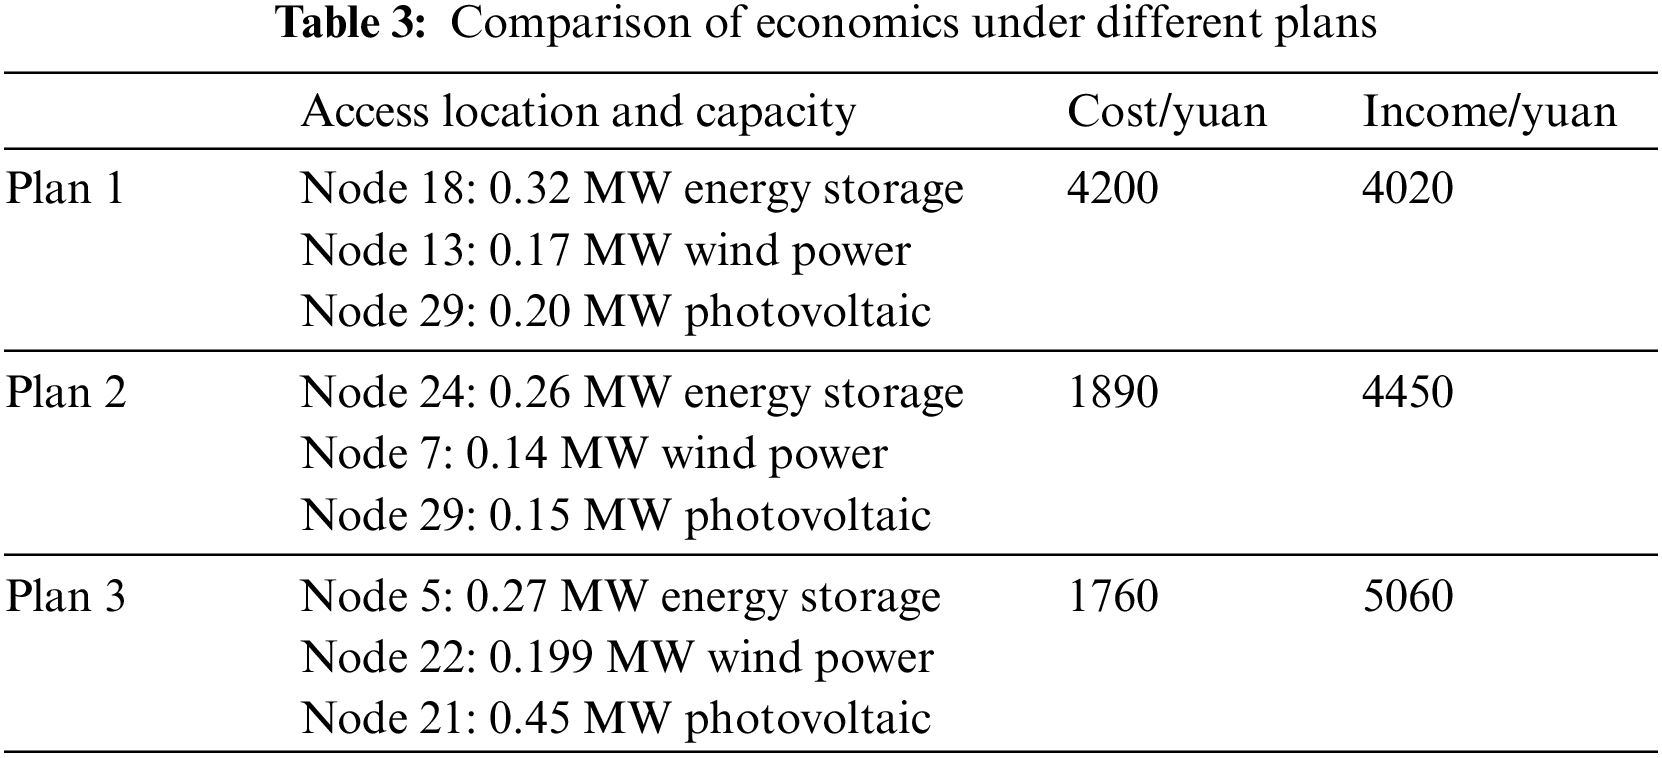
The economic indicators under different schemes are shown in Table 3. As can be seen from Table 3, the overall investment cost of two-stage planning after zoning is reduced by 58.1% compared to the single-layer planning solution, and the income from wind and solar grid connection is increased by 20.6%. The results in Table 2 show that all costs of the distribution network have been reduced after optimization, which verifies the effectiveness of the optimization method proposed in this article.
In order to solve the voltage over-limit and accommodation problems caused by the access of high-proportion distributed power sources, this paper proposes an electrical distance structural index that comprehensively considers active output and reactive power output. This index reasonably divides the distributed generation voltage regulation domain and determines the location and number of distributed power supply connections. It is relatively more universal than existing indicators. And based on the zoning results, a two-stage planning is carried out, comprehensively considering the coordination between distributed power sources and energy storage, and planning with the goal of minimizing network losses and optimizing economics, making the planning results more comprehensive and reasonable.
Finally, the distance-based ant lion optimization algorithm is used to solve the problem. The solution results can take into account the different needs of different entities. The voltage and network loss of the entire network have been significantly improved, the voltage deviation has been reduced to 2.23%, and the average network loss has been reduced by 27.2% compared with the case without partitioning. The overall investment cost was reduced by 58.1%, and the income from wind and solar grid connection increased by 20.6%, which not only achieved the safe operation of the distribution network, but also met the profit needs of distributed power sources and energy storage.
Acknowledgement: We would like to thank all the authors for their guidance and help on this article.
Funding Statement: This work is supported by North China Electric Power Research Institute’s Self-Funded Science and Technology Project “Research on Distributed Energy Storage Optimal Configuration and Operation Control Technology for Photovoltaic Promotion in the Entire County” (KJZ2022049).
Author Contributions: Yuqing Zhang: Writing the original draft; Junhui Li, Xingxu Zhu and Cuiping Li: Writing-review & editing, supervision; Can Chen, Xiaoxiao Wang and Yinchi Shao: Writing-review & editing, co-supervision. All authors have read and agreed to the published version of the manuscript.
Availability of Data and Materials: Data will be made available on request.
Conflicts of Interest: The authors declare that they have no conflicts of interest to report regarding the present study.
References
1. S. M. Sadeghi, M. Daryalal, and M. Abasi, “Two-stage planning of synchronous distributed generations in distribution network considering protection coordination index and optimal operation situation,” IET Renew. Power Gen., vol. 16, no. 11, pp. 2338–2356, 2022. doi: 10.1049/rpg2.12526. [Google Scholar] [CrossRef]
2. B. Yang, J. Wang, and Y. Chen, “Optimal sizing and placement of energy storage system in power grids: A state-of-the-art one-stop handbook,” J. Energy Storage, vol. 32, pp. 101814, 2020. doi: 10.1016/j.est.2020.101814. [Google Scholar] [CrossRef]
3. Z. H. Jiang, J. Y. Tu, S. C. L., J. Peng, and G. Ouyang, “Research on coordinated development and optimization of distribution networks at all levels in distributed power Energy Engineering,” Energy Eng., vol. 120, no. 7, pp. 1655–1666, 2023. doi: 10.32604/ee.2023.026981. [Google Scholar] [CrossRef]
4. H. Shokouhandeh, M. Ahmadi Kamarposhti, and W. Holderbaum, “Optimal operation of distributed generations considering demand response in a microgrid using GWO algorithm,” Comput. Syst. Sci. Eng., vol. 47, no. 1, pp. 809–822, 2023. doi: 10.32604/csse.2023.035827. [Google Scholar] [CrossRef]
5. F. Zheng, X. Meng, T. Xu, Y. Sun, and H. Wang, “Optimization method of energy storage configuration for distribution network with high proportion of photovoltaic based on source-load imbalance,” Sustainability, vol. 15, no. 13, pp. 10628, 2023. doi: 10.3390/SU151310628. [Google Scholar] [CrossRef]
6. R. P. Kumar and G. Karthikeyan, “A multi-objective optimization solution for distributed generation energy management in microgrids with hybrid energy sources and battery storage system,” J. Energy Storage, vol. 75, pp. 109702, 2024. doi: 10.1016/j.est.2023.109702. [Google Scholar] [CrossRef]
7. M. S. Abid, H. J. Apon, I. M. Nafi, A. Ahmed, and R. Ahshan, “Multi-objective architecture for strategic integration of distributed energy resources and battery storage system in microgrids,” J. Energy Storage, vol. 72, pp. 108276, 2023. doi: 10.1016/j.est.2023.108276. [Google Scholar] [CrossRef]
8. E. Aprilia, K. Meng, H. H. Zeineldin, M. Al Hosani, and Z. Y. Dong, “Modeling of distributed generators and converters control for power flow analysis of networked islanded hybrid microgrids,” Elect. Power Syst. Res., vol. 184, pp. 106343, 2020. doi: 10.1016/j.epsr.2020.106343. [Google Scholar] [CrossRef]
9. Y. Meng, X. Z. Fan, and R. J. Shi, “Siting and capacity optimization of combined wind and solar energy storage system based on opportunity constraint and N-1 safety constraint,” (in ChinesePower Syst. Technol., vol. 45, no. 5, pp. 1886–1893, 2021. doi: 10.13335/j.1000-3673.pst.2020.0812. [Google Scholar] [CrossRef]
10. Y. Li, B. Feng, G. Li, J. Qi, D. Zhao, and Y. Mu, “Optimal distributed generation planning in active distribution networks considering integration of energy storage,” Appl. Energy, vol. 210, pp. 1073–1081, 2018. doi: 10.1016/j.apenergy.2017.08.008. [Google Scholar] [CrossRef]
11. F. Postigo Marcos, C. Mateo Domingo, T. Gómez San Román, and R. Cossent Arín, “Location and sizing of micro-grids to improve continuity of supply in radial distribution networks,” Energies, vol. 13, no. 13, pp. 3495, 2020. doi: 10.3390/en13133495. [Google Scholar] [CrossRef]
12. S. Y. Zhou, Y. Han, and S. H. Chen, “A multiple uncertainty-based bi-level expansion planning paradigm for distribution networks complying with energy storage system functionalities,” Energy, vol. 275, pp. 127511, 2023. doi: 10.1016/j.energy.2023.127511. [Google Scholar] [CrossRef]
13. Y. Li, B. Feng, B. Wang, and S. Sun, “Joint planning of distributed generations and energy storage in active distribution networks: A Bi-Level programming approach,” Energy, vol. 245, pp. 123226, 2022. doi: 10.1016/j.energy.2022.123226. [Google Scholar] [CrossRef]
14. J. L. Li, B. Yang, and Y. Hu, “Site selection and capacity determination of electric-hydrogen hybrid energy storage system considering demand side response,” (in ChinesePower Syst. Technol., vol. 47, no. 9, pp. 3698–3714, 2023. doi: 10.13335/j.1000-3673.pst.2022.2285. [Google Scholar] [CrossRef]
15. H. Khajeh, C. Parthasarathy, E. Doroudchi, and H. Laaksonen, “Optimized siting and sizing of distribution-network-connected battery energy storage system providing flexibility services for system operators,” Energy, vol. 285, pp. 129490, 2023. doi: 10.1016/j.energy.2023.129490. [Google Scholar] [CrossRef]
16. B. Zhao, Z. Xu, C. Xu, C. Wang, and F. Lin, “Network partition-based zonal voltage control for distribution networks with distributed PV systems,” IEEE Trans. Smart Grid, vol. 9, no. 5, pp. 4087–4098, 2017. doi: 10.1109/TSG.2017.2648779. [Google Scholar] [CrossRef]
17. J. M. Ge, Y. R. Liu, and D. Pang, “Cluster division voltage control strategy for high penetration photovoltaic distribution network,” (in ChineseHigh Voltage Eng., vol. 50, no. 1, pp. 74–82, 2024. doi: 10.13336/j.1003-6520.hve.20230816. [Google Scholar] [CrossRef]
18. R. Gugulothu, B. Nagu, D. Pullaguram, and B. C. Babu, “Optimal coordinated energy management strategy for standalone solar photovoltaic system with hybrid energy storage,” J. Energy Storage, vol. 67, pp. 107628, 2023. doi: 10.1016/j.est.2023.107628. [Google Scholar] [CrossRef]
19. N. Nasiri, S. Zeynali, and S. N. Ravadanegh, “Tactical price-setter scheduling of a network-constrained integrated energy system under high penetration of solar distributed generations,” Sustain. Cities Soc., vol. 97, pp. 104777, 2023. doi: 10.1016/j.scs.2023.104777. [Google Scholar] [CrossRef]
20. H. Ranjbar, H. Saber, and M. Sharifzadeh, “Bi-level planning of distributed energy resources into existing transmission grids: Pathway to sustainable energy systems,” IET Gener. Transm. Distrib., vol. 16, no. 24, pp. 4963–4979, 2022. doi: 10.1049/gtd2.12647. [Google Scholar] [CrossRef]
21. H. Saeian, T. Niknam, M. Zare, and J. Aghaei, “Coordinated optimal bidding strategies methods of aggregated microgrids: A game theory-based demand side management under an electricity market environment,” Energy, vol. 245, pp. 123205, 2022. doi: 10.1016/j.energy.2022.123205. [Google Scholar] [CrossRef]
22. M. J. Abbass, R. Lis, and F. Saleem, “The maximum power point tracking (MPPT) of a partially shaded PV array for optimization using the antlion algorithm,” Energies, vol. 16, no. 5, pp. 2380, 2023. doi: 10.3390/en16052380. [Google Scholar] [CrossRef]
23. W. Ouyang, Y. Chen, Q. Li, T. Meng, and M. Cai, “Multi-scenario clustering-based distribution network with distributed power sources operational risk warning method,” J. Phys. Conf. Ser., vol. 2557, no. 1, pp. 012045, Jul. 2023. doi: 10.1088/1742-6596/2557/1/012045. [Google Scholar] [CrossRef]
24. C. Cadena-Zarate and G. Osma-Pinto, “Study of the variation of operation of a low voltage electric network due to the integration of distributed energy resources—Steady state condition,” Int. J. Electr. Power Energy Syst., vol. 155, pp. 109649, 2024. doi: 10.1016/j.ijepes.2023.109649. [Google Scholar] [CrossRef]
25. M. Lee, T. Hong, J. Jeong, and K. Jeong, “Development of a rooftop solar photovoltaic rating system considering the technical and economic suitability criteria at the building level,” Energy, vol. 160, pp. 213–224, 2018. doi: 10.1016/j.energy.2018.07.020. [Google Scholar] [CrossRef]
26. C. Gutiérrez, M. A. Gaertner, O. Perpiñán, C. Gallardo, and E. Sánchez, “A multi-step scheme for spatial analysis of solar and photovoltaic production variability and complementarity,” Sol. Energy, vol. 158, pp. 100–116, 2017. doi: 10.1016/j.solener.2017.09.037. [Google Scholar] [CrossRef]
27. A. Khatibi, F. Razi Astaraei, and M. H. Jahangir, “Using cluster analysis and genetic algorithm for multi-objective optimisation of hybrid electricity supply systems: The case of a photovoltaic/wind/battery grid-connected system in Yazd, Iran,” Int. J. Ambient Energy, vol. 44, no. 1, pp. 474–482, 2023. doi: 10.1080/01430750.2022.2128418. [Google Scholar] [CrossRef]
Cite This Article
 Copyright © 2024 The Author(s). Published by Tech Science Press.
This work is licensed under a Creative Commons Attribution 4.0 International License , which permits unrestricted use, distribution, and reproduction in any medium, provided the original work is properly cited.
 Downloads
 Citation Tools