
 Submit a Paper
 Propose a Special lssue
 Open Access
ARTICLE

Analysis of Electricity Consumption Pattern Clustering and Electricity Consumption Behavior
1 Power Supply Service Management Center, State Grid Jiangxi Electric Power Corporation Limited, Nanchang, 330077, China
2 State Grid Jiangxi Electric Power Corporation Limited, Nanchang, 330077, China
3 College of Electrical and Information Engineering, Hunan University, Changsha, 410082, China
* Corresponding Author: Yupeng Liu. Email:
Energy Engineering 2024, 121(9), 2639-2653. https://doi.org/10.32604/ee.2024.041441
Received 23 April 2023; Accepted 08 September 2023; Issue published 19 August 2024
 View Full Text
 Download PDF
Abstract
Studying user electricity consumption behavior is crucial for understanding their power usage patterns. However, the traditional clustering methods fail to identify emerging types of electricity consumption behavior. To address this issue, this paper introduces a statistical analysis of clusters and evaluates the set of indicators for power usage patterns. The fuzzy C-means clustering algorithm is then used to analyze 6 months of electricity consumption data in 2017 from energy storage equipment, agricultural drainage irrigation, port shore power, and electric vehicles. Finally, the proposed method is validated through experiments, where the Davies-Bouldin index and profile coefficient are calculated and compared. Experiments showed that the optimal number of clusters is 4. This study demonstrates the potential of using a fuzzy C-means clustering algorithm in identifying emerging types of electricity consumption behavior, which can help power system operators and policymakers to make informed decisions and improve energy efficiency.Keywords
The smart grid represents an innovative power technology that integrates information technology with energy systems, offering the potential for substantial transformation in traditional electricity services. By leveraging advanced business systems, comprehensive customer data, and intelligent service platforms, smart grids enable the deployment of intelligent power services, ultimately enhancing energy efficiency on a societal scale. This advancement holds the promise of creating a more sustainable and efficient energy infrastructure that can effectively meet the evolving demands of modern society [1–3].
During the intelligent construction and development of traditional power grids, the wide adoption of smart meters has enabled researchers to access large-scale and diverse original electricity consumption data for analyzing user electricity consumption behavior [4,5]. These data present characteristics of high dimensionality and complex data processing, and extracting valuable information from them is a challenge faced by the power industry. Thus, analyzing the electricity consumption behavior patterns and demand characteristics of power users has significant research value as it can enhance the service level of electricity sales enterprises and distribution network dispatchers, and drive the transformation of power consumption mode towards intelligence.
Over the past decades, research on the energy consumption behavior of consumers become an important way to improve energy efficiency and promote energy conservation. The traditional analysis of electricity consumption behavior mainly relied on questionnaires and statistics to analyze residents’ electricity consumption preferences and utilized highly subjective fuzzy comprehensive evaluation methods to assess residents’ attitudes towards electricity consumption, which failed to take into account the characteristics of residents’ electricity load. Alternatively, reference [6] calculated the difference between daily electricity consumption curves using three similarity measures: Euclidean distance, Pearson distance, and Chebyshev distance. Reference [7] analyzed the impact of the time granularity of original electricity consumption data on the clustering of power users’ electricity consumption behavior. Meanwhile, reference [8] studied a Spark-based K-means clustering algorithm parallel method for large-scale power load curves, and reference [9] proposed a multi-resolution clustering algorithm for large amounts of electricity consumption data collected by smart meters. Reference [10] introduced a load classification method for power users combining the K-means algorithm and Fuzzy support vector machine (FSVM) classification algorithm. Reference [11] utilized the K-means++ clustering algorithm in conjunction with Self-Organizing Map (SOM) neural networks to determine user power usage patterns, while Reference [12] analyzed and evaluates several clustering algorithms, such as the traditional K-means clustering algorithm, self-organizing neural network, weighted average fuzzy K-means clustering algorithm, and hierarchical algorithm. Additionally, reference [13] optimized the number of selected clusters through multi-criteria decision analysis, reference [14] adopted the parametric bootstrapping algorithm to determine the number of clusters, reference [15] fited temperature control load curves through load-temperature correlations, and reference [16] extended non-invasive load monitoring technology to the regional level. Load pattern identification is often studied for specific loads in different regions, different industries, and different seasons [17]. Reference [18] proposed a load identification research method based on typical load curves of different industries, which effectively identifies load curves with common morphological characteristics. Cluster analysis was performed on 936 residential electricity load datasets obtained from the U.S. Department of Energy [19]. Reference [20] presented a case study to examine how the lockdowns during the COVID-19 pandemic affected the amount of electricity and natural gas consumption in four organized industrial zones in Turkey. Reference [21] provided the time-series forecasting of energy demand in electric vehicles and the impact of the COVID-19 pandemic on energy demand. Reference [22] employed the CH-K-means algorithm and Long Short-Term Memory (LSTM) neural network to conduct industrial energy consumption behavior and forecasting analysis. Reference [23] assessed the effects of social media in molding the consumption behaviors while considering eco-labeling, eco-branding, social norms, and purchase intensions. Reference [24] proposed an unsupervised progressive incremental data mining mechanism applied to smart meters energy consumption data through frequent pattern mining to overcome these challenges. Reference [25] analyzed energy usage behavior in households by using a mix of primary and secondary techniques, which revealed seasonal consumption trends, with peculiar ownership and usage patterns of appliances. Reference [26] conducted an analysis to understand differences between consumer categories and what this could mean e.g., to develop effective demand response measures. Reference [27] took the Energy Saving and Emission Reduction Plan (ESER) since 2006 as a policy shock to explore the impact of the ESER on industrial firms’ energy consumption behavior and explores the impacts of the ESER on firms’ energy consumption behavior based on industrial firm data. Reference [28] described a methodology of integrating the energy consumption estimation associated with equipment operation into a digital twin model based on discrete-event simulation through a data-driven pipeline and discussed the implementation of the methodology in a laboratory environment including industrial equipment. Reference [29] evaluated how prosumers adapt their consumption behavior in response to such political uncertainty and increasing electricity prices. Reference [30] explored behavioral determinants of the demand for water and electricity, contributing a set of categories and items that may be useful for understanding knowledge, attitudes, and practices related to consumption and constructing valid scales.
It can be seen from the above research that load pattern recognition is often classified and trained by specific loads such as regions, industries, seasons, etc., and its classifier model has low generalization ability and weak model migration ability, which is only applicable to specific user load models. Whenever a new load object is studied, it cannot be directly transferred to the new user load without re-doing tedious long-term training sample collection. At present, the problem that is difficult to solve in load clustering analysis is that the initial center of clustering is randomly selected, resulting in discrete points or boundary points in the data sample that easily affect the determination of the final cluster center, making it difficult to classify the sample points near the decision boundary.
To address the aforementioned issues, this study proposes a solution using statistical analysis of clusters to analyze power usage patterns based on a set of indicators. Specifically, the fuzzy C-means clustering algorithm is applied to investigate the electricity consumption modes of energy storage equipment, agricultural drainage irrigation, port shore power, and electric vehicles in the low-voltage power supply station area. The proposed method can provide support for line loss control and energy optimization in low-voltage supply areas. Experimental results demonstrate the effectiveness of our approach.
The rest of this paper is organized as follows. Section 2 introduces the basics of statistical analysis of clusters. Section 3 describes the FCM algorithm and indicators for power usage patterns. Section 4 presents the load characteristics of low-voltage power supply station areas, including energy storage equipment, agricultural drainage irrigation, electric vehicles, and port ship shore power. Section 5 provides the experimental results. Section 6 concludes this paper.
2 Basics of Statistical Analysis of Clusters
Cluster analysis is a modern multivariate statistical technique that combines contemporary taxonomy and multivariate statistical analysis, and is considered a crucial branch of unsupervised pattern recognition. Its purpose is to categorize a disordered set of samples into several subclasses with distinct characteristic differences by using specific rules. This process aims to group samples with similar feature quantities and classify them as accurately as possible, while also separating samples with dissimilar feature quantities into different categories. There are several types of clustering methods, including division-based clustering, hierarchical-based clustering, density-based clustering, grid-based clustering, and model-based clustering.
Steps for clustering can be listed as follows:
Step 1: Select the clustering variable. These variables should have the following characteristics: 1) They are related to the goal of cluster analysis; 2) Reflect the characteristics of the object to be classified; 3) There are obvious differences in the values of different objects; 4) Variables should not be highly correlated with each other. For highly correlated variables (two): 1) Before the case cluster analysis, the variables are clustered and selected as clustering variables in each category; 2) Do factor analysis on variables to produce a set of uncorrelated variables as clustering variables.
Step 2: Calculate the similarity. The similarity is a fundamental concept in cluster analysis and reflects the degree of affinity between study subjects. Cluster analysis is based on the similarity between the study objects.
Step 3: Clustering. Select a clustering method to determine the number of classes formed.
Step 4: Interpretation of clustering results. After obtaining the clustering results, verify and interpret the results to ensure that the clustering solution is trustworthy.
3 Electricity Consumption Pattern Recognition Method Based on Cluster Analysis Theory
3.1 Set of Indicators for Power Usage Patterns
The user load characteristics and power consumption mode can be broadly classified into three types: user attribute class, load curve class, and electrical index class. The user attribute class comprises the electricity consumption attributes that are determined by the user at the time of using electricity. These attributes are typically stable or undergo minimal changes and are assigned during clustering. The load curve class comprises the power and electricity consumption change curve of the user over a specific period of time. This class provides information on the user’s peak and valley characteristics, load change trends, and fluctuations, making it a rich source of power consumption data. The electrical index class describes the user’s electricity consumption behavior in numeric form, with load fluctuation, growth, peak and valley, and other aspects being quantified over different time frames such as day, week, month, season, and year. Table 1 shows the different types of indicators and their respective meanings.
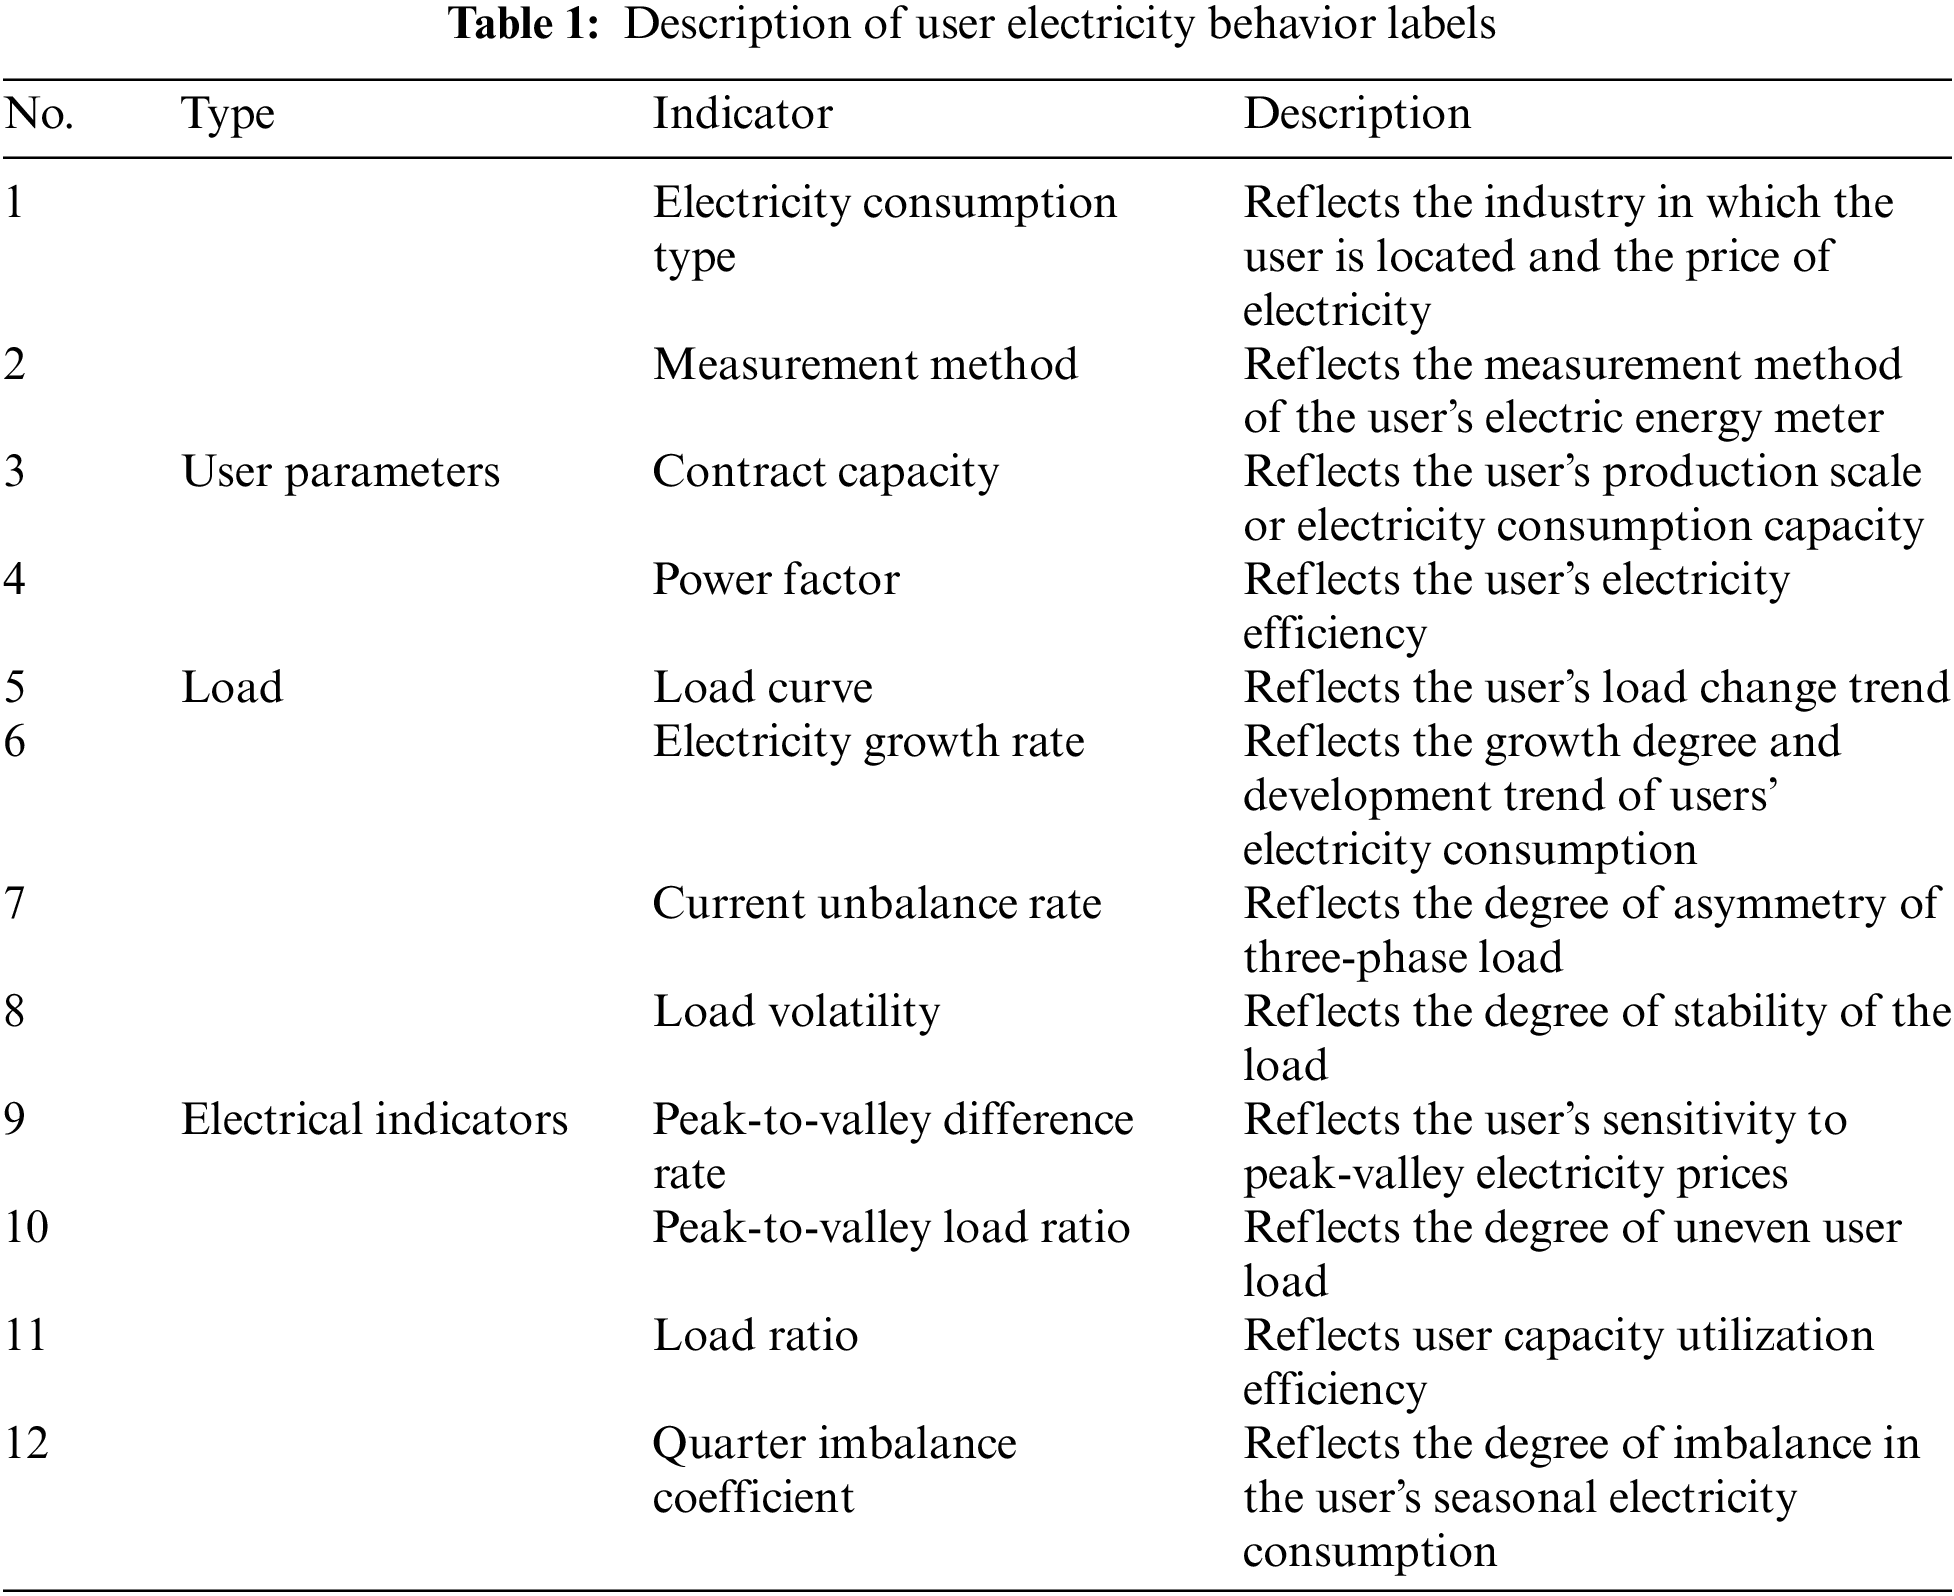
1) User attribute class. Type of electricity consumption (agricultural production, agricultural drainage and irrigation, large industry, general industry, and commerce, residential lighting, etc.), measurement method (single-phase, three-phase three-wire, three-phase four-wire), contract capacity, power factor.
2) Load curve class. Daily load curve, monthly load curve, annual load curve.
3) Electrical indicators. Electricity growth rate, current imbalance rate, load fluctuation rate, peak-to-valley difference rate, seasonal imbalance coefficient, load ratio, peak-to-valley load ratio.
Some electrical indicators have time scale malleability, so that different index types are formed to comprehensively describe the user’s power consumption mode, and the content of the extended indicators is shown in Table 1.
The Fuzzy C-means (FCM) clustering algorithm is designed to assign a degree of membership to each data point in a cluster, based on their similarity, thereby grouping the most similar objects into the same cluster and separating the least similar objects into different clusters. Unlike the traditional C-means algorithm that is rigid in data partitioning, FCM provides a flexible approach for fuzzy data partitioning. Fuzzy clustering methods are particularly useful in cases where clustering involves ambiguous boundaries between objects. The FCM algorithm is commonly employed in cluster analysis to identify various electricity consumption patterns within an industry, where load characteristics are classified for each industry. The flowchart of the FCM algorithm is shown in Fig. 1.
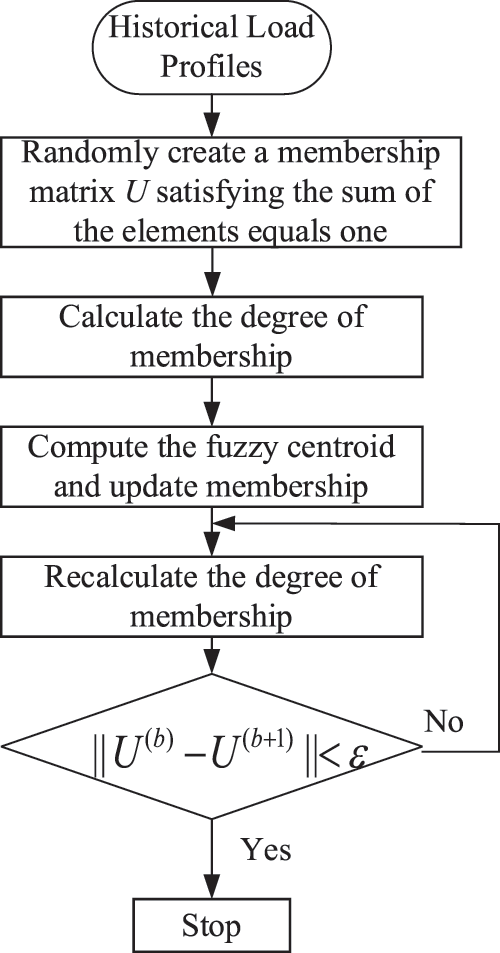
Figure 1: The flowchart of the FCM algorithm
The FCM clustering process involves several steps:
1) Initialization. Let the number of clustering categories be c (2 ≤ c ≤ n, n is the number of samples), set the iteration stop threshold ε and the iteration counter b = 0, and initialize the membership matrix U(0);
2) Update the cluster center matrix P(b) by the following equation:
where m is the hyper-parameters that controls how fuzzy the cluster will be. xk is the samples. b denotes the iteration counter. U(b) is the membership matrix.
3) Update the membership matrix U(b + 1) by following equation:
where dik denotes the distance between the sample k and the cluster center i,
4) Determine whether
After the algorithm iteration stops, the final membership degree and cluster center form are:
The characteristics of user electricity mainly cover the following six types and grades:
1) Seasonal characteristics: insensitive, spring sensitive, summer sensitive, autumn sensitive, winter sensitive.
2) Temperature characteristics: insensitive, high-temperature peak, low-temperature peak.
3) Weekly rest characteristics: irregular, five-day working system, six-day working system, seven-day working system.
4) Peak-valley characteristics: peak preference, valley preference, peak-valley equilibrium.
5) Fluctuation characteristics: low, medium, high, high.
6) Benefit characteristics: low, medium, high, high.
4 Load Characteristics of Low-Voltage Power Supply Station Area
In this section, we analyze the electricity consumption of four scenarios, including energy storage equipment, agricultural drainage irrigation, electric vehicles, and port ship shore power. Data comes from State Grid Jiangxi Electric Power Co., Ltd. (Nanchang, China), and 6 months of data in 2017 are selected.
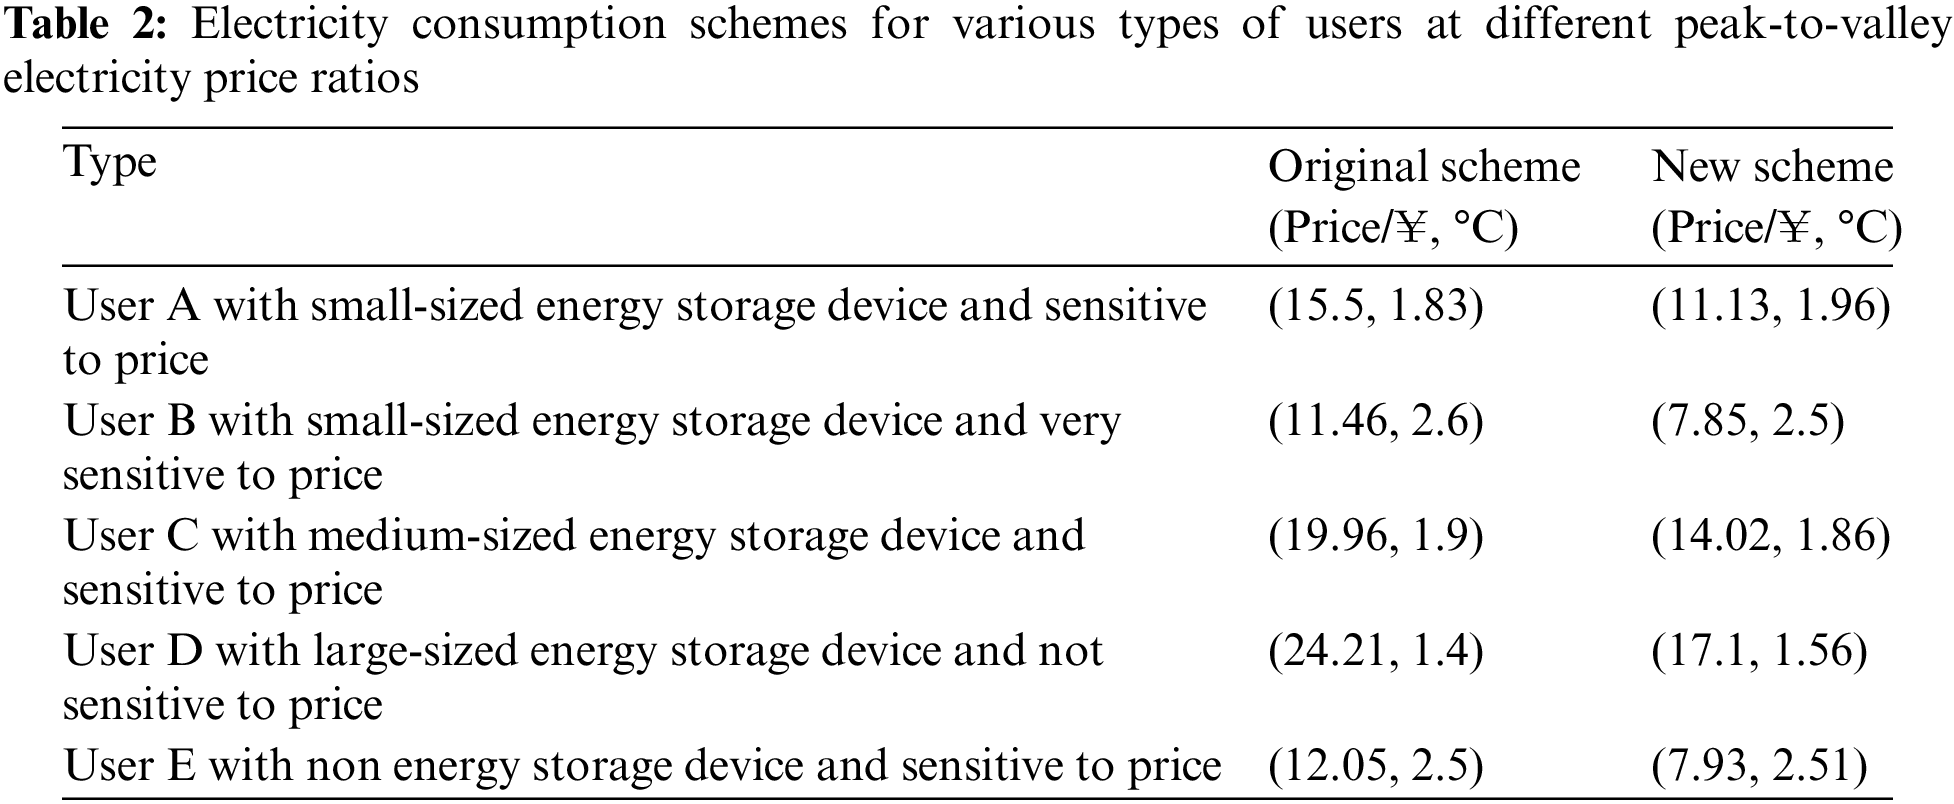
To analyze how the peak-to-valley electricity price ratio affects the response characteristics of energy storage equipment users, various peak-to-valley electricity price ratios are separately set, and the demand response electricity consumption characteristics of users are calculated. Subsequently, the impact of the peak-to-valley electricity price ratio on the demand response characteristics of energy storage users is analyzed. As shown in Table 2, the initial peak-to-valley electricity price ratio is 4.45, and a higher peak-to-valley electricity price ratio of 9.90 is introduced. For each energy storage equipment user, an electricity consumption scheme is developed based on this electricity price ratio, which is then compared to the original peak-to-valley electricity price. Users A and B, who have different economic sensitivities, were chosen for a comparative analysis of electrical load characteristics. User A utilizes a medium-sized energy storage device, while User B utilizes a large energy storage device.
Based on Fig. 2, it can be observed that for users C and D, their electricity consumption slightly increases from 20:00 to 08:00 the next day with an increase in electricity price, while during the peak period of electricity prices from 08:00 to 20:00, the electricity consumption of user C remains stable, whereas the electricity consumption of user D decreases significantly. Thus, for user C, who is more sensitive to the economy, under the influence of the original peak-to-valley electricity price ratio, the response to peak electricity prices is more pronounced, and the load characteristics do not change with a further increase in the electricity price ratio. However, for user D with weaker economic sensitivity, the increase in peak-to-valley electricity price ratio results in significant adjustments in electricity load during peak periods, leading to an increase in the degree of demand response, until the electricity price reaches a certain level, after which the user’s response potential becomes maximum, and the load characteristics remain constant.
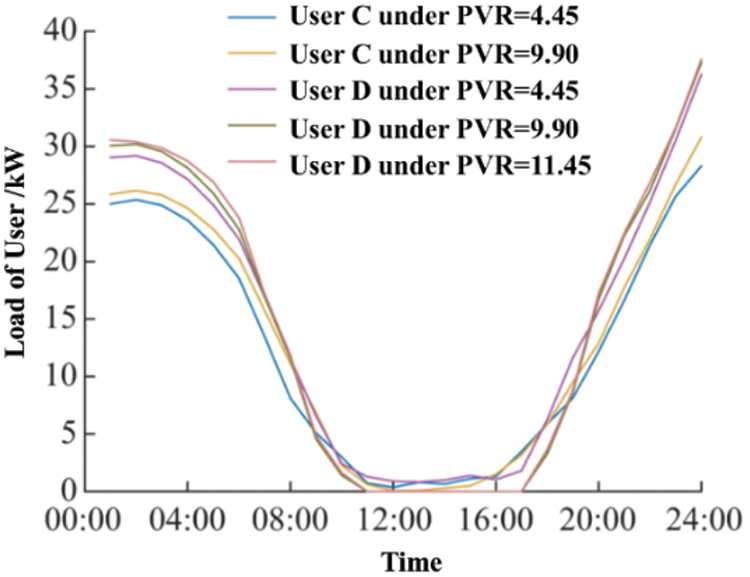
Figure 2: Daily load characteristics of users under different peak-valley electricity prices
4.2 Agricultural Drainage Irrigation
The seasonal imbalance coefficient and annual load rate are used as the electricity consumption labels of the irrigation load of agricultural drainage. The quarterly imbalance coefficient is:
where Pyear,max is the maximum load of the year, and Pi is the maximum load of the ith month.
The annual load factor is:
where Wi is the electricity consumption in the ith month (kWh) and Pmax is the maximum annual load (kW).
The typical daily load characteristics of agricultural drainage irrigation are shown in Fig. 3.

Figure 3: Daily load characteristics of typical agricultural irrigation substations
The figure illustrates that the daily fluctuation of electricity consumption for agricultural irrigation is minimal. This is because the electricity consumption cycle for agricultural irrigation is long and continuous and not restricted to day or night. The irrigation system is typically kept running until the end of the irrigation season, resulting in a low daily load fluctuation rate.
We examine real-world historical data pertaining to electric vehicles, which includes records of each EV charging session. The crucial information captured in these records consists of the starting and ending times of the charging, as well as the state of charge (SOC) at the beginning and end of the charging session.
For the typical load of electric vehicles on weekdays and weekends, we consider two scenarios.
(1) Electric vehicle charging load scenario
Three charging scenarios were considered to generate electric vehicle charging load scenarios, and three of them are presented in Fig. 4. The first scenario (in blue) and the second scenario (in green) both depict a single charging event that occurs at night, with the only difference being that the charging time in the first scenario spans 24 h. The third scenario (in red) depicts two charging events, one in the morning and one in the evening.

Figure 4: Electric vehicle charging load scenario
(2) Electric vehicle load under the modeling of different charging cycles
500 electric vehicle grid load power scenarios are generated by considering the key variables of tertiary, secondary, and primary charging. The weighted average electric vehicle load curve is obtained and shown in Fig. 5. To provide a benchmark for comparison, the load curve of electric vehicles is obtained based on historical data, considering all charge and discharge times.

Figure 5: EV load curve under modeling of different charging cycles (working days)
The load model shows the closest approximation to the load curve based on historical data when considering the key variable of tertiary charging. However, when considering only the key variables of two charging sessions and one charging session, the load curve tends to be underestimated, particularly during the evening peak hours.
When the ship is connected, the load experiences a sudden and significant increase, rather than a gradual one, which has a notable impact on the power system. This is a rapidly changing process that occurs over approximately 7 h of docking time, during which the load is maintained at a high operating state and exhibits minimal fluctuations.
Active and reactive load curve of a single ship connected to shore power is shown in Fig. 6.

Figure 6: Daily load curve for a single vessel
The ships usually access shore power for 7 to 9 h between 07:00 and 21:00, in a 24-h cycle for a total of 7 days. When a single berth is connected, the shore power load starts from zero and fluctuates slightly during the access period due to the use of various power loads on the ship. The change characteristics of active and reactive power are similar.
When two berths are connected to shore power, there are differences in port call and residence times of the vessels, as well as differences in load operation characteristics, leading to fluctuations in power load when both ships are connected to shore power simultaneously. The change characteristics of active and reactive power are similar. Although the daily electricity consumption period is extended, the overall electricity consumption period remains between 07:00 and 21:00.
After conducting the above analysis, the following characteristics of port shore power load have been identified:
(1) There is a significant disparity in load between day and night. As port ship operations primarily occur during the daytime, the load during this period is substantially higher than that during nighttime. The day-night load ratio can be used as an indicator to describe the shore power load characteristics of the port.
(2) The load fluctuation during peak periods is minimal. Once the ship is docked, the overall load variation is not abrupt. During peak periods of port shore power, a diverse range of constant power equipment occupies a substantial portion of the electrical load. However, the load variation is very sharp in the case of certain loads like pole-changing motors, which are utilized as drive motors for cargo machinery.
(3) The power factor is low. Port ships involve a large number of inductive loads, which result in a low power factor, typically ranging between 0.75 to 0.9, with the total power factor being close to 0.8.
By analyzing the relationship between peak-to-valley electricity price ratio and the response characteristics of energy storage equipment users, we can conclude that users with different economic sensitivities exhibit varying responses to increasing peak-to-valley electricity price ratios, leading to adjustments in electricity load during peak periods. The analysis shows that users more sensitive to the economy maintain stable load characteristics during peak price periods, while those with weaker economic sensitivity demonstrate a higher degree of demand response. In terms of agricultural irrigation, electricity consumption exhibits minimal daily fluctuation. This is attributed to the long and continuous electricity consumption cycle associated with irrigation, which is not limited to specific day or night periods. The irrigation system typically operates continuously until the end of the irrigation season, leading to a low rate of daily load fluctuation. Our findings related to EV charging load scenario suggest that including tertiary charging as a key variable provides the closest approximation to the historical load curve. Finally, the load patterns at the port exhibit a significant disparity between day and night, minimal load fluctuation during peak periods, and a low power factor due to the presence of inductive loads. Understanding these characteristics is crucial for effective load management and optimizing the use of shore power resources at the port.
5 User Electricity Clustering Experiments
We use the 936 residential electricity load datasets from the U.S. Department of Energy for cluster analysis [19]. The dataset spans one year, with data collected every hour, resulting in 8760 data points per user. Note that the data do not include the time of COVID. The COVID-19 lockdowns have adversely affected energy demand and consumption. The changes in energy requirements are compared and analyzed from multiple perspectives according to available data and information. Interested readers are referred to [20,21] for better the better understanding of the impacts of COVID-19 pandemic.
The data exhibit clear peak and off-peak periods, with high consumption from January to mid-March and June to September, and low consumption from mid-March to June and September to mid-November. Based on these periods, four initial cluster medoids were determined. The experiments involved comparing the FCM clustering method and the distance cost function.
The Davies-Bouldin index (DBI) is used as the cluster effectiveness evaluation index, and the calculation formula is as follows:
where d(xk) and d(xj) represent the average distance from the same category of data to their clustering centers, respectively; d(ck, ck) represents the vector distance between different categories, so it can be seen that the smaller the DBI, the higher the clustering accuracy.
Different K values are set on the same scale dataset, and the results are shown in Fig. 7. The experimental results show that the FCM clustering algorithm shows good clustering performance under different K values.

Figure 7: Cluster accuracy at different K values
In order to determine if the 4 initial cluster clusters obtained by FCM are the optimal number of clusters, K values ranging from 2 to 9 are tested. Contour coefficients are calculated for each K value, and Fig. 8 shows the corresponding profile coefficient map. The profile coefficient ranges from −1 to 1, with values closer to 1 indicating better clustering results. From the results of Fig. 8, the largest profile coefficient value of 0.4978 is obtained when the number of clusters is 4, followed by a value of 4.852 when the number of clusters is 5. Combining the contour coefficient method and DBI value, it is determined that the optimal number of clusters is 4.
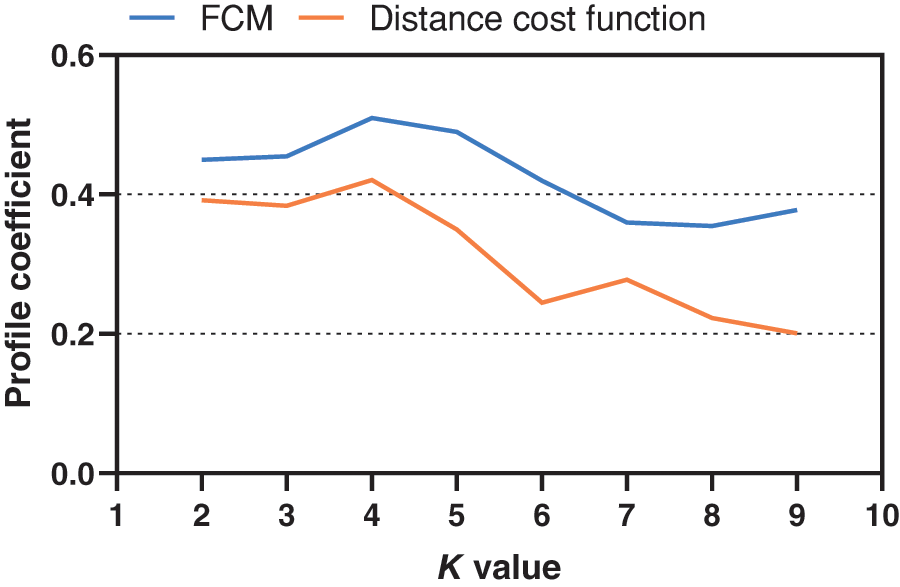
Figure 8: Clustering K value and profile coefficient plot
In conclusion, this study successfully applies the FCM clustering algorithm to analyze user electricity consumption behavior. The statistical analysis of clusters and the set of indicators for power usage patterns provide a comprehensive understanding of power consumption modes in various scenarios. The findings reveal specific load characteristics in energy storage equipment, agricultural drainage irrigation, port shore power, and electric vehicles in the low-voltage power supply station area. The FCM algorithm proves effective in clustering consumption patterns and analyzing power consumption behavior, offering valuable insights for load management, energy optimization, and the development of intelligent power services. The study’s findings have implications for enhancing energy efficiency and supporting informed decision-making by power system operators and policymakers.
This paper explores the power consumption behavior of users by using a clustering algorithm to analyze their electricity consumption data. The analysis includes statistical analysis of clusters and the introduction of a set of indicators for power usage patterns. The fuzzy C-means clustering algorithm is applied to analyze the electricity consumption patterns of various scenarios, such as energy storage equipment, agricultural drainage irrigation, port shore power, and electric vehicles in the low-voltage power supply station area. We selected 6 months of electricity consumption data in 2017 from Jiangxi Province, China, and 936 residential electricity load datasets obtained from the U.S. Department of Energy for analysis. For energy storage equipment, the impact of the peak-to-valley electricity price ratio from 4.45 to 9.90 is analyzed. We used the Davies-Bouldin index and profile coefficient to select the K value. The largest profile coefficient value of 0.4978 is obtained when the number of clusters is 4, followed by a value of 4.852 when the number of clusters is 5. Combining these two results, we get the number of clusters, K = 4. The experimental results show that the proposed FCM is suitable for clustering consumption patterns and analyzing consumption behavior.
Acknowledgement: None.
Funding Statement: The work is supported by the Science and Technology Project of State Grid Jiangxi Electric Power Corporation Limited ‘Research on Key Technologies for Non-Intrusive Load Identification for Typical Power Industry Users in Jiangxi Province’ (521852220004), where the principle investigator is Liang Zhu.
Author Contributions: The authors confirm contribution to the paper as follows: study conception and design: Liang Zhu, Junyang Liu, Yupeng Liu; data collection: Chen Hu, Yanli Zhi; analysis and interpretation of results: Liang Zhu, Junyang Liu, Chen Hu, Yupeng Liu; draft manuscript preparation: Liang Zhu, Yanli Zhi. All authors reviewed the results and approved the final version of the manuscript.
Availability of Data and Materials: The 936 residential electricity load datasets used for cluster analysis in this paper is from the U.S. Department of Energy from reference [19].
Conflicts of Interest: The authors declare that they have no conflicts of interest to report regarding the present study.
References
1. M. Liserre, T. Sauter, and J. Y. Hung, “Future energy systems: Integrating renewable energy sources into the smart power grid through industrial electronics,” Ind. Electron. Mag. IEEE, vol. 4, no. 1, pp. 18–37, Mar. 2010. doi: 10.1109/MIE.2010.935861. [Google Scholar] [CrossRef]
2. X. Lin, R. Yu, J. Yu, and H. Wen, “Constant coupling effect-based PLL for synchronization stability enhancement of grid-connected converter under weak grids,” IEEE Trans. Ind. Electron., vol. 70, no. 11, pp. 11310–11323, Nov. 2023. doi: 10.1109/TIE.2022.3227268. [Google Scholar] [CrossRef]
3. J. Song, J. Zhang, H. Kuang, and H. Wen, “Dynamic synchrophasor estimation based on weighted real-valued sinc interpolation method,” IEEE Sens. J., vol. 23, no. 1, pp. 588–598, Jan. 2023. doi: 10.1109/JSEN.2022.3224365. [Google Scholar] [CrossRef]
4. A. Mohsenianrad and A. Leongarcia, “Coordination of cloud computing and smart power grids,” in Proc. 2010 First IEEE Int. Conf. Smart Grid Commun., Gaithersburg, MD, USA, 2010, pp. 368–372. doi: 10.1109/SMARTGRID.2010.5622069. [Google Scholar] [CrossRef]
5. Y. W. Nie, W. Yang, L. S. Huang, and X. R. Lu, “A privacy preserving scheme for change increment of electricity big data base on symmetric cryptography,” in Proc. 2014 IEEE 3rd Int. Conf. Cloud Comput. Intell. Syst., Shenzhen, China, Nov. 2014, pp. 487–490. doi: 10.1109/CCIS.2014.7175784. [Google Scholar] [CrossRef]
6. M. Zatti et al., “k-MILP: A novel clustering approach to select typical and extreme days for multi-energy systems design optimization,” Energy, vol. 181, pp. 1051–1063, Aug. 2019. doi: 10.1016/j.energy.2019.05.044. [Google Scholar] [CrossRef]
7. R. Granell, C. J. Axon, and D. Wallom, “Impacts of raw data temporal resolution using selected clustering methods on residential electricity load profiles,” IEEE Trans. Power Syst., vol. 30, no. 6, pp. 3217–3224, Jun. 2015. doi: 10.1109/TPWRS.2014.2377213. [Google Scholar] [CrossRef]
8. S. Pan, J. Qiao, and L. Zhu, “Application of parallel clustering algorithm based on R in power customer classification,” in IEEE 4th Int. Conf. Cloud Comput. Big Data Anal. (ICCCBDA), Chengdu, China, 2019, pp. 165–169. doi: 10.1109/ICCCBDA.2019.8725760. [Google Scholar] [CrossRef]
9. R. Li, N. Smith, and F. Li, “Multi-resolution load profile clustering for smart metering data,” IEEE Trans. Power Syst, vol. 31, no. 6, pp. 4473–4482, 2016. doi: 10.1109/TPWRS.2016.2536781. [Google Scholar] [CrossRef]
10. R. Q. Sun, X. Q. Xiao, F. Zhou, and Y. S. Zhou, “Research of power user load classification method based on K-means and FSVM,” in Proc. 2019 IEEE 3rd Inf. Technol., Netw., Electron. Autom. Control Conf. (ITNEC), Chengdu, China, 2019, pp. 2138–2142. doi: 10.1109/ITNEC.2019.8729085. [Google Scholar] [CrossRef]
11. I. Panapakidis, T. Papadopoulos, G. Christoforidis, and G. Papagiannis, “Pattern recognition algorithms for electricity load curve analysis of buildings,” Energy Build., vol. 73, pp. 137–145, Apr. 2014. doi: 10.1016/j.enbuild.2014.01.002. [Google Scholar] [CrossRef]
12. S. M. Bidoki, N. Mahmoudi-Kohan, M. H. Sadreddini, Z. P. Jahromi, and M. P. Moghaddam, “Evaluating different clustering techniques for electricity customer classification,” in Proc. IEEE PES T&D 2010, New Orleans, LA, USA, Apr. 2010, pp. 1–5. doi: 10.1109/TDC.2010.5484234. [Google Scholar] [CrossRef]
13. P. Laurinec and M. Lucká, “Clustering-based forecasting method for disaggregated end-consumer electricity load using smart grid data,” in Proc. 2017 IEEE 14th Int. Sci. Conf. Inf., Poprad, Slovakia, Nov. 2017, pp. 210–215. doi: 10.1109/INFORMATICS.2017.8327248. [Google Scholar] [CrossRef]
14. X. Luo, X. Zhu, and E. G. Lim, “A parametric bootstrap algorithm for cluster number determination of load pattern categorization,” Energy, vol. 180, pp. 50–60, May 2019. doi: 10.1016/j.energy.2019.04.089. [Google Scholar] [CrossRef]
15. J. Cui, R. Yu, D. Zhao, J. Yang, W. Ge and X. Zhou, “Intelligent load pattern modeling and denoising using improved variational mode decomposition for various calendar periods,” Appl. Energy, vol. 247, pp. 480–491, Aug. 2019. doi: 10.1016/j.apenergy.2019.03.163. [Google Scholar] [CrossRef]
16. S. Wang, R. Li, A. Evans, and F. Li, “Regional nonintrusive load monitoring for low voltage substations and distributed energy resources,” Appl. Energy, vol. 260, 2020, Art. no. 114225. doi: 10.1016/j.apenergy.2019.114225. [Google Scholar] [CrossRef]
17. M. A. Asadi, H. Samet, and T. Ghanbari, “Ghanbari, k-NN based fault detection and classification methods for power transmission systems,” Prot. Control Mod. Power Syst., vol. 2, no. 32, Aug. 2017. doi: 10.1186/s41601-017-0063-z. [Google Scholar] [CrossRef]
18. X. Liu et al., “A data mining research on office building energy pattern based on time-series energy consumption data,” Energy Build., vol. 259, Mar. 2022, Art. no. 111888. doi: 10.1016/j.enbuild.2022.111888. [Google Scholar] [CrossRef]
19. The US Department of Energy. Data from the Open Energy Information Website. Washington, DC, USA: National Renewable Energy Laboratory, 2023. Accessed: Nov. 29, 2023. [Online]. Available: http://en.openei.org/datasets/dataset [Google Scholar]
20. P. Cihan, “Impact of the COVID-19 lockdowns on electricity and natural gas consumption in the different industrial zones and forecasting consumption amounts: Turkey case study,” Int. J. Electr. Power Energy Syst., vol. 134, Jan. 2022, Art. no. 107369. doi: 10.1016/j.ijepes.2021.107369. [Google Scholar] [CrossRef]
21. P. Cihan, “Time-series forecasting of energy demand in electric vehicles and impact of the COVID-19 pandemic on energy demand,” Sakarya Univ. J. Comput. Inf. Sci., vol. 6, no. 1, pp. 10–21, Apr. 2023. doi: 10.35377/saucis.1209519. [Google Scholar] [CrossRef]
22. Q. Wu, H. Ren, S. Shi, C. Fang, S. Wan and Q. Li, “Analysis and prediction of industrial energy consumption behavior based on big data and artificial intelligence,” Energy Rep., vol. 9, pp. 395–402, 2023. doi: 10.1016/j.egyr.2023.01.007. [Google Scholar] [CrossRef]
23. M. Ali, S. Ullah, M. S. Ahmad, M. Y. Cheok, and H. Alenezi, “Assessing the impact of green consumption behavior and green purchase intention among millennials toward sustainable environment,” Environ. Sci. Pollut. Res., vol. 30, no. 9, pp. 23335–23347, Feb. 2023. doi: 10.1007/s11356-022-23811-1. [Google Scholar] [PubMed] [CrossRef]
24. S. Singh and A. Yassine, “Mining energy consumption behavior patterns for households in smart grid,” IEEE Trans. Emerg. Top., vol. 7, no. 3, pp. 404–419, Apr. 2017. doi: 10.1109/TETC.2017.2692098. [Google Scholar] [CrossRef]
25. S. Thapar, “Energy consumption behavior: A data-based analysis of urban Indian households,” Energy Policy, vol. 143, Aug. 2020, Art. no. 111571. doi: 10.1016/j.enpol.2020.111571. [Google Scholar] [CrossRef]
26. I. Vassileva, F. Wallin, and E. Dahlquist, “Understanding energy consumption behavior for future demand response strategy development,” Energy, vol. 46, no. 1, pp. 94–100, Oct. 2012. doi: 10.1016/j.energy.2012.02.069. [Google Scholar] [CrossRef]
27. Z. Dong, S. Wang, W. Zhang, and H. Shen, “The dynamic effect of environmental regulation on firms’ energy consumption behavior-evidence from China’s industrial firms,” Renew. Sustain. Energ. Rev., vol. 156, Mar. 2022, Art. no. 111966. doi: 10.1016/j.rser.2021.111966. [Google Scholar] [CrossRef]
28. F. Abdoune, L. Ragazzini, M. Nouiri, E. Negri, and O. Cardin, “Toward Digital twin for sustainable manufacturing: A data-driven approach for energy consumption behavior model generation,” Comput. Ind., vol. 150, Sep. 2023, Art. no. 103949. doi: 10.1016/j.compind.2023.103949. [Google Scholar] [CrossRef]
29. S. Pelka et al., “Self-consumption rises due to energy crises? An evaluation of prosumers’ consumption behavior in 2022,” in Proc. 19th Int. Conf. Eur. Energy Market (EEM), Lappeenranta, Finland, Jul. 2023, pp. 1–6. doi: 10.1109/EEM58374.2023.10161968. [Google Scholar] [CrossRef]
30. W. Salas-Zapata, L. Hoyos-Medina, and D. Mejía-Durango, “Urban residential water and electricity consumption behavior: A systematic literature review,” Utilities Policy, vol. 83, Aug. 2023, Art. no. 101590. doi: 10.2139/ssrn.4314049. [Google Scholar] [CrossRef]
Cite This Article
 Copyright © 2024 The Author(s). Published by Tech Science Press.
This work is licensed under a Creative Commons Attribution 4.0 International License , which permits unrestricted use, distribution, and reproduction in any medium, provided the original work is properly cited.
 Downloads
 Citation Tools