
 Submit a Paper
 Propose a Special lssue
 Open Access
ARTICLE

A Situational Awareness Method for Initial Insulation Fault of Distribution Network Based on Multi-Feature Index Comprehensive Evaluation
1 Electric Power Research Institute, China Southern Power Grid, Guangzhou, 510663, China
2 State Key Laboratory of Disaster Prevention and Reduction for Power Grid, Changsha University of Science and Technology, Changsha, 410114, China
3 Electric Power Research Institute of Yunnan Power Grid Co., Ltd., Kunming, 650032, China
4 Qujing Power Supply Bureau of Yunnan Power Grid Co., Ltd., Qujing, 655099, China
* Corresponding Author: Beiyuan Liu. Email:
Energy Engineering 2024, 121(8), 2191-2211. https://doi.org/10.32604/ee.2024.049848
Received 19 January 2024; Accepted 18 March 2024; Issue published 19 July 2024
 View Full Text
 Download PDF
Abstract
Most ground faults in distribution network are caused by insulation deterioration of power equipment. It is difficult to find the insulation deterioration of the distribution network in time, and the development trend of the initial insulation fault is unknown, which brings difficulties to the distribution inspection. In order to solve the above problems, a situational awareness method of the initial insulation fault of the distribution network based on a multi-feature index comprehensive evaluation is proposed. Firstly, the insulation situation evaluation index is selected by analyzing the insulation fault mechanism of the distribution network, and the relational database of the distribution network is designed based on the data and numerical characteristics of the existing distribution management system. Secondly, considering all kinds of fault factors of the distribution network and the influence of the power supply region, the evaluation method of the initial insulation fault situation of the distribution network is proposed, and the development situation of the distribution network insulation fault is classified according to the evaluation method. Then, principal component analysis was used to reduce the dimension of the training samples and test samples of the distribution network data, and the support vector machine (SVM) was trained. The optimal parameter combination of the SVM model was found by the grid search method, and a multi-class SVM model based on 1-v-1 method was constructed. Finally, the trained multi-class SVM was used to predict 6 kinds of situation level prediction samples. The results of simulation examples show that the average prediction accuracy of 6 situation levels is above 95%, and the perception accuracy of 4 situation levels is above 96%. In addition, the insulation maintenance decision scheme under different situation levels is able to be given when no fault occurs or the insulation fault is in the early stage, which can meet the needs of power distribution and inspection for accurately sensing the insulation fault situation. The correctness and effectiveness of this method are verified.Keywords
Statistics show that most power failure accidents are caused by distribution network insulation faults [1]. Based on the analysis of distribution network operation fault data, it is found that the dielectric properties of the insulation layer will deteriorate due to the aging phenomenon, and timely detection of initial insulation faults before the permanent breakdown of insulation will help prevent the failure from developing into a major accident [2]. In terms of research on online insulation monitoring of power grids, the earliest research was carried out on insulation monitoring of low-voltage distribution networks, which usually use leakage protection to monitor insulation status [3]. So far, researchers have proposed a variety of insulation monitoring methods. Some scholars carry out insulation monitoring by establishing the life estimation model of insulated cables [4]. Some researchers have proposed a method for insulation monitoring of transformers using fiber optic sensors [5]. Some researchers use deep learning algorithms to identify cable insulation defects and monitor cable insulation status [6]. These insulation monitoring methods can not directly perceive the development of insulation faults, and the effect is not good when applied to engineering practice. Therefore, it is particularly important to study the effective analysis method of distribution network insulation state and timely perceive the development trend of distribution network insulation fault to ensure the safe and reliable operation of the power system.
As a pattern recognition method with strong generalization ability, support vector machines (SVM) have been widely used in the field of power grid protection fault identification [7]. Reference [8] proposed a high-impedance arc fault identification and improved protection strategy for power grids. The measurement units arranged in power grids were used to collect data, and SVM was used to identify high-impedance arc fault types. Reference [9] proposed a fault identification method for intelligent distribution networks, based on voltage and current measurement values of lines, using multi-class SVM and other models to achieve fault identification. In [10], the Hilbert-Yellow transformation is performed on the current transient signal, and then the energy features of the current component are extracted as the eigenvector input model to realize the identification of short-circuit fault types in the distribution network. However, most of the research on fault type identification methods is oriented to the scenario where the fault has already occurred, and few involve the research on predicting the development trend of the distribution network fault before the fault occurs.
The new generation of information technology, especially the development of big data processing, cloud computing, and other technologies [11], has enabled artificial intelligence technology to have a strong ability to capture, analyze, and manage data [12]. Based on artificial intelligence technology, it can well meet the intelligent perception requirements of distribution network faults under the new situation [13]. Distribution network monitoring and management system configuration is increasingly mature, numerous distribution network data systems provide massive and rich multi-source heterogeneous data, which is an important data support for the use of big data technology to characterize distribution network insulation status, and network coordination and optimization data are possible [14]. To extract valuable information from massive power grid data and effectively select and utilize it, it is necessary to grasp the internal correlation and law of distribution network data [15] and extract the main factors affecting the operation of the distribution network [16]. On this basis, considering the influence of external environmental conditions of the distribution network [17], the accurate perception of the development status of the initial insulation fault of the distribution network has become a key issue in the analysis and research of the insulation fault of the distribution network [18].
At present, most cities have multiple distribution management systems, including distribution network data acquisition and monitoring systems, distribution automation systems, power grid meteorological information systems, dispatch automation systems, power quality detection, and management systems, geographic information systems, and intelligent public distribution monitoring systems. These data sources cover multiple management services such as scheduling, operation and inspection, and marketing, as well as most power grid monitoring and collection information of multi-voltage levels of 110 kV and below [19]. Reference [20] proposed a distribution network fault location method based on multi-source information fusion, which realizes the fault location of overhead cable hybrid lines of distribution network by using voltage, current, active power, and reactive power data. Based on the multi-source data support of distribution automation and other systems, Reference [21] developed a distribution network fault information statistical management system to realize the statistical analysis of distribution network fault information under different operating states. Considering that the multi-source heterogeneous data of the distribution network contains rich information [22], it is necessary to apply artificial intelligence technology to extract the features with a high contribution rate to the insulation fault situation of the distribution network from the distribution network data [23]. The information process of power systems in all aspects of power generation, transmission, transformation, distribution, and power consumption continues to advance, and a large number of valuable real-time and quasi-real-time data of power grid and customer service data information resources have been accumulated [24]. All kinds of business data have been quite large-scale in terms of total amount and types, providing good basic data support for distribution network insulation fault situation analysis [25].
Based on the analysis and research of the insulation fault mechanism in distribution networks, this paper selected 9 indices that effectively characterize the insulation state of distribution lines. Additionally, it designed a relational database for the distribution network based on data support from an existing distribution management system. Considering various fault factors and power supply regions, this paper proposed an evaluation method for the initial insulation fault situation in distribution networks. To reduce the dimensionality of distribution network fault data samples which contain 6 markers representing different insulation situations, principal component analysis (PCA) is employed. Subsequently, a SVM model is trained using the reduced dimensional data, and a multi-class SVM model based on the 1-v-1 method is constructed. Finally, prediction sets are inputted into the trained multi-class SVM to predict situation levels with an accuracy of not less than 90%. The accurate prediction of insulation fault situation level under different grounding modes of the distribution network is realized.
This paper is mainly divided into five parts. The first part provides a detailed description of the selection basis for the evaluation index of distribution network insulation situation in this study, which serves as the foundation for theoretical research on constructing a distribution network insulation fault situation awareness system. The second part presents an initial method for assessing insulation fault situations in distribution networks and proposes specific quantitative indices to measure the risk associated with these faults. The third part explains the methodology used to process fault data and introduces the algorithm employed to predict distribution network situations. The fourth part focuses on simulating and verifying the proposed method, providing predictions under different fault conditions and highlighting its advantages compared to other approaches. Lastly, the fifth part conducts experimental verification of the proposed method, further confirming its applicability and correctness in practical engineering applications.
2 Distribution Network Insulation Situation Evaluation Index Selection
To select a suitable insulation situation evaluation index, this section analyzes and studies the fault mechanism of electric arc insulation in distribution network. It is found that ground residual voltage and current are generated after the grounding fault occurs in the distribution network, which affects the insulation state of the distribution network lines. The residual voltage is proportional to the transition resistance, and the residual current is inversely proportional to the transition resistance. The asymmetry of the system can reflect the transition resistance sensitively, and the greater the asymmetry, the more likely it is to cause overvoltage and overcurrent, and the more serious the insulation damage of the distribution network line. There is a big difference between the damping rate and the fault time of the distribution network, and the insulation state of the distribution network can be characterized and warned according to the damping rate. When the fault occurs in the distribution network, the neutral voltage and the capacitance current of the system are inversely proportional to the transition resistance and decrease with the increase of the transition resistance. Still, they are different from the capacitance current before the fault. According to the capacitance current of the system, the insulation state of the distribution network can also be judged. The transition resistance Rf is the essential cause of the change of residual voltage, residual current, asymmetry Ks damping rate d, zero sequence admittance angle θ (Y∑), capacitance current Ic, and other index parameters at the fault point, which further affects the insulation state of distribution network. The relationship between transition resistance Rf and residual voltage, residual current, asymmetry Ks, damping rate d, zero sequence admittance angle θ (Y∑) and capacitance current Ic at the fault point of the distribution network is shown in Table 1. Through the research of insulation deterioration and insulation fault mechanism, we find that the development process of single-phase insulation fault in distribution network is similar to that of other grounding insulation faults. The transition resistance in Table 1 is the ground resistance of the single-phase ground fault. Table 1 uses the single-phase grounding insulation fault as an example to describe the trend of each characteristic indicator as the transition resistance changes. Other grounding insulation faults follow similar insulation degradation rules.
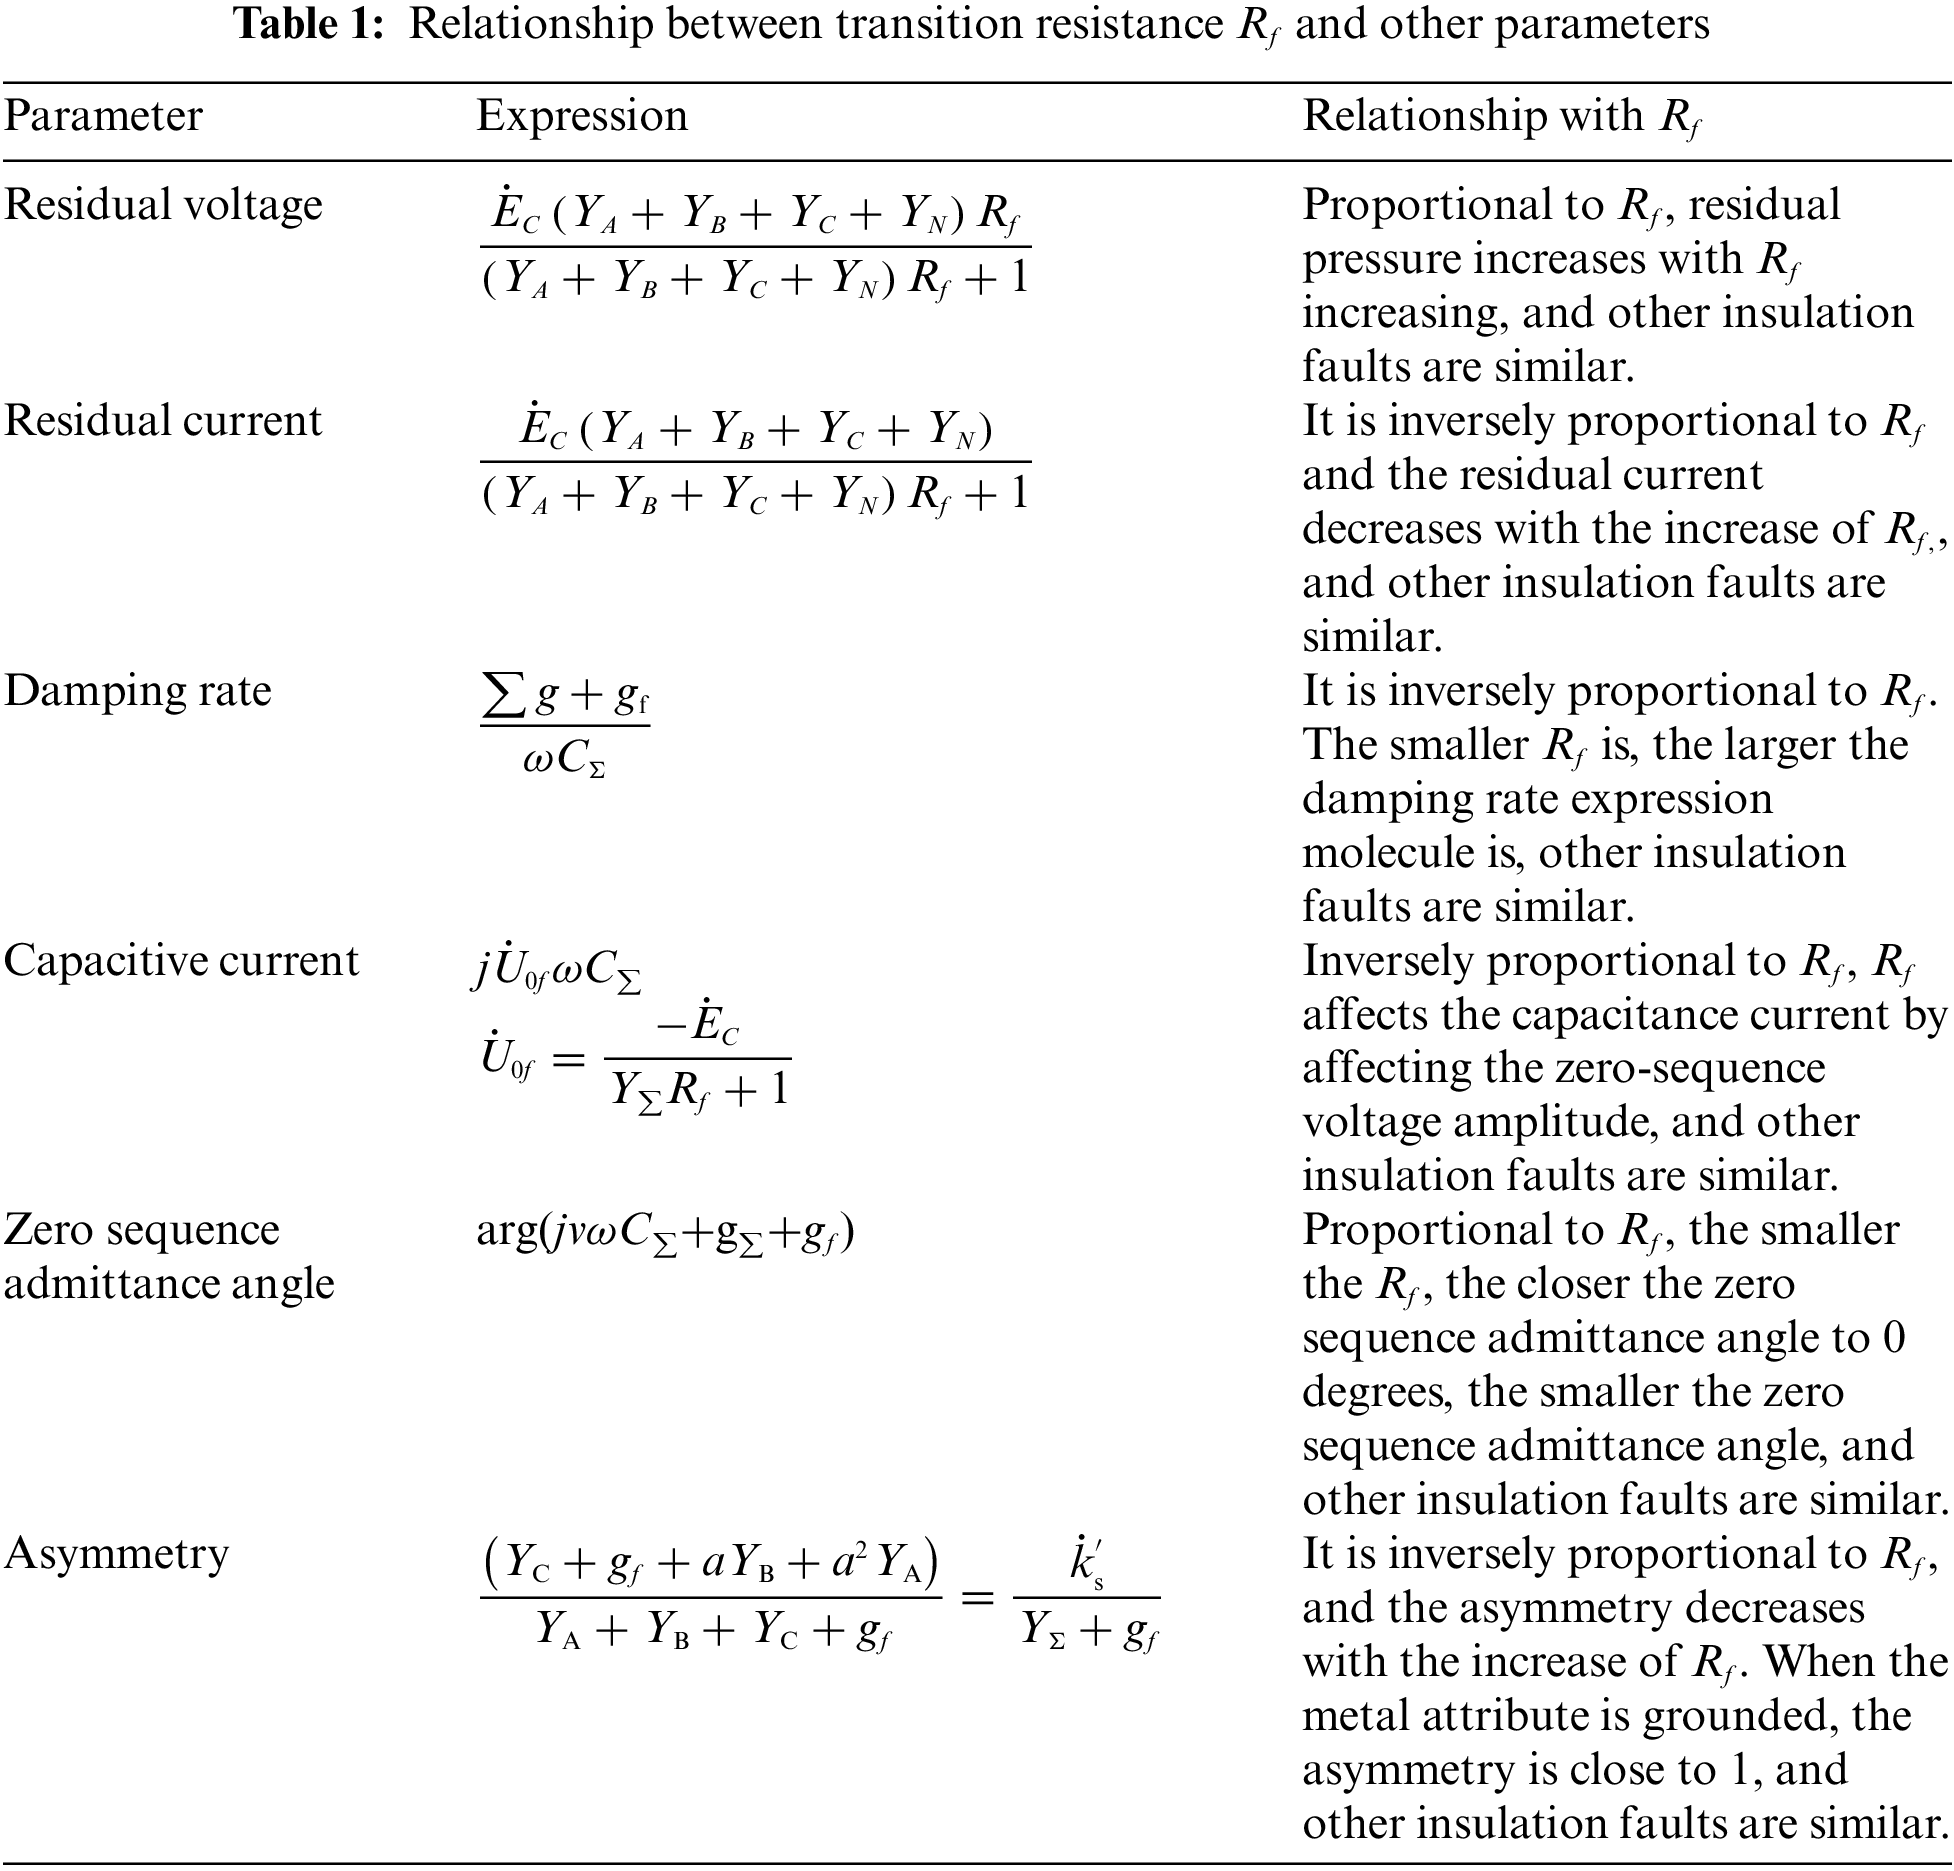
The expressions in Table 1 are obtained with the system phase C as the fault phase. Ec is the electrodynamic force of the C-phase power supply, YX (X = A, B, C) is the ground admittance of the three phases of the feeder line, respectively, YN is the neutral ground admittance, ∑g is the total conductance of the distribution network to the ground, gf is the transition conductance of the fault point, ω is the system frequency, Y is the total admittance of the system to the ground, C is the total capacitance of the distribution network to the ground, U0f is the zero sequence voltage when the ground fault occurs. a = ej120 is the phasor operator. In particular, it is worth noting that the transition resistance affects the capacitive current by affecting the magnitude of the zero-sequence voltage amplitude. Since the zero sequence voltage is inversely proportional to the transition resistance, and the zero sequence voltage is proportional to the capacitive current, the capacitive current is inversely proportional to the transition resistance. It can be seen from Table 1 that the change of transition resistance Rf will correspondingly cause changes in residual voltage, residual current, asymmetry Ks, damping rate d, zero sequence admittance angle θ (Y∑) and capacitive current Ic at the fault point of distribution network. Further analysis shows that the smaller the transition resistance Rf is, the greater the offset of the above index parameters relative to normal conditions of the distribution network. The operating environment is worse, the phenomenon of system overvoltage and overcurrent will be more obvious, and the harm to the insulation state of distribution network lines will be greater.
By analyzing the mechanism of insulation fault in distribution network, the following 9 distribution network data characteristics are selected for subsequent insulation fault situational awareness: Fault residual voltage, fault residual current, asymmetry, damping rate, zero sequence admittance angle, capacitive current, off tuning degree, transition resistance, and fault duration. These characteristics can effectively characterize the insulation state of distribution lines, and provide support for the subsequent insulation situation level prediction of distribution networks.
3 Evaluation Method of Initial Insulation Fault Situation of Distribution Network
3.1 Insulation Fault Risk Factor and Regional Risk Factor
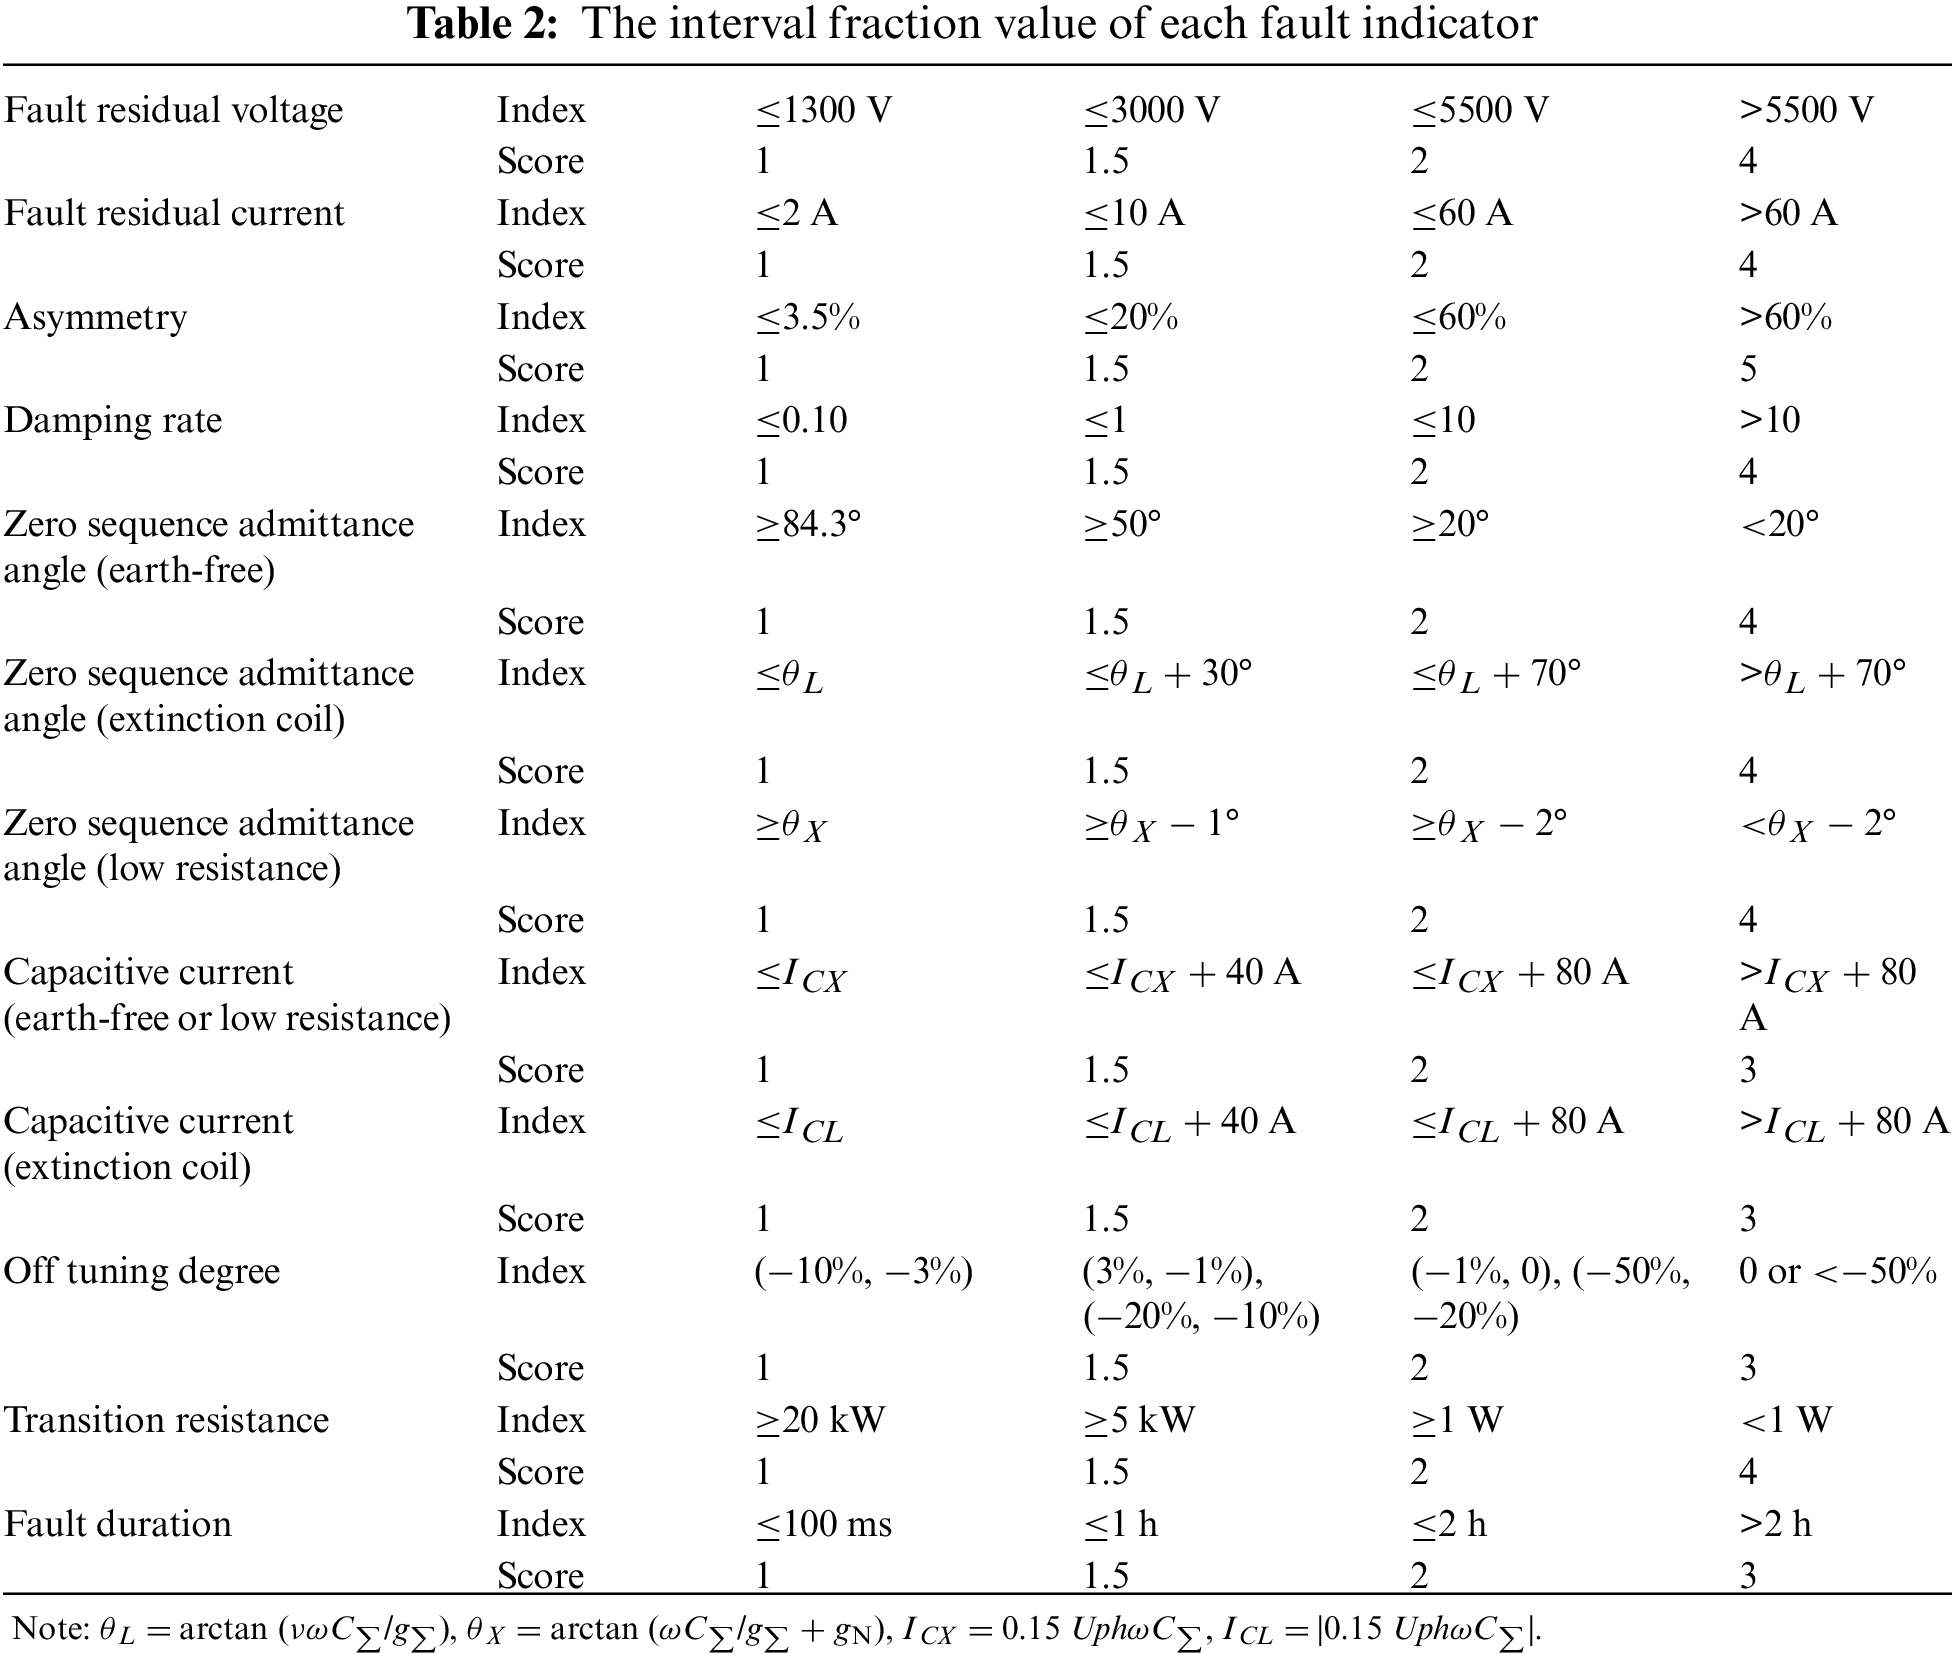
According to the research results of the insulation fault mechanism of the distribution network in Section 1 of this paper and the requirements of safe and stable operation of the distribution network, this section adopts fault point residual voltage, fault point residual current, asymmetry, damping rate, zero sequence admittance angle, capacitive current, detuning degree, transition resistance, fault duration and other indicators to synthesize the distribution network insulation fault risk characterization factor Fe. The specific calculation formula of Fe is shown in Eq. (1).
In Eq. (1): Fe is the risk factor of insulation fault. Pe1, Pe2,..., Pen refers to the score value obtained in Table 2 after the distribution network insulation fault occurs.
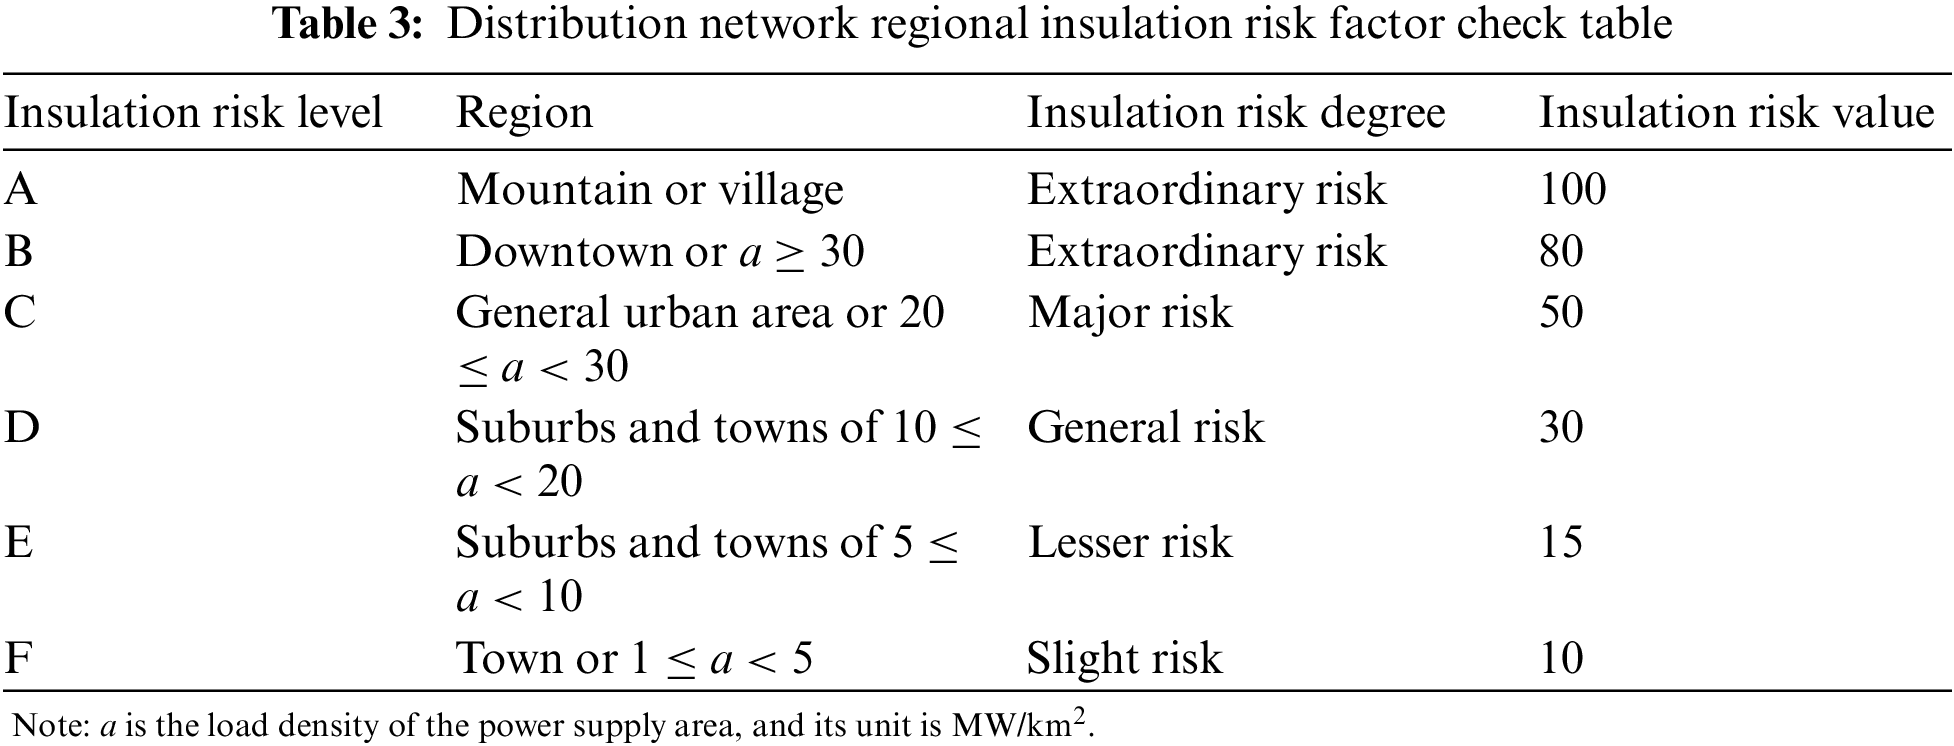
The different power supply areas of the distribution network also affect the development trend of insulation faults to different degrees. According to the power supply area where the distribution network is located and the load density of the power supply area, set the regional insulation risk factor check table as shown in Table 3. The distribution network with the lowest insulation risk in the distribution network area (set as the lowest level F) is set as the reference value of the factor value Fa (Fa = 10), and the risk factor values of F, E, D, C, B and A are successively increased.
3.2 Insulation Fault Situation Level Evaluation
Firstly, the insulation fault risk factor Fe is obtained according to Eq. (1). Secondly, according to the region where the distribution network is located, check the regional insulation risk check table of the distribution network, and select the regional risk factor value Fa. Then, the total value Pf of the insulation fault situation is obtained by Eq. (2).
After calculating the total score value Pf, the evaluation result of the insulation fault situation level of the distribution network can be obtained by comparing it with the score level. The power distribution network insulation fault status level evaluation method sets up 6 status levels:
(1) Level Ⅰ : The total value Pf > 8000 indicates that the insulation situation of the distribution network is serious, and a high probability of insulation failure has occurred. It is necessary to immediately locate the insulation damage location of the distribution network, troubleshoot and replace the insulation fault, and restore the normal operation of the distribution network.
(2) Level II: 5000< total value Pf ≤ 8000, the distribution network insulation situation is very poor, the future is highly likely to occur insulation faults affect the safe and stable operation of the distribution network, need to take timely measures to replace or maintain poorly insulated lines and equipment.
(3) Level III: 3000< total value Pf ≤ 5000, the insulation situation of the distribution network is poor, and there is a greater probability of insulation faults in the future. It is necessary to check, test regularly, and replace or maintain the weak insulation position. It is recommended to monitor and inspect the insulation status of the distribution network every seven days.
(4) Level IV: 1500< total value Pf ≤ 3000, the insulation situation of the distribution network is normal, the insulation fault may occur in the future, it is necessary to regularly monitor and inspect the insulation status of the distribution network, and design countermeasures for insulation fault. It is recommended to inspect the insulation status of the distribution network every 25 days.
(5) Level V: 1000< total value Pf ≤ 1500, the distribution network insulation situation is good, there is no insulation fault, the distribution network can operate safely and stably, and it is necessary to regularly monitor and inspect the insulation status of the distribution network. It is recommended to inspect the insulation status of the distribution network every 40 days.
(6) Level VI: The total value Pf ≤ 1000, the distribution network insulation situation is very good, the probability of insulation fault is low, and the long-term safe and stable operation of the distribution network.
The classification of the distribution network insulation fault situation is shown in Fig. 1.
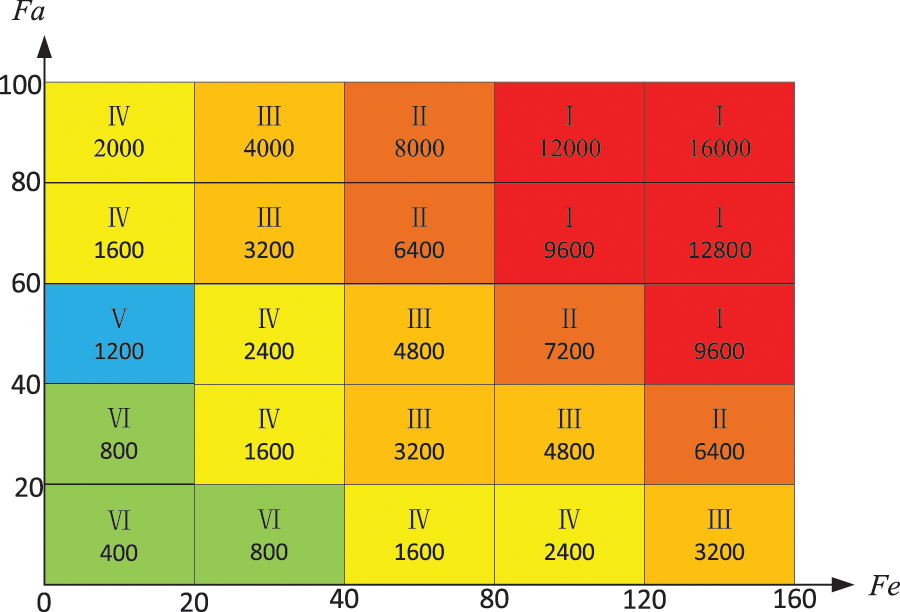
Figure 1: Distribution network insulation fault situation classification
4 Fault Situation Awareness of Distribution Network Based on PCA and Multi-Class SVM
4.1 Dimensionality Reduction of Distribution Network Data Based on PCA
In the initial insulation fault state perception process of the distribution network, although it is hoped that there are rich data to comprehensively reflect the effects of various factors on the state of the distribution network, the indicators obtained in most cases are complex and have different impacts on the distribution network. The direct utilization of these indicators for predicting insulation fault in distribution networks may not accurately perceive the situation, but it can potentially impact the accuracy of the model. Therefore, it is necessary to identify and extract from massive multi-source data and numerous fault feature indicators that reflect the high contribution degree of distribution network state and high feature accuracy and eliminate redundant features with a low contribution degree. In this paper, the 9-dimensional features mentioned in Section 2 are extracted and converted to a 4-dimensional coordinate system by principal component analysis, and redundant features are removed.
(1) The first step in dimensionality reduction is zero-mean processing. In Section 2 of this paper, the data feature selected for dimensionality reduction is as follows: Fault residual voltage, fault residual current, asymmetry, damping rate, zero sequence admittance angle, capacitive current, off-tuning degree, transition resistance, and fault duration. First, the average values of 9 features are obtained, respectively, and then the corresponding average values are subtracted from the original data of each feature to obtain a new zero-mean feature matrix Xn × m.
(2) The second step of data dimensionality reduction is to find the feature covariance matrix and identify the correlation according to the feature covariance matrix. Eq. (3) represents the feature matrix, where each column vector represents a set of data, and each set of data contains several features. Each row of the column vector represents a feature of the data. Where n is the number of features and m is the number of samples (that is, the number of groups of data). The distribution network data feature number is 9, so set n = 9. Thus, the covariance matrix A can be obtained as shown in Eq. (4).
(3) The third step in dimensionality reduction is to identify the principal components by solving the eigenvalues and eigenvectors of the covariance matrix A using SVD. The covariance matrix shown in Eq. (4) above exists in the singular value decomposition form shown in Eq. (5). Eq. (5) is the singular value decomposition form of covariance matrix A, where U is composed of the unitized AAT eigenvector and is the left singular vector, and V is composed of the unitized ATA eigenvector and is the right singular vector. The ∑ matrix is a diagonal matrix formed by taking the square root of the eigenvalues of AAT or ATA, and each element on the main diagonal is a singular value arranged from largest to smallest. Therefore, we can use Eq. (5) for singular value decomposition of covariance matrix A to solve its eigenvalues and corresponding eigenvectors.
(4) The fourth step in data dimensionality reduction is to achieve data feature dimensionality reduction by creating feature vectors that determine which principal components to retain and recasting the data along the principal component axis. The 9 kinds of eigenvalues extracted and calculated above are arranged in order from largest to smallest, and the first 4 largest eigenvalues are found and the corresponding 4 eigenvectors are used to form a new coordinate system. Finally, the original matrix extracted by the algorithm in this paper is projected to a new coordinate system with the eigenvector matrix as the axis, and the original extracted eigenmatrix is converted to 4-dimensional (4 < 9). In Eq. (5), if λ1 is the largest eigenvalue of ∑ and α1 is the eigenvector corresponding to λ1, then α1 is the first principal component. If λ2 is the second largest eigenvalue of ∑, α2 is the eigenvector corresponding to λ2, i.e., the second principal component. Similarly, the third principal component and the fourth principal component can be found, that is, α3, α4, whose coefficients are the eigenvalues λ3 and λ4 corresponding to ∑.
4.2 Distribution Network Insulation Situational Awareness Based on Multi-Class SVM
According to the evaluation method of distribution network insulation fault situation level described in Section 3.2 of this paper, a total of 6 insulation fault situation levels are set, and the SVM is required to predict one of the 6 situation levels as output. Aiming at the multi-classification problem of insulation fault situation level prediction in the distribution network, the SVM method is proposed for insulation fault situational awareness. However, the traditional SVM usually uses the binary classification pattern recognition method, which cannot be directly used to solve this multi-classification problem. Therefore, in order to accurately perceive the insulation fault situation of the distribution network, the multi-classification function of SVM needs to be expanded.
The objective of this paper is to achieve multi-classification functionality for the 6 levels of distribution network insulation fault states by constructing a combination of two classifiers. Specifically, the 1-v-1SVMs algorithm is utilized to identify the insulation fault state in the distribution network. A classifier is trained between two types of distribution network insulation fault situation levels based on the 1-v-1SVMs method using a dataset specific to distribution network insulation faults. Consequently, a total of 15 classifiers need to be trained for the 6 different insulation situation levels. The structure of the multi-class SVM based on the 1-v-1 method can be seen in Fig. 2.
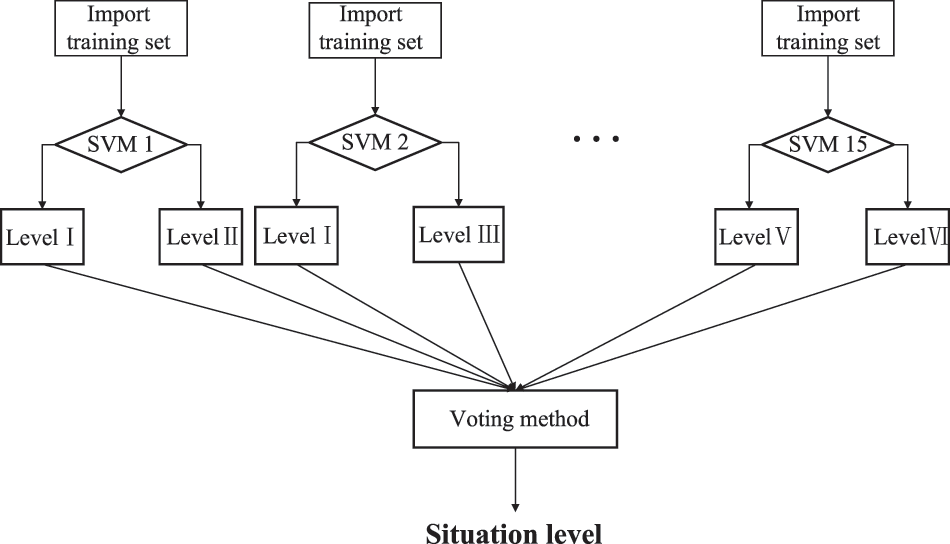
Figure 2: Multi-class SVM structure based on 1-v-1 method
The selection of SVM parameters for distribution network insulation fault situation awareness mainly includes three steps: Selecting the appropriate kernel function, determining the parameters of the kernel function, and selecting the regularization parameter C. In this paper, the radial basis kernel function is chosen as the kernel function of SVM for the classification of insulation fault situation level prediction in the distribution network. The choice of parameters gamma and C in the radial basis kernel function will greatly affect the prediction performance of the subsequent SVM. To find the optimal gamma value and regularization parameter C, the grid search method is used in this paper. The gamma value of the radial basis kernel function is used to adjust the kernel width, and both the gamma value and the C value in SVM control the complexity of the model.
In this paper, the grid search method is used to select the optimal combination of gamma and C parameters. Set alternative parameter gamma to 0.001, 0.01, 0.1, 1.0, 10, 100; Set the value of alternative C to 0.01, 0.1, 0.5, 1, 2, 10, and 100. There are 42 permutations and combinations of the two parameters. Based on the Python platform, the GridSearchCV grid search module in the sklearn machine learning toolkit is called to find the optimal combination of gamma and C in the permutation combination of parameter gamma and parameter C. The approximate flow chart is shown in Fig. 3. The search accuracy results of SVM grid search method based on the above parameter combination are shown in Fig. 4.
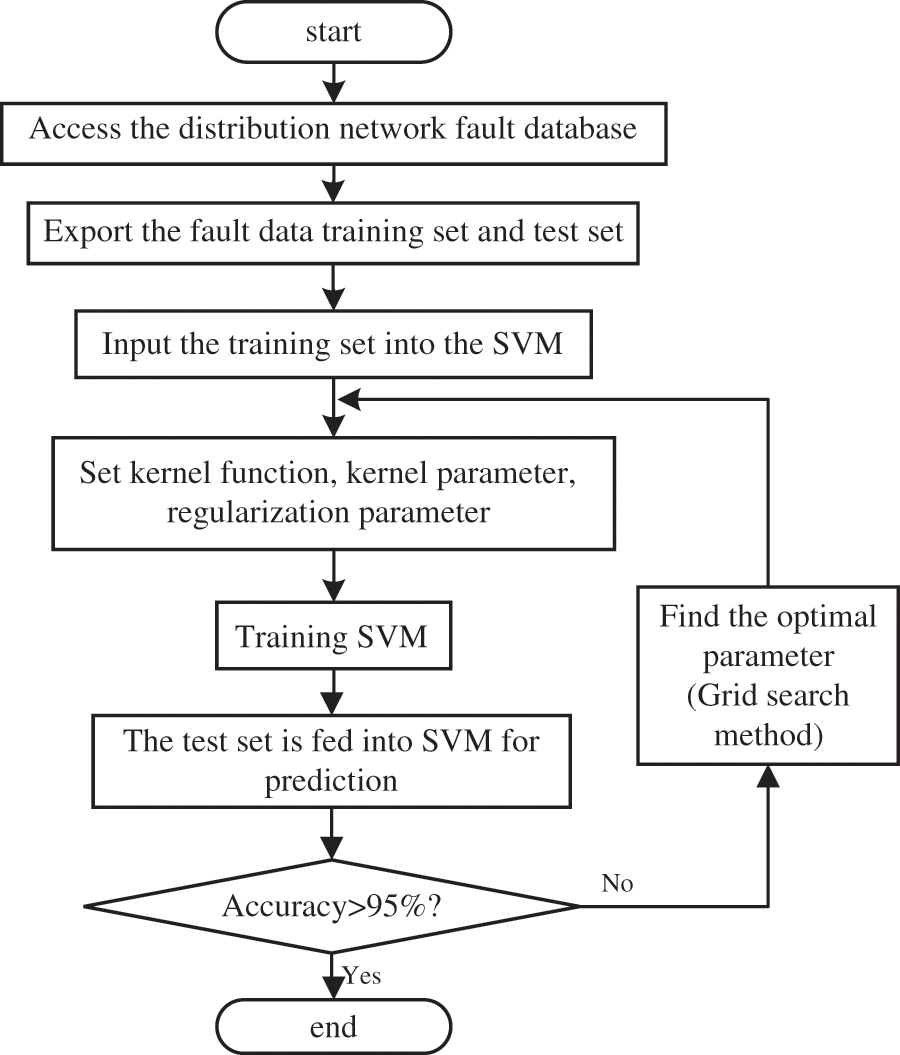
Figure 3: SVM parameter selection flowchart
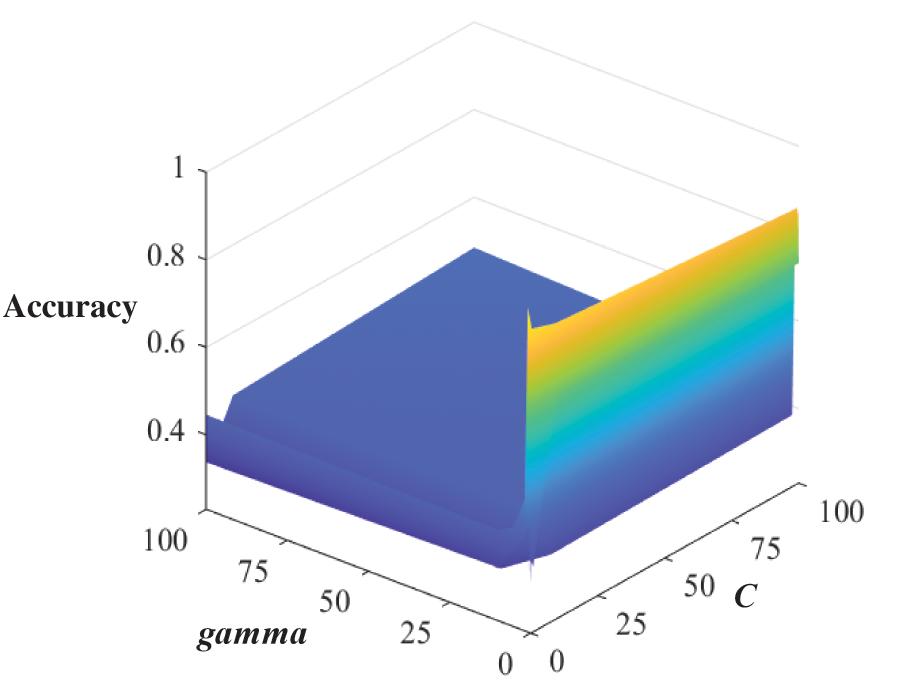
Figure 4: Grid search method SVM parameter selection results
In the three-dimensional coordinates in Fig. 4, the vertical coordinates represent the classification accuracy, and the horizontal and vertical coordinates represent the values of parameters gamma and C, respectively. It can be seen from the accuracy result chart that the corresponding accuracy of most parameter combinations is below 90%, and the accuracy of parameter combinations gamma = 1 and C = 0.1 is the highest, reaching 96.2%. Using the grid search method to replace the subjective setting of SVM parameters can better avoid the phenomenon of underfitting and overfitting in SVM, and help improve the perception accuracy of SVM in the face of new data situations. In the training process, with the increase in training times, the change in model loss function is shown in Fig. 5, and the change in accuracy rate is shown in Fig. 6. It can be seen that when the training times reach 25, the model loss function tends to a small value. When the training times reach more than 35, the prediction accuracy of the model can be stable at more than 95%. At this point, the construction of the distribution network insulation fault state sensing SVM has been completed.
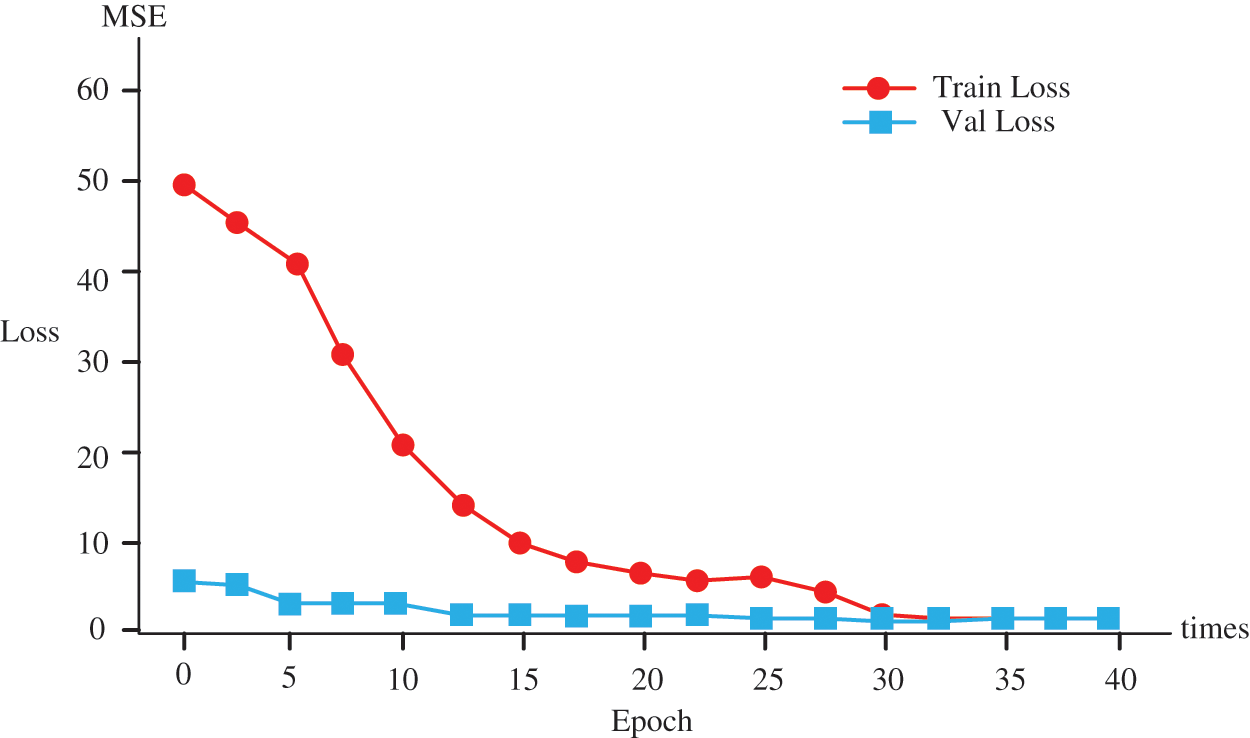
Figure 5: Loss function of model training and validation process
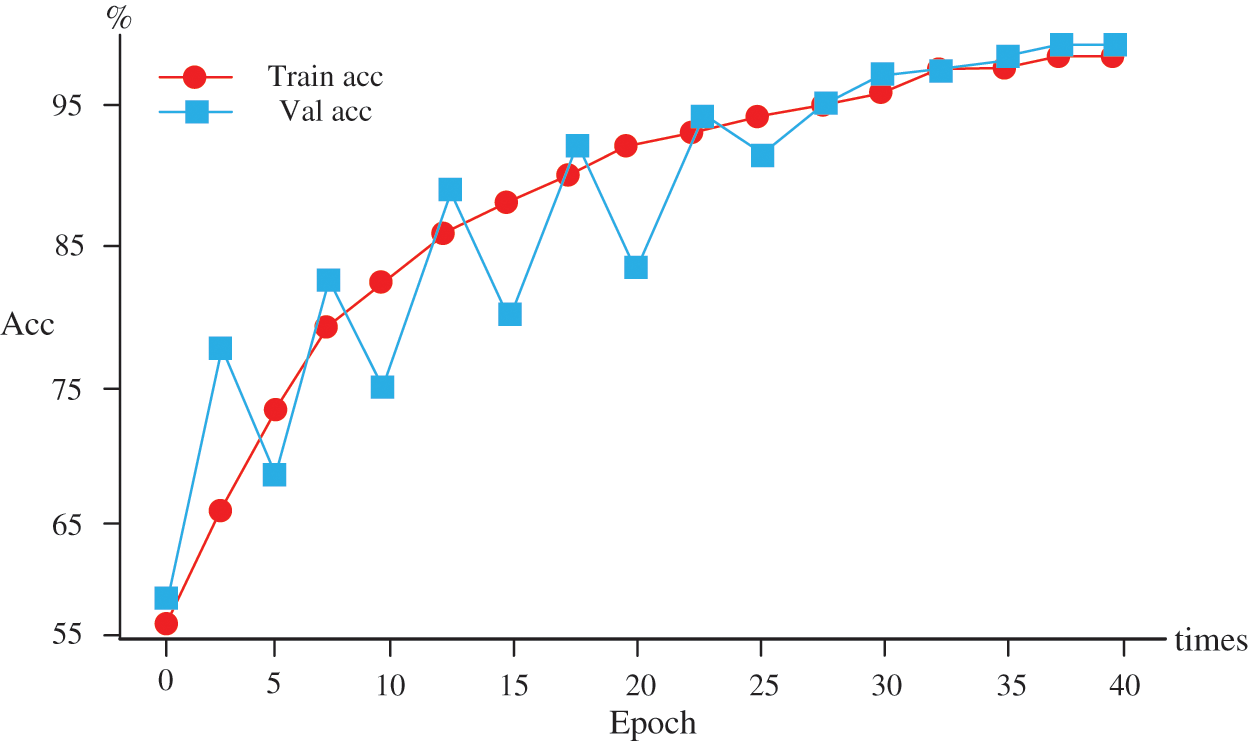
Figure 6: Accuracy of model training and verification process
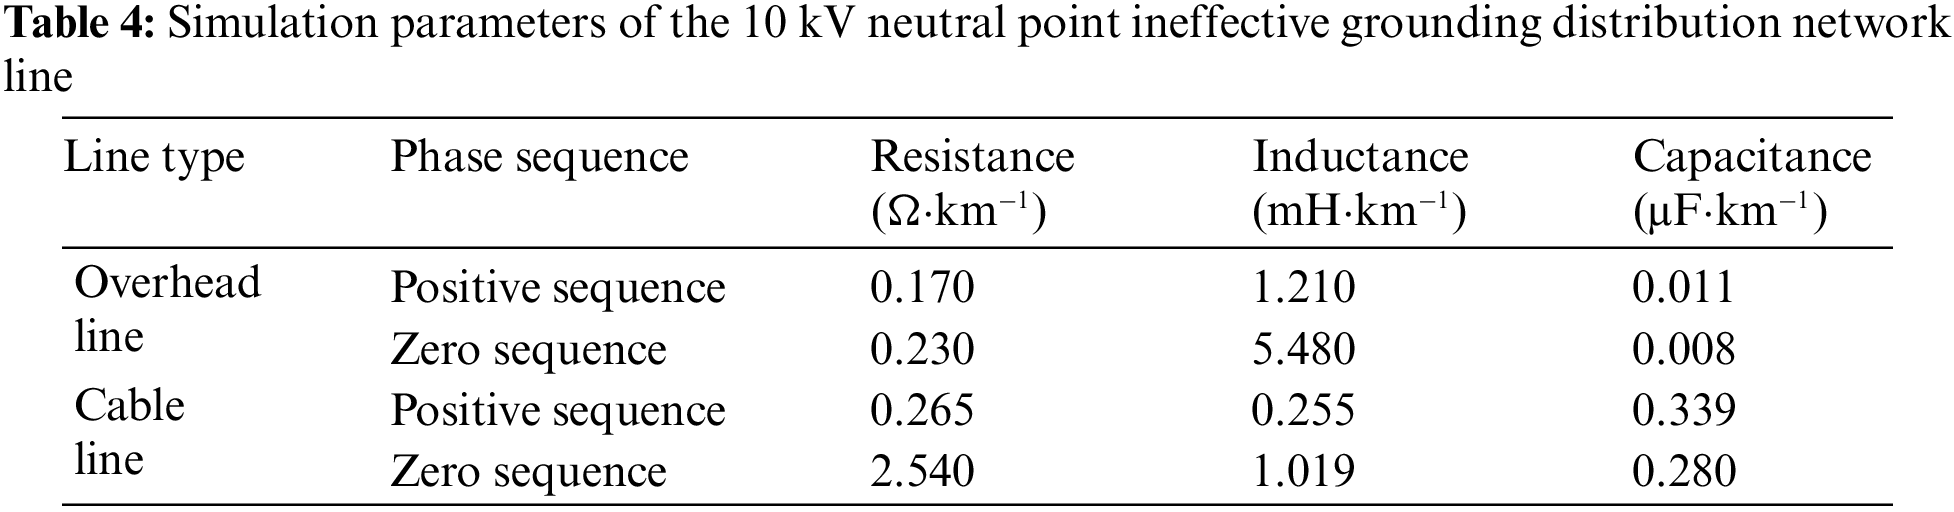
In this paper, based on the PSCAD/EMTDC simulation environment, a 10 kV distribution network model with ineffective grounding at the neutral point is built to verify the effectiveness and accuracy of the proposed method. The occurrence of insulation faults at different positions of the line under different grounding modes of neutral points is simulated, respectively. The simulation model is shown in Fig. 7. The five distribution feeders include overhead lines, cable lines, and cable-overhead hybrid lines, assuming that the load is 0.5 + j0.25 MVA, the line parameters are listed in Table 4. YN is the neutral ground admittance of the system, and different YN values can simulate different grounding modes. By setting various types of insulation faults in different distribution network line locations, the distribution network fault data is obtained by running the simulation model.
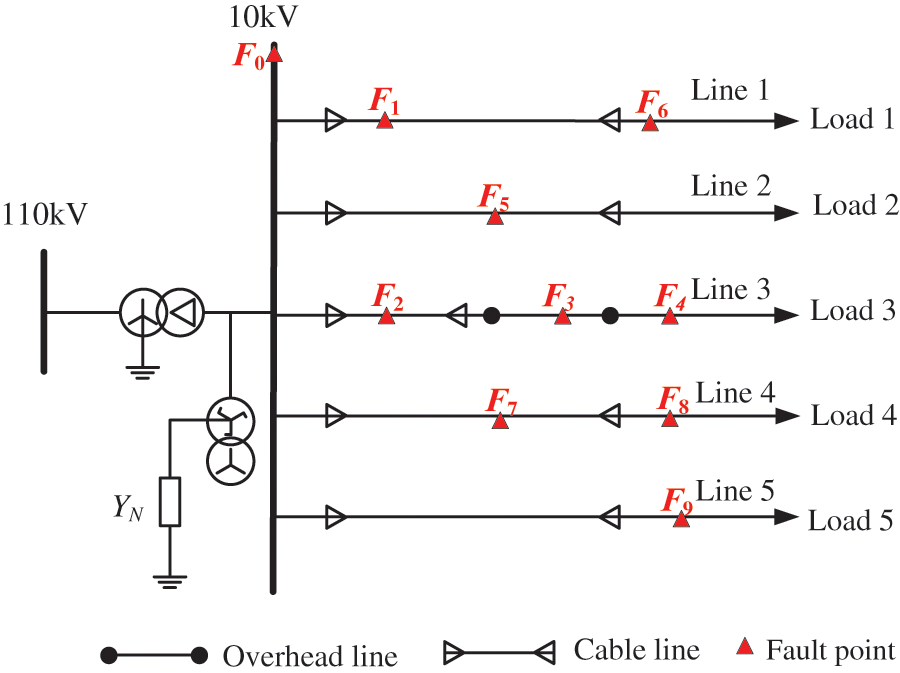
Figure 7: Neutral point ineffective grounding 10 kV distribution system model
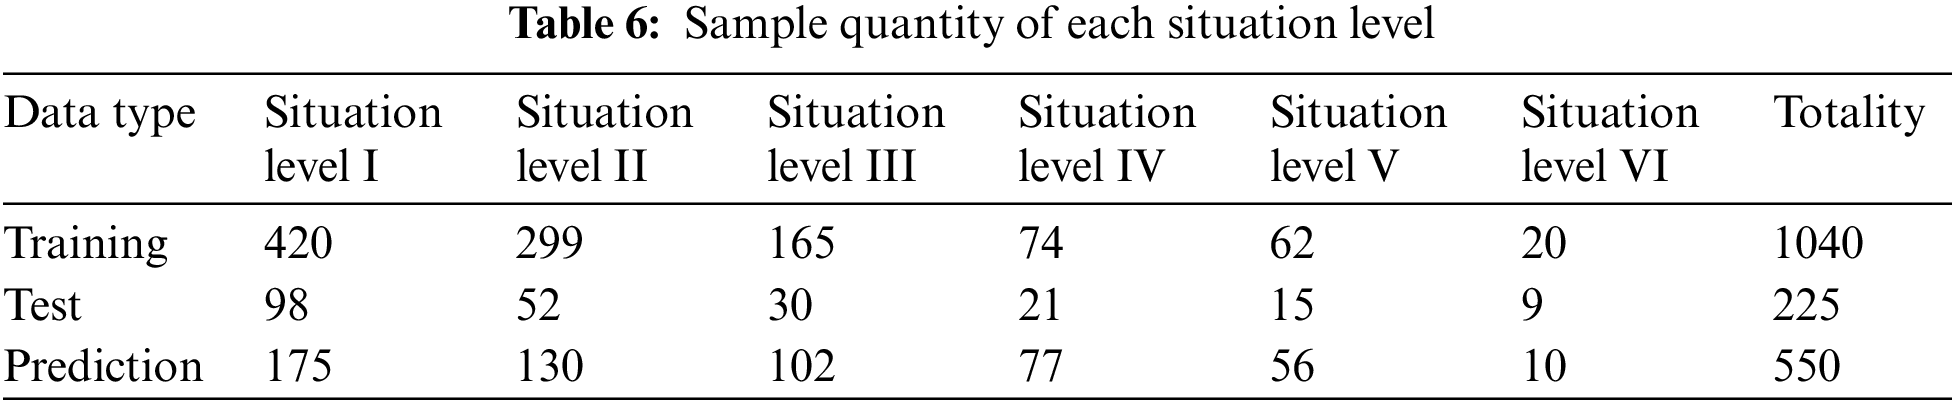
In Fig. 5, F0−F9 is set as the fault points for constructing samples, and 10 fault types are set for each fault point. Sample data is obtained through simulation by changing the transition resistance and initial phase angle of the fault point. Among them, the fault points F1 and F2 are 4 km away from the bus bar, F5 and F7 are 7 km away from the bus bar, F3 is 8 km away from the bus bar, F4, F6, F8, and F9 are 10 km away from the bus bar, and F0 is used to simulate the fault occurring at the neutral exit. The fault data of F1−F3 and F0 points are used as the training set, the fault data of F4−F6 and F0 points are used as the test set, and the fault data of F7−F9 and F0 points are used as the prediction set. The distribution of the obtained training samples, test samples, and prediction samples is shown in Table 5. According to the calculation method of insulation fault situation level described in Section 3 of this paper, the situation level of the fault sample is calculated by using the fault index data, and the sample is labeled. After removing redundant and incorrect samples, the sample quantity of each insulation fault situation level is shown in Table 6.

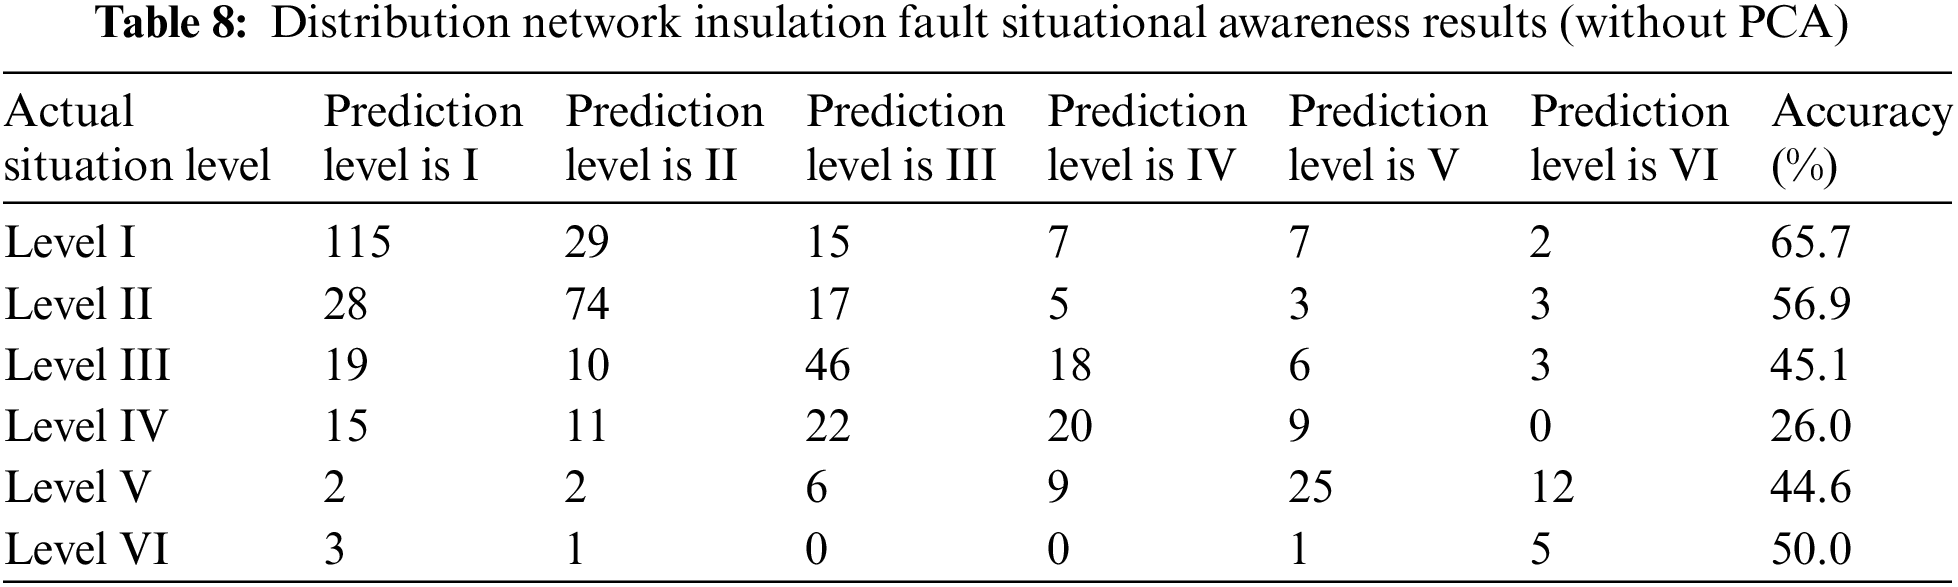
Using the neutral point ungrounded method, the insulation fault phase, insulation fault location, fault initial phase angle, transition resistance, and other factors were comprehensively considered, and the test samples in Table 5 were used to test the prediction effect of the proposed insulation situational awareness method. The results of situational awareness using PCA are shown in Table 7, where situational awareness accuracy is the ratio of the number of accurate prediction samples to the total number of corresponding situation-level samples. The results of situational awareness without PCA are shown in Table 8. It can be seen that PCA can extract the indexes with high feature accuracy and large contribution degree of distribution network state, and eliminate redundant features with small contribution degree, which can help significantly improve the accuracy rate of distribution network insulation fault situational awareness model prediction.
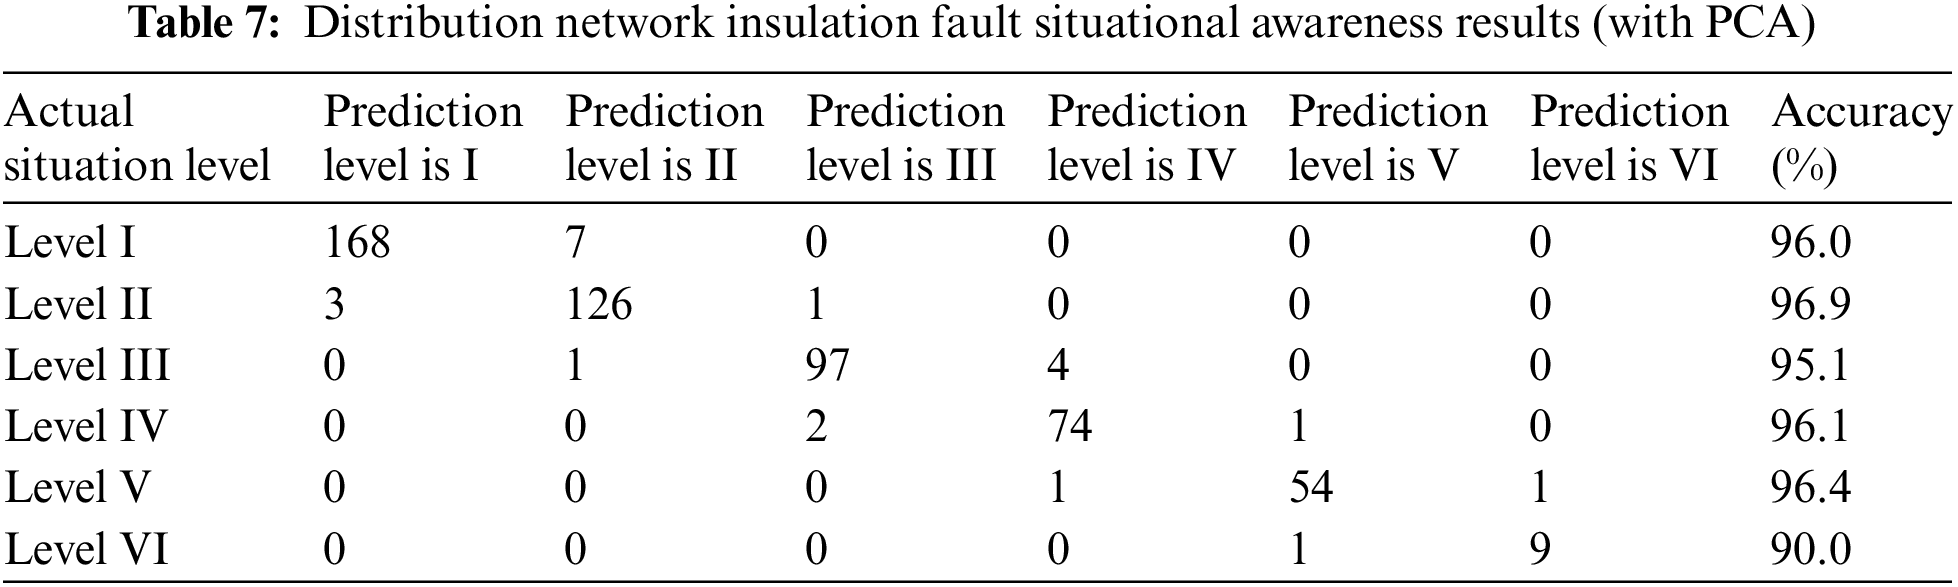
As can be seen from Table 7, the perception accuracy of each level except situation level VI is above 95%. The perception accuracy of 4 situation levels is above 96%. The average perception accuracy of 6 situation levels is 95.08%, indicating that the situational awareness method proposed in this paper has high accuracy and practicability. The perception accuracy of situation level VI is low because the number of original samples of this level is too small. The perceptual error samples only deviate by one situation level at most, and do not cross two situation levels, which indicates that the robustness of the proposed method is strong. In the original samples, 85% of the samples were classified as Ⅰ, II and III, and only 15% were classified as IV, V and VI, which can focus on sensing the more urgent insulation fault situation of the distribution network, and meet the requirements for accurate and rapid sensing of insulation situation.
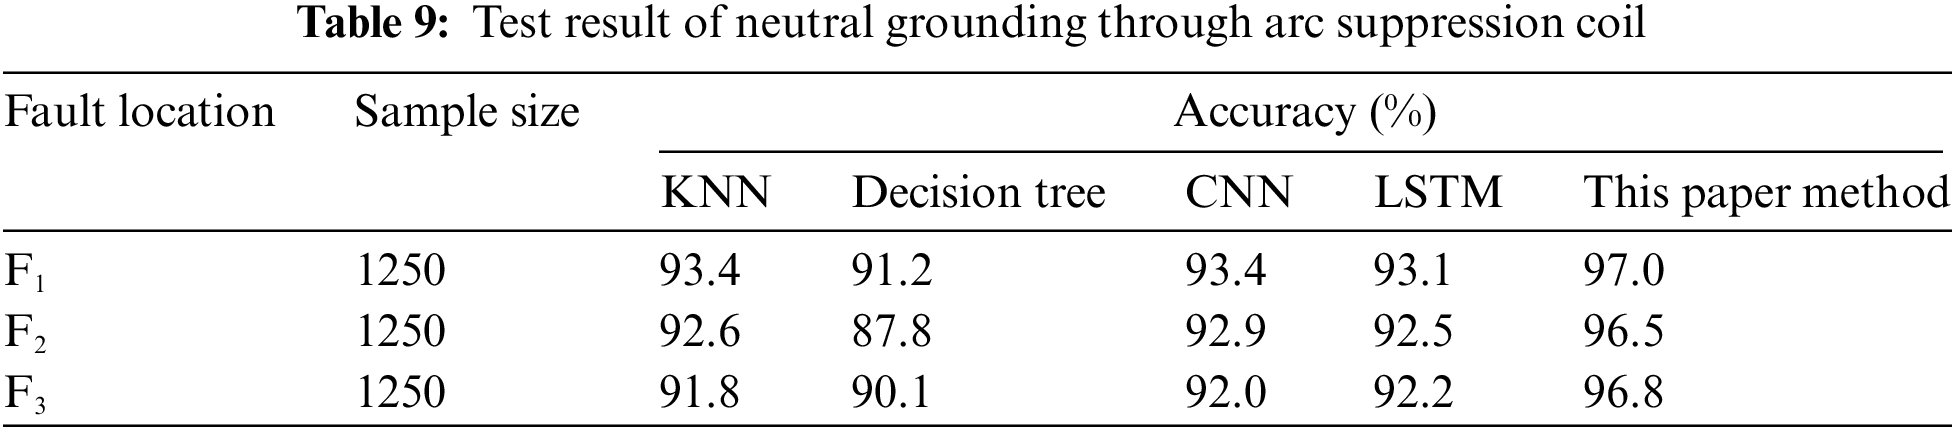
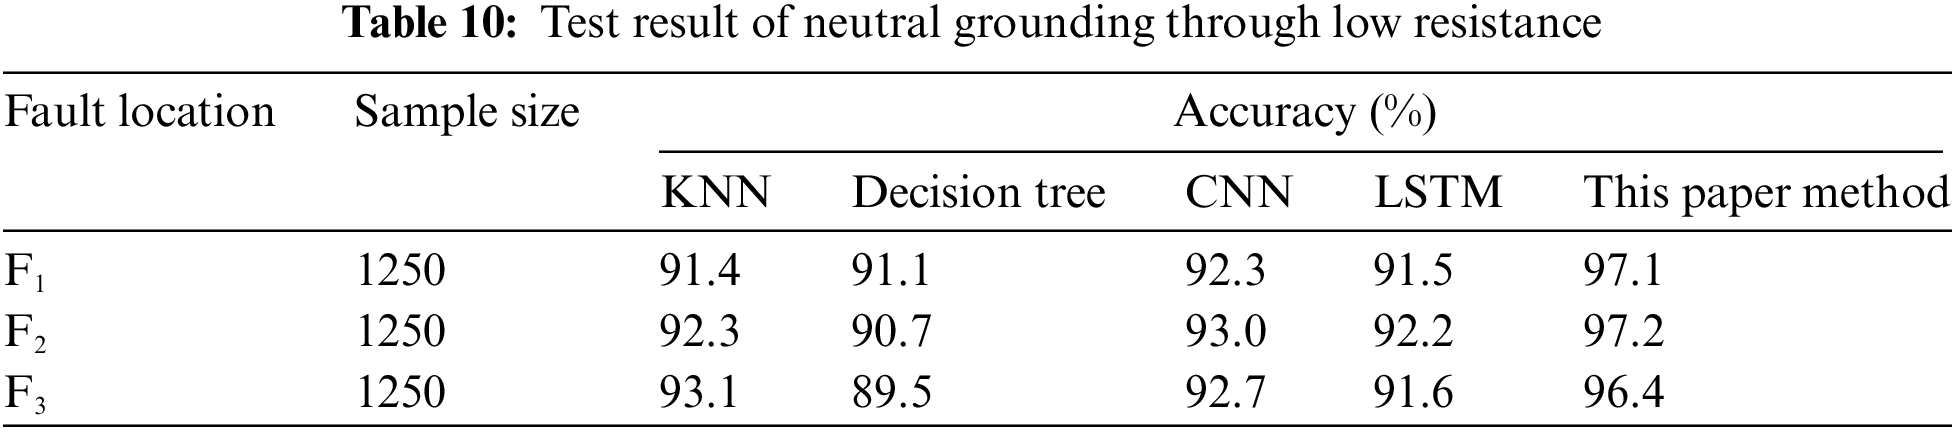
Since the neutral arc suppression coil and low resistance can affect each characteristic index of insulation fault to a certain extent, to further verify the robustness of this method under different neutral grounding modes, the grounding mode of the simulation model in Fig. 5 is changed to arc suppression coil grounding and low resistance grounding. The inductance of the arc suppression coil is 0.74 H and the small resistance is 10 Ω. Data of fault points F1, F2, F3 and F0 are selected for test samples, and other conditions are the same as in Table 5. The insulation situational awareness results are shown in Tables 9 and 10. It can be seen from the perception results that the change of neutral grounding mode does not influence the prediction effect of the proposed method. This proposed method can be well applied to systems with different neutral grounding modes, and the prediction accuracy is much higher than the K-Nearest Neighbor (KNN) method, decision tree method, Convolutional Neural Networks (CNN) method, Long Short-Term Memory (LSTM) method.
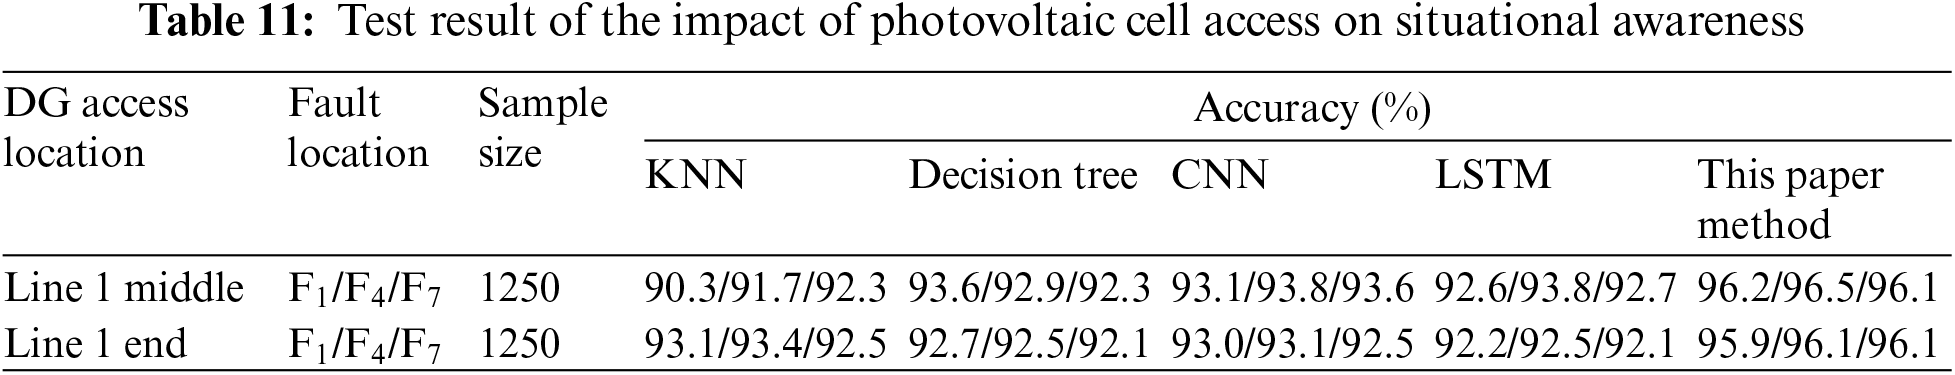
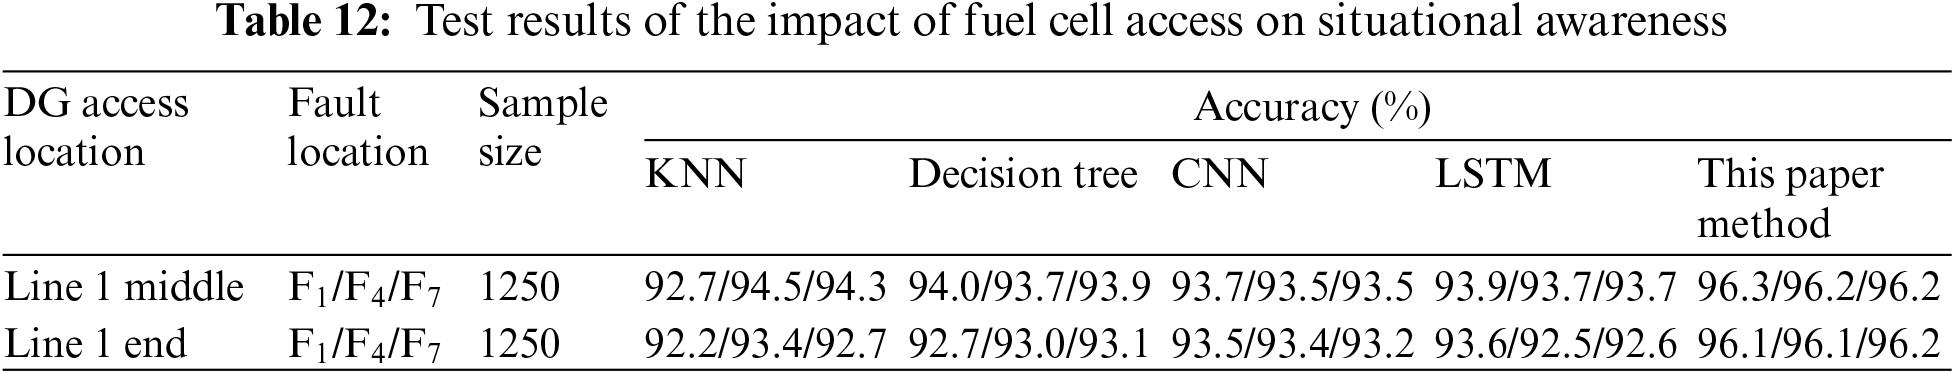
With the proposal of the carbon peaking and carbon neutrality goals, distributed power supply (DG) has been widely connected to the distribution network. To verify the adaptability of the proposed method under the DG access condition, a DG is connected to the end and middle of line 1 of the distribution network simulation model as shown in Fig. 5. The DG model takes photovoltaic cells and solid oxide fuel as an example: The photovoltaic cell model is established by simplifying and deducing the equivalent circuit of photovoltaic power generation and according to the experimental fitting compensation coefficient [26]. The fuel cell model uses the semi-empirical model to obtain the differential equation for the partial pressure of gas, which is established according to the Nernst equation [27]. Samples are selected from fault points F1, F4, F7, and other simulation parameters as shown in Table 5.
The situational awareness test results are shown in Tables 11 and 12. It can be seen that the method proposed in this paper still maintains a high insulation fault sample accuracy when connected to the distributed power supply, and is higher than the CNN method, LSTM method, KNN method and decision tree method.
In order to further verify the applicability of the distribution network insulation fault situational awareness method proposed in this paper in the actual fault situation, the overhead line and cable line fault simulation experiments were respectively conducted in the 10 kV true distribution network experimental field, and the fault data obtained from the experiments were organized into validation data sets. The topology diagram of the true type experimental field is shown in Fig. 8. The experiment site is shown in Fig. 9.
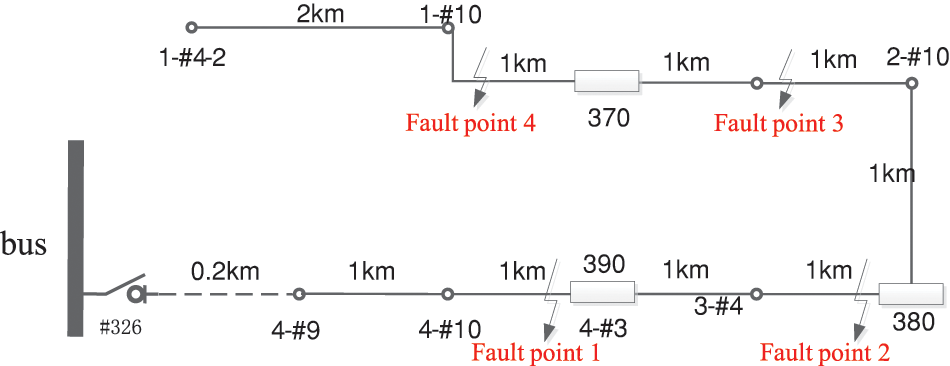
Figure 8: Topology diagram of real experimental field
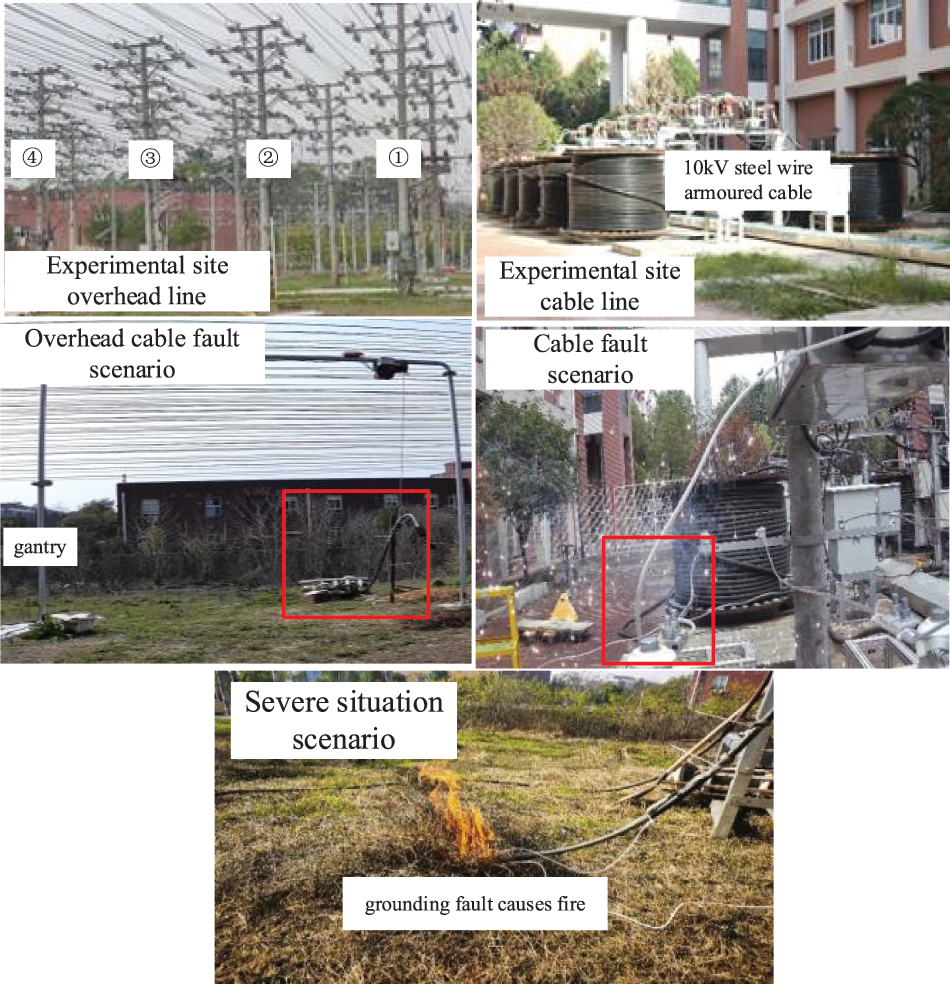
Figure 9: Real distribution network experiment site
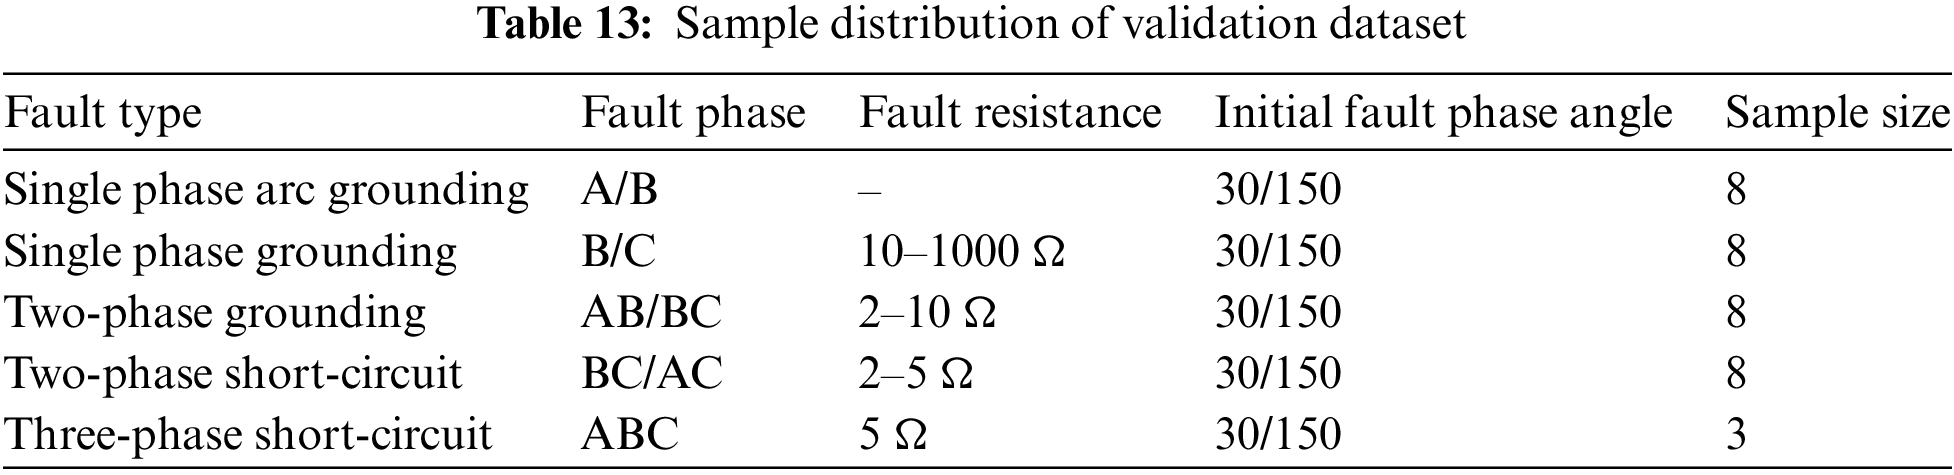
The 10 kV bus lines in the distribution network test field are connected to four outlet lines (No. 1, No. 2, No. 3 and No. 4), respectively, with an ungrounded neutral point. Insulation faults of different phases were intentionally set at distances of 2, 4, 6 and 8 km from the bus to simulate five types of actual distribution network insulation faults: Single-phase arc grounding, single-phase direct grounding, two-phase short circuit, two-phase ground contact and three-phase short circuit. Table 13 shows the sample distribution of the obtained verification data set while Table 14 presents the results of actual distribution network insulation fault situational awareness using the proposed method. Combined with Tables 13 and 14, it can be seen that the distribution network situation awareness method proposed in this paper can accurately identify the fault situation level under different fault types, different fault phases, different fault resistances, and different fault initial phase angles, and can still reliably perceive the fault situation under the condition of insulation faults, and can be well applied to the actual distribution network.

Based on the analysis and research of the insulation fault mechanism of the distribution network, this paper deeply explores the internal relationship of each characteristic quantity of insulation fault and selects 9 characteristic indexes that can effectively characterize the insulation state of the distribution line. Based on the comprehensive consideration of the fault nature and the region of the distribution network, the insulation fault risk factor and regional risk factor of the distribution network are constructed, the specific calculation formula and check table are given, and the insulation fault situation is classified, which provides a theoretical basis for quantifying the insulation fault situation of the distribution network.
In this paper, based on the evaluation method of the multi-feature index, the characteristic quantity and situational awareness model of the initial insulation fault of the distribution network are studied by taking the data of the distribution network in the existing distribution management system as the research object. A dimensionality reduction method for distribution network data based on PCA is proposed, and 9 state indicators of the distribution network are used to construct the insulation fault feature data set, which can provide data support for subsequent insulation fault situational awareness. This paper presents a multi-class SVM method based on the 1-v-1 method for initial insulation fault situation awareness of the distribution network. The insulation fault situation simulation analysis of 10 kV distribution network under various grounding modes and DG access conditions is carried out, which verifies the effectiveness and correctness of the situation awareness method proposed in this paper and provides a theoretical basis for the insulation risk prevention and control of the distribution network.
The purpose of this paper is to propose a situational awareness method for the initial insulation fault of the distribution network based on multi-feature index comprehensive evaluation. In this paper, the calculation method of distribution network insulation fault risk level for situation awareness is to obtain the risk level by comprehensively considering the fault factor and the influence factor of the region where the distribution network is located and calculating the product of the two factors. Therefore, the situation awareness method proposed in this paper may not be directly applied between distribution networks with great differences. Given the distribution networks with large differences in different periods, different anti-disturbance capabilities and different topological structures, a suitable calculation method of insulation status level should be developed according to the specific conditions of distribution networks. Different insulation situation evaluation methods consider different situation level calculation methods and situation awareness results are different.
The difficulty to find the insulation deterioration of distribution network in time, and the puzzle of initial insulation fault development trend is the problematic issues in distribution inspection work. The method presented in this paper can accurately perceive the fault development situation in the initial stage of distribution network insulation fault, and the situational awareness result has high accuracy, good robustness, strong operability, and high engineering application value. The method proposed in this paper is expected to be applied to the field of distribution network security. In the initial stage of insulation deterioration in distribution network, the rapid and accurate perception of insulation fault situation can help prevent the deterioration of distribution network insulation, provide a scientific basis for decision-making workers in distribution and transportation inspection, help improve the efficiency of distribution and transportation inspection, and ensure the reliability of distribution network power supply. For distribution networks with great differences in different periods, different anti-disturbance capabilities and different topological structures, it is necessary to establish a suitable insulation situation level calculation method combined with the specific situation of distribution networks when applying the situational awareness method in this paper. Specifically, by increasing the influence factors and increasing the weight for each influence factor, the fault situation level calculation method under specific distribution network conditions can be obtained, and then the situation awareness method in this paper can be applied. The guiding significance of situation awareness results is different with different calculation methods of insulation fault situation level in the distribution network.
Acknowledgement: The authors acknowledge the support of China Southern Power Grid Electric Power Research Institute.
Funding Statement: This work was funded by the Science and Technology Project of China Southern Power Grid (YNKJXM20210175), and the National Natural Science Foundation of China (52177070).
Author Contributions: The authors confirm their contribution to the paper as follows: the study conception and design: Hao Bai, Beiyuan Liu; data collection: Beiyuan Liu, Hongwen Liu; analysis and interpretation of results: Jupeng Zeng, Ouyang Jian; draft manuscript preparation: Beiyuan Liu, Yipeng Liu. All authors reviewed the results and approved the final version of the manuscript.
Availability of Data and Materials: Data supporting this study are included within the article.
Conflicts of Interest: The authors declare that they have no conflicts of interest to report regarding the present study.
References
1. R. Dashti, M. Daisy, H. Mirshekali, H. R. Shaker, and M. H. Aliabadi, “A survey of fault prediction and location methods in electrical energy distribution networks,” Measurement, vol. 184, pp. 109947, Nov. 2021. doi: 10.1016/j.measurement.2021.109947. [Google Scholar] [CrossRef]
2. S. Govindarajan, A. Morales, J. A. Ardila-Rey, and N. Purushothaman, “A review on partial discharge diagnosis in cables: Theory, techniques, and trends,” Measurement, vol. 216, pp. 112882, Jul. 2023. doi: 10.1016/j.measurement.2023.112882. [Google Scholar] [CrossRef]
3. W. Zhan et al., “A leakage protection method for low-voltage power supply systems based on flexible regulation of the neutral point voltage,” Int. J. Electr. Power Energy Syst., vol. 151, pp. 109157, Sep. 2023. doi: 10.1016/j.ijepes.2023.109157. [Google Scholar] [CrossRef]
4. S. Gharazi and M. Al-Sheikhly, “Modelling end-OF–life of radiolytically and thermally aged cable insulations by non-destructive condition monitoring parameters,” Radiat. Phys. Chem., vol. 212, pp. 111166, Nov. 2023. doi: 10.1016/j.radphyschem.2023.111166. [Google Scholar] [CrossRef]
5. S. N. Meitei, K. Borah, and S. Chatterjee, “Review on monitoring of transformer insulation oil using optical fiber sensors,” Results Optics, vol. 10, pp. 100361, Feb. 2023. [Google Scholar]
6. T. Zhou., X. Z. Xiao, H. F. Yang, X. Y. Yan, X. J. Jin and Q. Z. Wan, “Identification of XLPE cable insulation defects based on deep learning,” Glob. Energy Interconnect., vol. 6, no. 1, pp. 36–49, Feb. 2023. [Google Scholar]
7. R. Aiswarya, D. S. Nair, T. Rajeev, and V. Vinod, “A novel SVM based adaptive scheme for accurate fault identification in microgrid,” Electr. Power Syst. Res., vol. 221, pp. 109439, Aug. 2023. doi: 10.1016/j.epsr.2023.109439. [Google Scholar] [CrossRef]
8. M. Eslami, M. Jannati, and S. S. Tabatabaei, “An improved protection strategy based on PCC-SVM algorithm for identification of high impedance arcing fault in smart microgrids in the presence of distributed generation,” Measurement, vol. 175, pp. 109149, Apr. 2021. doi: 10.1016/j.measurement.2021.109149. [Google Scholar] [CrossRef]
9. A. Ghaemi, A. Safari, H. Afsharirad, and H. Shayeghi, “Accuracy enhance of fault classification and location in a smart distribution network based on stacked ensemble learning,” Electr. Power Syst. Res., vol. 205, pp. 107766, Apr. 2022. doi: 10.1016/j.epsr.2021.107766. [Google Scholar] [CrossRef]
10. X. Lu et al., “Research on identification method of short-circuit fault in distribution network based on least squares twin support vector machine,” (in ChineseEng. J. Wuhan Univ., vol. 55, no. 4, pp. 401–405, Apr. 2022. doi: 10.14188/j.1671-8844.2022-04-011. [Google Scholar] [CrossRef]
11. H. Sheng and X. D. Qi, “Application of new digital signal processing technology based on distributed cloud computing in electronic information engineering,” Future Gener. Comp. Syst., vol. 128, pp. 443–450, Mar. 2022. doi: 10.1016/j.future.2021.10.032. [Google Scholar] [CrossRef]
12. X. Li, H. Zhao, Y. Feng, J. Li, Y. Zhao and X. Wang, “Research on key technologies of high energy efficiency and low power consumption of new data acquisition equipment of power Internet of Things based on artificial intelligence,” Int. J. Thermofluids, vol. 21, pp. 100575, Feb. 2024. [Google Scholar]
13. X. Y. Yu, L. W. Qin, and H. T. Gui, “Application of new generation artificial lntelligence technology in intelligent sensing and fault detection of power distribution network,” (in ChineseSouthern Power Syst. Technol., vol. 16, no. 5, pp. 34–43, May 2022. [Google Scholar]
14. Y. G. Nie and G. X. Shi, “Big data application requirements and scenario analysis in smart distribution network,” (in ChineseChina Plant Eng., vol. 37, no. 22, pp. 23–25, Nov. 2021. [Google Scholar]
15. Z. F. Zhu et al., “Correlation knowledge extraction based on data mining for distribution network planning,” Global Energy Interconnect., vol. 6, no. 4, pp. 485–492, Aug. 2023. [Google Scholar]
16. H. Bai, “Key factor mining method of distribution network equipment operational efficiency based on Apriori and CNN,” Energy Reports, vol. 8, pp. 533–538, Jun. 2022. doi: 10.1016/j.egyr.2022.02.103. [Google Scholar] [CrossRef]
17. J. Huang, C. Chen, C. H. Sun, Y. J. Cao, and Y. An, “An integrated risk assessment model for the multi-perspective vulnerability of distribution networks under multi-source heterogeneous data distributions,” Int. J. Electr. Power Energy Syst., vol. 153, pp. 109397, Nov. 2023. [Google Scholar]
18. R. Kumari, B. K. Naick, and D. Ghosh, “Reliability assessment of distribution system using Petri net for enhancement of situational awareness,” Electr. Power Syst. Res., vol. 224, pp. 109739, Nov. 2023. doi: 10.1016/j.epsr.2023.109739. [Google Scholar] [CrossRef]
19. J. S. Li, H. Liu, W. Z. Li, T. S. Bi, and M. Y. Zhao, “Data network traffic analysis and optimization strategy of real-time power grid dynamic monitoring system for wide-frequency measurements,” Global Energy Interconnect., vol. 5, no. 2, pp. 131–142, Apr. 2022. [Google Scholar]
20. Z. H. Li, Z. P. Wang, and Y. X. Zhang, “New method of fault location for active distribution network based on multi-source information fusion,” (in ChinesePower Syst. Technol., vol. 47, no. 8, pp. 3448–3459, Aug. 2023. doi: 10.13335/j.1000-3673.pst.2022.0535. [Google Scholar] [CrossRef]
21. M. N. I. Siddique, M. J. Rana, M. Shafiullah, S. Mekhilef, and H. Pota, “Automating distribution networks: Backtracking search algorithm for efficient and cost-effective fault management,” Expert. Syst. Appl., vol. 247, pp. 123275, Aug. 2024. doi: 10.1016/j.eswa.2024.123275. [Google Scholar] [CrossRef]
22. R. Z. Wei et al., “New energy power prediction and warning based on multi-source prediction and scene classification recognition,” Procedia Comput. Sci., vol. 224, pp. 401–406, Aug. 2023. [Google Scholar]
23. X. Zhang, Z. Wu, Q. R. Sun, W. Gu, S. Zheng and J. T. Zhao, “Application and progress of artificial intelligence technology in the field of distribution network voltage control: A review,” Renew. Sustain. Energy Rev., vol. 192, pp. 114282, Mar. 2024. doi: 10.1016/j.rser.2024.114282. [Google Scholar] [CrossRef]
24. C. L. Athanasiadis, T. A. Papadopoulos, G. C. Kryonidis, and D. I. Doukas, “A review of distribution network applications based on smart meter data analytics,” Renew. Sustain. Energy Rev., vol. 191, pp. 114151, Mar. 2024. doi: 10.1016/j.rser.2023.114151. [Google Scholar] [CrossRef]
25. S. Barja-Martinez, M. Aragüés-Peñalba, Í. Munné-Collado, P. Lloret-Gallego, E. Bullich-Massague and R. Villafafila-Robles, “Artificial intelligence techniques for enabling big data services in distribution networks: A review,” Renew. Sustain. Energy Rev., vol. 150, pp. 111459, Oct. 2021. doi: 10.1016/j.rser.2021.111459. [Google Scholar] [CrossRef]
26. V. K. Singhal, U. K. Verma, M. Joshi, and B. Kumar, “Charge transport in quantum dot sensitized solar cells: A mathematical model,” Sol. Energy, vol. 245, pp. 120–126, Oct. 2022. doi: 10.1016/j.solener.2022.09.013. [Google Scholar] [CrossRef]
27. L. Blanco-Cocom, S. Botello-Rionda, L. C. Ordoñez, and S. I. Valdez, “Parameter estimation for empirical and semi-empirical models in a direct ethanol fuel cell,” Energy Rep., vol. 10, pp. 451–459, Nov. 2023. doi: 10.1016/j.egyr.2023.07.002. [Google Scholar] [CrossRef]
Cite This Article
 Copyright © 2024 The Author(s). Published by Tech Science Press.
This work is licensed under a Creative Commons Attribution 4.0 International License , which permits unrestricted use, distribution, and reproduction in any medium, provided the original work is properly cited.
 Downloads
 Citation Tools