
 Submit a Paper
 Propose a Special lssue
 Open Access
ARTICLE

Impact of Blade-Flapping Vibration on Aerodynamic Characteristics of Wind Turbines under Yaw Conditions
1 College of Energy and Power Engineering, Inner Mongolia University of Technology, Hohhot, 010051, China
2 Key Laboratory of Wind and Solar Energy Utilization Technology, Ministry of Education, Hohhot, 010051, China
* Corresponding Author: Zhiying Gao. Email:
Energy Engineering 2024, 121(8), 2213-2229. https://doi.org/10.32604/ee.2024.049616
Received 12 January 2024; Accepted 14 March 2024; Issue published 19 July 2024
 View Full Text
 Download PDF
Abstract
Although the aerodynamic loading of wind turbine blades under various conditions has been widely studied, the radial distribution of load along the blade under various yaw conditions and with blade flapping phenomena is poorly understood. This study aims to investigate the effects of second-order flapwise vibration on the mean and fluctuation characteristics of the torque and axial thrust of wind turbines under yaw conditions using computational fluid dynamics (CFD). In the CFD model, the blades are segmented radially to comprehensively analyze the distribution patterns of torque, axial load, and tangential load. The following results are obtained. (i) After applying flapwise vibration, the torque and axial thrust of wind turbines decrease in relation to those of the rigid model, with significantly increased fluctuations. (ii) Flapwise vibration causes the blades to reciprocate along the axial direction, altering the local angle of attack and velocity of the blades relative to the incoming wind flow. This results in the contraction of the torque region from a circular shape to a complex “gear” shape, which is accompanied by evident oscillations. (iii) Compared to the tangential load, the axial load on the blades is more sensitive to flapwise vibration although both exhibit significantly enhanced fluctuations. This study not only reveals the impact of flapwise vibration on wind turbine blade performance, including the reduction of torque and axial thrust and increased operational fluctuations, but also clarifies the radial distribution patterns of blade aerodynamic characteristics, which is of great significance for optimizing wind turbine blade design and reducing fatigue risks.Keywords
Wind energy, which is one of the fastest-growing renewable energy sources, relies heavily on increasing the size of wind turbines to enhance their utilization efficiency [1]. With their increase in size, wind turbines have become more sensitive to dynamic environmental loads [2]. Yaw, a common operating condition of horizontal-axis wind turbines, significantly affects their performance [3]. As complex fluid-structure coupled systems [4], wind turbine blades are prone to nonlinear deformations and structural vibrations under varying loads, such as gravitational, centrifugal, and aerodynamic forces, which further affect their effective service life [5,6].
In exploring the aerodynamic characteristics of wind turbines, the academic community has generally adopted high-precision computational methods that consider the aeroelastic behavior of blades. To investigate the impact of blade flapping on the aerodynamics of wind turbines, researchers such as Li et al. [7] integrated the computational fluid dynamics (CFD) and computational structural dynamics (CSD) software on a mesh-based parallel code-coupling interface (MpCCI) platform to study the deformation behavior of wind turbine blades in a coupled environment, emphasizing that blade flapping significantly reduces the load on blades under high wind speeds. Zhao et al. [8] used an aerodynamic model developed based on the blade element momentum (BEM) theory, incorporating the composite material layup structure of blades, and found that blade flapping leads to a decrease in wind turbine power, which is more noticeable at higher wind speeds. Additionally, Tang et al. [9–11] applied the geometrically exact beam theory, BEM theory, and the free-vortex wake method to construct unidirectional fluid-structure coupled nonlinear aeroelastic models of large wind turbines. They found that, compared to models that account for blade-flapping vibration, traditional rigid blade models might overestimate power output by 5%–8% and could overestimate blade fatigue damage by a factor of 1–2, further confirming the significant role of blade-flapping vibration in wind turbine performance assessment. Li et al. [12] considered the vibration velocity and structural deformation in the flapping direction of a blade in a bidirectional fluid-structure coupled model for the first time. Considering blade deformation, they found that the axial and tangential aerodynamic forces decreased by 19.4% and 63.8%, respectively, highlighting the significant impact of blade-flapping vibration on the aerodynamic performance of wind turbines. Li et al. [13], using a unidirectional fluid-structure coupled model, confirmed that with an increase in the yaw angle, the fluctuations in the angle of attack, blade flapping, and yaw torque increase. Fang et al. [14,15] simulated blade-flapping vibrations using dynamic grid technology and demonstrated an increase in the fluctuation amplitude of the blade torque and axial force as the blade tip flapping amplitude increased, proving the profound impact of blade-flapping vibrations on the aerodynamic characteristics of wind turbines.
The aerodynamic loads experienced by wind turbine blades under yaw conditions are closely related to the radial positions and azimuths on the blade. Yu et al. [16–18] used CFD bidirectional fluid-structure coupled models to verify the significant impact of yaw angle changes on the flow field characteristics and force performance of wind turbines, particularly the major impact of the angle of attack and Reynolds number on the power output characteristics [19]. Current research mainly focuses on the overall aerodynamic performance and power output of wind turbines. However, there is a lack of in-depth studies on the distribution patterns of aerodynamic loads along the radial direction of blades and their impact at specific azimuth angles. Although some studies have explored this aspect, they have been limited to specific angles [20,21]. Wang et al. [22] conducted a detailed analysis of the radial distribution of aerodynamic loads on blades but did not consider the impact of blade-flapping vibration, limiting the applicability of their conclusions. A comprehensive understanding of the radial and circumferential variations in blade loads is crucial for effectively reducing the uncertainty in fatigue load prediction during the design stage.
Understanding the aerodynamic characteristics of blades is vital for studying the fatigue loads in coupled-yaw wind turbines. Variations in these characteristics lead to complex aeroelastic-coupled behaviors, with the impact of flapping vibrations being the most significant [23,24]. Therefore, in this study, CFD calculations were primarily used to convert displacement data of blade-flapping vibration from wind tunnel experiments into time-varying motion equations. The actual movement of blades was simulated through dynamic grid technology, establishing a fluid-structure coupled model for blade-flapping vibration. Following the principle of global-to-local analysis, the aerodynamic performance of the wind turbine rotor, individual blades, and radially segmented blade sections were evaluated under yaw conditions. By investigating the impact mechanism of applying blade flap vibrations on the blade aerodynamic parameters, the research findings can provide valuable references for optimizing the design of wind turbine blades.
This study is structured as follows: Section 2 discusses the calculation model and validation. Section 3 discusses the aerodynamic analysis of the wind rotator or blades. Section 4 presents the analysis of the aerodynamic performance of the blade radial wing sections. Finally, Section 5 presents the conclusions drawn from this study.
2 Calculation Model and Validation
In this study, a small-scale wind turbine with a rated power of 300 W and a three-bladed NACA4415 airfoil profile was used. From the results of wind-tunnel experiments, a 1:1 scale model of the wind turbine was constructed, as shown in Fig. 1. The rotor diameter was 1.4 m, the tower height was 1.6 m, and the tower diameter was 0.11 m. The rated wind speed was 8 m/s, the rated rotational speed was 545 r/min, and the tip-speed ratio was 5.
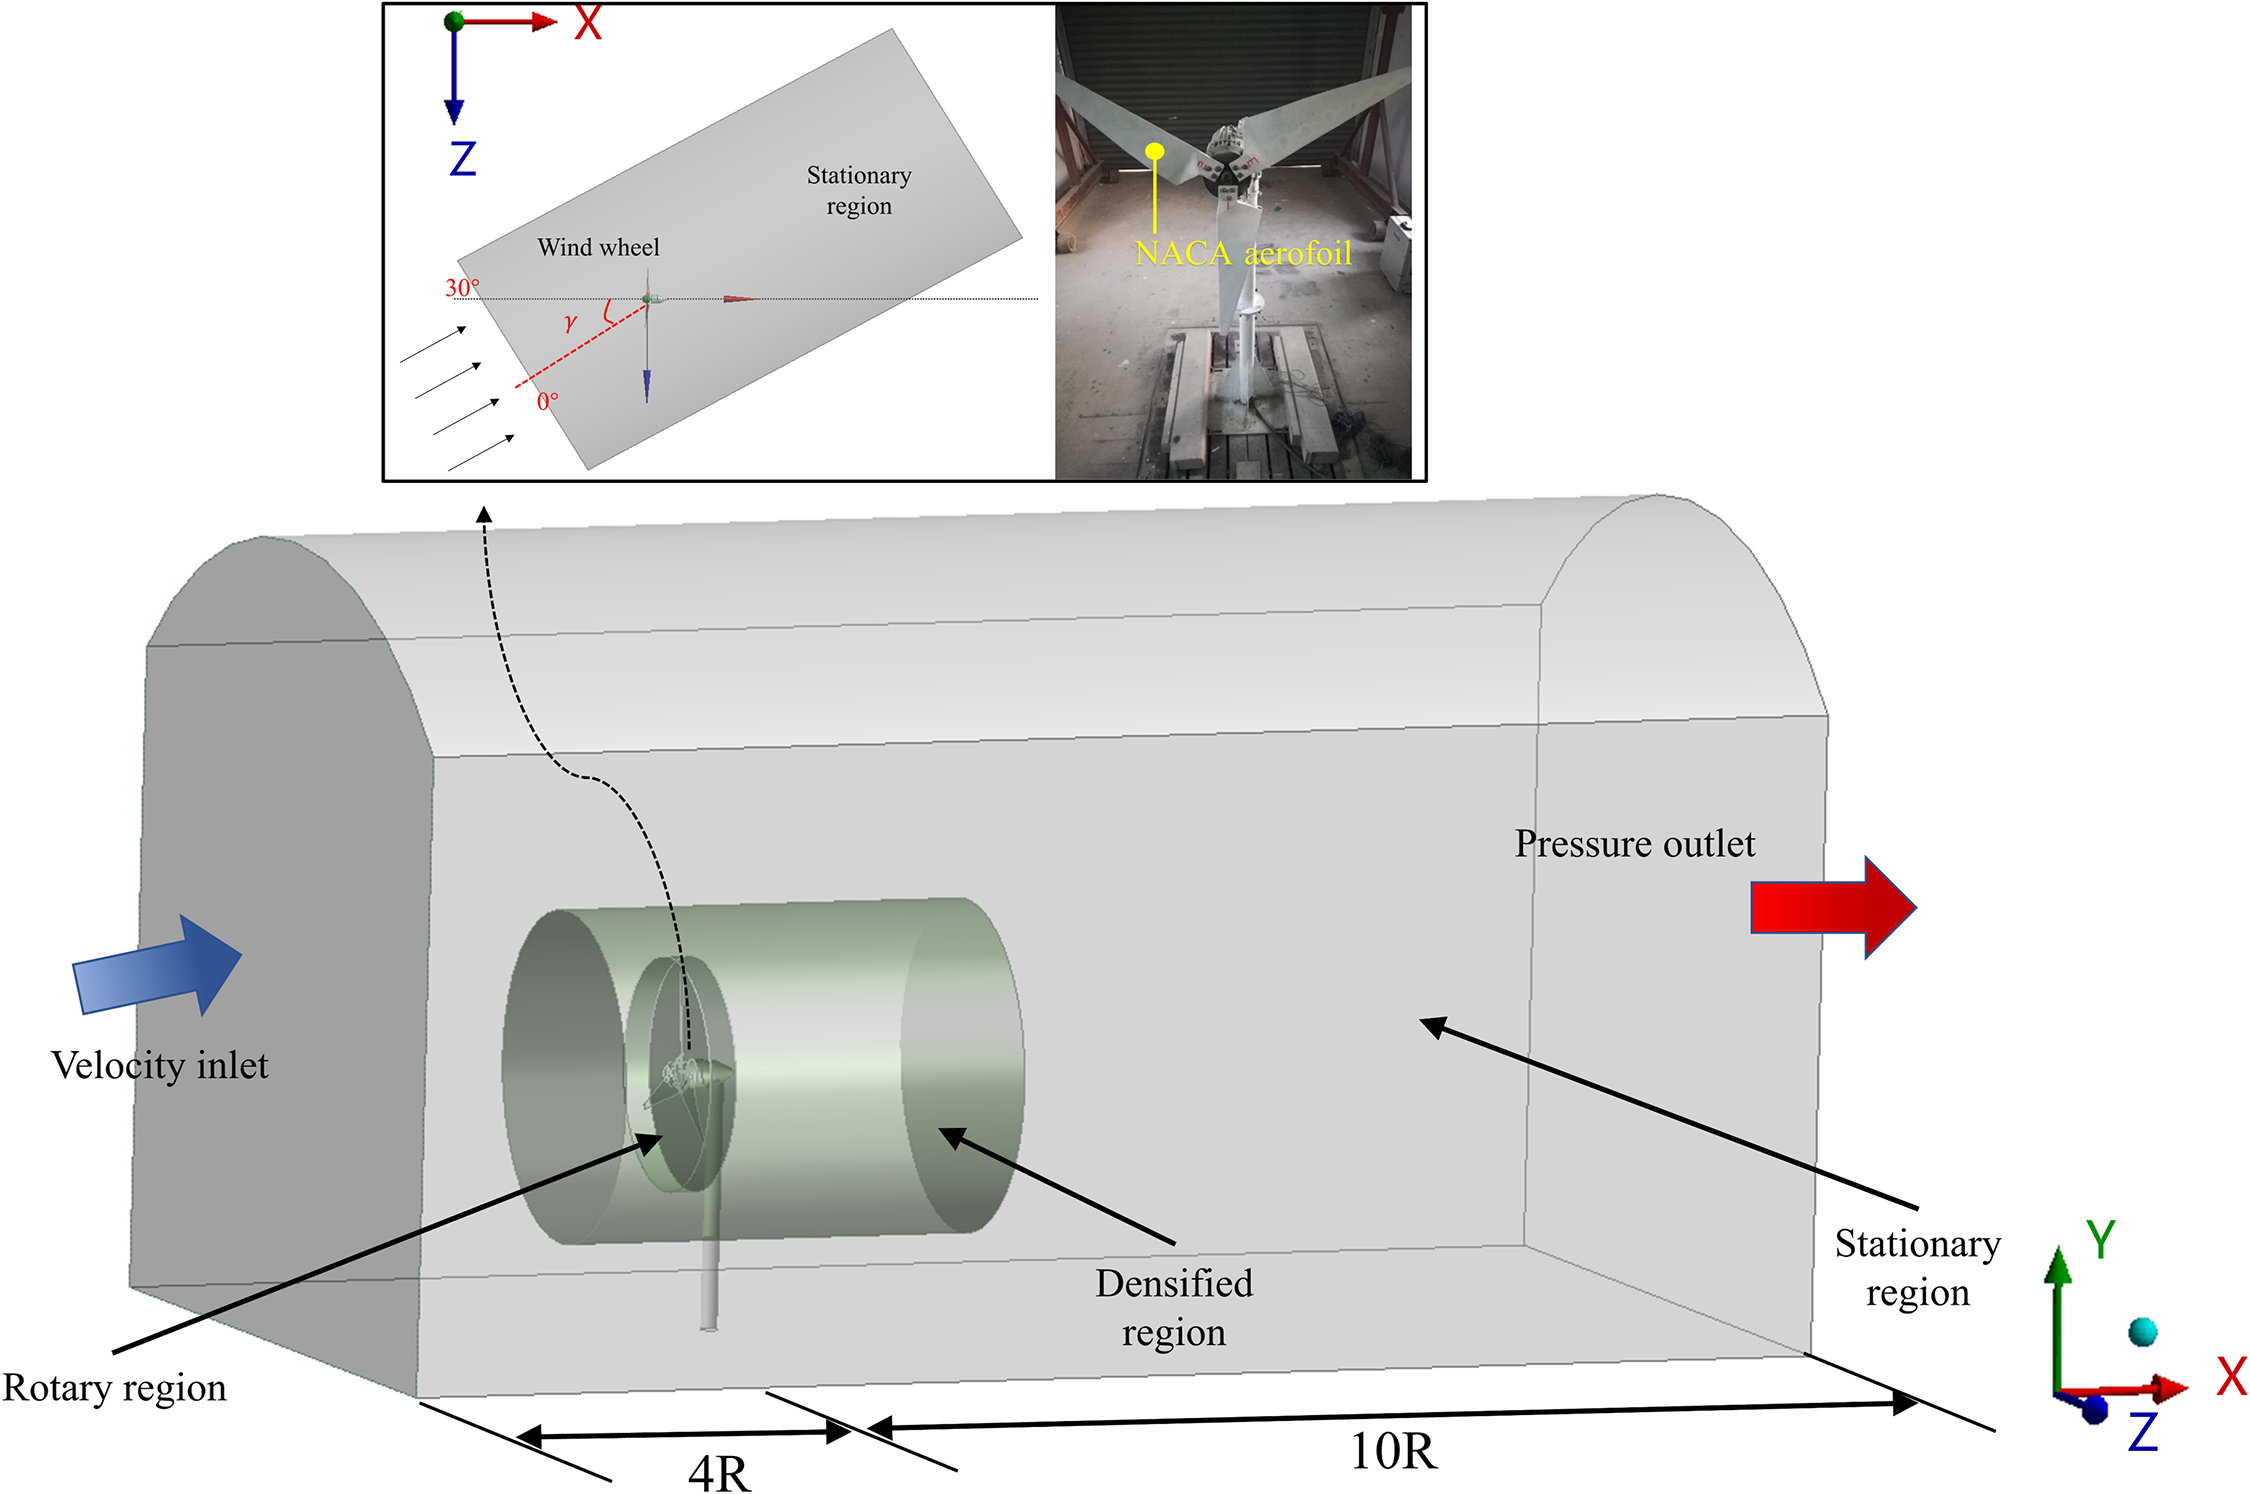
Figure 1: Computational region and angle definition
In this study, according to the specific dimensions of the B1/K2 wind tunnel at the Inner Mongolia University of Technology, meticulously constructed stationary, refined, and rotating domains [25] were used to simulate the dynamic behavior of wind turbines in actual operating environments. The inlet and outlet sections were extended to 4R and 10R, respectively, to ensure airflow simulation accuracy. The rotation center of the wind rotator was precisely located at the coordinate origin, with the X-axis along the direction of the rotational axis of the wind rotator and the Y-axis perpendicular to the ground. To effectively simplify the process of extracting aerodynamic data from the blades, the stationary and refined domains were rotated during the simulation of wind turbine yaw while keeping the rotating domain stationary. Using a yaw angle of 30° as an example, Fig. 1 illustrates the definition of yaw angle γ, where the wind rotator rotates clockwise around the X-axis and the stationary and refined domains rotate counterclockwise around the Y-axis.
2.2 Mesh Generation and Turbulence Model
A tetrahedral, unstructured mesh was created using Analysis Mesh. The mesh was refined in the rotating and wake regions of the wind turbine. Additionally, boundary layers were added to the blade surfaces, with the first layer height set to 0.02 mm with a growth rate of 1.2, comprising 15 layers, to ensure
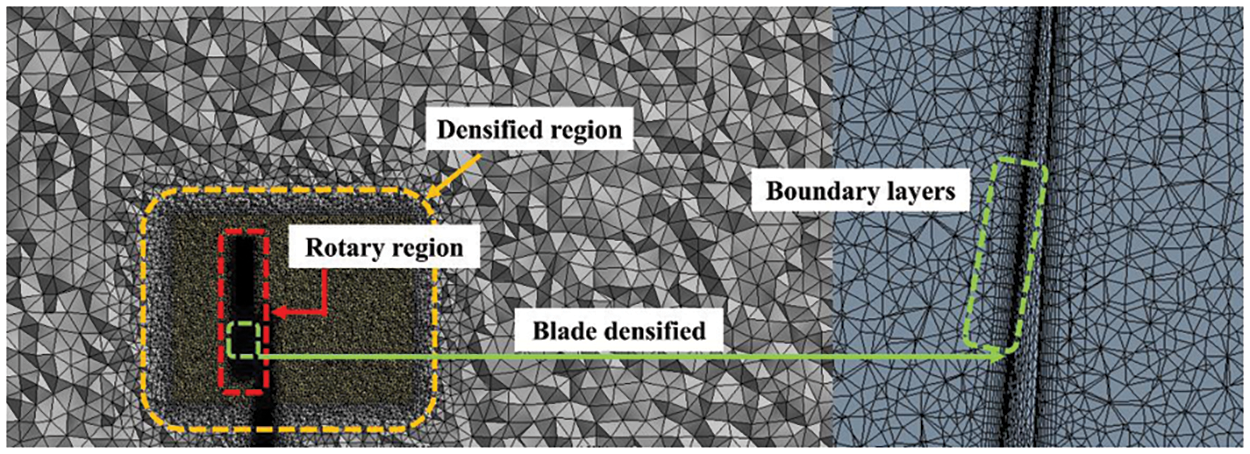
Figure 2: Mesh division
A detached eddy simulation (DES) model was employed as the turbulence model, which combines the advantages of the Reynolds-averaged Navier–Stokes (RANS) and large-eddy simulation (LES) models. The momentum equations for the RANS and LES models are given by
The main difference between the two models lies in the last term of the momentum equation, which blends the Reynolds-averaged and LES approaches to address the limitations of both methods. When the turbulence scale was relatively large, LES subgrid-scale modeling was used for solving, whereas the conventional RANS model was employed when the turbulence scale was relatively small. The DES momentum equation is
The DES method can better capture detailed vortex structures and aerodynamic characteristics than pure RANS. Simultaneously, it reduces the stringent grid requirements of the LES, effectively reducing computational costs. Using unsteady transient computation, a uniform inlet flow with a rated wind speed of 8 m/s and a turbulence intensity of 0.5% was set. The boundary conditions at the outlet were defined as zero velocity and pressure gradients. The computational domain was surrounded by fixed walls according to the wind tunnel design, with the tower fixed to the ground. The rotor was simulated to rotate at a rated speed of 545 rpm using a sliding mesh technique, with data exchange between the rotating and stationary domains facilitated by non-overlapping interface boundaries. The custom functions controlling the motion of the three blades by the addition of flapwise vibration equations were integrated. The time step set to capture the rotation of the rotor by 1° was 0.0003058 s. A simple method and a second-order upwind scheme were used to correct the pressure–velocity coupling and discretization equations.
2.3 Flapping Vibration Equation
Fig. 3 shows the schematic diagram of the sensor layout and experimental testing platform. The B&K vibration testing software was used for experimental testing. The sensors were accurately positioned along the nodal lines through multiple adjustments. After establishing the appropriate experimental boundary conditions, data regarding nodal displacements were collected. The sensor data gathered from these specific locations were imported into the signal processing software. This process facilitated the extraction of the modal vibration parameters of the blades, which are crucial for understanding their dynamic behavior and responses under operational conditions. Based on experimental data, the vibration mode diagrams corresponding to the first and second-order flapping vibrations of the blades are obtained, as shown in Fig. 4.
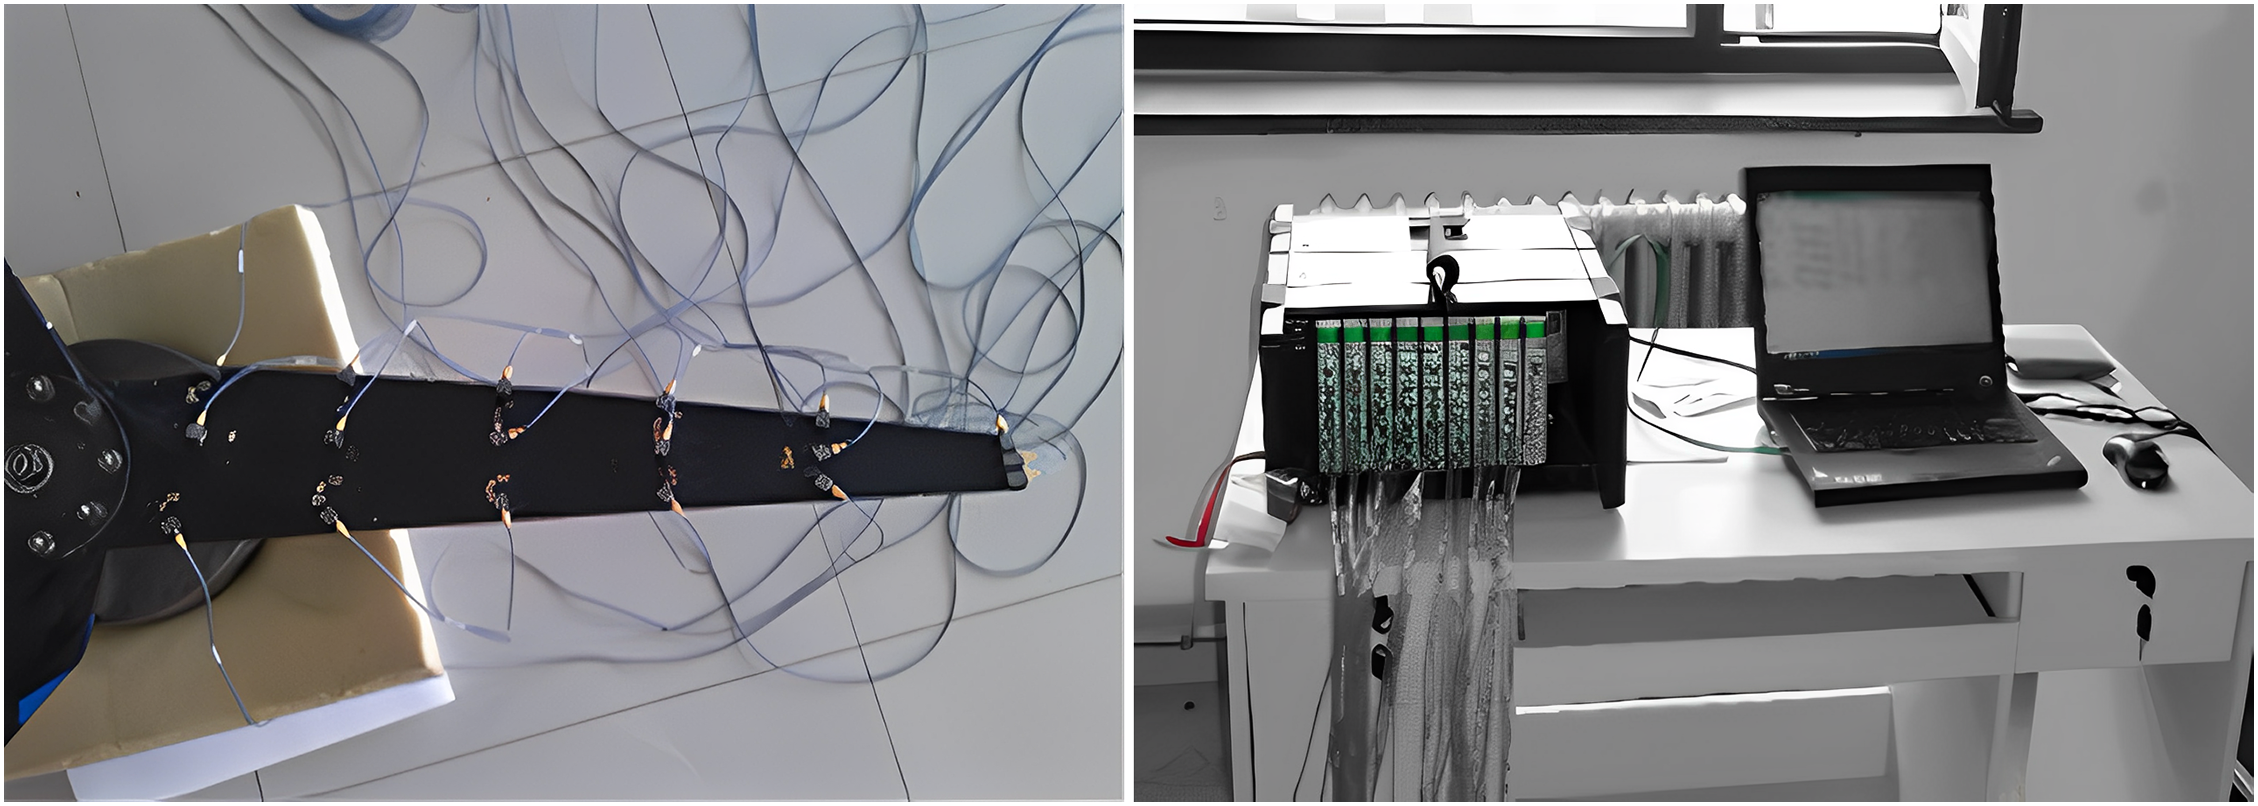
Figure 3: Sensor layout and test platform
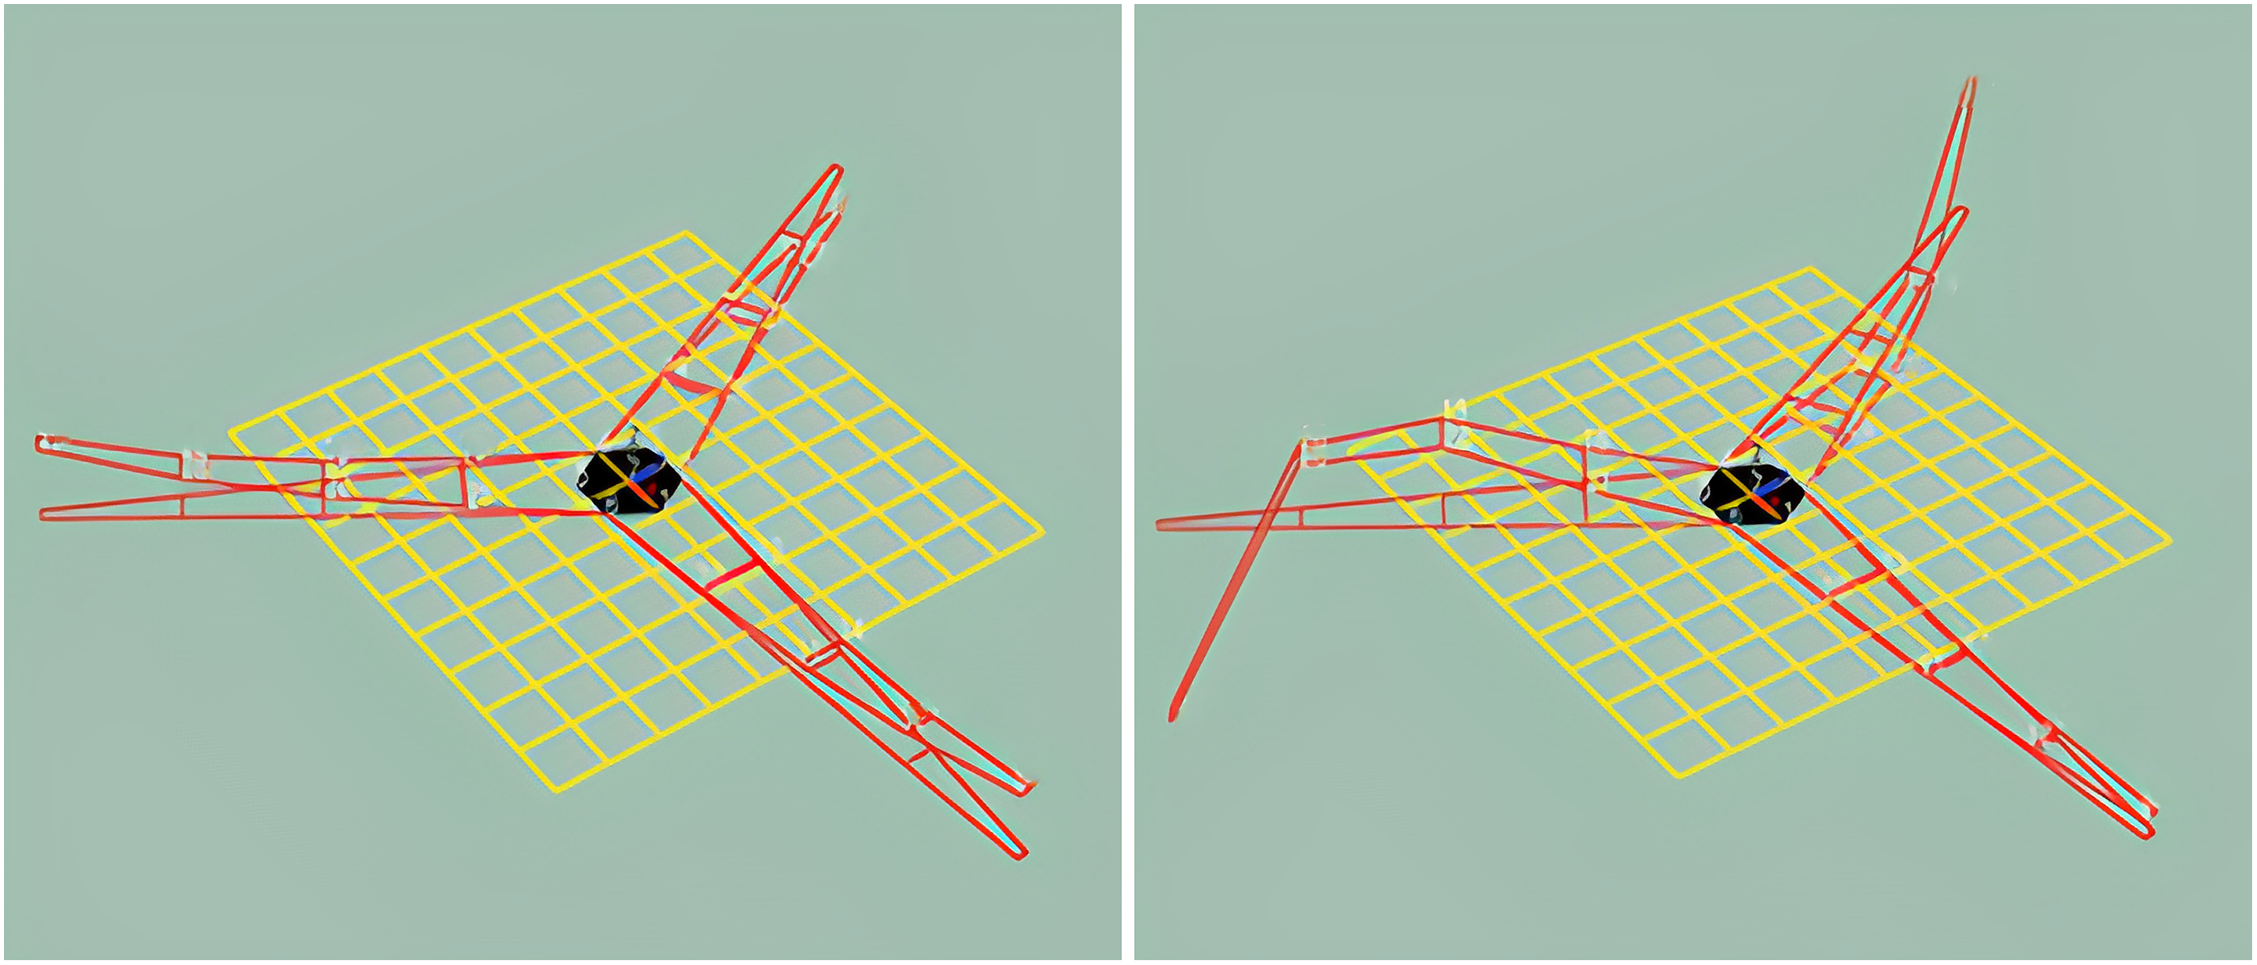
Figure 4: First- and second-order flapping mode shapes
Analysis of the gathered data yielded the eigenvectors and natural frequencies of the blades in both the first- and second-order flapping vibrations. The data from the measurement points were transformed into coordinate data and then imported into MATLAB for polynomial fitting, enabling the derivation of the mode-shape control equations:
where
where
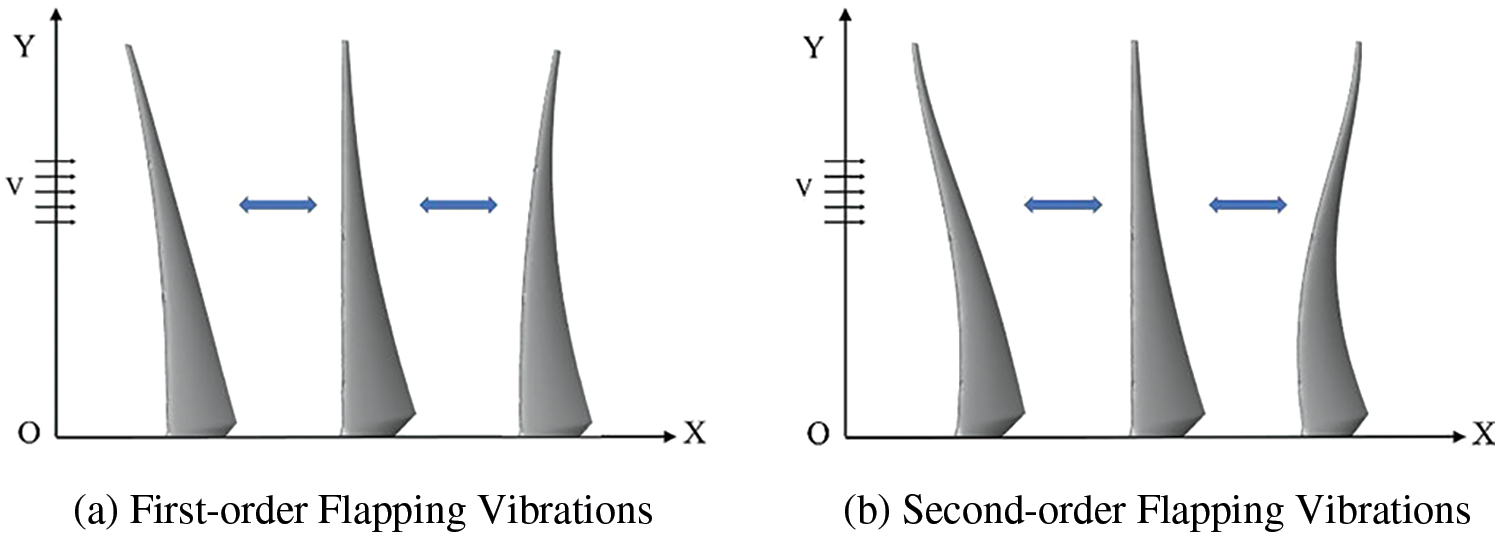
Figure 5: Blade-flapping shapes
2.4 Numerical Simulation Validation
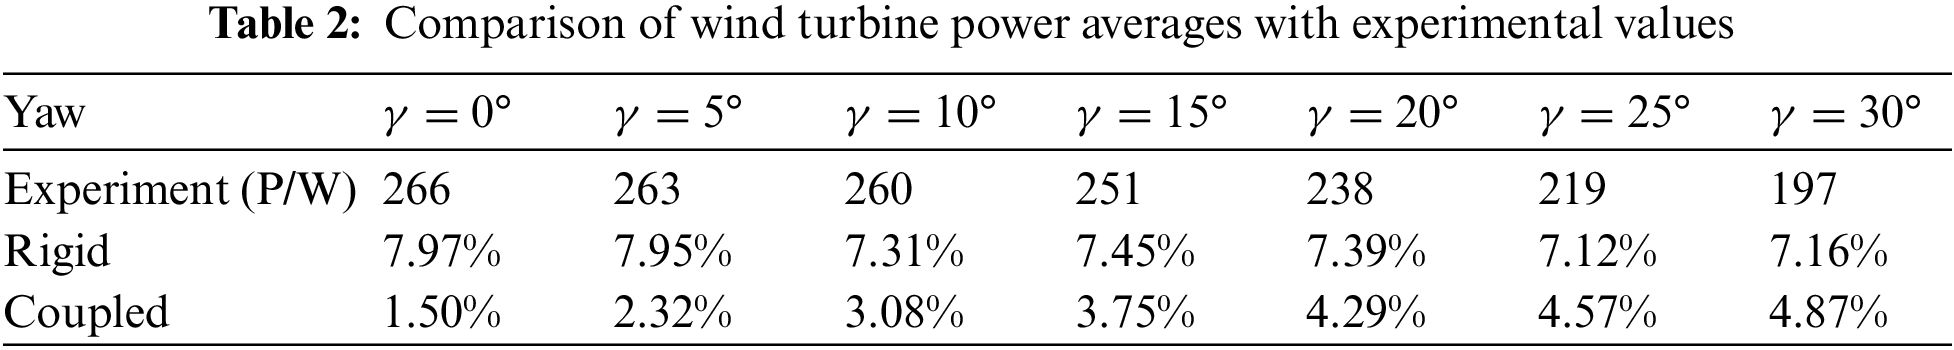
Fig. 6 shows the average output power of both the rigid model and the flapping vibration model under rated conditions, simulated using the Fluent software across yaw angles of 0° to 30°. Under the same conditions, the average output power of the wind turbine under yaw conditions was measured using the wind tunnel experimental setup at Inner Mongolia University of Technology [28]. Table 2 presents the average power outputs of the wind turbine obtained through experimental measurements and numerical simulations at different fixed yaw angles. A comparison of the power curves obtained from the numerical simulations with the experimental data reveals a close match between the predicted power variations and the experimental results. In particular, the power calculated by the coupled model, considering flapwise vibration, agrees closely with that of the experimental data. This result not only verifies the accuracy of the numerical calculation model used in this study but also highlights the significant impact of blade-flapping vibration on the output power of wind turbines.
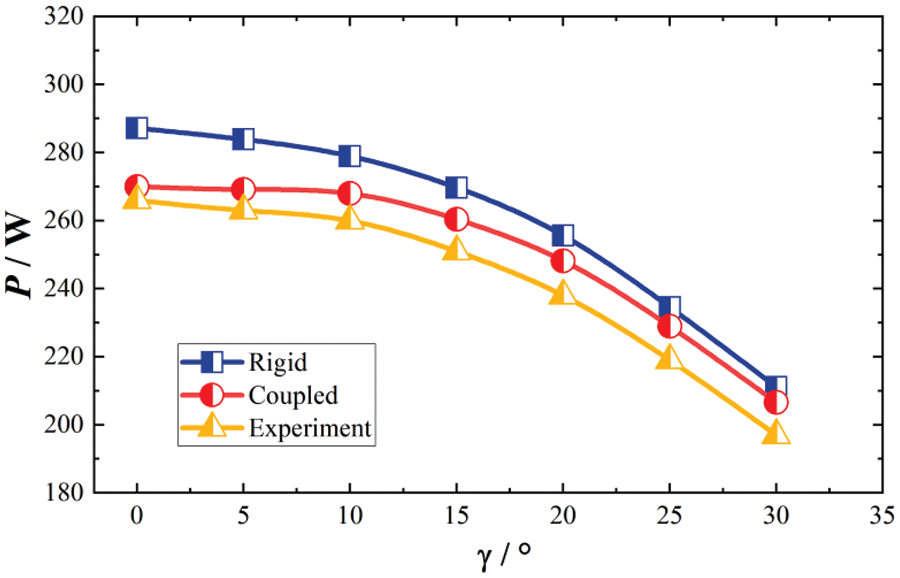
Figure 6: Model accuracy verification
3 Aerodynamic Parameter Analysis of the Wind Rotator and Blades
As shown in Fig. 7, the torque M, axial thrust T, and, for five blade segments within the span of the blade, torque Me, axial load Fa, and tangential load Ft were selected as the parameters for analysis.
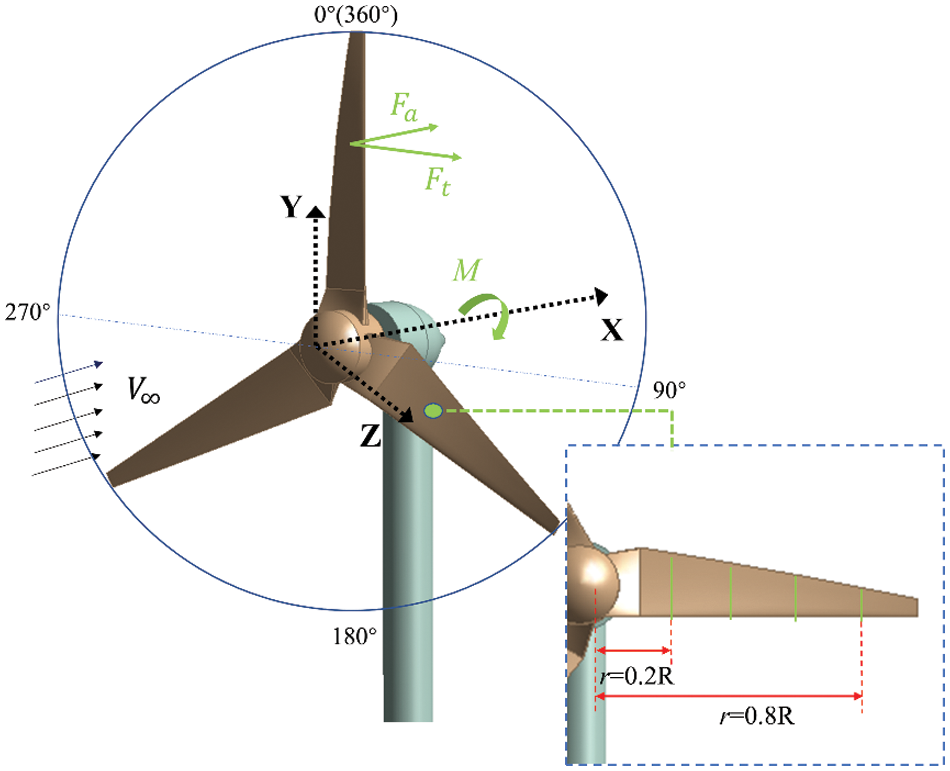
Figure 7: Aerodynamic parameters
3.1 The Impact of Yaw and Blade Flapping on Aerodynamic Parameters of Wind Turbines
Fig. 8a presents the variations in the torque and axial thrust of the wind rotator and blades over one rotation cycle, considering the rigidity of the blades. The analysis indicates that, as the yaw angle increased, the average values of the torque and axial thrust decreased, particularly at larger yaw angles, where the reduction was more pronounced. In addition, periodic changes in the angle of attack caused by yaw led to fluctuations in the aerodynamic parameters within the rotation cycle. These fluctuations intensified with an increasing yaw angle. For an individual blade, yaw causes an increase in the angle of attack on the upwind side, enhancing its torque and axial thrust. Conversely, on the downwind side, the angle of attack decreases rapidly, leading to a reduction and subsequent stabilization of torque and axial thrust.
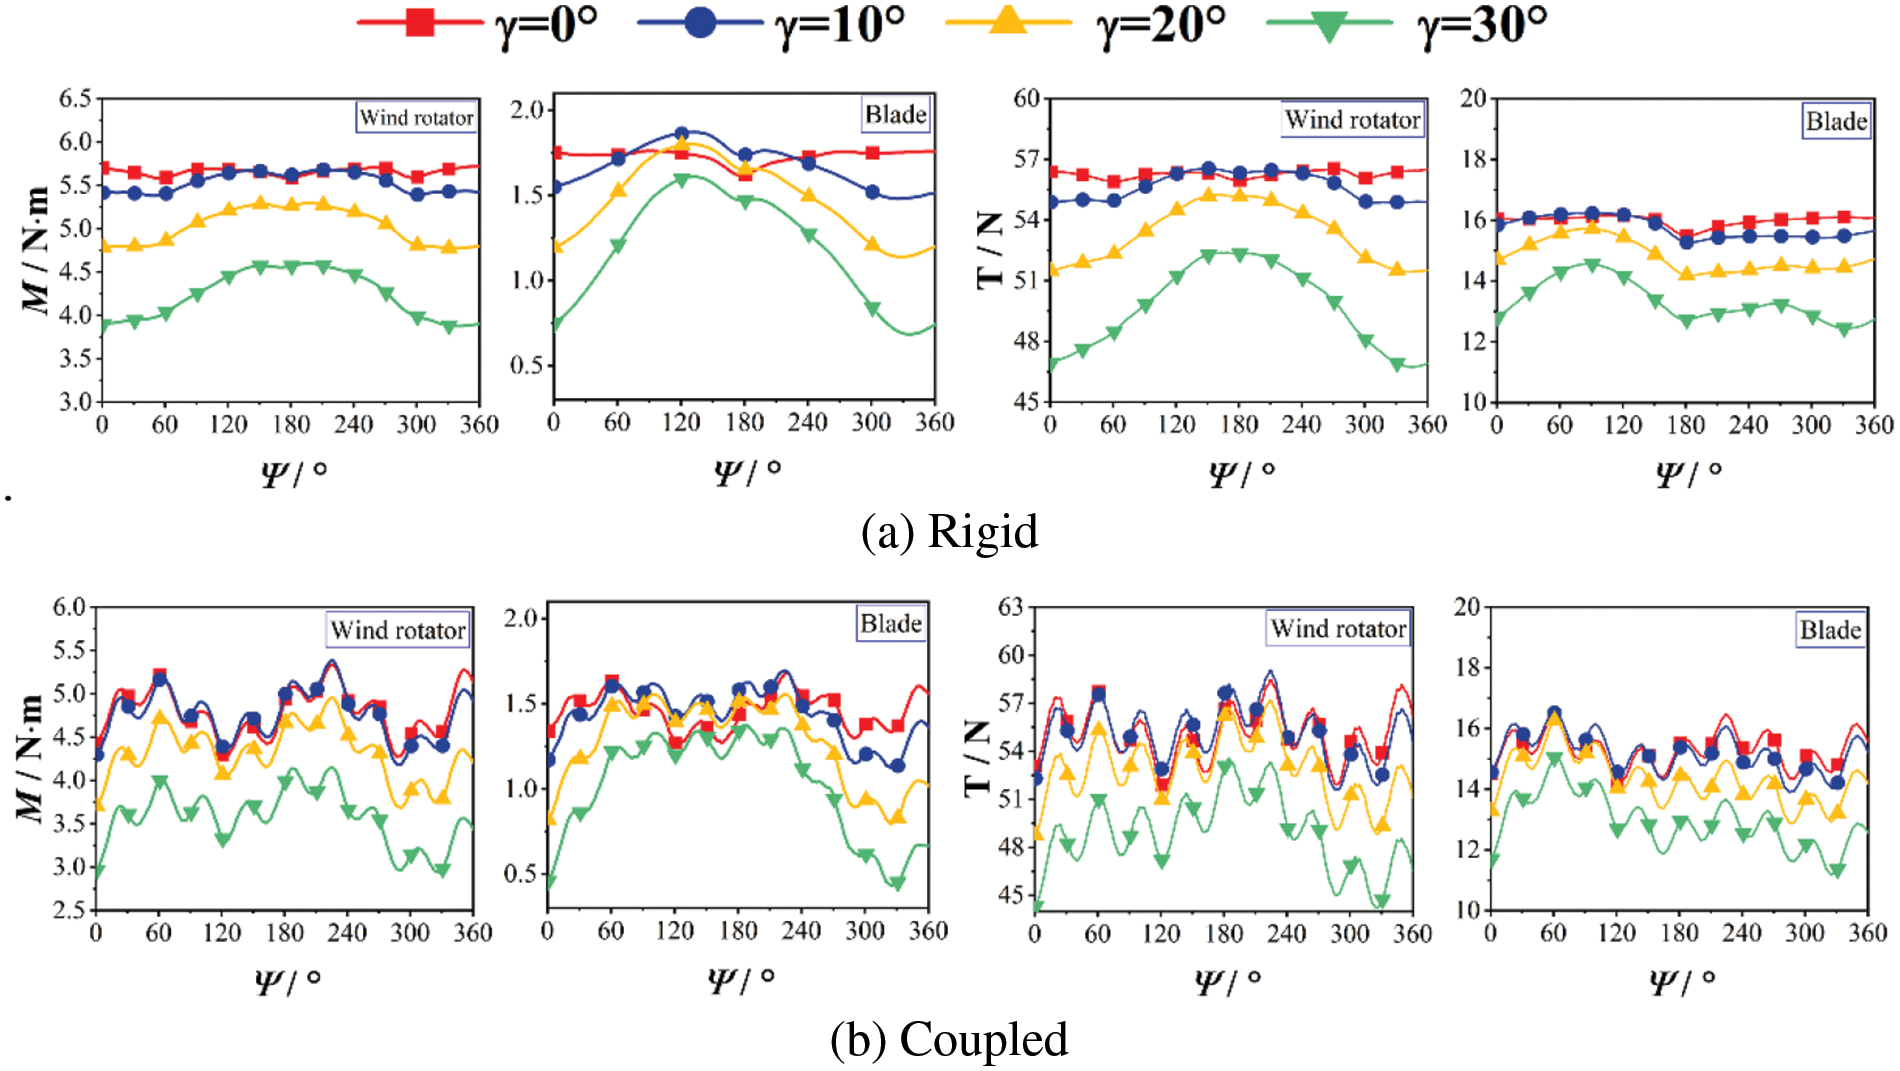
Figure 8: Aerodynamic parameter variation curves with azimuth angle
In Fig. 8b, changes in the M–Ψ and T–Ψ curves are shown after applying second-order flapping vibration to the blades. Although the overall trends are similar to those without coupling, the blade-flapping vibration significantly increases the variability in the aerodynamic parameters. Because of the periodic nature of blade flapping, the fluctuations in the curves also show periodic changes. When the flapping direction aligns with the incoming flow, the axially induced velocity increases, leading to higher torque and axial thrust; conversely, when the flapping direction is opposite to the flow, the axially induced velocity decreases, resulting in reduced torque and axial thrust. Whether in a rigid or coupled state, the trends in the M–Ψ and T–Ψ curves are broadly similar. However, in the rigid state, fluctuations in the aerodynamic parameters caused by the tower shadow effect can be observed, which are much less significant in small wind turbines than in large turbines. In the coupled state, the fluctuations caused by the tower shadow effect are overshadowed by those induced by the flapping vibration.
3.2 Quantitative Analysis of Mean Values and Relative Amplitude of Aerodynamic Parameters
The results of this research demonstrate that yaw significantly affects the mean values and variability of aerodynamic parameters. These effects become more complex when combined with the blade-flapping vibrations. To quantitatively assess these changes, the concept of the mean ratio (Aver) was introduced in this study to reflect the impact of yaw and blade flapping on the mean values of the aerodynamic parameters. Aver represents the ratio of the average value of an aerodynamic parameter over one rotation cycle of a wind rotator at a specific yaw angle to its value without yaw. Under the conditions of blade-flapping vibration, the average value of the aerodynamic parameter is compared with its mean value in the absence of both yaw and flapping vibrations, and the relative amplitude (Fm) is introduced to quantify the degree of fluctuation of an aerodynamic parameter relative to its mean value. Specifically, it represents the ratio of the amplitude (i.e., the difference between the maximum and minimum values) of an aerodynamic parameter over one rotation cycle of the wind rotator to its average value. The formula is
Fig. 9 shows the mean ratio (Aver) and relative amplitude (Fm) of the torque M and axial thrust T for the wind rotator and blades under rated conditions, both in the rigid state and with a second-order flapping vibration. In the rigid state, yaw causes a decrease in Aver, with a more pronounced effect on torque than on axial thrust. Comparing the wind rotator and blades shows that the reduction in Aver was greater for the blades; this difference increased with the yaw angle. After applying the blade-flapping vibration, both Aver-M and Aver-T, particularly Aver-M, decreased, indicating that the blade-flapping vibration had a more significant impact on the torque generation of the wind turbine.
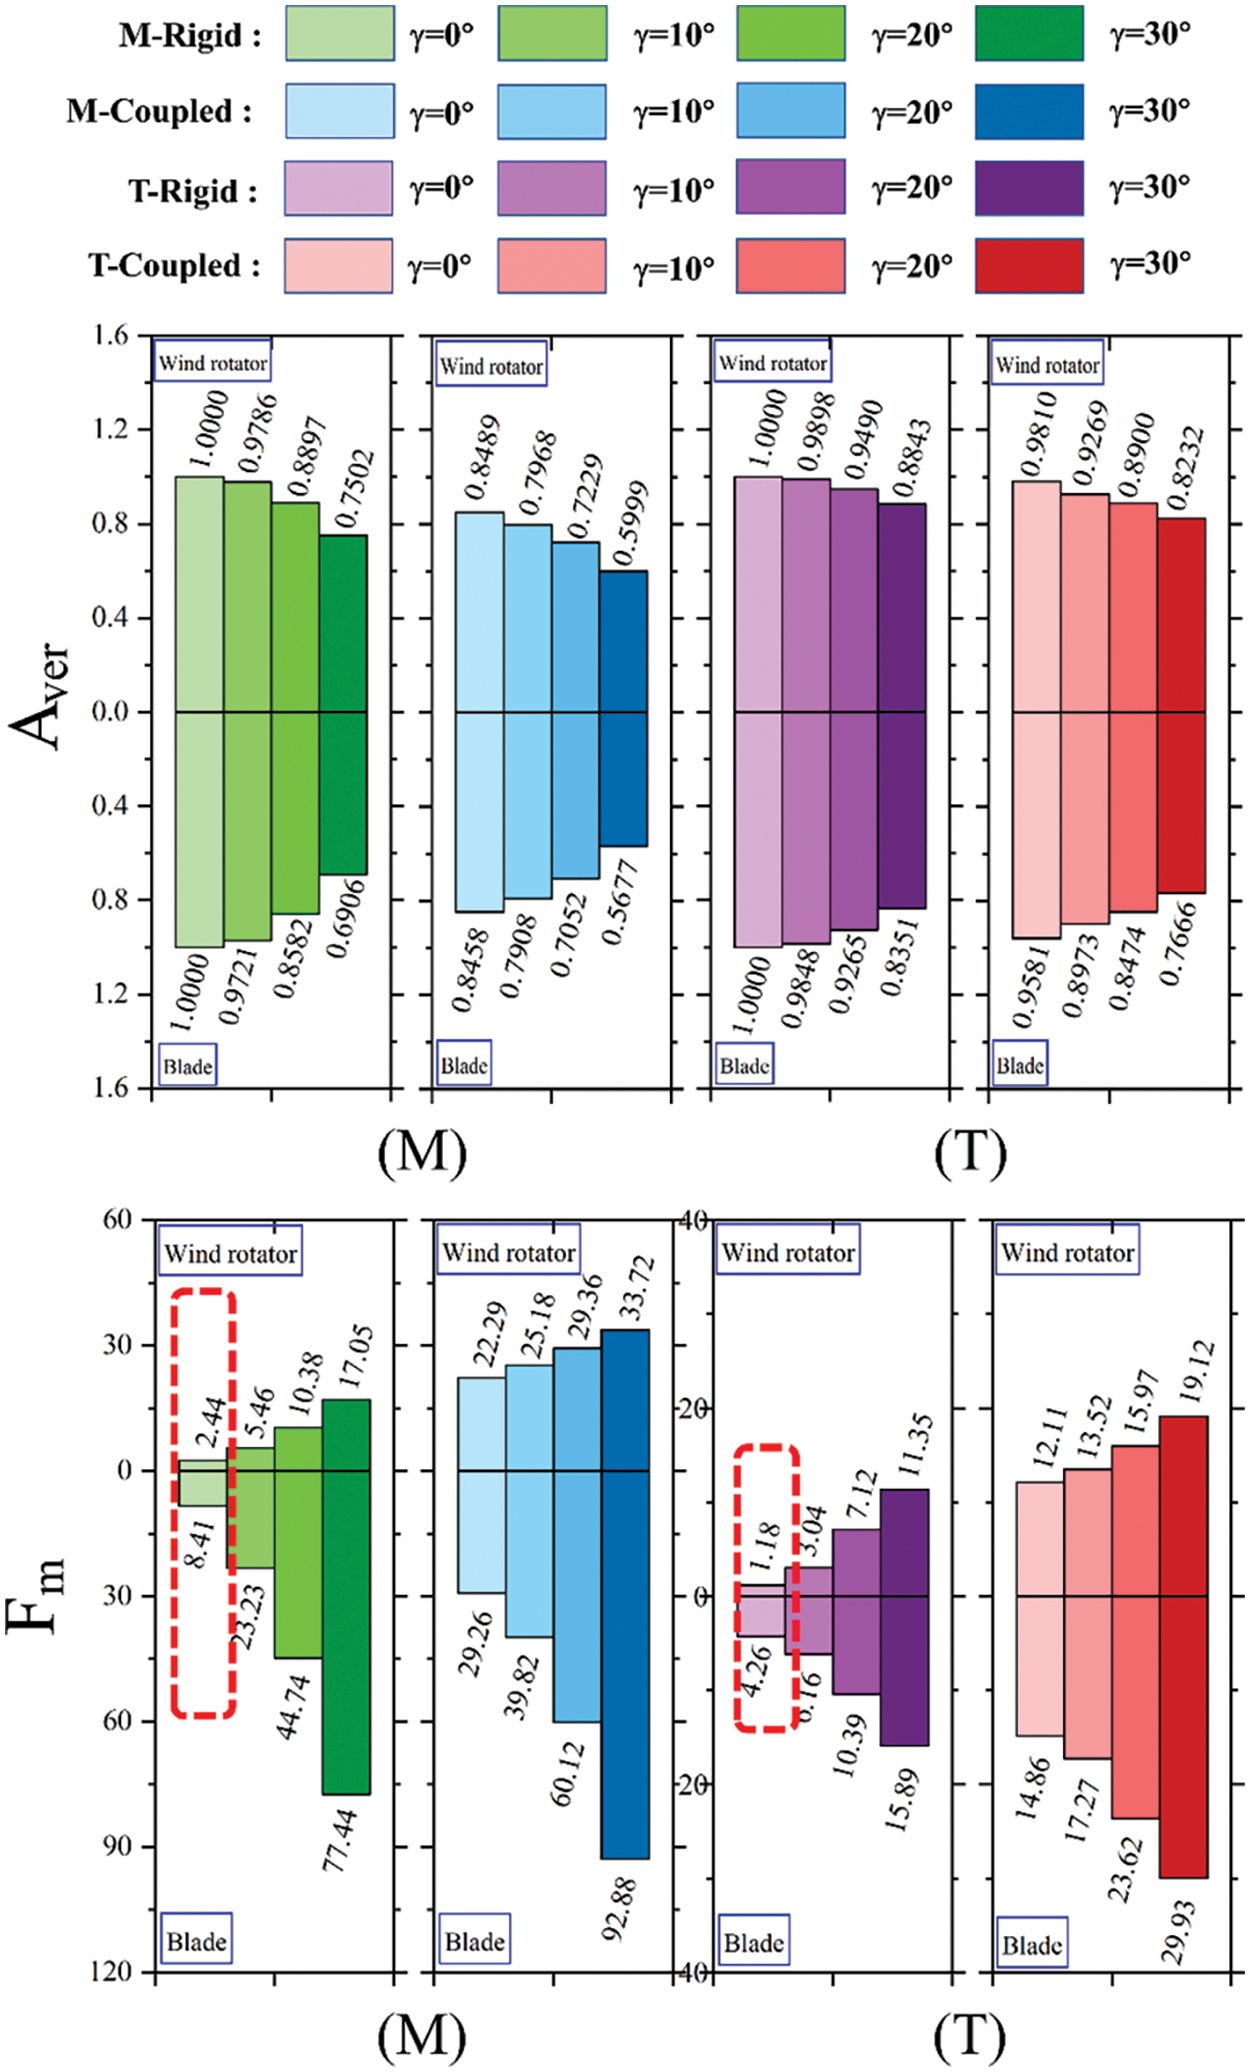
Figure 9: Aerodynamic parameters Aver and Fm
The torque and axial thrust fluctuations were analyzed. When the aerodynamic fluctuations of each blade, with a phase difference of approximately 120°, were superimposed, the overall aerodynamic parameter amplitude of the wind rotator was significantly reduced. For instance, at γ = 30°, the relative amplitude of the blade torque curve reached 77.44%, whereas for the wind rotator, it was only 17.05%. The relative amplitude of the blade axial thrust was 15.89%, in relation to 11.35% for the wind rotator, which was less than that of the torque curve.
The tower shadow effect is crucial in large wind-power systems. The fluctuation within the dashed box in Fig. 9 occurred when there was no yaw or blade vibration. This fluctuation is entirely attributed to the tower shadow effect; for example, a 2.5 MW wind turbine has a power fluctuation rate of 7.4% under the tower shadow effect [29], far exceeding the 2.44% determined for small wind turbines in the study. After applying the flapping vibration, the relative amplitudes of the aerodynamic parameters significantly increased. In wind-power systems, torque fluctuations in the wind rotator lead to fluctuations in the rotor speed, which affect the output power of the generator and are directly related to the power stability of the electrical grid. Additionally, axial thrust fluctuations on the wind rotator not only pose a challenge to the structural stability of the wind turbine but also increase its fatigue risk, especially on the blades and other key structural components. Therefore, for the design and operation of wind-power systems, it is crucial to consider the impacts of yaw and blade flapping on the entire system and its power output.
4 Aerodynamic Performance Analysis of Blade Radial Wing Sections
To further investigate the aerodynamic parameters of the wind turbine blades and their variation patterns along the span over the entire rotation cycle, the blades were divided into five segments along the span, each with a length of 0.2R, as shown in Fig. 7. It was assumed that there was no forced transfer between the segments.
4.1 Radial Torque Distribution of the Blade
Fig. 10a shows the torque distribution of the rigid blades. At γ = 0°, the torque distribution cloud map of the blade rotating one round is circular, with the main working area of the blade from 0.6R to the blade tip. As γ increased and the inflow angle changed, the wind speed distribution on the blade became uneven, resulting in an overall downward trend in torque. The high-torque area’s circular ring narrowed, gradually changing into a crescent shape opening at Ψ = 330°, with the upwind torque exceeding that of the downwind side. The low-torque areas were concentrated near the blade root, spreading fan-shaped toward Ψ = 0°. The torque extremes did not align with the yaw rotation axis, which served as the dividing line between upwind and downwind, but were instead offset by approximately 30°, reaching a maximum and minimum at Ψ = 120° and Ψ = 300°, respectively. As shown in Table 3, an increase in γ reduced both the maximum and minimum values of blade torque, with the former decreasing more significantly, thus reducing the difference between torque extremes. The increasing unevenness of the torque distribution due to yaw heightens the fatigue risk of the blade and negatively impacts the power output.
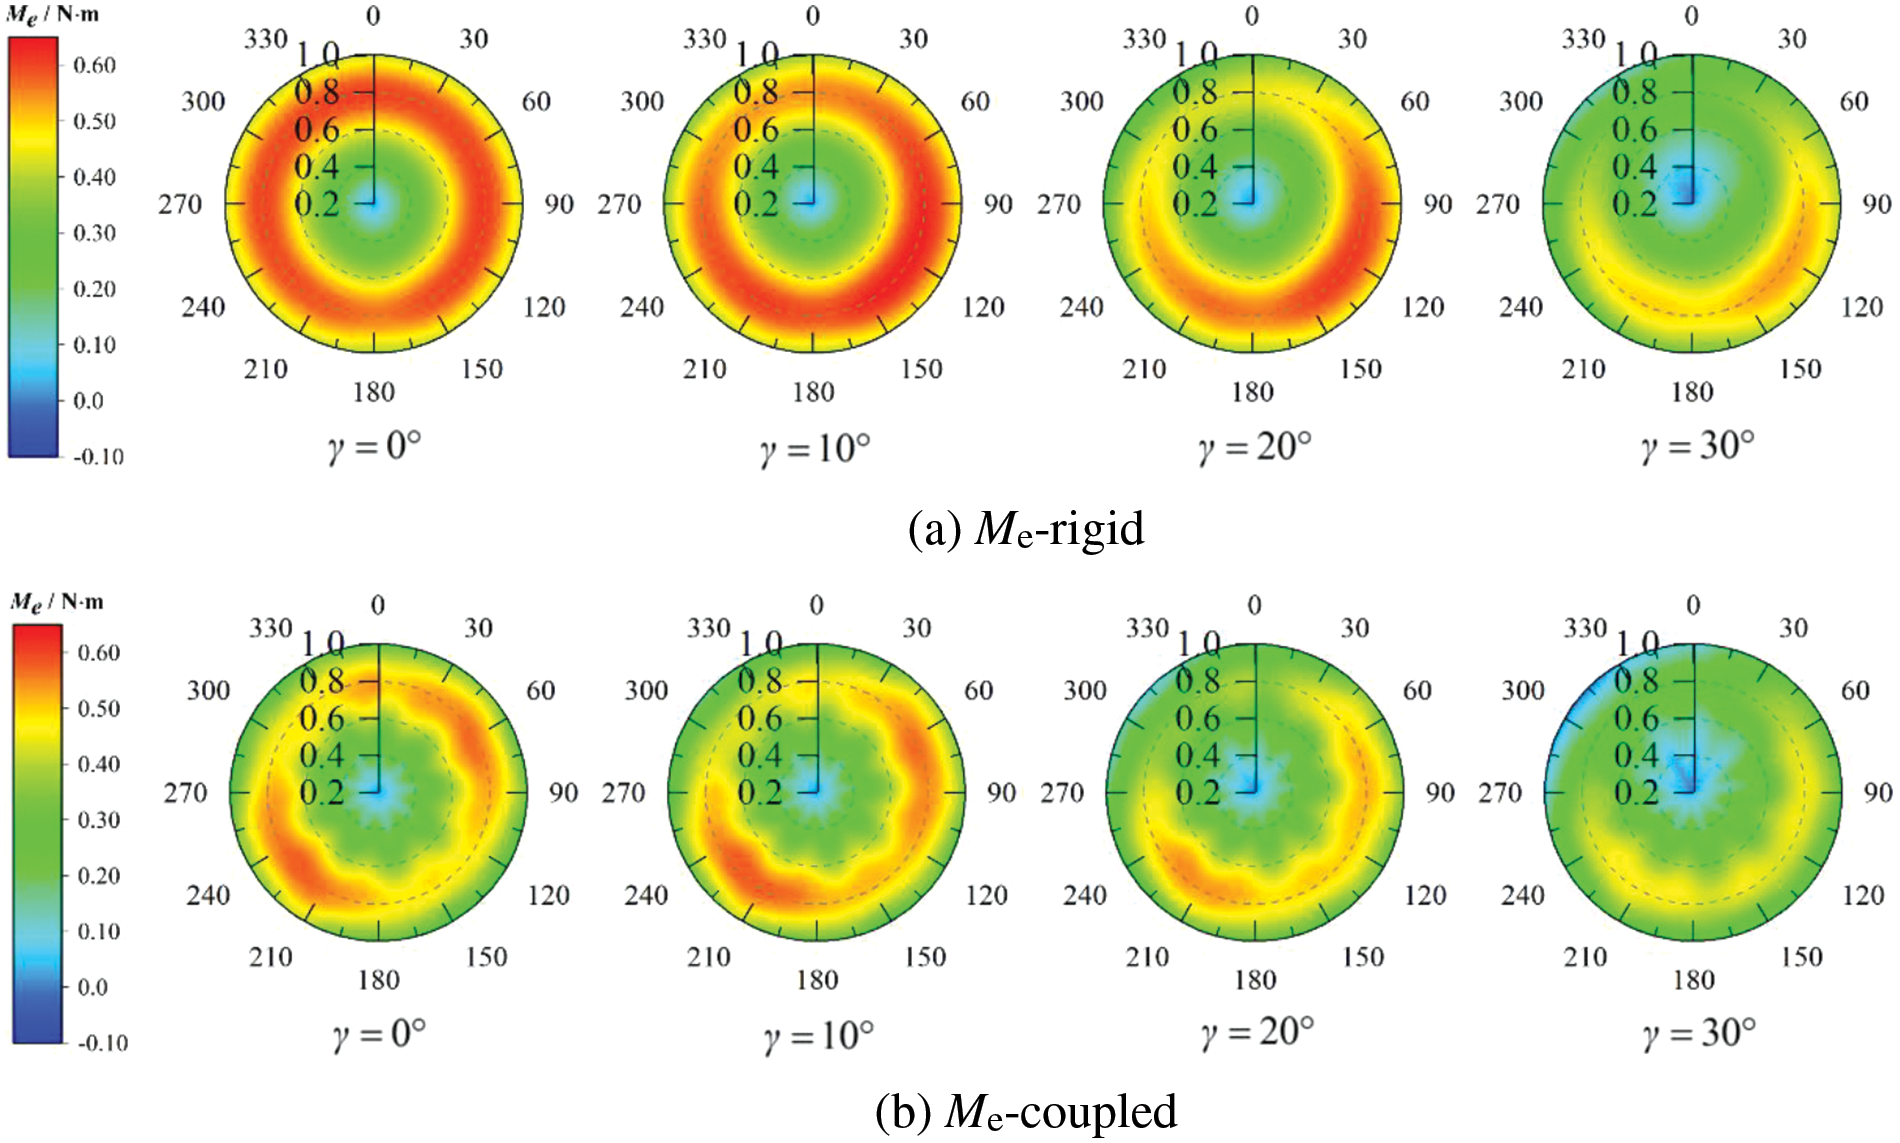
Figure 10: Radial distribution of torque under different yaw angles
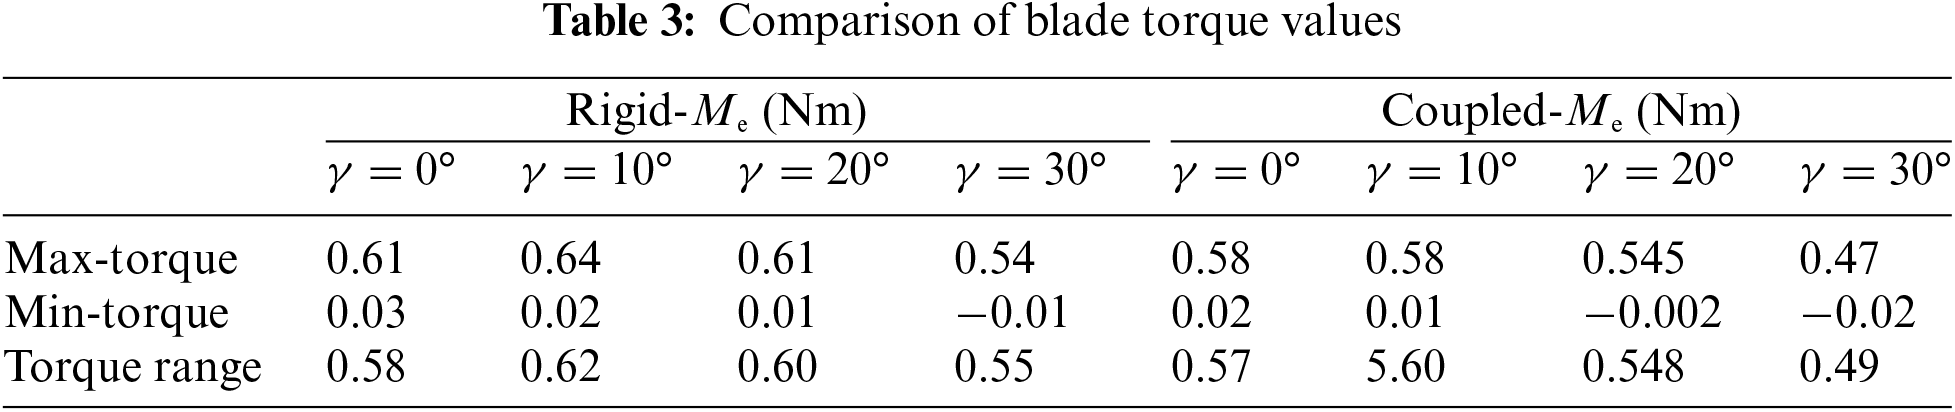
Fig. 10b shows the torque distribution of the blades considering the flapping vibration, revealing that the torque of the flapping vibration blades was significantly lower than that of the rigid blades because the flapping vibration reduces the efficiency of the blades in generating work. A portion of the energy is used for vibration rather than being converted into mechanical energy. At γ = 0°, the blade torque exhibited periodic high and low bands, related to the initial phase of applied flapping vibration (Ψ = 0° was the initial phase of vibration in this study) and vibration frequency. When the blade rotated to Ψ = 60°, the flapping direction aligned with the inflow direction, maximizing blade torque. At Ψ = 180°, the blade rebounded, and the flapping direction opposed the inflow, reducing the torque. Owing to the periodic nature of the vibration, the same changes occurred from 180° to 360°. Combined with yaw, the maximum torque appeared near 210°. This axial back-and-forth motion altered the local angle of attack and speed of each airfoil section relative to the inflow wind speed, causing significant oscillations in the high-torque-area ring, with the inner wall contracting into a “gear” shape. The circular low-torque area also morphed into a “gear” shape, possibly related to uneven local responses of the blade. The increase in γ induced shape changes in high- and low-torque areas similar to those shown in Fig. 10a, indicating that blade-flapping vibration did not alter the impact of yaw on wind turbine torque but did irregularly affect torque distribution, increasing its variability. In practical engineering applications, because blade flapping is random, the distribution of the torque magnitude varies; however, its variability remains constant. This variability can lead to stress fluctuations in the blades and potentially induce flutter, thereby damaging the wind turbine structure.
4.2 Radial Distribution of Axial Load on Blades
Axial loads directly affect the mechanical stress on the wind turbine blades, main shaft, and transmission systems. Understanding the distribution of the axial loads under yaw conditions is crucial for the design and maintenance of wind turbines. Fig. 11 shows the distribution cloud maps of axial loads for both rigid and flapping vibration blades over a rotation cycle. As shown in Fig. 11a, at γ = 0°, the highest axial load occurred near the blade tip, distributed in a ring shape throughout the rotation cycle. The axial load on the blade decreased radially from the tip to the root, with a low-load area at the root forming a circular pattern because the aerodynamic loads are directly proportional to the square of the relative speed of the blade to the air. Thus, owing to their higher linear speeds, blade tips typically endure greater aerodynamic loads. As γ increased, the wind speed decomposed along the axial and tangential directions as

Figure 11: Radial distribution of axial load under different yaw angles
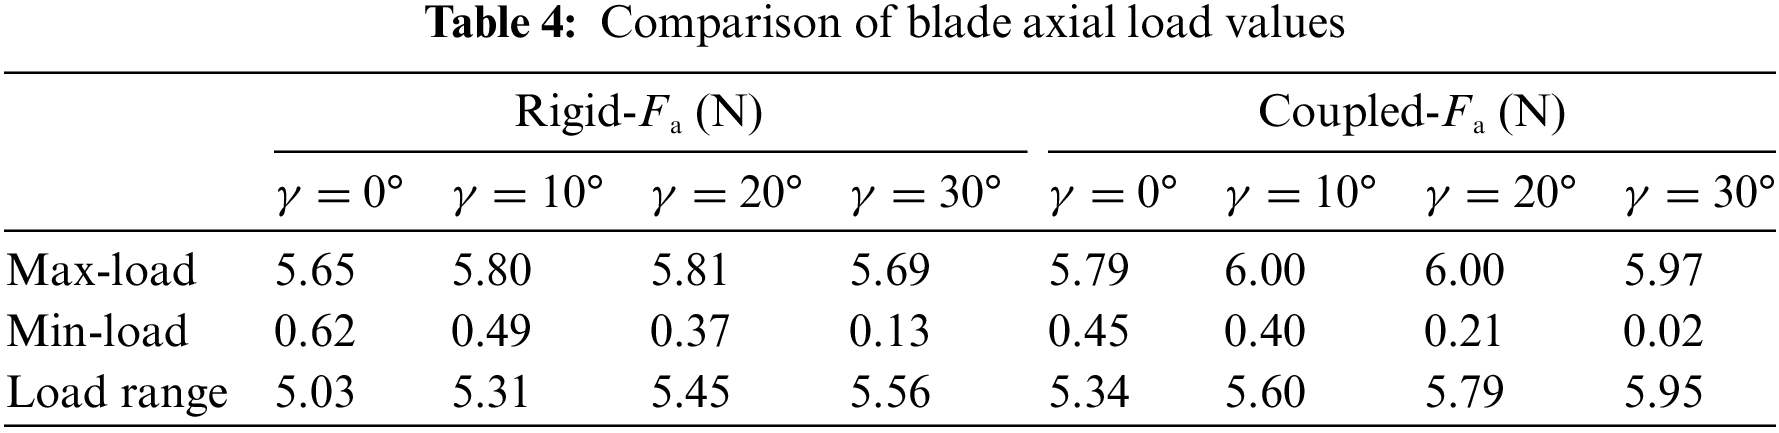
For coupled blades, as shown in Fig. 11b, when γ = 0°, high-load areas near the blade tip show a periodic high- and low-band distribution related to the direction of flapping vibration. However, no significant fluctuations were observed, and the ring width did not change significantly. In contrast, the low-load area near the root exhibited significant periodic fluctuations, and the originally circular low-load area transformed into a “gear” shape. This result could be due to the different responses to vibration at the root, where the stiffness and mass differ from those of other parts of the blade, showing a relatively larger dynamic response. As γ increased, changes in the high-load area were similar to those in rigid blades, but the low-load area expanded and its fluctuations intensified. Table 4 shows that with increasing γ, the difference between the extreme values of axial load increased, especially after applying flapping vibration, indicating a significant increase in the entire blade’s fatigue risk. This phenomenon not only reduces the energy utilization efficiency of the wind turbine but also increases maintenance costs.
4.3 Radial Distribution of Tangential Load on Blades
Fig. 12 shows the curves of the tangential load distribution along the blade radius at different typical rotational azimuth angles for both rigid and flapping vibration blades. The analysis indicates that although axial loads are primarily caused by wind pressure, tangential loads result from wind shear forces. The axial load is much larger than the tangential load, and the aerodynamic loads on the wind turbines are mainly determined by the axial loads. Overall, the shapes of the Ft–r/R curves under different yaw angles were essentially the same, following an initial increase and then a decrease.
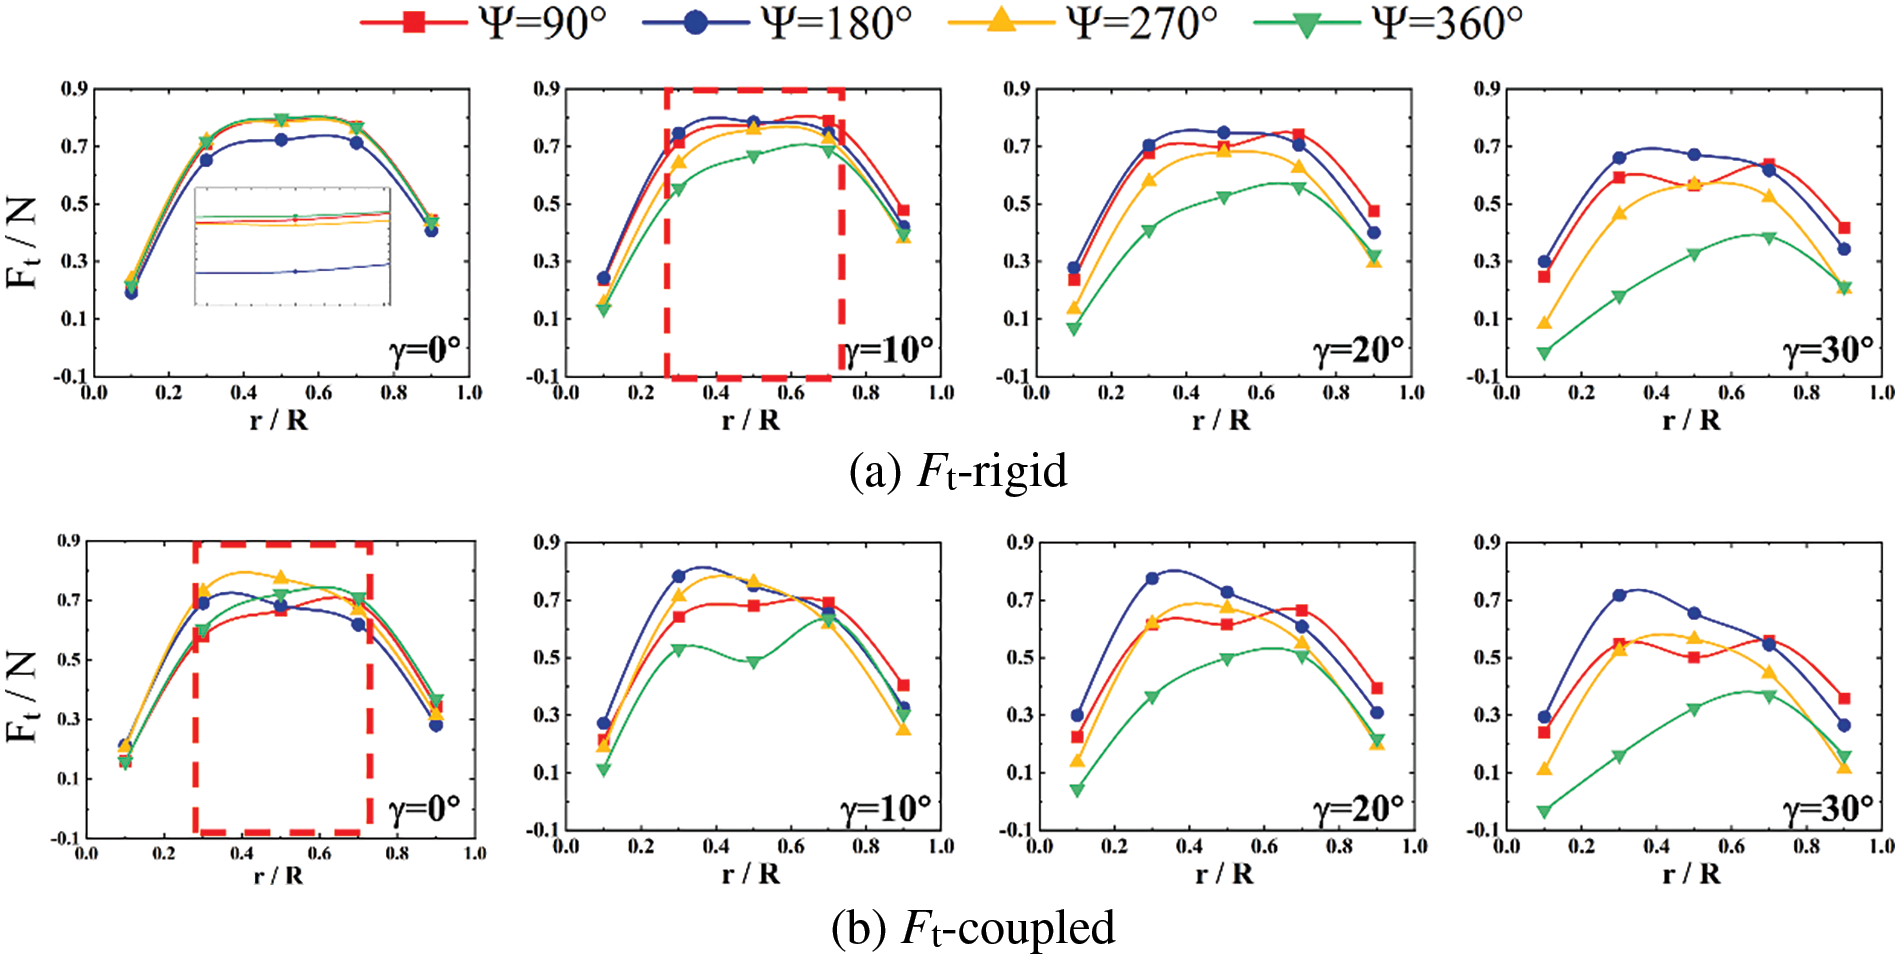
Figure 12: Curves of tangential load variation with the radial position of the blade
As shown in Fig. 12a, without yaw, the tangential load of the blade remained relatively stable, fluctuating only at Ψ = 180° due to the tower shadow effect. The primary area for tangential load on the blade was between 0.2R and 0.8R. As γ increased, the relative angle between the inflow and the blade changed, reducing the overall tangential load. The high-load area contracted near 90°–180°, whereas the low-load area expanded toward 360°, with the reduction in the low-load area being much more significant than that in the high-load area. Over a complete rotation cycle, the blade transitioned from a high-load area to a low-load area, with the maximum load gradually shifting from 0.4R to 0.8R. This phenomenon became more pronounced with an increasing yaw angle, indicating that the yaw angle had a significant impact on the load distribution.
After applying the flapping vibration, as shown in Fig. 12b, the Ft–r/R curve exhibited more noticeable fluctuations. Without yaw, the high-load area was approximately 180°–270°. As γ increased, the high-load area contracted near 180°, exceeding that in the rigid state with a maximum load at 0.4R. Comparing the tangential loads before and after coupling shows that the yaw had a more significant impact on the tangential load of the blade than the blade-flapping movement.
In this study, CFD was utilized to analyze the torque and axial forces on rigid and second-order flapping vibratory blades under yaw conditions. The distribution patterns of the blade torque and loads along the radial direction under different azimuth angles were also investigated, leading to the following conclusions:
1. With an increase in yaw angle, both the torque and axial thrust of the wind turbine decrease, whereas the relative amplitude of these parameters increases. When flapping vibration is applied to the blades, these average values decrease further, and their variability significantly increases, affecting the torque of the wind turbine more prominently.
2. Flapping vibration causes axial back-and-forth movement of the blades, leading to an uneven distribution of airflow speed on the blade surface and a decrease in torque. Simultaneously, it causes periodic changes in the local angle of attack at different airfoil sections, causing the torque region along the radial direction to contract into a “gear” shape and produce noticeable oscillations, significantly increasing its variability.
3. The maximum axial load is primarily concentrated near the blade tip, whereas the maximum tangential load is distributed along the middle section of the blade, that is, in the 0.2R to 0.8R region. Both yaw and blade-flapping vibrations increase the variability of the axial and tangential loads, with flapping vibrations having a smaller impact on the tangential load than on the axial load. In blade design, it is essential to consider the distribution patterns of loads owing to flapping vibrations to enhance the performance and durability of the blades.
Acknowledgement: We acknowledge the support of the National Natural Science Foundation of China, the Major Project of the Natural Science Foundation of Inner Mongolia Autonomous Region, and the Fundamental Research Funds for the Central Universities of Inner Mongolia Autonomous Region for this research work.
Funding Statement: This work was supported by the National Natural Science Foundation of China (51866012), the Major Project of the Natural Science Foundation of Inner Mongolia Autonomous Region (2018ZD08), and the Fundamental Research Funds for the Central Universities of Inner Mongolia Autonomous Region (JY20220037).
Author Contributions: The contributions of the authors to the paper are as follows: Research conception and design: Shaokun Liu, Zhiying Gao, Runa Su. Data collection: Mengmeng Yan, Jianwen Wang. Results analysis and interpretation: Shaokun Liu, Zhiying Gao, Runa Su. Manuscript drafting: Shaokun Liu, Zhiying Gao. All authors reviewed the results and approved the final version of the manuscript.
Availability of Data and Materials: All data, models, or codes that support the findings of this study are available from the corresponding author upon reasonable request.
Conflicts of Interest: The authors declare that they have no conflicts of interest to report regarding the present study.
References
1. V. Jahangiri and C. Sun, “Three-dimensional vibration control of offshore floating wind turbines using multiple tuned mass dampers,” Ocean Eng., vol. 206, pp. 107–196, 2020. doi: 10.1016/j.oceaneng.2020.107196. [Google Scholar] [CrossRef]
2. J. Dai, X. Yang, W. Hu, L. Wen, and Y. Tan, “Effect investigation of yaw on wind turbine performance based on SCADA data,” Energy, vol. 149, pp. 684–696, 2018. doi: 10.1016/j.energy.2018.02.059. [Google Scholar] [CrossRef]
3. H. Jokar, M. Mahzoon, and R. Vatankhah, “Nonlinear dynamic characteristics of horizontal-axis wind turbine blades including pre-twist,” Ocean Eng., vol. 256, pp. 111441, 2022. doi: 10.1016/j.oceaneng.2022.111441. [Google Scholar] [CrossRef]
4. D. Tang, S. Bao, L. Luo, J. Mao, B. Lv and H. Guo, “Study on the aeroelastic responses of a wind turbine using a coupled multibody-FVW method,” Energy, vol. 141, pp. 2300–2313, 2017. doi: 10.1016/j.energy.2017.11.105. [Google Scholar] [CrossRef]
5. D. Y. Li, X. N. Wang, W. W. Mo, and C. T. Zhong, “Aeroelastic coupling analysis of wind turbine flexible blades under unsteady conditions,” Acta Energ. Sol. Sin., vol. 4, pp. 966–975, 2017. doi: 10.1016/j.jweia.2019.104057. [Google Scholar] [CrossRef]
6. Y. Zhao, Y. Q. Du, X. W. Wang, Z. Yang, and Z. Y. Wang, “Uncertainty analysis in fatigue damage assessment of wind turbine support structures,” (in ChineseProc. CSEE, vol. 16, pp. 6313–6320, 2023. [Google Scholar]
7. Y. Li, S. Kang, J. Wang, and P. Zhao, “Numerical simulation of fluid-structure interaction for the 2.5MW wind turbine blades,” J. Eng. Thermophys., vol. 1, pp. 71–74, 2013. [Google Scholar]
8. Y. Zhao, C. Liao, and Z. Qin, “Aeroelastic coupling analysis of blades based on high-precision finite element model,” J. Eng. Thermophys., vol. 38, pp. 748–753, 2017. [Google Scholar]
9. S. Tang, B. Sweetman, and J. Gao, “Nonlinear effects and dynamic coupling of floating offshore wind turbines using geometrically-exact blades and momentum-based methods,” Ocean Eng., vol. 229, pp. 108866, 2021. doi: 10.1016/j.oceaneng.2021.108866. [Google Scholar] [CrossRef]
10. A. K. Sabale and N. K. Gopal, “Nonlinear aeroelastic analysis of large wind turbines under turbulent wind conditions,” AIAA J., vol. 57, pp. 4416–4432, 2019. doi: 10.2514/1.J057404. [Google Scholar] [CrossRef]
11. P. Lü, M. F. Liao, and Y. J. Yin, “Nonlinear fluid-structure coupling model for large wind turbine blades,” Acta Energ. Sol. Sin., vol. 37, pp. 2126–2135, 2017. [Google Scholar]
12. Z. G. Li, C. Y. Song, Z. Y. Gao, L. R. Zhang, and J. W. Wang, “Development and application of a numerical model for aero-elastic coupling of large megawatt wind turbines,” (in ChineseProc. CSEE, vol. 43, pp. 7948–7959, 2023. [Google Scholar]
13. Z. Li, B. Wen, X. Dong, Z. Peng, Y. Qu and W. Zhang, “Aerodynamic and aeroelastic characteristics of flexible wind turbine blades under periodic unsteady inflows,” J. Wind Eng. Ind. Aerodyn., vol. 197, pp. 104057, 2020. doi: 10.1016/j.jweia.2019.104057. [Google Scholar] [CrossRef]
14. Y. C. Fang, Y. Y. Chen, Z. Y. Gao, and M. M. Yan, “CFD simulation of wind turbine output characteristics based on blade dynamic response,” Comput. Simul., vol. 2, pp. 106–109+158, 2020. [Google Scholar]
15. J. X. Feng et al., “Influence of blade flapping motion on the aerodynamic characteristics of wind turbines,” Acta Energ. Sol. Sin., vol. 7, pp. 478–485, 2023. [Google Scholar]
16. W. L. Yu et al., “Research on wind-rain-induced structural response and stability performance of large wind turbines considering yaw effect,” Acta Energ. Sol. Sin., vol. 10, pp. 236–245, 2020. [Google Scholar]
17. H. Lee and D. J. Lee, “Wake impact on aerodynamic characteristics of horizontal axis wind turbine under yawed flow conditions,” Renew. Energy, vol. 136, pp. 383–392, 2019. doi: 10.1016/j.renene.2018.12.126. [Google Scholar] [CrossRef]
18. Y. Tian, C. Gao, and Y. Liu, “Characteristics of yaw and pitch wake in horizontal axis wind turbines,” Acta Aerodyn. Sin., vol. 11, pp. 80–93, 2023. [Google Scholar]
19. X. L. Wang, L. R. Zhang, J. Q. Zhang, and J. W. Wang, “Research on wind turbine output power under coupled fluid-structure interaction in yaw conditions,” J. Eng. Thermophys., vol. 3, pp. 641–646, 2021. [Google Scholar]
20. X. Cai, R. Gu, P. Pan, and J. Zhu, “Unsteady aerodynamics simulation of a full-scale horizontal axis wind turbine using CFD methodology,” Energy Convers. Manag., vol. 112, pp. 146–156, 2016. doi: 10.1016/j.enconman.2015.12.084. [Google Scholar] [CrossRef]
21. W. P. Zhou, S. L. Tang, and H. Lv, “Influence of wind shear and dynamic inflow on the wake and aerodynamic performance of horizontal axis wind turbine,” (in ChineseProc. CSEE, vol. 14, pp. 122–127, 2012. [Google Scholar]
22. J. W. Wang et al., “Research on the influence of wind shear and wind direction variation on yawed wind turbine aerodynamic characteristics,” (in ChineseProc. CSEE, pp. 1–14, Nov. 2023. doi: 10.13334/j.0258-8013.pcsee.231423. [Google Scholar] [CrossRef]
23. Y. Li, L. Li, Q. Liu, and H. Lv, “Dynamic characteristics of lag vibration of a wind turbine blade,” Acta Mech. Solida Sin., vol. 26, pp. 592–602, 2013. doi: 10.1016/S0894-9166(14)60004-5. [Google Scholar] [CrossRef]
24. X. Chen, Z. Qin, K. Yang, X. Zhao, and J. Xu, “Numerical analysis and experimental investigation of wind turbine blades with innovative features: Structural response and characteristics,” Sci. China Technol. Sci., vol. 58, pp. 1–8, 2015. doi: 10.1007/s11431-014-5741-8. [Google Scholar] [CrossRef]
25. X. X. Zhang, Z. Y. Gao, R. N. Su, C. Q. Zhang, and J. W. Wang, “Research on noise reduction performance optimization of wind turbines based on tower addition of helical line,” Acta Energ. Sol. Sin., vol. 8, pp. 422–429, 2022. [Google Scholar]
26. H. Zhang, J. Wen, and J. Zhan, “Effects of blade number on the aerodynamic performance and wake characteristics of a small horizontal-axis wind turbine,” Energy Convers. Manag., vol. 273, pp. 116410, 2022. doi: 10.1016/j.enconman.2022.116410. [Google Scholar] [CrossRef]
27. L. Zhou, J. Wen, and Z. Wang, “High-fidelity wind turbine wake velocity prediction by surrogate model based on d-POD and LSTM,” Energy, vol. 275, pp. 127525, 2023. doi: 10.1016/j.energy.2023.127525. [Google Scholar] [CrossRef]
28. S. Zhao, X. Li, and J. W. Wang, “Study of the flow mechanism of wind turbine blades in the yawed condition,” Energy Eng., vol. 119, pp. 1379–1392, 2022. doi: 10.32604/ee.2022.019776 [Google Scholar] [CrossRef]
29. A. Ghandour, T. de Troyer, and M. C. Runacres, “A combined potential flow-BEM model to study the tower shadow effect in wind turbines,” J. Wind Eng. Ind. Aerodyn., vol. 229, pp. 105131, 2022. doi: 10.1016/j.jweia.2022.105131. [Google Scholar] [CrossRef]
Cite This Article
 Copyright © 2024 The Author(s). Published by Tech Science Press.
This work is licensed under a Creative Commons Attribution 4.0 International License , which permits unrestricted use, distribution, and reproduction in any medium, provided the original work is properly cited.
 Downloads
 Citation Tools