
 Submit a Paper
 Propose a Special lssue
 Open Access
ARTICLE

CFD Investigation of Diffusion Law and Harmful Boundary of Buried Natural Gas Pipeline in the Mountainous Environment
1 School of Petroleum Engineering, Southwest Petroleum University, Chengdu, 610000, China
2 National Pipe Network Group Southwest Pipeline Co., Ltd., Chengdu, 610000, China
3 National Pipeline Research Center Conveyance Pipe Institute, Baoji Petroleum Steel Pipe Co., Ltd., Baoji, 721000, China
* Corresponding Author: Kai Zhang. Email:
(This article belongs to the Special Issue: Integrated Geology-Engineering Simulation and Optimizationfor Unconventional Oil and Gas Reservoirs)
Energy Engineering 2024, 121(8), 2143-2165. https://doi.org/10.32604/ee.2024.049362
Received 04 January 2024; Accepted 29 March 2024; Issue published 19 July 2024
 View Full Text
 Download PDF
Abstract
The leakage gas from a buried natural gas pipelines has the great potential to cause economic losses and environmental pollution owing to the complexity of the mountainous environment. In this study, computational fluid dynamics (CFD) method was applied to investigate the diffusion law and hazard range of buried natural gas pipeline leakage in mountainous environment. Based on cloud chart, concentration at the monitoring site and hazard range of lower explosion limit (LEL) and upper explosion limit (UEL), the influences of leakage hole direction and shape, soil property, burial depth, obstacle type on the diffusion law and hazard range are analyzed. Results show that the leakage gas is not radially diffused until it reaches the ground, and the velocity of gas diffusion to the ground and the hazard range decrease as the angle between the leaking direction and the buoyancy direction increases. Triangular and square leak holes have a faster diffusion rate and a wider hazard range than circular. The diffusion rate of leakage gas in soil rises as soil granularity and porosity increase. The time of leakage gas diffusion to the ground increases significantly with the increase of burial depth, and the hazard range reduces as burial depth increases. Boulder-type obstacles will alter the diffusion path of the leakage gas and accelerate the expansion of the hazard distance, while trench-type obstacles will cause the natural gas to accumulate in the trench and form a high concentration region slowing the expansion of the surface gas concentration.Keywords
Natural gas, as the cleanest and most efficient fossil energy source, has played a critical role in fostering green and low-carbon energy transformation and high-quality development with the implementation of the global decarbonization strategy in recent years [1–3]. And the Construction and advancement of natural gas pipelines have reached a golden age as the primary method of natural gas transportation today [4]. Despite China’s enormous natural gas deposits, the country’s natural gas is primarily dispersed in the central and western areas, whereas the eastern region has the fastest growing economy and the fastest growing demand for natural gas consumption [5]. To ensure natural gas supply, an increasing number of long-distance natural gas pipelines must pass through hilly areas with complicated and varied topography and high and low relief.
Currently, the majority of long-distance natural gas pipes are installed by burying them in the Soil [6]. Although pipeline burial reduces both organic and synthetic damages, accidents caused by leakage of buried natural gas pipelines due to mechanical external forces, corrosion, and construction defects have been a constant occurrence, accounting for 27%, 27%, and 16% of reported accidents [7]. An accident will not only waste resources and result in financial losses but will also significantly impair the environment, social order, and public safety [8–12]. Therefore, it is critical to investigate and assess the leakage and dispersion properties of buried pipelines in mountainous areas.
Current research on buried natural gas pipeline leakage focuses on calculating gas leakage rates and analyzing gas diffusion mechanisms [13]. Over the years, numerical models used to examine the leakage and dispersion properties of buried pipelines have advanced from 1D to 2 and 3D [14,15]. The majority of early research was done on 1D models based on assumptions such as ideal gases, adiabatic fluxes, and so on. For example, Olorunmaiye et al. [16] modeled the flow following a long-distance natural gas pipeline break as a one-dimensional unsteady isothermal flow and used the eigenvalue approach to quantify the natural gas loss. Montiel et al. [17] supplied a model for forecasting gas leakage based on pore size and pipe pressure under steady-state and one-dimensional flow assumptions, which is a conventional “pore” and “pipe” model under low and medium-pressure and steady state assumptions. Jo et al. [18] applied Fanning’s equation to construct a one-dimensional estimate model for hole leakage in high-pressure gas transmission pipes. Kostowski et al. [19] stated a one-dimensional model for predicting the rate of gas outflow under isothermal and adiabatic flow assumptions. Lu et al. [20] presented a one-dimensional model of an urban medium-pressure pipeline for predicting the effects of pipeline pressure and leakage hole diameter on leakage rate under steady leakage circumstances.
It should be noted that the usage of one-dimensional models is prone to substantial mistakes [21]. Because of the advantages of using computer simulation technology and the findings of numerous experimental research, people began to utilize 2D and 3D models closer to the real gas to examine pipeline leakage and diffusion behavior [22–26]. Particularly for buried pipes, 3D modeling can account for the resistance of all 3D soil bodies, which is more accurate than 1D and 2D computational models [27]. For the widely encountered medium-pressure natural gas pipelines in cities, Ebrahimi-Moghadam et al. [28] designed 2D and 3D models and numerically solved them using the finite volume approach to achieve high solution accuracy. Bezaatpour et al. [21] investigated the effects of soil anisotropy, stratification, soil matrix moisture content in every layer, and slope on the gas dispersion behavior of leakage from medium-pressure buried natural gas pipelines. Wang et al. [29] applied Fluent to simulate the leaking of a low-pressure buried natural gas pipeline and investigated the effects of various pressures, leakage hole sizes and directions, soil attributes, and burial depth on the diffusion process. Liu et al. [30] evaluated the leakage rate and diffusion extent in soil by numerically simulating the leakage diffusion of medium-pressure buried pipelines in soil. Bu et al.’s study [31] used numerical simulation to examine the properties of methane diffusion in soil, analyze the harmful boundary of methane diffusion, and develop a model for harmful boundary prediction.
It has revealed that previous discussions focused on urban low-pressure buried pipelines in the plains, with little research done on the dispersion behavior of high-pressure buried pipelines in mountainous areas. Pipelines in mountainous regions differ greatly from urban pipelines in plain areas in terms of both pipeline properties and laying environment. Pipelines in mountainous regions differ greatly from urban pipelines in plain areas in terms of both pipeline properties and laying environment. First, the pipeline’s large diameter and high pressure accelerate the rate of gas loss and diffusion following damage [32,33]. As the saying goes: “One mountain with four seasons, ten miles with different weathers”, since long-distance pipelines usually cross several regions, the pipeline temperature and soil properties vary greatly. Meanwhile, the mountain environment tends to be the “ecological kingdom,” a large number of wild animals and plants will exacerbate corrosion and harm to the pipeline, and the frequent occurrence of natural disasters such as collapses, landslides, and other natural disasters will cause pipeline damage more uncertain. Furthermore, the undulating terrain could lead to the pipeline’s depth altering, and the numerous rivers, ravines, and cliffs in the mountainous environment may create various barriers to the dispersion of leaking gases.
This article creates a 3D model of pipeline-soil-air to investigate the leaking diffusion process and hazardous distance of high-pressure buried gas pipelines in mountainous areas. The law of leakage and diffusion is examined by varying pipeline features such as vagaries leakage direction and changeable leakage hole shape, and external environmental factors such as different soil properties, burial depth and various obstacles. The diffusion pattern and hazard range of the leakage gas are explored using the diffusion cloud chart, the concentration of the monitoring point, and the vertical hazard distance. This work is expected to give a theoretical foundation for pipeline integrity management in mountainous environments.
The model considers not only the influence of soil resistance in the three directions but also the dispersion of the gas in the air when it overflows from the soil, to ensure the accuracy of the results. The simple model has a rectangular body with 6 m × 6 m × 5 m dimensions. Where the height direction is divided into the upper air layer with a height of 2 m and the lower soil layer with a depth of 3 m, with the pipeline positioned in the middle of the soil layer. Fig. 1 shows the established pipeline-soil-air 3D model.
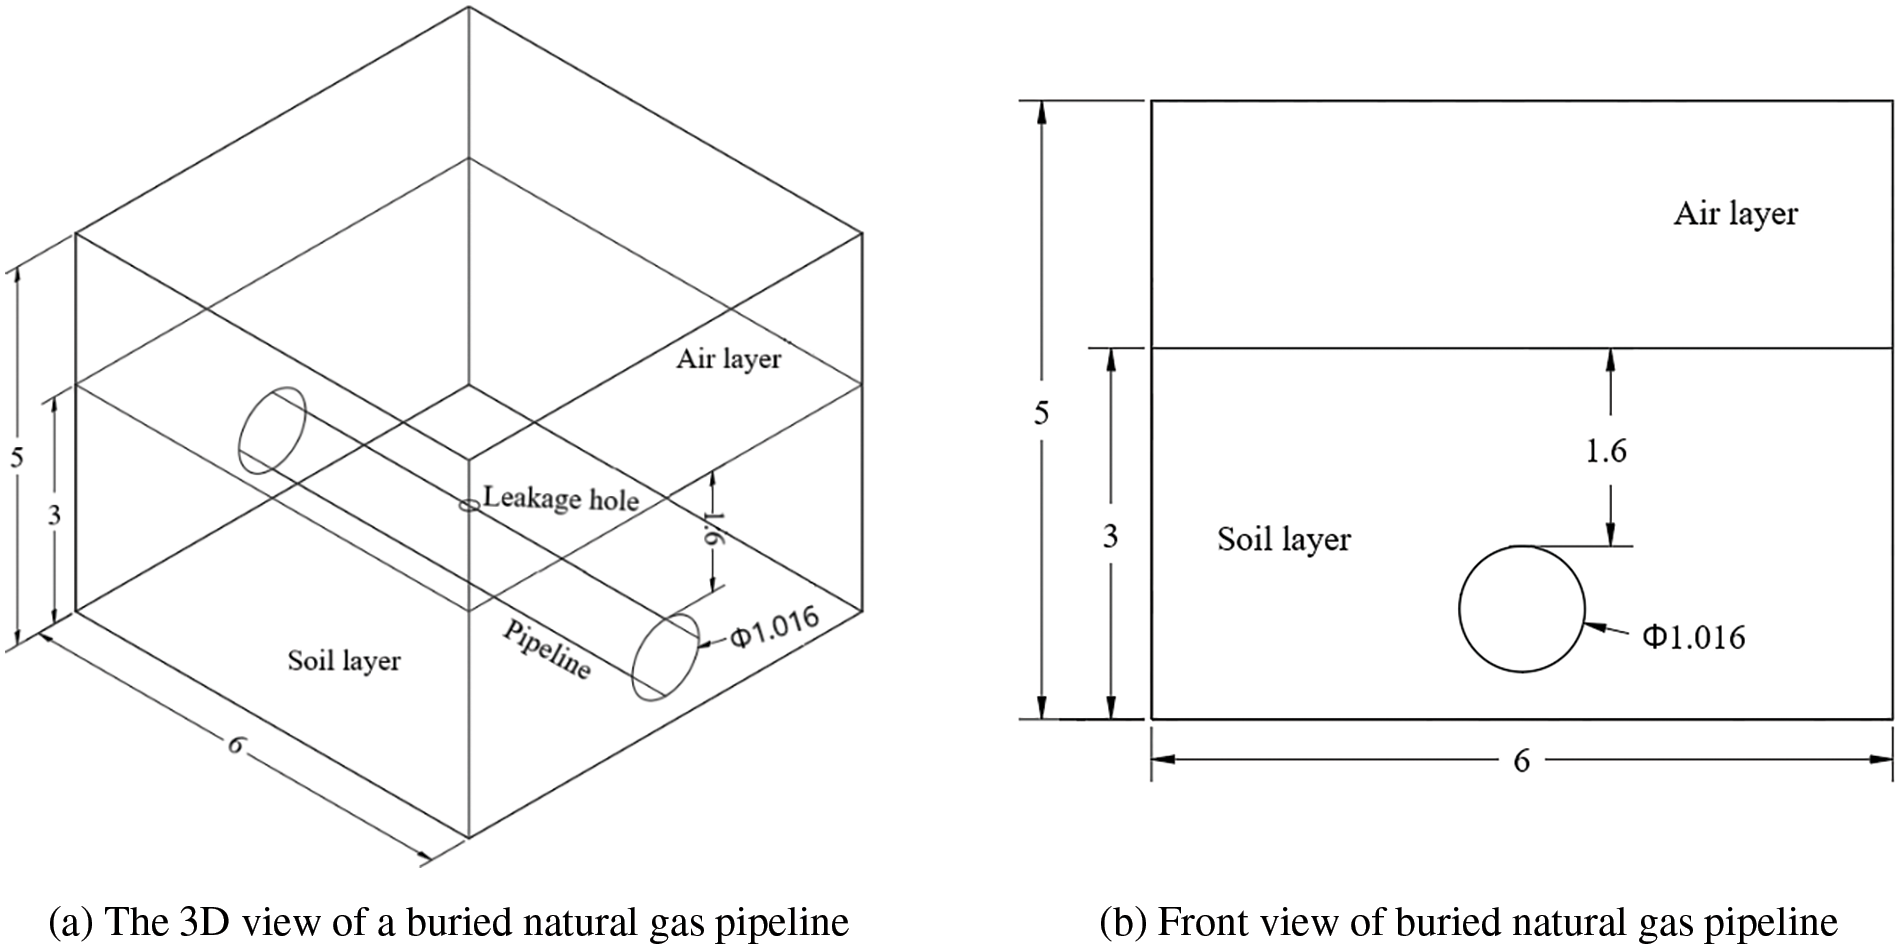
Figure 1: Physical model of buried natural gas pipeline
The following assumptions are raised to simplify the modeling and calculations [34]:
(1) The soil was modeled as a porous structure, with all air in the pores prior to gas leakage, and its porous structure was set to be isotropic;
(2) The default leakage hole’s shape is circular, and the leakage process is continuous with no impact on the pipe wall next to it;
(3) Soil temperatures and leakage gas temperatures are stable and unaffected by environmental factors;
(4) Assume the gas leakage rate is constant during a brief period of time;
(5) The gas composition is set to 95% CH4 and 5% C2H6, regardless of the natural wind speed.
The governing equations contain the conservation equations of mass, the conservation equations of momentum, the transport equations, and the turbulence model based on the assumptions in Section 2.2.1.
(1) Conservation equation of mass [35]:
where,
(2) Conservation equation of momentum [36]:
where, j is three directions of the coordinate axes, uj is the split velocity in that direction (
where,
where, Dp is soil particle diameter (m).
(3) Transport equation [38]:
where,
(4) Turbulence modeling [39]:
An appropriate turbulence model should be chosen for modeling since the flow state at the gas leakage port of a high-pressure gas pipeline is turbulent [40]. In this paper, the k-ε standard equation is used for the calculation, which consists of k turbulent kinetic energy equation and ε turbulent dissipation rate equation as shown in Eqs. (7) and (8).
where,
2.3.1 Soil Property Definition
Soil is regarded as a porous media with viscous resistance, inertial resistance, and porosity. The behavior of gas diffusion is strongly influenced by the properties of the soil. This study categorizes mountain soil types into four groups based on soil granularity and porosity, and Table 1 displays their resistance properties [21,23].

2.3.2 Boundary Type Definition
According to the simplified assumptions in Section 2.2.1, there are three major features of boundary condition settings: Outlet boundary conditions, inlet boundary conditions, and wall boundary conditions, which are shown in Table 2.

2.3.3 Settings of Leakage Hole Shape
Generally, the leakage hole caused by corrosion is irregular in shape. In order to simulate operability, the shape of the hole is simplified and the typical hole shape shown in Table 3 is used for simulation.

2.4 Settings of Simulation Parameters and Monitoring Point
In this paper, the influence of the characteristics of the pipeline (leakage hole shape and leakage direction) and the laying environmental factors (soil property, burial depth and obstacle type) on the diffusion characteristics of leakage gas was investigated by the control variate method.
Take a long-distance natural gas pipeline in the mountainous region of Western China as an example, the operating pressure of the pipeline is set to 10 MPa, the ambient temperature is set to 300 K, the diameter of the pipe is set to 1016 mm, and the default leakage hole is set to a circle with a diameter of 100 mm because the leakage hole of buried pipelines in mountainous areas are mostly small hole caused by corrosion. The working conditions under the constant parameter are simulated as the default conditions, and the other variable parameters are shown in Table 4.
2.4.2 Monitoring Point Setting
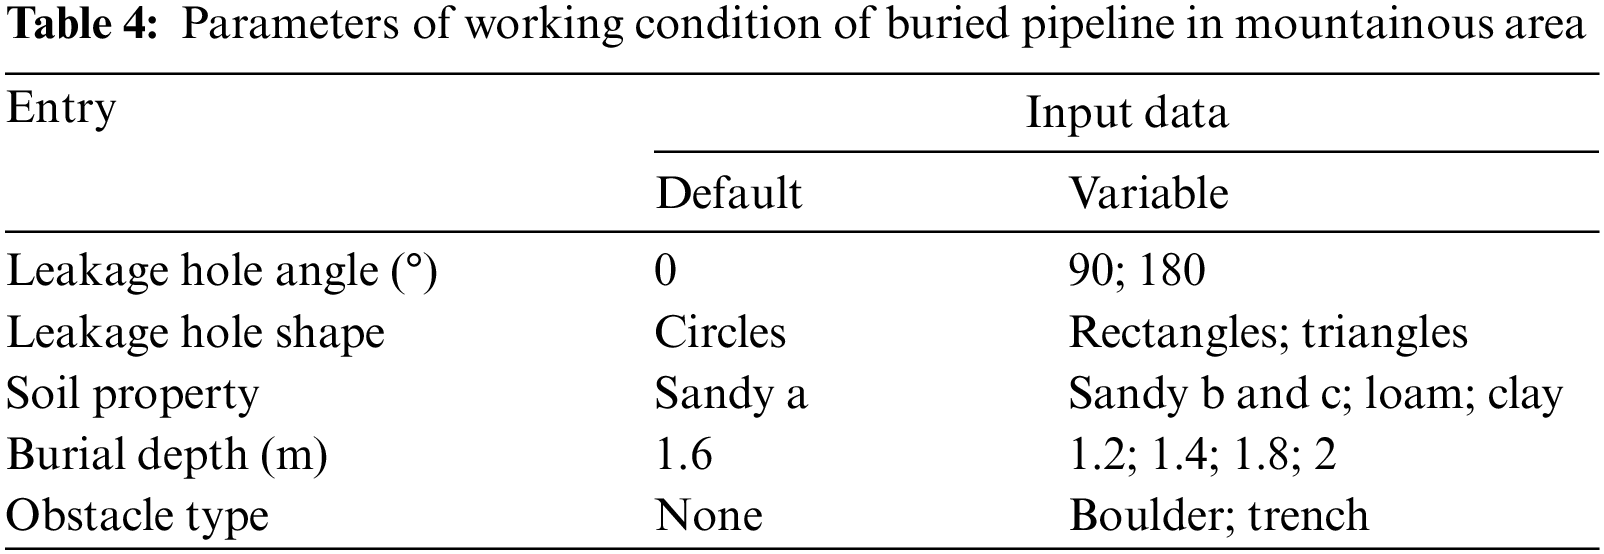
To investigate how the gas diffusion pattern varies at typical heights and directions, we have set up seven monitoring points as shown in Table 5 and Fig. 2, respectively, with O point being the location of the leakage holes, points A, B, and C being able to respond to the concentration variation at different heights, and points E and F being used to study the variation of gas diffusion concentration at typical heights and directions.

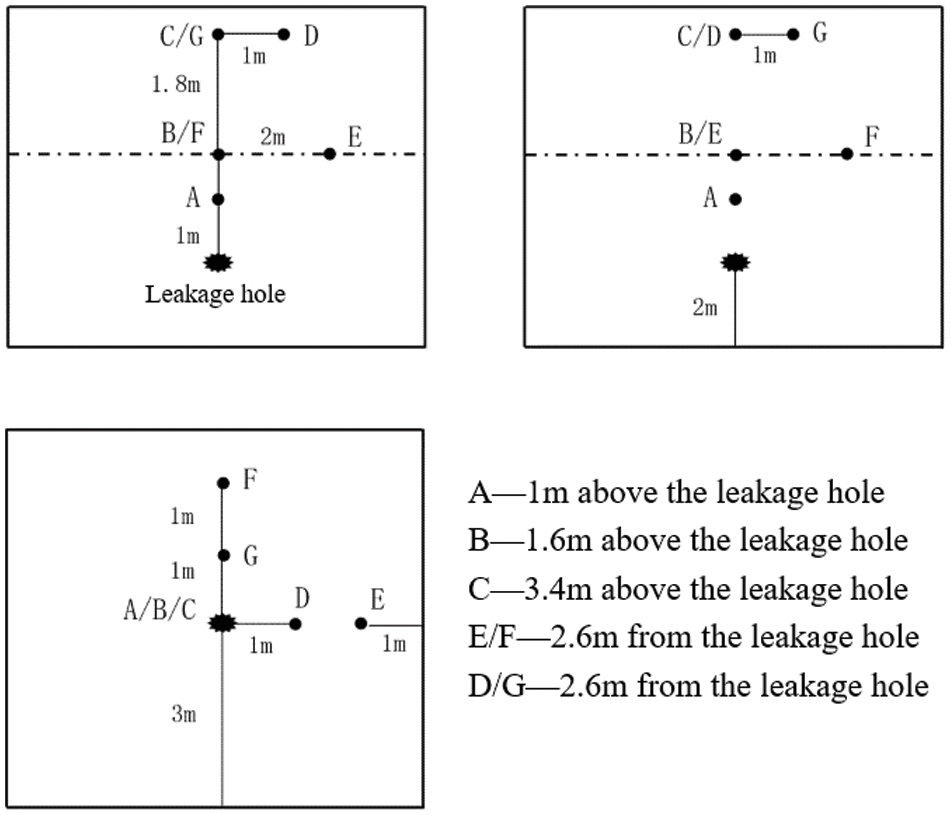
Figure 2: Schematic representation of the location of the monitoring sites
2.5 Grid Generation and Solution Methods
In this paper, a structured geometric grid is used to discretize the computational model, focusing on encrypting the mesh around the leakage orifice to obtain more accurate calculation results.
In this paper, the finite volume method (FVM) was used to discretize the control equations. For the coupled velocity and pressure problem in the solution process, the PISO algorithm with better applicability is used for transient simulation calculations based on the pressure solver. In order to ensure the convergence and accuracy of the computational results, a second-order windward discrete format is used. The time step was set to 0.05 s for a total of 3600 steps to study the diffusion of the leakage within 180 s, and the data were recorded every 20 steps.
2.6.1 Validation of Grid-Independent Solution
As shown in Fig. 3, generate four grid levels of 68 × 104, 48 × 104, 28 × 104, and 10 × 104 and monitor methane concentrations at varying vertical distances under the same operating settings 30 s after leakage. The calculation results with grid of 28 × 104 and 10 × 104 have a large deviation, while the average error of gas concentration calculated with grid number 68 × 104 and 48 × 104 is within 3%. To ensure the calculation accuracy and reduce the calculation time, the 48 × 104 grid level was selected for numerical simulation, and the minimum grid is 6.86714e−01, as shown in Fig. 4.
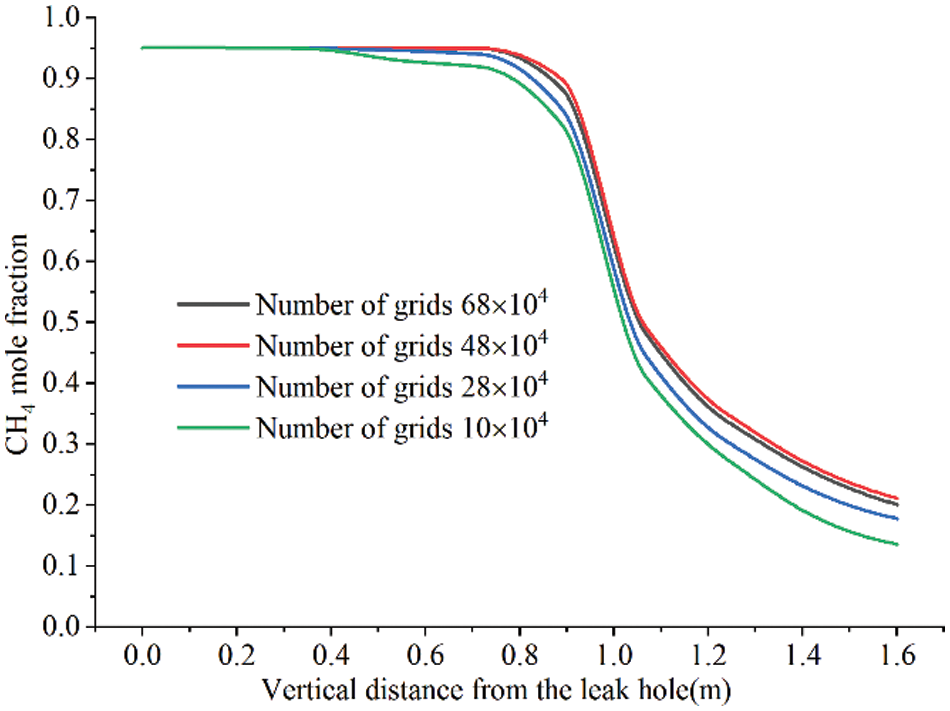
Figure 3: Variation of vertical methane concentration calculated by four different grids
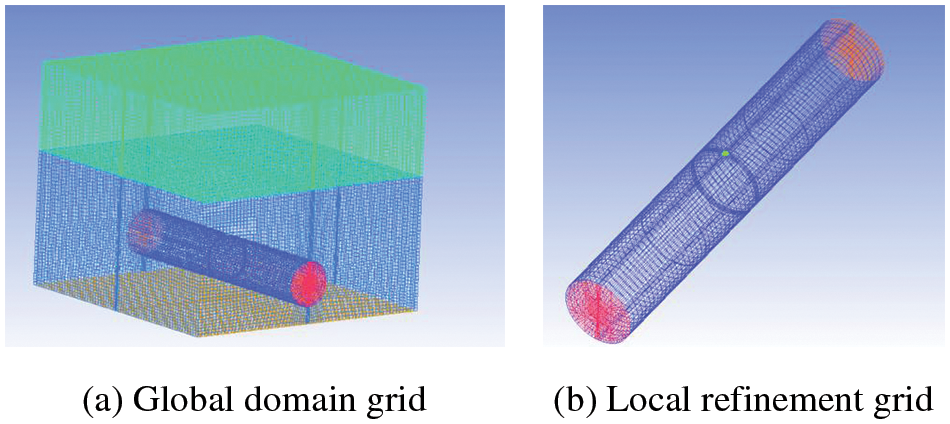
Figure 4: Schematic of grid generation
2.6.2 Validation of Mathematical Model
The buried pipelines experimental results of Yan et al. [26] were used to verify the steady simulation method. In this paper, a rectangular model with a pipe burial depth of 900 mm, a pipe diameter of 200 mm and a leakage hole diameter of 5 mm is reconstructed according to Yan’s experimental method. The gas fraction was set to 2.5% air and 97.5% methane with a volumetric flow rate of 12
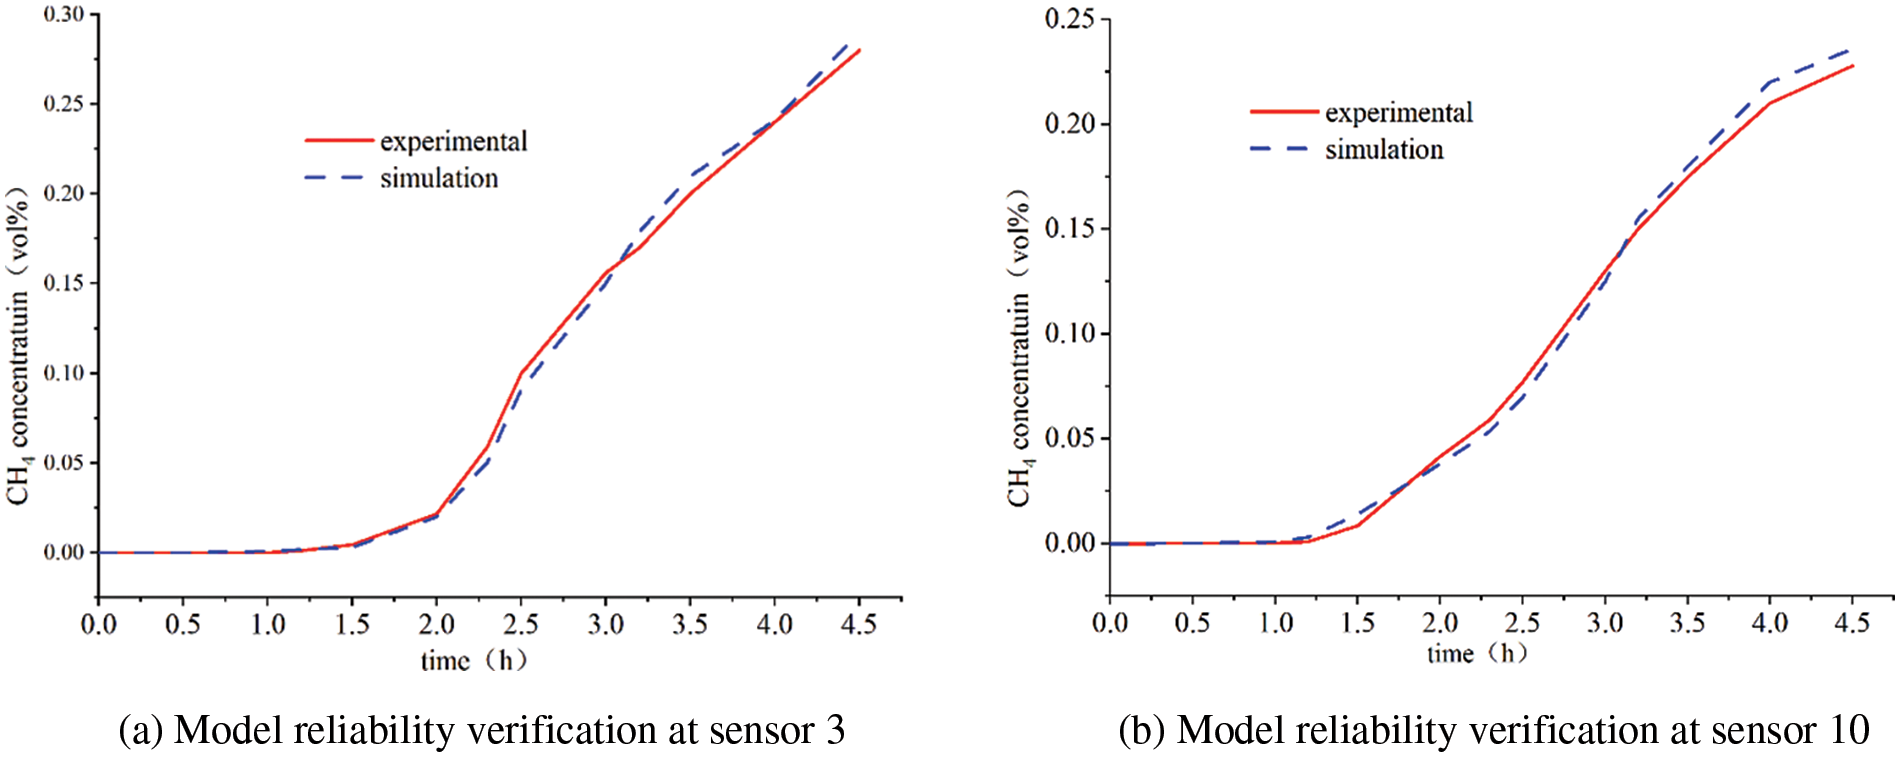
Figure 5: Comparison of numerical simulation and experimental
We analyzed the diffusion characteristics of buried natural gas pipeline leaks under default conditions by means of methane concentration distribution cloud chart and methane concentration variations at monitoring points. Leakage gas tends to spread upwards due to the fact that natural gas is less dense than air. Meanwhile, the space at the top of the model is the main area where humans live and build. Therefore, utilizing LEL and UEL as methane observation concentration boundaries, the changes in the vertical height of methane under various working conditions with time were recorded to explore the vertical hazard distance, and the changes in concentration at monitoring points under the same leakage time were recorded to realize the diffusion process.
3.1 Analysis of Leakage and Diffusion Processes
The simulation scenario was set up according to the constants in Table 3, and two mutually perpendicular sections a and b, perpendicular to the ground, parallel to the x-axis and z-axis and passing through the center of the leakage hole, are set up to observe the diffusion of the leakage gas. The gas dispersion clouds after 2, 4, 20, 60, 120 and 180 s of leakage were obtained as shown in Fig. 6. In the initial stage within 2 s of the leakage, a nearly circular area of high methane concentration was formed near the orifice due to the high initial velocity and the insignificant effect of soil on gas deceleration. When the leak occurs for 4 s, the gas is about to diffuse near the ground because the resistance in the air layer is much smaller than that in the soil layer, resulting in a greater velocity of the gas in the vertical direction at this time, making the top of the shape of the gas diffusion region longer. Methane had partially entered the air layer when the leak occurred in 20 s, making the diffusion speed up the vertical axis larger than that of the horizontal axis, and there was a crease about the methane concentration appearing at the junction of the air layer and the soil layer, and the shape of the gas diffusion at this time changed to a half-ellipse. The concentration of methane that spreads to the vicinity of the ground after 60 s has reached the gas explosion concentration range, which means that if there is an ignition source will cause great casualty losses. The leak occurred for 120 s, and an area of high concentration developed near the ground, at which time the gas diffused mainly in the air upwards, while the extent of diffusion in the soil did not change much. Finally, nearly 90% of all locations in the model had generated medium to high concentrations, as seen at simulation times up to 180 s.
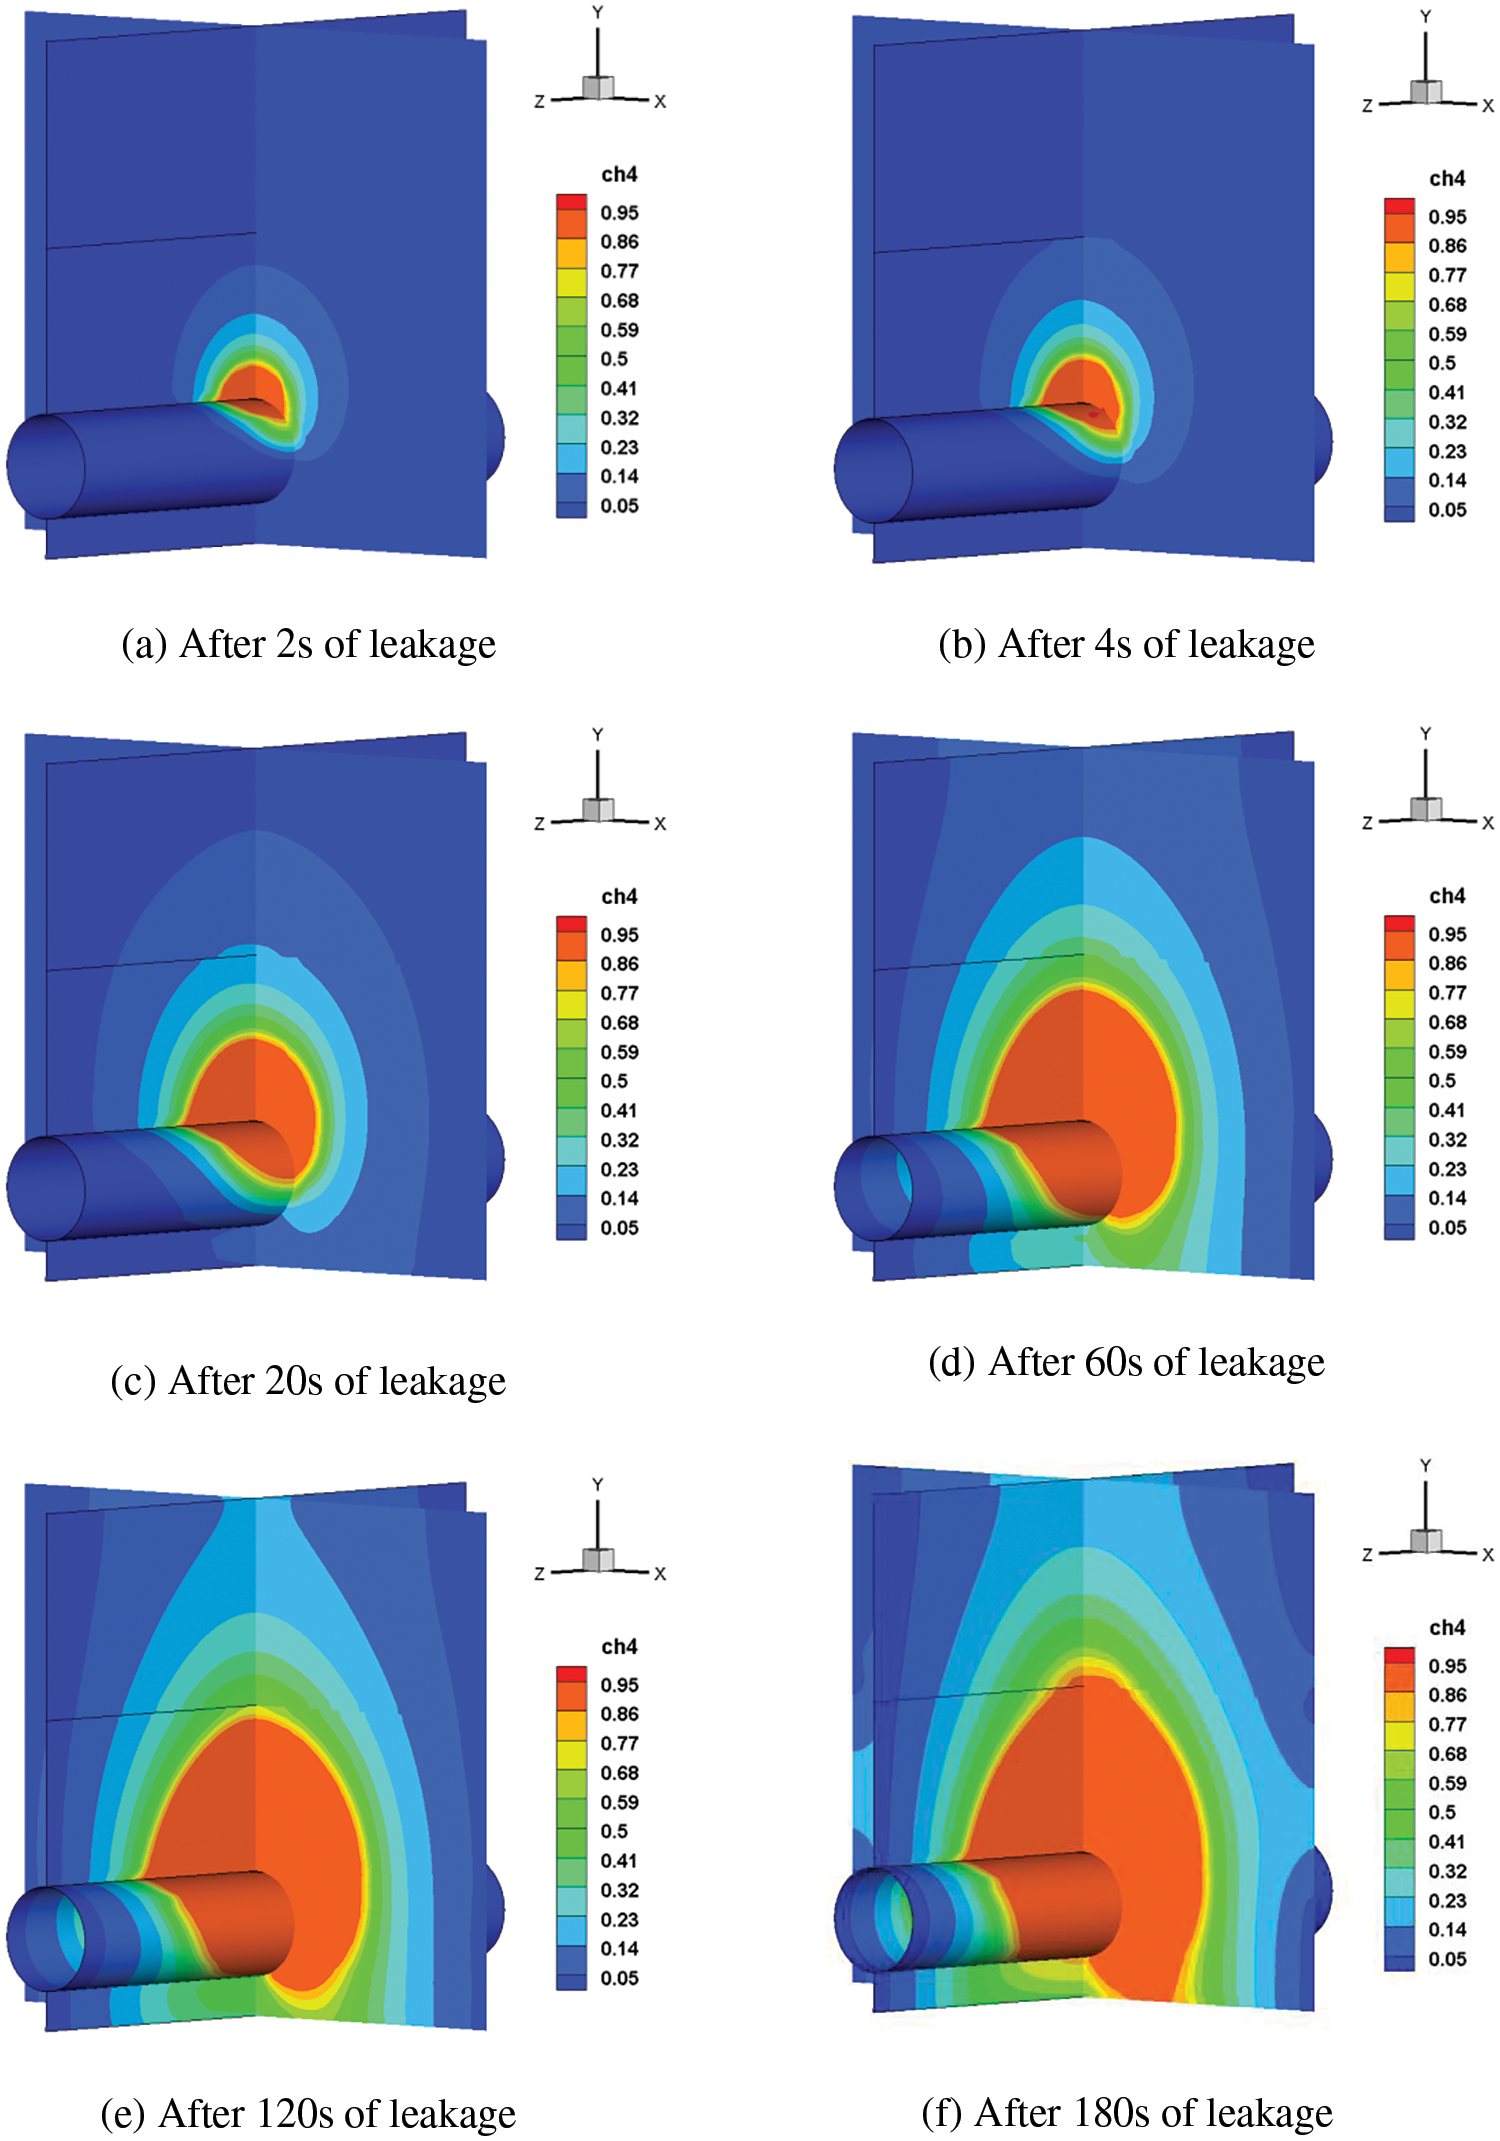
Figure 6: Time series of the dispersion clouds
The calculated changes in the concentration of leakage gas at the seven monitoring points are shown in Fig. 7. The highest and quickest change in concentration in the altitude direction is revealed by data from monitoring locations A, B, and C, and it is worth noting that due to the close proximity of point C to the upper boundary of the model, inhomogeneous diffusion of gas occurred at the model boundary with the increase of gas concentration, which led to a sudden increase in the growth rate of gas concentration at point C at 210 s. Since the F/G monitoring point is set up in the same direction as the leakage gas flow, there is less loss of velocity, permitting the F/G monitoring point to detect methane earlier.
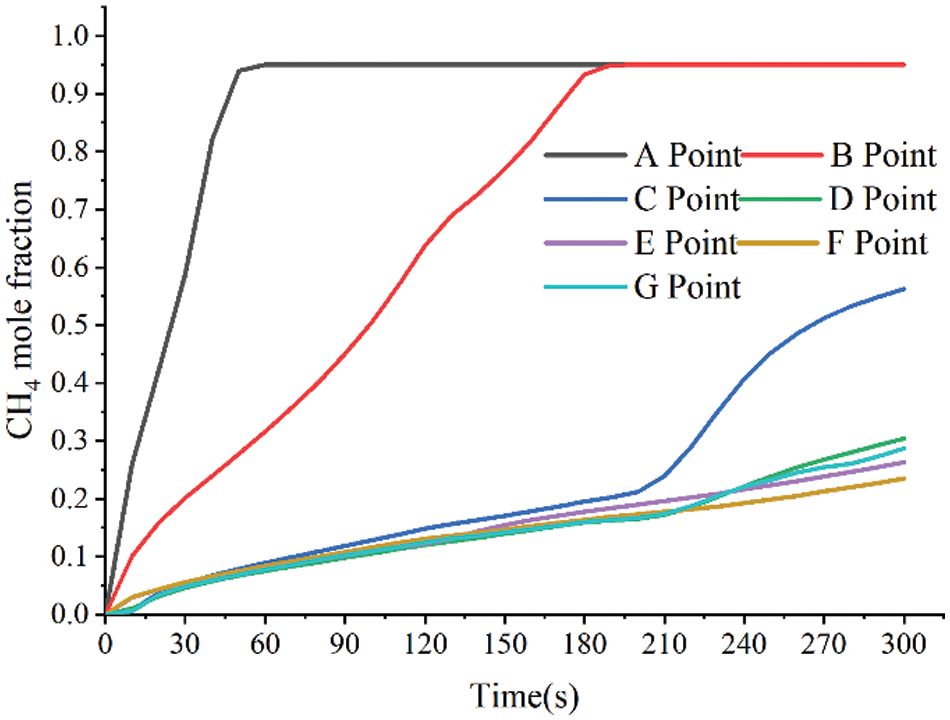
Figure 7: Variation of leakage gas concentration at different positions
Similarly, Fig. 8 displays the vertical hazard distance determined by the simulation. The LEL meets the ground 3.5 s after the leak happened, while the UEL meets the ground 18 s later. Both in soil and air layers, the rate of increase of the LEL is much faster than that of UEL, but the rate of increase of both tends to decrease with time.
Figure 8: The vertical danger distance of the LEL/UEL with time
3.2 Analysis of Leakage Consequences with Leakage Hole Characteristics
Leakage of buried pipelines are generally caused by small hole created by corrosion, and the abundance of wild animals and plants in mountainous environments and frequent geologic hazards make corrosion of pipelines more unpredictable. Therefore, based on the previous analysis of the default working condition, this work focuses on the influence of the leakage direction and the shape of the leakage hole on the leakage diffusion law of the buried pipelines in mountainous areas.
3.2.1 Effect of Leakage Direction
Based on constant parameters, simulations were performed by changing the leakage direction to 90° and 180°, respectively. And the center of the leakage hole at 90° and 180° leakage directions is roughly (3, 0.38, −3) and (2.5, 0.9, −3), based on the leakage direction, which changes the location of the leakage hole [25,29]. The diffusion cloud of the gas after 60 s of leakage from different direction is shown in Fig. 9. The gas always produces a jet and high concentration zone in the direction of the leakage hole initially. As the volume of gas spilt grows, the gas slowly spreads to the ground owing to buoyancy. The downward direction of the leakage gas diffusion range is the smallest, followed by lateral leakage, and the upward leakage range is the largest, indicating that the hazard range of the leaking gas decreases as the angle between the leakage direction and the direction of the buoyancy.
Figure 9: Cloud chart of natural gas diffusion after 60 s of leakage from different directions
The variation of methane concentration at monitoring points B and D under different leak directions is shown in Fig. 10 the concentration of methane rises more quickly when the gas leaked upwards. In contrast, the methane concentration increases slowly when leaking to the side and downward, and the process is mainly divided into a no-growth phase at the beginning of the leakage and a low-growth phase when the leakage gas starts to spill out of the ground.
Figure 10: Variation of leakage gas concentration from different directions
As shown in Fig. 11, for lateral and downward leakage, the LEL of gas to reach the ground in the 13 and 30 s, the UEL get to the ground in the 65 and 95 s, respectively, the distance of the hazard is much lower than upward leakage at the same time. When the gas leaks downward, the outlet location of the gas is farthest from the ground and the velocity of exit gas is opposed to the direction of buoyancy, so the LEL and UEL require the longest time to get the ground.
Figure 11: Vertical hazard distances for different leakage hole orientations
3.2.2 Effect of Leakage Hole Shape
Under the conditions that the aperture size is consistent, the simulated diffusion cloud of the gas with different leakage hole shapes is shown in Fig. 12. It can be seen that the overall shape of the concentration interval formed by the leakage of the square hole is more like trapezoid, and the hazard range is larger, which is different from the oval formed by the circular hole. The shape of the leakage hole has little effect on the high concentration zone in the soil, while the middle and low concentration zone outside the soil formed by the triangular hole shifts to the left and upward. Simultaneously, the diffusion range created by triangular and square leakage hole is similar, and both are bigger than circular hole. Different shapes of leakage holes affect the velocity gradient of the leaking gas in the hole and the direction of gas injection, which results in different diffusion rates and hazard ranges of the leaking gas.
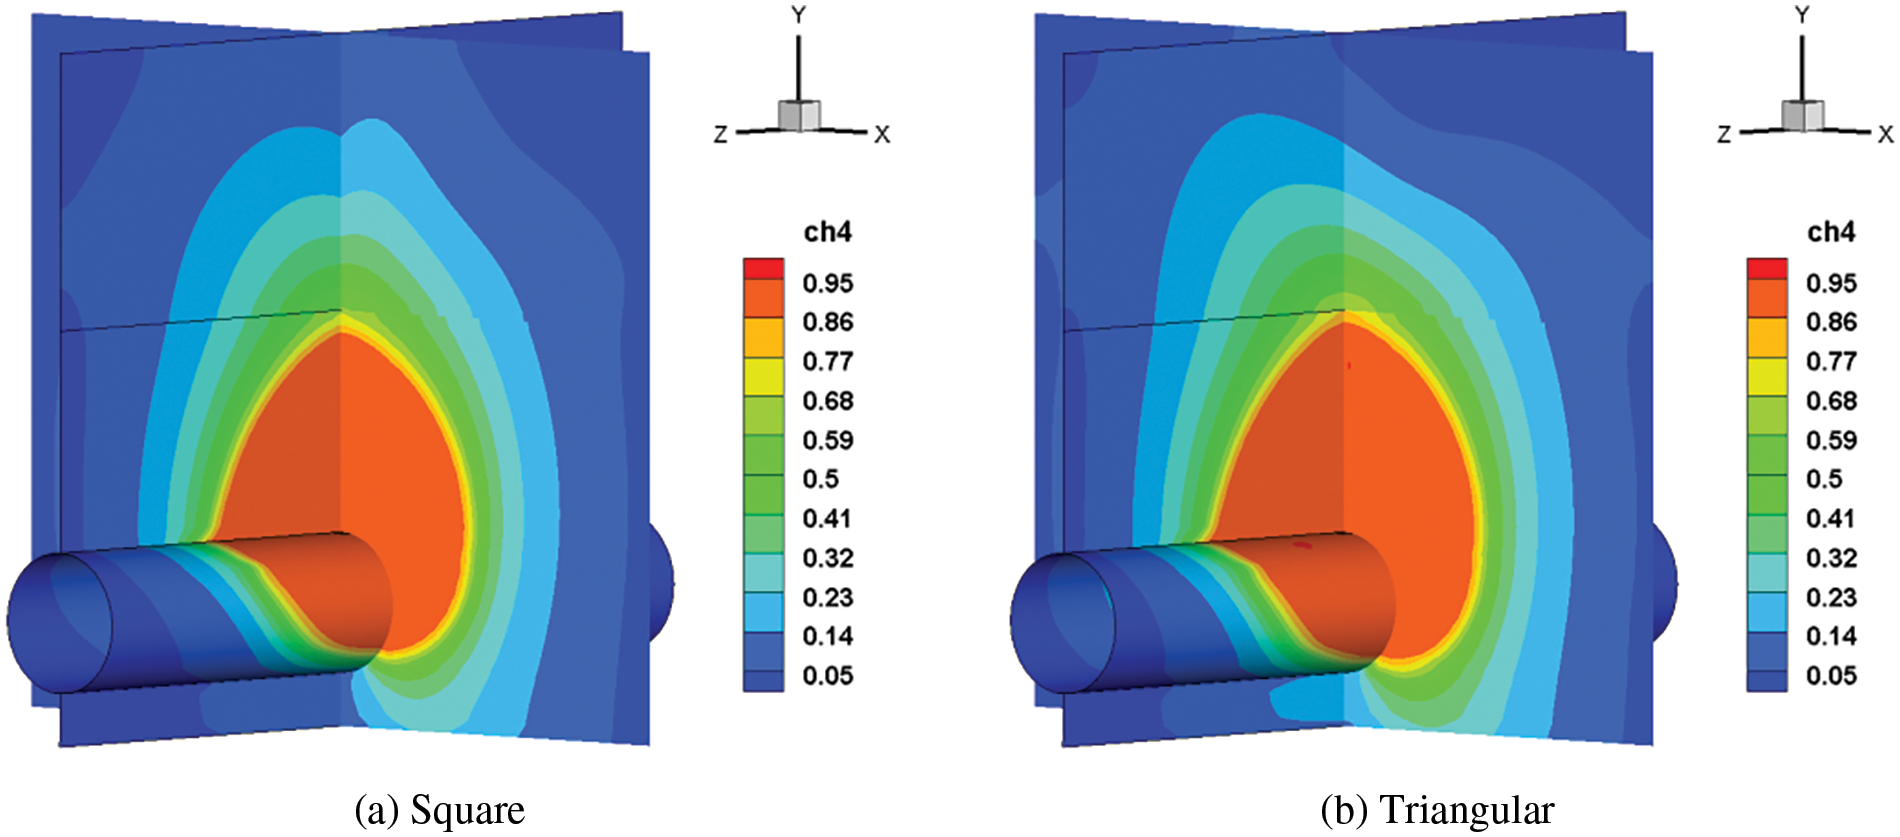
Figure 12: Cloud chart of natural gas diffusion after 60 s with different leakage hole shapes
The concentration variation of B and D monitoring points under various leakage hole shape is depicted in Fig. 13. With square and triangular holes, the concentration of B monitoring points increases more quickly, and the peak time is shorter. The concentration growth rate of the triangular hole is the slowest at monitoring point D, which is generated by the gas’s deviation to one side.
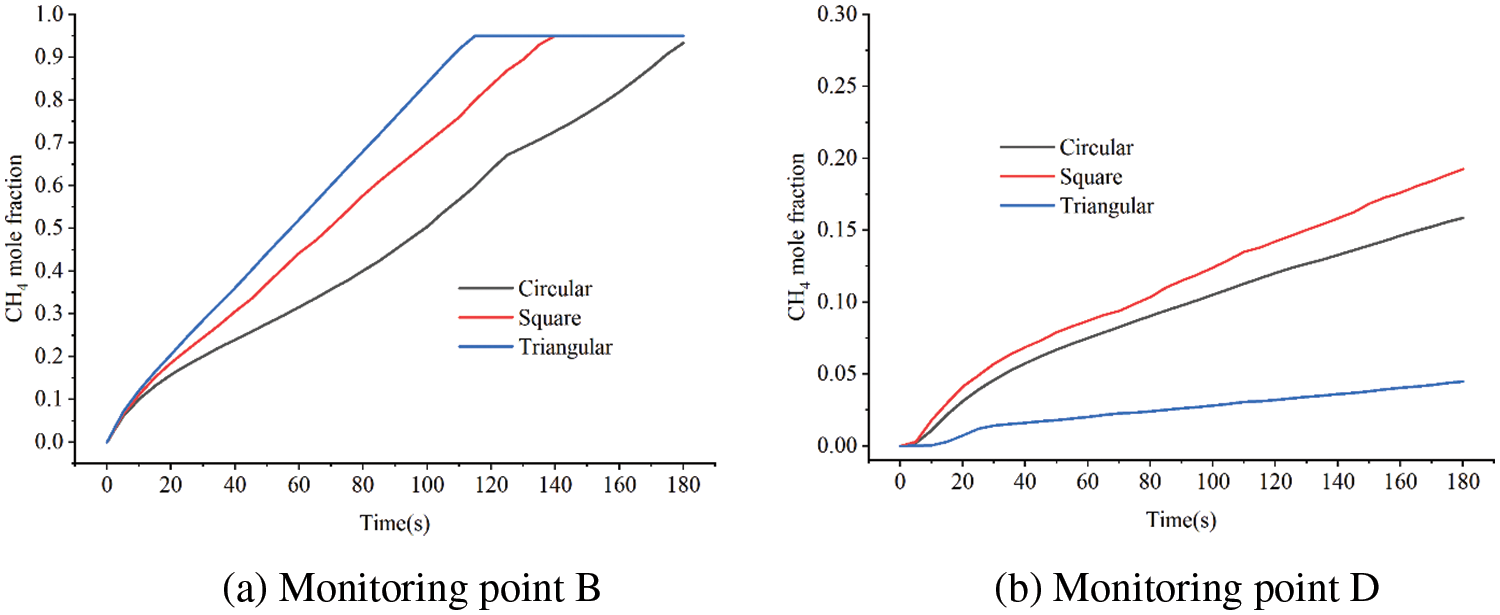
Figure 13: Variation of leakage gas concentration with different leakage hole shapes
Fig. 14 shows that the various leakage hole shapes have little effect on when the LEL gets to the ground; however, when the UEL does, the square and triangular hole get the ground roughly 10 s sooner than the circular hole. The vertical hazard distance of the triangular hole is somewhat greater than that of the square at the same time, and the circular hole is the smallest.
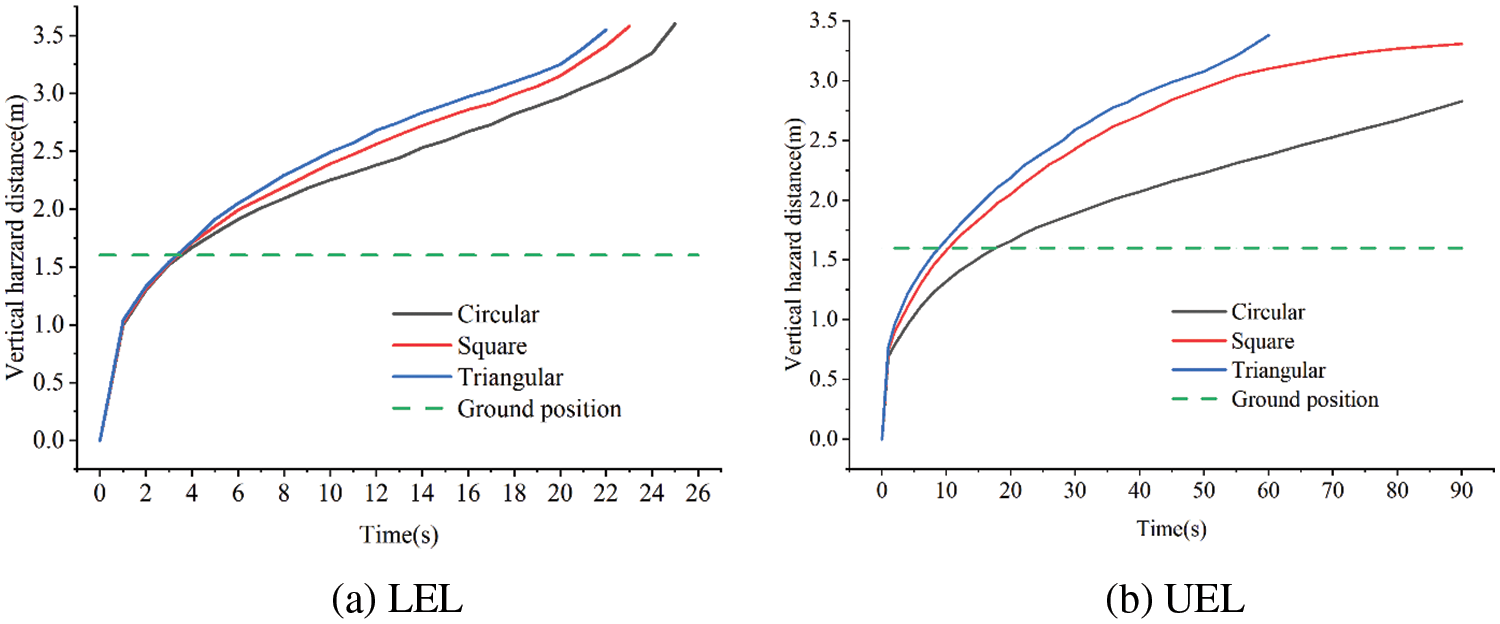
Figure 14: Vertical hazard distances with different leakage hole shapes
3.3 Analysis of Leakage Consequences with Laying Environments
The laying environment of the pipeline has an important influence on the diffusion behavior. On the one hand, the long-distance pipeline has a wide range of soil property due to the vast distance span. Also, the long-term natural impacts of weathering and desertification in the mountain environment, as well as frequent natural disasters like earthquakes and landslides, will change the type and thickness of the soil put on the pipeline trenches. On the other hand, obstacles such as boulders and trenches near the pipeline will prevent the diffusion of leakage gas.
In diverse soil settings, the resistance to gas leakage varies substantially. This research examines the effects of five common soils listed in Table 1 on diffusion behavior, ignoring the influence of soil deformation at the leakage hole. Fig. 15 shows that the larger the porosity, the greater the velocity and range of methane diffusion when the diameter of soil particles remains constant. The range of methane diffusion increases with soil particle diameter when soil porosity remains constant. The range of influence is shortest in clay soil due to the slowest gas diffusion as compared to sandy and loam soil.
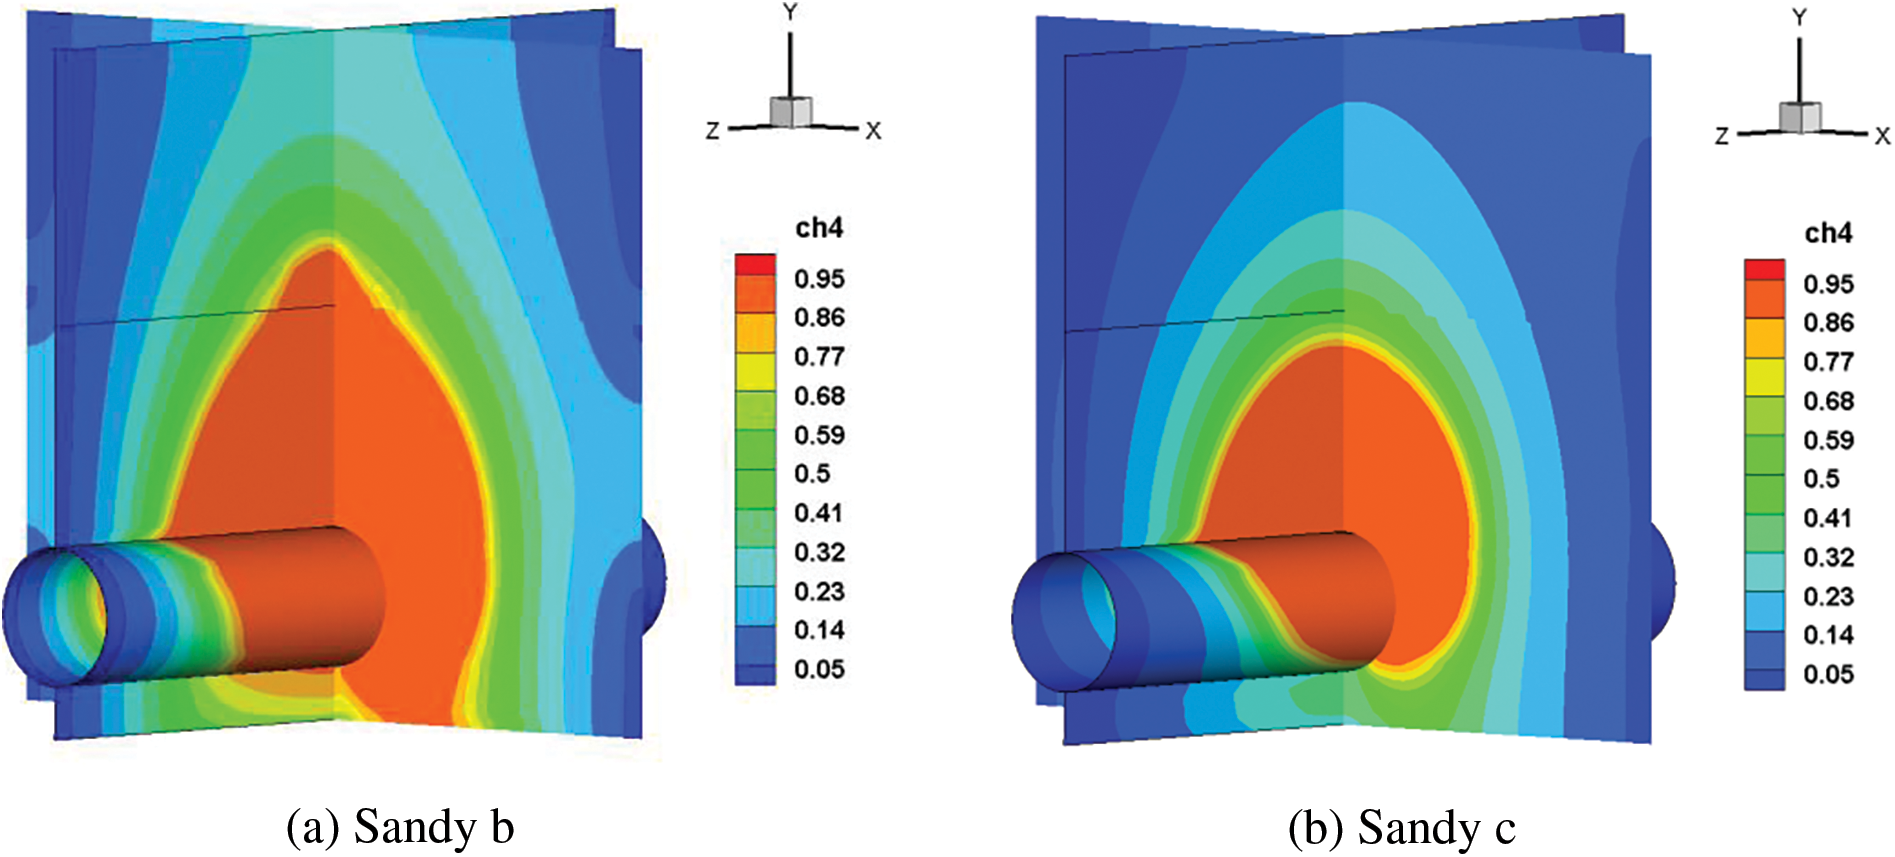
Figure 15: Cloud chart of natural gas diffusion after 60 s with different soil types
Changes in methane concentrations at monitoring sites B and D under different soil categories are shown in Fig. 16. The larger the porosity, the shortest time for gas concentration to reach the peak; when the soil particle diameter and porosity are small, the change rate of gas concentration is the slowest. When soil particle diameter is large, it has little effect on the peak time of methane concentration in air, but when soil particle diameter and porosity are small, the peak time of gas increases significantly.
Figure 16: Variation of leakage gas concentration with different soil types
It can be seen from Fig. 17 that after the sand leakage accident, the LEL of gas quickly reaches the ground in 2~4 s, and the UEL enters the ground in 4~18 s, while the LEL of loam reaches the ground in 9 s, and the UEL enters the ground in about 51 s. Therefore, with the decrease of soil particle size porosity, the resistance effect of soil to gas becomes larger, and the sag hazard distance decreases at the same time.
Figure 17: Vertical hazard distances with different soil types
The length of time and distance required for the leakage gas to spread into the atmosphere will be directly affected by the pipeline’s laying depth. This paper continues to simulate the working conditions of the soil depth of 1.2, 1.4, 1.8 and 2 m. For pipelines with different soil laying depths, the diffusion cloud chart after 60 s is shown in Fig. 18. The high concentration area within the soil and the middle and low concentration areas outside the soil are shown to decrease with increasing buried depth. The reason for this is that the soil resistance distance of the gas increases with increasing burial depth.
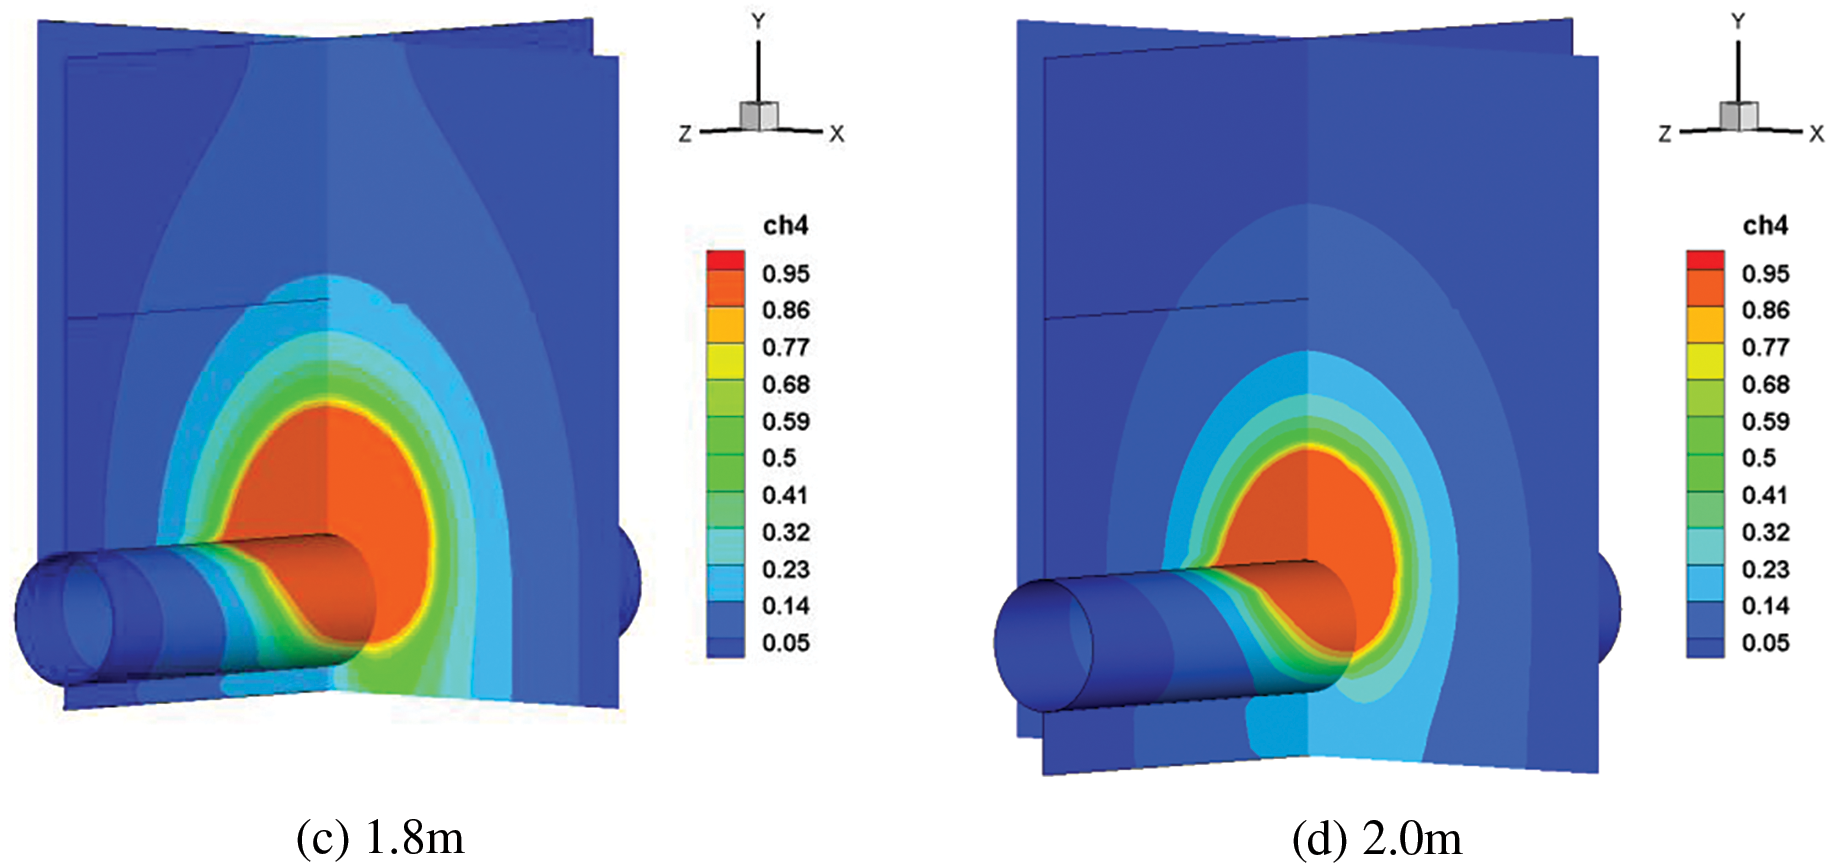
Figure 18: Cloud chart of natural gas diffusion after 60 s with different soil laying depths
Fig. 19 shows the change in methane concentrations at monitoring locations B and D. The concentration increases more quickly and the time it takes for the concentration to peak at the monitoring point B is reduced considerably when the pipeline is closer to the ground. When the laying depth is greater than 1.4 m, as the laying depth increases, the concentration change range of the monitoring point D is small, and the difference in atmospheric gas concentration is not obvious. In the early stage of leakage, the gas was in the stage of diffusion in the soil, and the concentration of D monitoring points was almost the same under different laying depths. After entering the middle stage of leakage, the concentration of D monitoring points began to rise rapidly for pipelines with shallow burial depths.
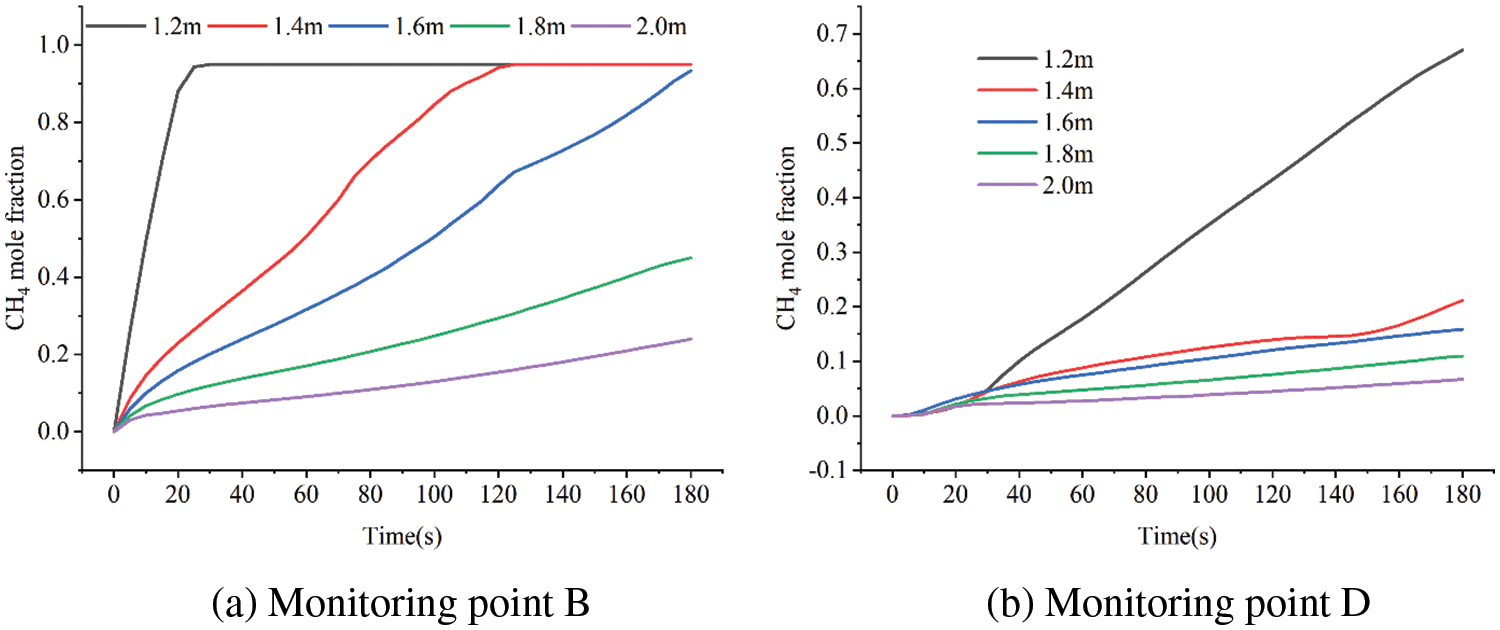
Figure 19: Variation of leakage gas concentration with different soil laying depths
As shown in Fig. 20, after the leakage accident occurs at the laying depth of 1.2 and 1.4 m, the LEL of the gas quickly reaches the ground in 1~3 s, and the UEL reaches the ground in 3~10 s. After the laying depth of 1.8 and 2 m leakage accidents, the LEL of the gas reach the ground in 6 and 15 s, and the UEL enter the atmosphere in about 45 and 100 s, respectively. It is evident that the gas diffusion range is more significantly impacted by the burial depth. The possibility of damage can be reduced by appropriately raising the burial depth of the pipeline on the assumption that the laying criteria and economic requirements are met.
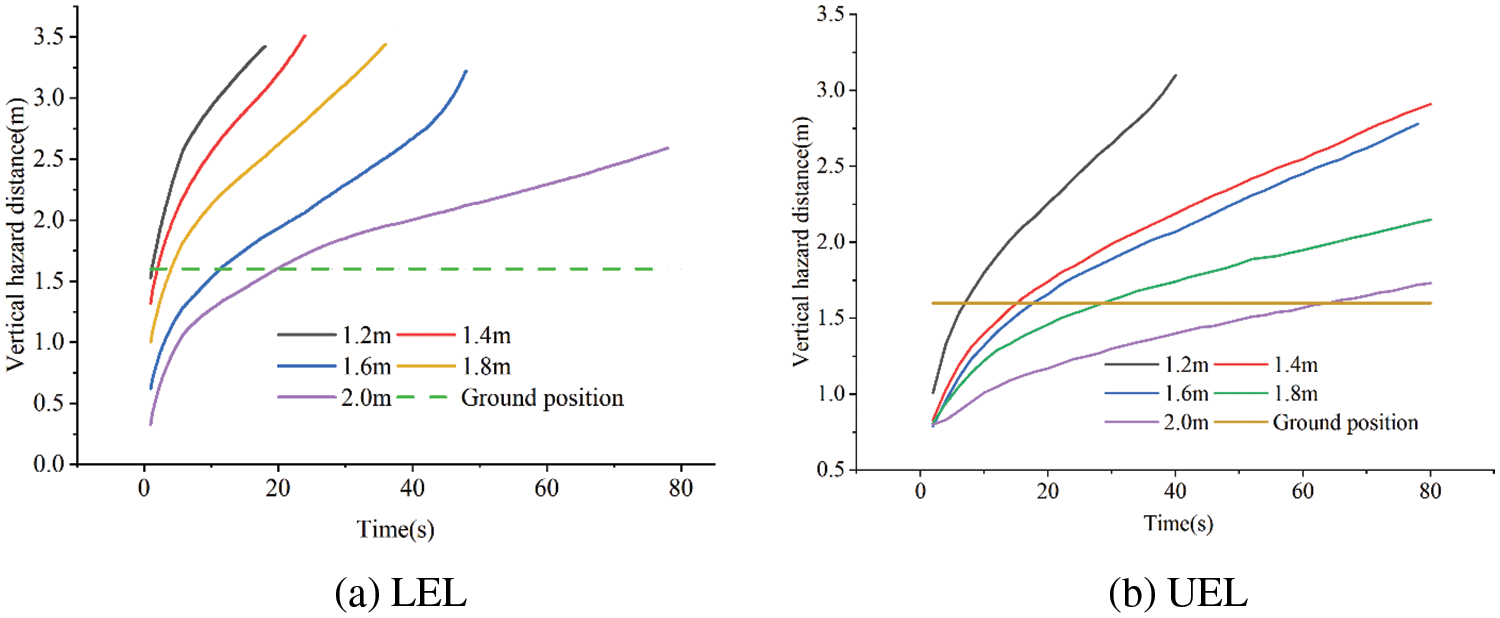
Figure 20: Vertical hazard distances with different soil laying depths
During the diffusion process, leakage gas frequently encounters the influence of barriers. Whereas buried pipelines in mountainous areas frequently encounter unknown factors like boulders in mountains and hidden trenches, pipelines in urban and plain areas frequently encounter interference from obstacles parallel to the ground, such as cement or asphalt, this work carries on the investigation of the impact of obstacles on the gas leakage and diffusion behavior. In the first stage of soil leakage, as seen in Fig. 21, the gas will spread upward along the surface of the obstruction when there is a wall surrounding the pipeline. And the gas outside the soil will go to the side that is not an obstruction when an adequate quantity of gas rises to the surface. Besides, a trench surrounding the pipeline will allow a significant quantity of gas leakage to enter it, creating a high concentration area and lowering the concentration close to the surface.
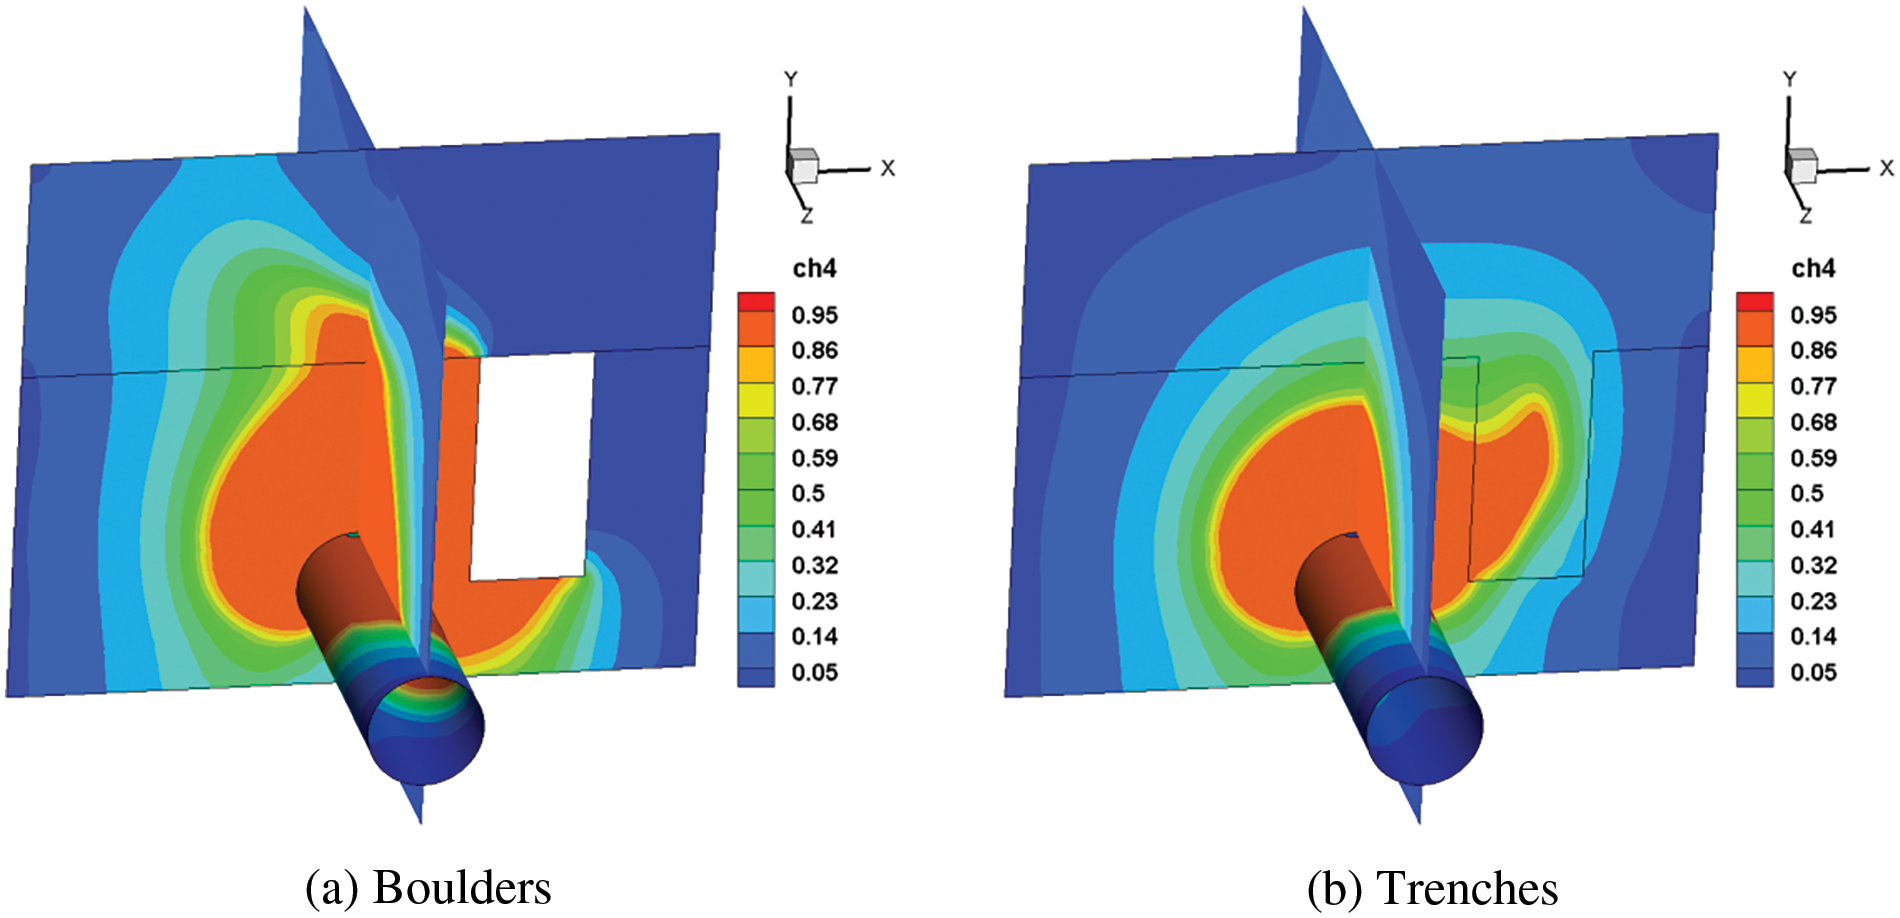
Figure 21: Cloud chart of natural gas diffusion after 60 s with different obstacles
Fig. 22 shows the changes in methane concentration at monitoring points B and D under different obstacles. Obstacles of boulder-type will prevent gas from diffusing transversely, causing a lot of gas to rise along the obstructions. The leakage gas will build up in the trench and form a high concentration area due to the trench-type obstructions. Consequently, the boulder-type obstacles will cause the monitoring point B’s concentration peak to appear sooner. In addition, the boulder-type obstacles located on the same side of the D monitoring point, and the methane concentration at the D monitoring point changes little compared with the presence of the trench-type obstructions.
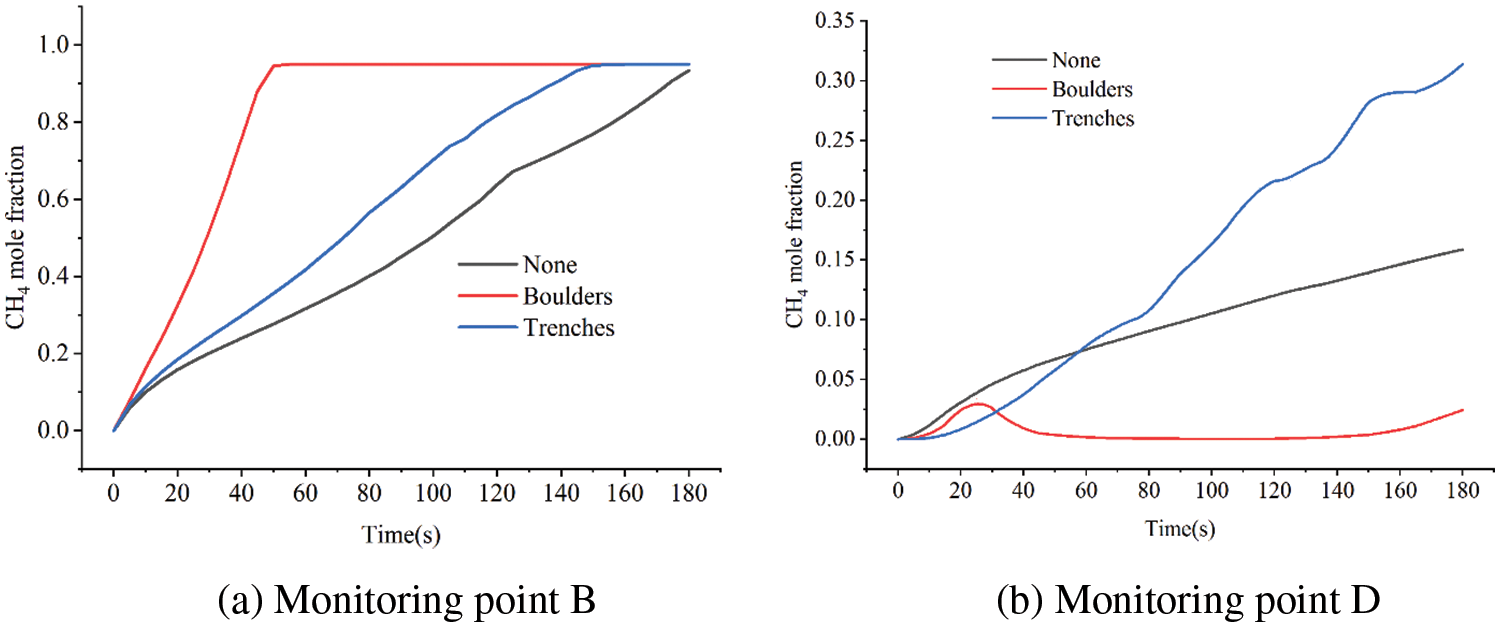
Figure 22: Variation of leakage gas concentration with different obstacles
As shown in Fig. 23, regardless of the type of obstacles in the spread path, the LEL of gas immediately reach the ground at roughly 4 s, and the UEL enter the atmosphere at 9 and 15 s, respectively. It is evident that obstacles have little effect on the LEL’s vertical harm distance in the soil, but once in the atmosphere, the presence of wall impediments causes the vertical harm distance of LEL to rise quickly. Moreover, obstacles in the trench cause the vertical boundaries of the UEL and LEL to rise slowly as a result of the accumulation effect of the leakage gas.
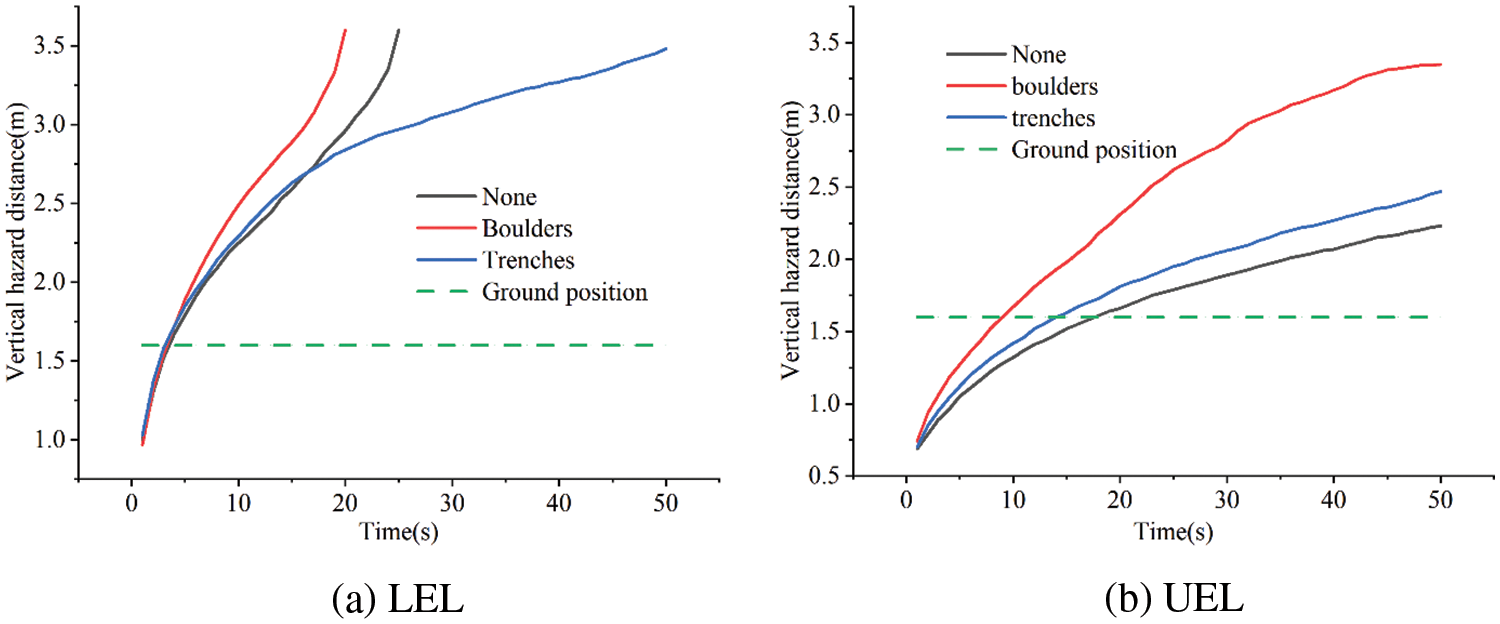
Figure 23: Vertical hazard distances with different obstacles
This paper analyzes the leakage and diffusion process of high-pressure buried pipelines in mountainous areas, takes pipeline attributes and external environment characteristics as research variables, and studies the diffusion law and influence range of leakage gas in soil from three aspects: Leakage diffusion cloud chart, concentration change of monitoring points, and vertical harm distance. The main conclusions are as follows:
(1) Under the influence of soil resistance, the gas leakage in the buried pipeline does not appear radial, but the concentration distribution in the soil is approximately circular. When natural gas spills out of the ground, the concentration distribution of methane changes from circular to radial. The leakage gas near the ground is symmetrically distributed in axial and radial direction, and the gas concentration is highest at the middle point of the leakage hole. Compared with the UEL, the LEL increases faster in both soil and air.
(2) For the characteristics of the pipeline, the leakage direction of the leakage have the greatest influence on the leakage and diffusion behavior of the pipeline. The change of leakage direction causes the change of the angle between the exit velocity and the buoyancy direction, resulting in the smallest harm range of natural gas diffusion in the atmosphere for downward leakage, followed by sidewall leakage, and the largest harm range for upward leakage. The overall shape of the diffusion caused by the square leak hole is more trapezoidal, while the middle and low concentration area formed by the triangular hole outside the soil is shifted to the upper left.
(3) The factors that have great influence on the leakage and diffusion behavior in the buried environment mainly include soil property, buried depth and obstacle type, the larger the soil particle diameter, soil porosity and the shallower the pipeline burial depth, the larger the leakage and diffusion range and the vertical hazard distance of the buried natural gas pipeline. The presence of boulder-type obstacles will cause a shift in the diffusion direction of the leakage gas. The gas diffusion characteristic is manifested as upward diffusion along the surface of the boulders at the initial stage and begins to shift to the side without obstacles after a large number of gas enter the air layer. The presence of trench-type obstacles will cause a large amount of gas to gather in the trenches and form a high concentration area, which will reduce the growth rate of methane concentration in the air layer.
Acknowledgement: None.
Funding Statement: The authors received no specific funding for this study.
Author Contributions: The authors confirm contribution to the paper as follows: Study conception and design: Liqiong Chen, Kui Zhao; analysis and interpretation of results: Liqiong Chen, Kui Zhao, Kai Zhang; data collection: Kai Zhang; Wenwen Zhan; draft manuscript preparation: Kui Zhao, Duo Xv; rework & communications: Kai Zhang; guidance and recommendations: Hongxvan Hu, Guoguang Ma. All authors reviewed the results and approved the final version of the manuscript.
Availability of Data and Materials: The authors confirm that the data supporting the findings of this study are available within the article.
Conflicts of Interest: The authors declare that they have no conflicts of interest to report regarding the present study.
References
1. S. Behrang et al., “The impact of methane leakage on the role of natural gas in the European energy transition,” Nat. Commun., vol. 14, no. 1, pp. 5756, Sep. 2023. doi: 10.1038/s41467-023-41527-9. [Google Scholar] [PubMed] [CrossRef]
2. J. E. T. Bistline and D. T. Young, “The role of natural gas in reaching net-zero emissions in the electric sector,” Nat. Commun., vol. 13, no. 1, pp. 4743, Aug. 2022. doi: 10.1038/s41467-022-32468-w. [Google Scholar] [PubMed] [CrossRef]
3. Editorial Board of China Natural Gas Development Report 2023, China Natural Gas Development Report, China: Petroleum Industry Press (in Chinese2023. [Google Scholar]
4. C. Zou et al., “Theory, technology and prospects of conventional and unconventional natural gas,” Pet. Explor. Dev., vol. 45, no. 4, pp. 604–618, Dec. 2018. [Google Scholar]
5. C. Gong, N. Gong, R. Qi, and S. Yu, “Assessment of natural gas supply security in Asia Pacific: Composite indicators with compromise Benefit-of-the-Doubt weights,” Resour. Policy, vol. 67, pp. 101671, Aug. 2020. doi: 10.1016/j.resourpol.2020.101671. [Google Scholar] [CrossRef]
6. J. F. Li, Y. Su, H. Zhang, and B. Yu, “Research progress on pipeline transportation of hydrogen-doped natural gas,” Natural Gas Industry, vol. 41, no. 4, pp. 137–252, Mar. 2021. doi: 10.3787/j.issn.1000-0976.2021.04.015. [Google Scholar] [CrossRef]
7. S. Li, Y. Wen, P. Li, J. Yang, X. Dong and Y. Mu, “Leak location in gas pipelines using cross-time-frequency spectrum of leakage-induced acoustic vibrations,” J. Sound Vib., vol. 333, no. 17, pp. 3889–3903, Aug. 2014. doi: 10.1016/j.jsv.2014.04.018. [Google Scholar] [CrossRef]
8. F. Li, W. Wang, J. Xu, S. Dubljevic, F. Khan and J. Yi, “A CAST-based causal analysis of the catastrophic underground pipeline gas explosion in Taiwan,” Eng. Fail. Anal., vol. 108, Jan. 2020. doi: 10.1016/j.engfailanal.2019.104343. [Google Scholar] [CrossRef]
9. Y. V. Fan, S. Perry, J. J. Klemes, and C. T. Lee, “A review on air emissions assessment: Transportation,” J. Clean. Prod., vol. 194, pp. 673–684, Sep. 2018. doi: 10.1016/j.jclepro.2018.05.151. [Google Scholar] [CrossRef]
10. H. Y. Jiang, Z. Y. Xie, Y. L. Li, and M. H. Chi, “Leakage and diffusion of high-pressure gas pipeline in soil and atmosphere: Experimental and numerical study,” Energy Sources, Part A: Recovery, Util. Environ. Eff., vol. 45, no. 4, pp. 10827–10842, Aug. 2023. doi: 10.1080/15567036.2023.2251429. [Google Scholar] [CrossRef]
11. C. L. Liu, J. An, C. X. Xie, H. W. Wu, and Z. J. Zhang, “Numerical simulation-based pinhole leakage characteristics and hazard boundaries of buried natural gas risers,” Process Saf. Environ. Prot., vol. 184, pp. 462–476, Apr. 2024. doi: 10.1016/j.psep.2024.02.011. [Google Scholar] [CrossRef]
12. N. G. Phillips et al., “Mapping urban pipeline leaks: Methane leaks across Boston,” Environ. Pollut., vol. 173, pp. 1–4, Feb. 2013. doi: 10.1016/j.envpol.2012.11.003. [Google Scholar] [PubMed] [CrossRef]
13. P. Wexler, Encyclopedia of Toxicology, 3rd ed. 2014. [Google Scholar]
14. A. Ebrahimi-Moghadam, M. Farzaneh-Gord, and M. Deymi-Dashtebayaz, “Correlations for estimating natural gas leakage from above-ground and buried urban distribution pipelines,” J. Nat. Gas Sci. Eng., vol. 34, pp. 185–196, Aug. 2016. doi: 10.1016/j.jngse.2016.06.062. [Google Scholar] [CrossRef]
15. A. Nouri-Borujerdi and M. Ziaei-Rad, “Simulation of compressible flow in high pressure buried gas pipelines,” Int. J. Heat Mass Transf., vol. 52, no. 25–26, pp. 5751–5758, Dec. 2010. doi: 10.1016/j.ijheatmasstransfer.2009.07.026. [Google Scholar] [CrossRef]
16. J. A. Olorunmaiye and N. E. Imide, “Computation of natural gas pipeline rupture problems using the method of characteristics,” J. Hazard. Mater., vol. 34, no. 1, pp. 81–98, Apr. 1993. doi: 10.1016/0304-3894(93)87005-e. [Google Scholar] [CrossRef]
17. H. Montiel, J. A. Vı́lchez, J. Casal, and J. Arnaldos, “Mathematical modelling of accidental gas releases,” J. Hazard. Mater., vol. 59, no. 2–3, pp. 211–233, Apr. 1998. doi: 10.1016/s0304-3894(97)00149-0. [Google Scholar] [CrossRef]
18. Y. D. Jo and B. J. Ahn, “A simple model for the release rate of hazardous gas from a hole on high-pressure pipelines,” J. Hazard. Mater., vol. 97, no. 1–3, pp. 31–46, Feb. 2003. doi: 10.1016/s0304-3894(02)00261-3. [Google Scholar] [PubMed] [CrossRef]
19. W. J. Kostowski and J. Skorek, “Real gas flow simulation in damaged distribution pipelines,” Energy, vol. 45, no. 1, pp. 481–488, Sep. 2012. doi: 10.1016/j.energy.2012.02.076. [Google Scholar] [CrossRef]
20. L. Lu, X. Zhang, Y. Yan, J. M. Li, and X. Zhao, “Theoretical analysis of natural-gas leakage in urban medium-pressure pipelines,” J. Environ. Hum., 2014. doi: 10.15764/EH.2014.02009. [Google Scholar] [CrossRef]
21. J. Bezaatpour, E. Fatehifar, and A. Rasoulzadeh, “CFD investigation of natural gas leakage and propagation from buried pipeline for anisotropic and partially saturated multilayer soil,” J. Clean. Prod., vol. 277, pp. 123940, Dec. 2020. doi: 10.1016/j.jclepro.2020.123940. [Google Scholar] [CrossRef]
22. C. Bonnaud et al., “Experimental study and modelling of the consequences of small leaks on buried transmission gas pipeline,” J. Loss Prev. Process Ind., vol. 55, pp. 303–312, Sep. 2018. doi: 10.1016/j.jlp.2018.06.010. [Google Scholar] [CrossRef]
23. M. S. Costanza-Robinson and M. L. Brusseau, “Gas phase advection and dispersion in unsaturated porous media,” Water Resour. Res., vol. 38, no. 4, pp. 7-1–7-9, Apr. 2002. doi: 10.1029/2001wr000895. [Google Scholar] [CrossRef]
24. H. Okamoto and Y. Gomi, “Empirical research on diffusion behavior of leaked gas in the ground,” J. Loss Prev. Process Ind., vol. 24, no. 5, pp. 531–540, Sep. 2011. doi: 10.1016/j.jlp.2011.01.007. [Google Scholar] [CrossRef]
25. Y. Su, J. Li, B. Yu, Y. Zhao, D. Han and D. Sun, “Model of hydrogen blending on the leakage and diffusion of urban buried hydrogen-enriched natural gas pipeline,” Comput. Model. Eng. Sci., vol. 136, no. 2, pp. 1315–1337, Feb. 2023. doi: 10.32604/cmes.2023.026035. [Google Scholar] [CrossRef]
26. Y. Yan, X. Dong, and J. Li, “Experimental study of methane diffusion in soil for an underground gas pipe leak,” J. Nat. Gas Eng., vol. 27, no. 1, pp. 82–89, Nov. 2015. doi: 10.1016/j.jngse.2015.08.039. [Google Scholar] [CrossRef]
27. Y. Kang, S. Y. Ma, M. M. Zhao, Z. Wu, and X. X. Xia, “Study on leakage and explosion law of buried gas pipeline based on scenario construction,” Environ. Sci. Pollut. Res. Int., vol. 30, no. 29, pp. 73899–73912, Jun. 2023. doi: 10.1007/s11356-023-27291-9. [Google Scholar] [PubMed] [CrossRef]
28. A. Ebrahimi-Moghadam, M. Farzaneh-Gord, A. Arabkoohsar, and A. J. Moghadam, “CFD analysis of natural gas emission from damaged pipelines: Correlation development for leakage estimation,” J. Clean. Prod., vol. 199, pp. 257–271, Oct. 2018. doi: 10.1016/j.jclepro.2018.07.127. [Google Scholar] [CrossRef]
29. X. Wang, Y. Tan, T. Zhang, R. Xiao, K. Yu and J. Zhang, “Numerical study on the diffusion process of pinhole leakage of natural gas from underground pipelines to the soil,” J. Nat. Gas Sci. Eng., vol. 87, pp. 103792, Mar. 2021. doi: 10.1016/j.jngse.2020.103792. [Google Scholar] [CrossRef]
30. C. Liu, Y. Liao, J. Liang, Z. Cui, and Y. Li, “Quantifying methane release and dispersion estimations for buried natural gas pipeline leakages,” Process Saf. Environ. Prot., vol. 146, pp. 552–563, Feb. 2021. doi: 10.1016/j.psep.2020.11.031. [Google Scholar] [CrossRef]
31. F. Bu et al., “Leakage diffusion characteristics and harmful boundary analysis of buried natural gas pipeline under multiple working conditions,” J. Nat. Gas Sci. Eng., vol. 94, pp. 104047, Oct. 2021. doi: 10.1016/j.jngse.2021.104047. [Google Scholar] [CrossRef]
32. S. Joshi, A. Prashant, A. Deb, and S. K. Jain, “Analysis of buried pipelines subjected to reverse fault motion,” Soil Dyn. Earthq. Eng., vol. 31, no. 7, pp. 930–940, Jul. 2011. doi: 10.1016/j.soildyn.2011.02.003. [Google Scholar] [CrossRef]
33. J. Zhang, Z. Liang, and C. J. Han, “Buckling behavior analysis of buried gas pipeline under strike-slip fault displacement,” J. Nat. Gas Sci. Eng., vol. 21, pp. 921–928, Nov. 2014. doi: 10.1016/j.jngse.2014.10.028. [Google Scholar] [CrossRef]
34. M. D. Steven, K. L. Smith, M. D. Beardsley, and J. J. Colls, “Oxygen and methane depletion in soil affected by leakage of natural gas,” Eur. J. Soil Sci., vol. 57, no. 6, pp. 800–807, Nov. 2006. doi: 10.1111/j.1365-2389.2005.00770.x. [Google Scholar] [CrossRef]
35. R. E. Ewing, J. Wang, and S. L. Weekes, “On the simulation of multicomponent gas flow in porous media,” Appl. Numer. Math., vol. 31, no. 4, pp. 405–427, Dec. 1999. doi: 10.1016/s0168-9274(99)00006-9. [Google Scholar] [CrossRef]
36. X. Y. Wang, M. P. Du, T. Wang, Y. Q. Bai, and Y. Xiang, “Numerical simulation of leakage of gas from buried pipeline and its diffusion process,” (in ChineseChina Saf. Sci. J., vol. 28, no. 2, pp. 45–50, 2018. [Google Scholar]
37. Y. K. Zhang et al., “Numerical investigation on pinhole leakage and diffusion characteristics of medium-pressure buried hydrogen pipeline,” Int. J. Hydrog. Energy, vol. 51, pp. 807–817, Jan. 2024. doi: 10.1016/j.ijhydene.2023.04.209. [Google Scholar] [CrossRef]
38. S. Sarkar and B. Lakshmanan, “Application of a Reynolds stress turbulence model to the compressible shear layer,” AIAA J., vol. 29, no. 5, pp. 743–749, 1991. doi: 10.2514/3.10649. [Google Scholar] [CrossRef]
39. J. Rieger, C. Weiss, and B. Rummer, “Modelling and control of pollutant formation in blast stoves,” J. Clean. Prod., vol. 88, pp. 254–261, Feb. 2015. doi: 10.1016/j.jclepro.2014.07.028. [Google Scholar] [CrossRef]
40. D. Xu et al., “Study on the leakage dispersion law of exposed high-pressure natural gas pipelines in the mountainous environment,” Front. Energy Res., vol. 10, Jan. 2023. doi: 10.3389/fenrg.2022.1031006. [Google Scholar] [CrossRef]
Cite This Article
 Copyright © 2024 The Author(s). Published by Tech Science Press.
This work is licensed under a Creative Commons Attribution 4.0 International License , which permits unrestricted use, distribution, and reproduction in any medium, provided the original work is properly cited.
 Downloads
 Citation Tools