
 Submit a Paper
 Propose a Special lssue
 Open Access
ARTICLE

Analyzing the Wind-Dominant Electricity Market under Coexistence of Regulated and Deregulated Power Trading
1 School of Electric Power, South China University of Technology, Guangzhou, 510641, China
2 School of Engineering and Computer Science, Washington State University Vancouver, Vancouver, 98686, USA
3 School of Automation, Guangdong University of Technology, Guangzhou, 510006, China
* Corresponding Author: Dongliang Xiao. Email:
(This article belongs to the Special Issue: Wind Energy Development and Utilization)
Energy Engineering 2024, 121(8), 2093-2127. https://doi.org/10.32604/ee.2024.049232
Received 31 December 2023; Accepted 14 March 2024; Issue published 19 July 2024
 View Full Text
 Download PDF
Abstract
Currently, both regulated and deregulated power trading exist in China’s power system, which has caused imbalanced funds in the electricity market. In this paper, a simulation analysis of the electricity market with wind energy resources is conducted, and the calculation methods of unbalanced funds are investigated systematically. In detail, the calculation formulas of unbalanced funds are illustrated based on their definition, and a two-track electricity market clearing model is established. Firstly, the concept of the dual-track system is explained, and the specific calculation formulas of various types of unbalanced funds are provided. Next, considering the renewable energy consumption, the market clearing model based on DC power flow is constructed and solved; by combining fitting methods of mid- and long-term curves, the unbalanced funds are calculated based on clearing results and formulas.Keywords
The excessive use of fossil fuels has increased greenhouse gas emissions, leading to global climate change and posing numerous risks to the sustainable development of human society and other forms of life on Earth [1,2]. The threats posed by the global energy crisis and climate change necessitate innovation in the energy sector and an urgent need for a transformation in energy infrastructure. Renewable energy has advantages such as being low in environmental pollution, cost-effective [3], and abundant in resources, relevant technologies for renewable energy to participate in the power grid have been explored, such as forecasting models [4], solutions for the stable operation of renewable energy microgrid [5], effects of storage technologies on renewable energy system [6]. The utilization of renewable energy can improve the environment, diversify fuel sources, and stimulate regional economic development. To promote the sustainable development of cities and societies, address global climate change issues, and enhance industrial production efficiency, it is necessary to vigorously develop renewable energy sources.
China is vigorously developing renewable sources as well, and new technologies for renewable energy are being promoted to obtain greater economic benefits [7], such as integrating renewable resources effectively through a well-established electricity market [8–10], and strengthening government regulation on renewable power generation and transmission [11]. Currently, China’s current energy supply system operates in parallel with both “regulated and deregulated” power trading, and renewable energy sources are given priority for electricity generation and do not participate in the electricity market, which will lead to the expansion of the scale of unbalanced funds in the settlement. Against the backdrop of a new round of power system reforms in China, provinces such as Shandong and Fujian, serving as pilot projects for the construction of electricity spot markets, initiated market trial settlement operations in 2019. Under the system where regulated and deregulated power trading coexist, electricity generation can be divided into marketized electricity and planned electricity. Taking Shandong Province’s spot market as an example: Electricity from outside the province and new energy sources within the province were not regarded as marketized electricity and did not participate in the market, and the marketized electricity traded in the Shandong electricity spot market was only provided by thermal power units in the province. The prioritized generation capacity (including specific power sources such as new energy, nuclear power, and electricity from outside the province) must adhere to the dual standards of marketized prices and quantity-price guarantees, prioritized for consumption, and settled by the grid company acting as an aggregator separately with users and power generation enterprises.
The generation of unbalanced funds is related to the market mechanism, whose production is affected by many factors, such as balance costs brought about by the fluctuation of new energy [12,13], and the mismatch between prioritized electricity generation and prioritized electricity consumption. During the mechanism design of the electricity market, individual rationality [14] and budget balance [15–17] need to be considered carefully; if a mechanism does not meet the above two principles, additional compensation or allocation is typically required, which can also be categorized as unbalanced funds.
The increase in renewable energy generation will further expand the scale of unbalanced funds in China’s electricity market, significantly impact the normal functioning of the market and the profits of various market participants. Therefore, it is necessary to derive a universal calculation formula and accurately assess the types and corresponding scales of unbalanced funds. To improve the accuracy of the estimation, data fitting is progressively carried out, starting from the loads of various cities.
The reform of the electric power system in China is being further deepened [18,19], and market-oriented reform is the key point. A more competitive unified electricity market is being established [20], and electricity subsidy reform is carried out as an effective method for mitigating the rebound effect [21,22]. Reform of electricity prices is underway, and real-time electricity pricing will have great significance with the rapid development of the smart grid [23], as it also contributes to solving the problem that catalog electricity prices in China are highly subsidized [24]. However, the structural transformation of China’s power supply is not covered in the above studies, and the unbalanced funds derived from the structural transformation are the focus of this paper.
1.1 Structure of Power Trading
The mode of China’s power mechanism is transforming from traditional “planned management” to new “market regulation” [25]. During the process of transformation, the coexistence of regulated and deregulated power trading will exist for a long time, and the structure of power supply in China is shown in Fig. 1. Medium and long-term market and spot market are included in the electrical energy market, and the spot market can be further divided into day-ahead and real-time electricity markets.
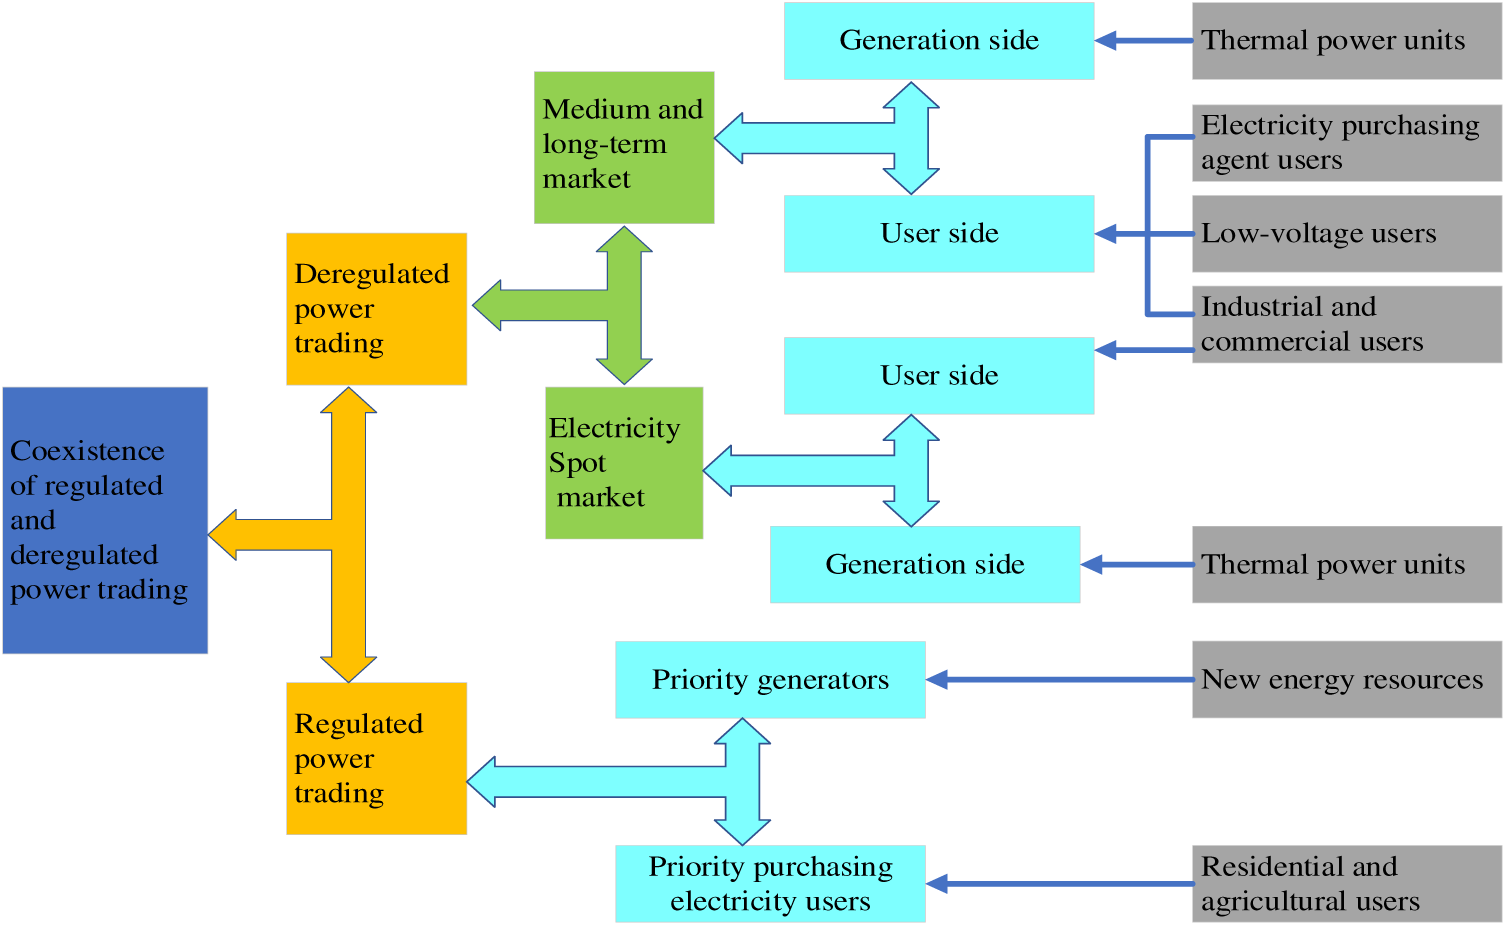
Figure 1: Structure of coexistence of regulated and deregulated power trading
Under the mode where regulated and deregulated power trading coexist, an effective connection between planned and marketized electricity is important [26]. There are two operating methods: “decoupling” and “non-decoupling” of planned and marketized electricity, the former is not suitable for large-scale markets, while unbalanced funds need to be handled properly in the latter method [27]. In the decoupling mode, the base power generation used for settlement on the generation side needs to be adjusted, so that power consumption of non-market-oriented users is equal to base power generation. In the non-decoupling mode, the value of base power generation is settled strictly according to that stipulated by the government, and the market-oriented power generation is not equal to the market-oriented power consumption. The planned electricity is settled at a price approved by the government, to ensure supply of electricity for non-market-oriented users. Marketized electricity is settled by using time-of-use electricity prices, to promote competition among market-oriented users and to realize the efficient and optimal allocation of electric resources [28].
In May 2020, Shandong Province conducted a four-day trial operation of continuous settlement in the electricity spot market. During the trial settlement period, a total of 95.0819 million yuan of unbalanced funds was generated. The spot market rules of Shandong Province stipulate that electricity from outside the province and new energy sources within the province are not regarded as marketized electricity and do not participate in the market, and the marketized electricity traded in the Shandong electricity spot market is only provided by thermal power units in the province. The prioritized generation capacity (including specific power sources such as new energy, nuclear power, and electricity from outside the province) must adhere to the dual standards of marketized prices and quantity-price guarantees, and the grid company serves as an aggregator to handle separate settlements with users and power generation enterprises. Against the backdrop of fully liberalizing market participation for commercial users, the dual-track settlement conflicts arising from the imbalance between generation and consumption of marketized electricity continue to be highlighted.
In May 2019, Guangdong’s electricity spot market experienced a phenomenon of negative congestion-unbalanced funds during the daily trial settlement. After allocating the negative congestion-unbalanced funds, many users who were originally supposed to be profitable based on market prices incurred losses; and upon analyzing the reasons for the losses among these users, it was found that under the dual-track system, planned electricity occupied transmission channels without paying the corresponding blocking fees, resulting in negative congestion surplus/loss. In the extreme scenario where market-oriented units were all located at high-price nodes, the electricity consumption of market-based users was settled at a unified price on the user side (calculated through full-load weighting), and the electricity fees paid by users could not cover the generating costs of market-oriented units.
In the construction of the electricity market, the problem of “unbalanced funds” is gradually attracting attention. The costs or surpluses generated in the operation of the electricity market are defined as unbalanced funds. There is not a clear market subject to bear the funds, so they need to be shared or returned to market subjects.
The notable characteristic of unbalanced funds is the inability to identify responsible parties. From a commodity perspective, the spot market can be divided into the electricity market, ancillary services market, demand response market, etc. Ancillary service compensation, demand response compensation, electricity evaluation costs, service evaluation costs, and similar costs also fall within the category of unbalanced funds as they lack clear responsible parties for allocation.
This article only discusses the unbalanced funds in the electricity market: from the perspective of market operators, there is a discrepancy between the total electricity fees payable by users and the total electricity fees receivable by generators in the electricity market. There is no clear entity responsible for allocating this deviation, which constitutes the unbalanced funds discussed in this article.
There are two main reasons behind the occurrence of unbalanced funds in China:
There is a mismatch between prioritized electricity generation (such as generation of renewable energy sources)/inter-provincial electricity and prioritized purchasing electricity, an imbalance in scale between marketized electricity generation and consumption is arising due to the mismatch.
As the pricing mechanism or settlement mechanism does not match the actual situation, the scale of unbalanced funds is further expanded.
During the trial operation of China’s electricity spot market, issues with unbalanced funds have arisen. The National Development and Reform Commission (NDRC) made it clear that pools of unbalanced funds should not be established, and each settlement item must be independently recorded, with clear and specific categorization. The approach adopted by different provinces to address unbalanced funds is to allocate them among various market participants. For example, in Shanxi Province, it was stipulated that congestion-unbalanced funds are to be shared on a 1:1 basis between power generation enterprises and wholesale market users or electricity purchasing agent users. Among power generation enterprises, the sharing was based on the proportion of monthly on-grid electricity (excluding inter-provincial spot energy); and wholesale market users and electricity purchasing agent users shared the burden based on the proportion of monthly settled electricity volume.
The suggestions for handling unbalanced funds by optimizing the calculation of electricity prices to reduce the income gap among relevant market participants and specifying the distribution method for congestion surplus to ensure market fairness are proposed in [29]. The settlement method, as proposed in [28], involves treating the base electricity generation of each market-oriented unit as shares; during the settlement process, the actual settlement of prioritized generation electricity is adjusted based on the curve of electricity consumption of prioritized purchasing users to avoid the generation of unbalanced funds. The settlement method mentioned above may result in market-oriented units bearing additional costs due to inaccurate load forecasting and deviations in prioritized generation, thus damaging their interests. The approach suggested in [30] advocates resolving unbalanced funds through subsidies, and it proposes dividing the settlement price for the prioritized electricity into two parts: spot market price and subsidy price. The subsidies are then allocated to eliminate unbalanced funds; however, the standards for subsidy prices and how the settlement mechanism should be designed have not been specified. In [31], it is mentioned that charges for unbalanced fees, such as compensation for ancillary services, should be collected from designated market participants; and refundable unbalanced funds, such as congestion surplus and assessment fees, should be refunded to designated market participants; however, the specific entities responsible for various unbalanced funds had not been specified.
Unbalanced funds can be divided into congestion surplus, deviation of electricity generation and consumption, and unbalanced funds caused by the coexistence of regulated and deregulated power trading, etc. Interests of all subjects are related to the apportionment of unbalanced funds, and the treatment of unbalanced funds is the key point in the design of the market mechanism.
The unbalanced funds caused by the coexistence of regulated and deregulated power trading are the main parts of unbalanced funds, which need to be described with emphasis. Prioritized electricity does not participate in the market, during the settlement, the prioritized electricity on the generation side is settled according to benchmarking price, while the prioritized electricity on the user side is settled based on the original catalog price. Marketized electricity is settled according to the market price. There is a mismatch between the total amount of marketized electricity generation and consumption, and the values of electric energy in different periods are different, which has an impact on the time-sharing matching of prioritized electricity generation and consumption. Unbalanced funds caused by the coexistence of regulated and deregulated power trading are defined as surplus or loss due to the above reasons.
In May 2020, Shandong Province conducted a 4-day trial operation of continuous settlement in the electricity spot market, resulting in a total of 95.0819 million yuan of unbalanced funds during the trial settlement period. The unbalanced funds can be divided into two parts: First, 61.5853 million yuan resulted from the imbalance caused by market-oriented users’ electricity consumption exceeding the on-grid electricity from in-province market-oriented units; second, 33.4966 million yuan resulted from the imbalance caused by the mismatch in the timing of marketized electricity generation and consumption. The substantial unbalanced funds generated during the trial operation of the Shandong spot market can be attributed to two main factors: Firstly, the mismatch in the total quantity of marketized electricity generation and consumption, primarily due to the prioritized generation of new energy sources such as wind and solar; secondly, the unbalanced funds arising from the mismatch in the generating curves of in-province market-oriented units and consuming curves of market-oriented users.
In Shandong Province’s electricity spot market, settlement was conducted using the weighted average price on the generation side. When marketized electricity consumption exceeded the on-grid electricity from in-province market-oriented units (i.e., when marketized electricity consumption surpassed in-province marketized electricity generation), the grid company, to meet the demands of market-based users, was compelled to purchase electricity at a higher price from the generation side and sell it to market-oriented users at a lower price. The majority of users settled transactions based on the mid-and-long term market price (382 yuan per megawatt-hour), while units settled based on the benchmarking electricity price for non-market-oriented units (395 yuan per megawatt-hour).
When the electricity generation from clean energy significantly increased, prioritized electricity generation exceeded prioritized electricity consumption. Market-oriented thermal units needed to reduce their outputs; and the deviated electricity, resulting from this reduction, was settled at the spot market price, which was an average of 198 yuan per megawatt-hour for the day-ahead market and 182 yuan per megawatt-hour for the real-time market. However, the deviated electricity caused by the increased generation from clean energy was settled at the approved electricity price, which was 395 yuan per megawatt-hour. The deviated electricity had exacerbated the scale of unbalanced funds.
In this paper, classification, and calculation methods of unbalanced funds are firstly summarized, where the characteristics of wind power in electricity market clearing are considered. Next, the current situation of China’s electricity supply system is addressed in detail, and the research on unbalanced funds in a dual-track market with wind energy resources is carried out. Finally, the impacts of wind power on the two-track electricity market are explained, and the simulation results can provide references for the calculation and classification of unbalanced funds in the system where regulated and deregulated power trading coexist.
1.3 Bibliographical Review and Contributions of the Paper
Unbalanced funds are classified in detail from multiple dimensions such as market participants, mechanism design, and product markets in reference [29], and the typical formation mechanisms of unbalanced funds are explained through the data of calculating examples and volume and price curves under different scenarios; however, it mainly focuses on theoretical introduction and lacks the construction of specific calculation models and derivation of formulas for unbalanced funds. and how to accurately calculate unbalanced funds under simulation conditions has not been yet discussed. By changing factors such as prioritized electricity generation, prioritized purchasing electricity, and electricity of market-oriented users, the unbalanced funds of the dual-track system under different scenarios are calculated in [30], and it is pointed out that the generation of unbalanced funds is related to the mismatch between the prioritized electricity generation and the prioritized electricity consumption at each settlement period; however, the types of unbalanced funds are not divided in this article, and the simulation of actual power systems including topological structures and the calculating methods of unbalanced funds are not mentioned. The congestion-unbalanced funds under the conditions of independent market, unified market, and unified market with congestion are calculated through a simple power system in reference [31], but the basis for classifying unbalanced funds is not pointed out, which causes a certain deviation in understanding. The core of handling the allocation of unbalanced funds in the power spot market is to determine which costs should be included in the unbalanced costs, the view is pointed out in reference [32]; however, the basis for the allocation of unbalanced charges is not pointed out in this article, and the impact of the allocation method on each subject has not been verified by simulation. The current calculation formulas and processing methods of congestion-unbalanced funds and deviations from the dual-track market are sorted out in reference [33], and a cost risk management mechanism for electricity price swap transactions is also proposed, and a mechanism to manage the risk of unbalanced funds through electricity price swaps is also proposed; however, the mechanism of the generation of unbalanced funds in actual market operations has not been discussed. There is a strong correlation between the settlement mechanism of deviation electricity and the unbalanced funds in the settlement process, and an allocating model of unbalanced funds based on ABM (agent-based modeling) is established in reference [34], and the bidding decision-making process of each market entity is effectively simulated in the article; however, the principle involved in the mechanism of allocating unbalanced funds is not explained. Taking the unilateral market model as the background, a model for the settlement of dual-track unbalanced funds and congestion-unbalanced funds under the mechanism involving settlement of based electricity is proposed in reference [35], but the mechanism has certain limitations, requiring the scale of liberalized generated electricity to be larger than the scale of liberalized consumed electricity on the user side.
Existing research does not start from the results of market clearing to calculate unbalanced funds, and the boundary conditions of the simulation are not obtained from the actual operating market; for example, the authors set the electricity generation by themselves according to the demand for comparison [30,31], and only the data of electricity prices in the market are intercepted to prove the point made but not used for simulation analysis [33,34], etc. This article is based on the improved IEEE 39 nodal system and the real data of the electricity market in a province in China, including the number of cities, the installed capacity of the generation side, the typical curves of electricity consumption on the user side, and the number of various types of users, etc. The operating data of a real regional market is fitted to the boundary conditions required to carry out simulation calculations. The clearing process of the electricity market in which new energy sources participate in electricity generation is completely simulated through the DC power flow model, and the winning amount of electricity of each unit and the nodal prices obtained from the clearing are substituted into the detailed calculation of unbalanced funds.
As for the calculating methods of unbalanced funds: Calculation is carried out based on the overall electricity generated on the generation side and all electricity consumed on the user side [30]; the electricity generation plans and bidding prices of generators required for the calculation are based on empirical values [31]; the calculation is based on electricity of all transactions and risks of the transactions in the market [33]; the actual prices in the spot market are adopted and the total values of electricity generation and electricity consumption are generally set [35]. Existing methods for calculating unbalanced funds are based on the macro electricity quantity of both generation and consumption sides. The definitions of the various components of existing unbalanced funds calculating formulas are unclear, making it impossible to calculate unbalanced funds based on specific market clearing data from simulations. The innovation of this paper lies in conducting comprehensive market clearing simulations and proposing specific formulas for calculating various types of unbalanced funds for each settlement moment. By substituting the clearing results into the calculating formulas, the scale of various types of unbalanced funds can be calculated simply and accurately.
To sum up, the existing research is based on the calculation of the macroscopic electricity of both parties but does not involve the data of volume and prices for specific users and specific nodes at each settlement moment, and no scholar has yet conducted a clearing simulation of the electricity market and calculated unbalanced funds based on the simulation results. This article starts from how various users and power generators participate in electricity market settlement, and based on the definitions and causes of various types of unbalanced funds, successfully derives the calculating formulas for various types of unbalanced funds. The formulas are very detailed and involve factors such as the mid-and-long contractual electricity of various users, the electricity declared in the spot market, and nodal prices in each settlement period; according to the data of market clearing and the proposed fitting method, each part of the formulas can be corresponded, providing a method and reference for the accurate calculation of unbalanced funds in the market.
2 Calculation Formula of Unbalanced Funds
There is a difference between the electricity expense payable by the user side and the electricity expense receivable by the generator side, which is the essence of unbalanced funds. Receivable/payable expense is related to the price and quantity of electricity, so unbalanced funds can be divided into five categories according to the difference between electricity and price in the actual market, which is shown in Fig. 2.
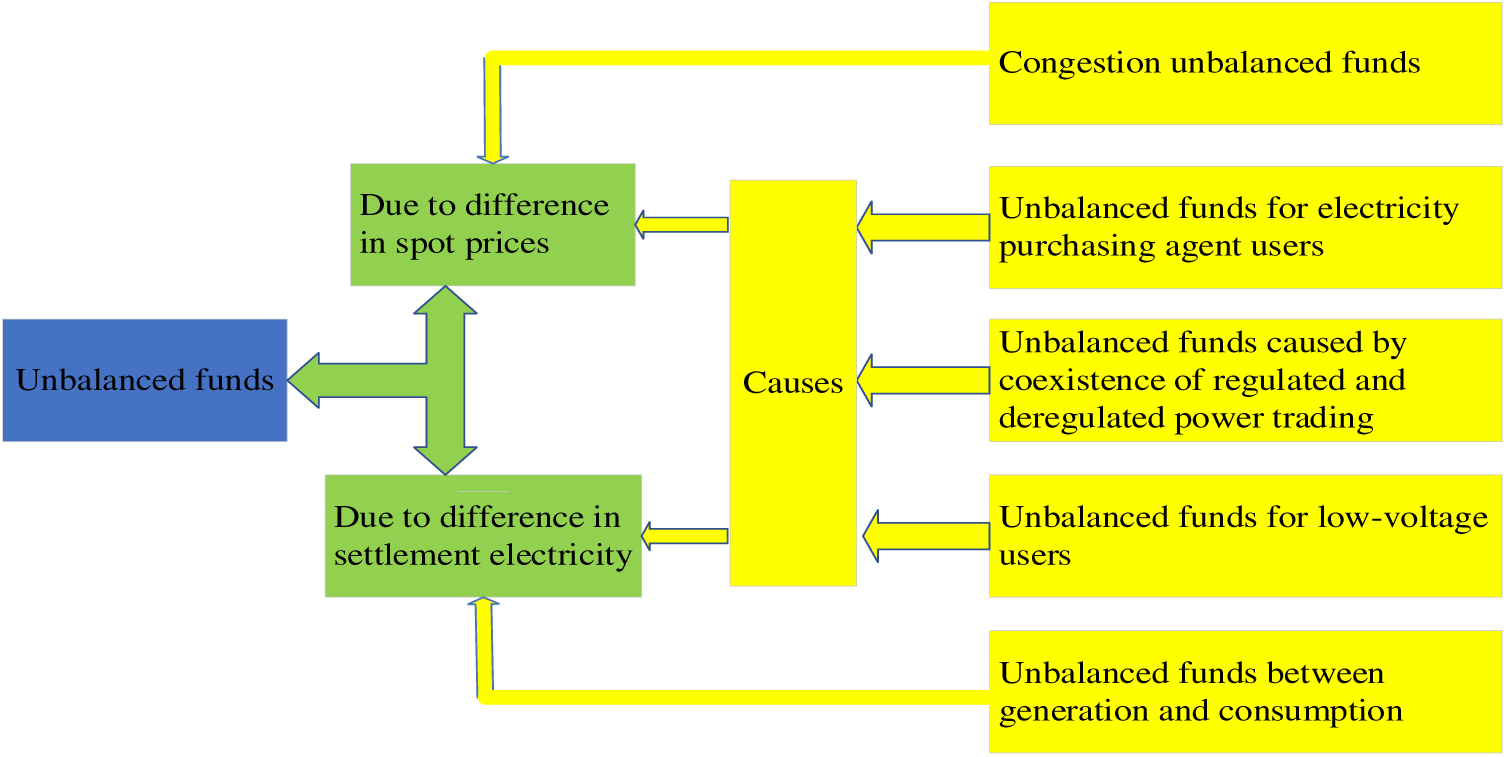
Figure 2: Classification of unbalanced funds
2.1 Congestion-Unbalanced Funds
In the electricity spot market, the expense of electric energy is settled according to the nodal price on the generation side, while the expense of electric energy is settled according to the unified nodal price on the user side, which will result in a deviation between expense payable and expense receivable in the market.
When the unified nodal prices are adopted by the user side for the settlement of electric energy, the congestion expense of the spot deviation electric quantity in the integrated full electricity will be covered in the electricity prices. Under the premise, only the congestion expense for the respective contractual electricity needs to be calculated in the day-ahead and real-time markets. Electricity purchasing agent users and low-voltage users do not participate in the spot market, so their contractual electricity needs to be deducted from the contractual electricity of the market-oriented units.
In the day-ahead market,
where
For the real-time market, the day-ahead clearing electricity of market-oriented unit
where
2.2 Unbalanced Funds between Generation and Consumption
In the electricity spot market, the clearing electricity in the day-ahead market is treated as the settlement electricity on the generation side, and the declared electricity of users in the day-ahead market is treated as the settlement electricity on the user side, so there is an imbalance in electricity settlement between generation and consumption, which results in deviated electricity expense.
where
where
where
where
At time t, the mid-and-long term contractual electricity of market-oriented users is equal to the sum of contractual electricity of the three types of market-oriented users, as follows:
At time t, it is considered that the real-time electricity generation of market-oriented units is equal to the actual electricity consumption of market-oriented users, as follows:
In the case without congestion, the nodal prices of the nodes where units are located are equal to the unified nodal price, as follows:
In the medium and long-term market, the settlement electricity expense on the generation side and that on the user side are equal; in the day-ahead market and the real-time market, the settlement electricity expense on the user side minus the settlement electricity expense on the generation side,
where
2.3 Unbalanced Funds Caused by the Coexistence of Regulated and Deregulated Power Trading
In the mode where regulated and deregulated power trading coexists, in each spot period, the electricity generation of non-market-oriented units does not match perfectly with the electricity consumption of non-market-oriented users. Planned generation needs to be sold to market-oriented users through the grid company at a marketized price, or marketized electricity generation needs to be sold to non-market-oriented users through the grid company at a government-authorized price, which results in unbalanced funds.
At a specific moment in an electricity market, the electricity generation of all units on the generation side should be equal to the electricity consumption of all users on the user side. The electricity on the generation side can be divided into marketized electricity and non-marketized electricity. Non-marketized electricity generation includes prioritized electricity from outside the province, electricity generated by new energy sources, base electricity of thermal power units, etc., and marketized electricity generation is mainly the electricity generated by market-oriented units; users can be divided into market-oriented users and non-market-oriented users, and their electricity consumption corresponds to marketized electricity consumption and non-marketized electricity consumption, respectively.
a) When non-marketized electricity consumption is greater than non-marketized electricity generation, the electric structure is shown in Fig. 3.
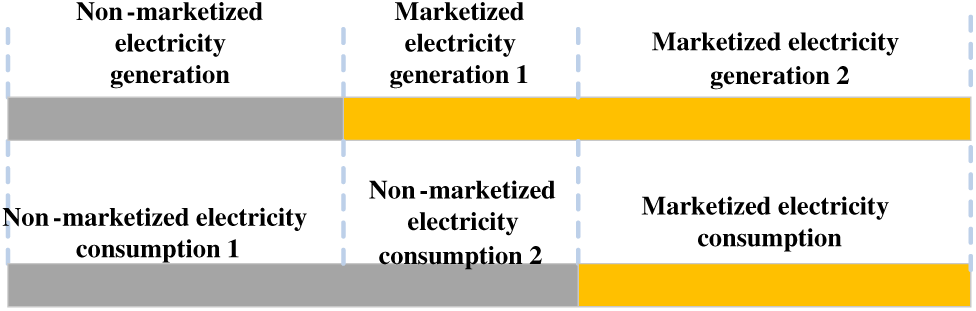
Figure 3: Electric structure when non-marketized electricity consumption is greater than non-marketized electricity generation
In Fig. 3, the upper layer represents the structure of electricity on the power generation side, and the lower layer represents the structure of electricity on the user side; the gray lines represent non-marketized electricity, and the yellow lines represent the marketized electricity.
In Fig. 3, the marketized electricity generation exceeds marketized electricity consumption, to illustrate this structure and facilitate understanding, a portion of marketized electricity generation equal in value to marketized electricity consumption is designated as ‘Marketized electricity generation 1’, while the excess portion is designated as ‘Marketized electricity generation 2’.
where
where
In time t, electricity generation on the generation side is equal to the electricity consumption on the user side:
For ease of understanding, there are the following decomposition relationships:
where
Eq. (15) represents the electricity structure when non-marketized electricity generation is less than non-marketized electricity consumption. Eq. (15) explains Fig. 3.
Assuming the difference between non-marketized electricity consumption and non-marketized electricity generation is GAP1, and assuming GAP2 is the difference between marketized electricity generation and marketized electricity consumption, GAP1 is equal to GAP2.
b) When non-marketized electricity generation is greater than non-marketized electricity consumption, the electric structure is shown in Fig. 4.
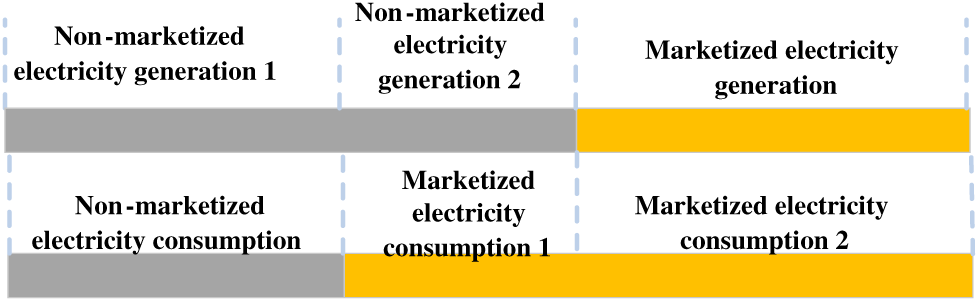
Figure 4: Electric structure when non-marketized electricity generation is greater than non-marketized electricity consumption
The layers and lines of Fig. 4 are the same as in Fig. 3.
where
Non-marketized electricity generation on the generation side is settled based on benchmarking electricity prices, while marketized electricity generation on the generation side is settled based on the nodal electricity prices where the units are located. Non-marketized electricity generation includes
where
In time t, electricity generation on the generation side is equal to the electricity consumption on the user side:
For ease of understanding, there are the following decomposition relationships:
where
c) There is a difference in the settlement electricity expense between the user side and the generation side, and
2.4 Unbalanced Funds for Low-Voltage Users
At the early stage, low-voltage users do not participate in the electricity spot market. Low-voltage users who do not have time-of-use metering equipment can only sign mid- and-long term contracts and participate in transactions of medium and long-term markets by using typical mid-and-long term contractual curves. There is a deviation between actual electricity consumption and contractual electricity: The variational electricity should be settled at the spot price theoretically, while it is settled at the contractual price. The settlement price of variational electricity is consistent with the spot price.
There is a difference between the actual settlement expense and the theoretical expense, and
2.5 Unbalanced Funds for Electricity Purchasing Agent Users
Electricity purchasing agent users can only sign mid- and long-term contracts, and they participate in the transaction of medium and long-term markets. Their unbalanced funds are generated for the same reasons as low-voltage users.
There is a difference between the actual settlement expense and the theoretical expense, and
3 Mathematical Model of Market Clearing
In the simulation model, it is necessary to achieve market-based adjustments for real-time balancing of power and grid security constraints. Under the conditions of meeting safety constraints, optimal economic dispatch of units is conducted to achieve the optimal generation cost for the entire system and obtain the market-clearing electricity prices for each period.
Regarding the specific elements of the market clearing model: The market clearing is based on a direct current power flow model to construct network security constraints. The objective function of the clearing is to maximize social welfare (in this paper, it refers to minimizing the total purchasing cost to society). The results of the clearing include the electricity generation of each generating entity at each time and the nodal prices. Constraints that need to be followed during the clearing process include constraints that the flow of the system needs to be balanced, flow constraints of lines, output constraints of units, and constraints on phase angles.
In the power network, thermal power units and wind turbines are distributed on different nodes, and city loads are distributed on the other nodes without units, loads in each city consist of the electricity consumption of four types of users (commercial and industrial users, electricity purchasing agent users, low-voltage users, residential and agricultural users, who have been shown in Fig. 1). Thermal power units participate in electricity market (including medium and long-term market, day-ahead market and real-time market), as the electricity generation of wind turbines is treated as marginal condition for market clearing, which is fully consumed. In the day-ahead market, thermal units declare their willingness about volume and price for the next day, and there is deviation of load on the user side. In the real-time market, thermal units declare their willingness about volume and price for today, and there is no deviation of load on the user side. The willingness declared by thermal power units is divided into ten segments.
For electricity users, at the same node, the sum of the electricity consumption of all users is equal to the nodal load.
Power system security constraints of the market clearing process are constructed based on the DC power flow model. The objective function of market clearing is the lowest power purchasing cost, consideration of cleared electricity, declared price, and start-up cost of thermal units. Unit operation constraints, network security constraints, and market rules constraints are included in the constraints. To facilitate the demonstration of the calculating process, both the day-ahead market and the real-time market clearing are performed at hourly intervals, and the time interval of the simulation does not affect the conclusion of the article. The results of clearing are hourly cleared electricity of thermal units and locational marginal prices. The details are as follows.
Clearing objective function for minimizing social electricity purchasing cost:
where
a) Thermal units’ output constraints:
For each thermal power unit, the sum of the cleared electricity in all segments should be less than or equal to the maximum electricity generation, and greater than or equal to the minimum electricity generation required to start the unit.
where
For each bidding segment, cleared electricity (in the market, after competition and scheduling calculations, the final actual electricity generation of the unit) must be less than the declared electricity.
where
For each thermal unit, to realize the target to maximize its interest, the sum of declared electricity in all segments should be equal to the maximum generating capacity.
b) Constraints on the balance of electricity generation and consumption:
At each moment, the total electricity generation should be equal to the total electricity consumption in the system, as the sum of all units’ generation shall be equal to the sum of the load of all cities.
where
c) System power constraints:
The system power needs to be balanced at every moment during power flow operation, as follows:
where
Here is the formula for calculating
where
The power flow on each branch cannot break the upper and lower flow limits of the branch.
where
Nodal voltage phase angle constraints:
where
d) Generator performance constraints:
Hot standby of thermal power units:
where
Thermal power units ramping constraints:
where
Minimum start-up and shut-down time constraints:
where
The simulation example is based on market data of Hunan province at various moments: Typical electricity consumption in cities, provincial generating power of thermal power units, provincial generating power of wind turbines in different cases, typical electricity consumption of various types of users, and proportion of total electricity consumption of various types of users are mainly adopted. The simulating analysis is carried out at an interval of one hour, and unbalanced funds are calculated for a whole day.
Two types of units are set on the generation side: Thermal and wind power. Thermal units are market-oriented units, and wind turbines are non-market-oriented units with prioritized generation. The provincial generating power of thermal units and wind turbines at various moments is shown in Fig. 5. To make the picture concise, the ‘Low’ in the legend represents the curve of the provincial generating power of wind turbines, and ‘Middle’ and ‘High’ in the legend also mean this; and the ‘Thermal’ in the legend represents the curve of provincial generating power of thermal units.
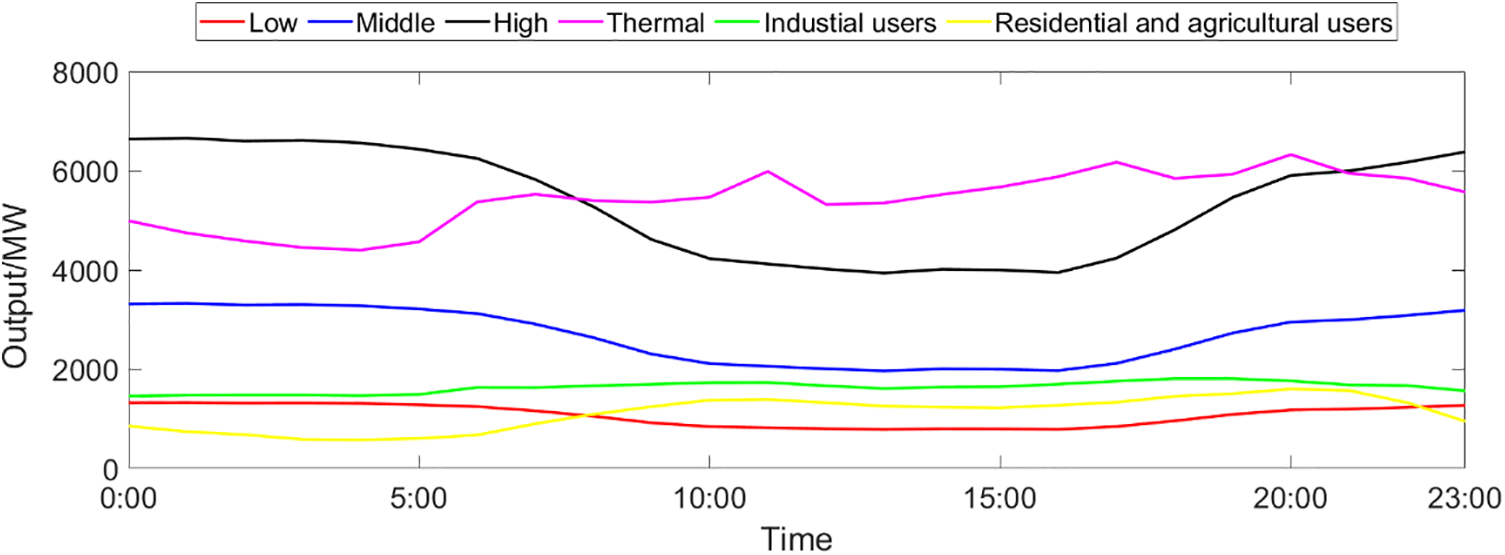
Figure 5: The provincial generating power of thermal units and wind turbines, and the typical electricity consumption of two types of users at various moments
There are four categories of users on the user side: Industrial users, residential and agricultural users, electricity purchasing agent users, and low-voltage users. The proportion of their total electricity consumption is 34%, 39%, 23% and 4%, respectively. Industrial users participate in both medium- and long-term market and spot market, and their total contractual electricity accounts for 90% of total electricity consumption, while their spot electricity accounts for 10% of total electricity consumption. Electricity purchasing agent users and low-voltage users are also market-oriented users, but they only sign mid-and-long term contracts, and the contractual electricity accounts for 90% of their total electricity consumption, respectively. Residential and agricultural users are non-market-oriented users, all of their electricity consumption is settled at catalog electricity price. The realistic typical electricity consumption of industrial users and residential and agricultural users are shown in Fig. 5.
In reality, the electricity consumed by the user side includes electricity from outside the province and electricity from other units such as hydropower and photovoltaics; however, in the simulating calculation of this article, only the thermal power and wind power units in the province are considered on the power generation side, so the original load data of the province cannot be directly adopted by the user side. According to the principle that electricity generation and electricity consumption are equal in real-time, through the power generation of thermal power and wind power in the whole province shown in Fig. 5, the user-side electricity required for simulation can be obtained.
To make the simulation process more complete, it is necessary to carry out the fitting of electricity and the calculation of electricity expenses based on each city. Under the simulation conditions, the fitting methods of electricity consumption in each city are shown as follows.
Calculation method of the province’s electricity generation at each moment:
where
Under the simulation conditions, the calculation method of the city’s electricity consumption at each moment:
where
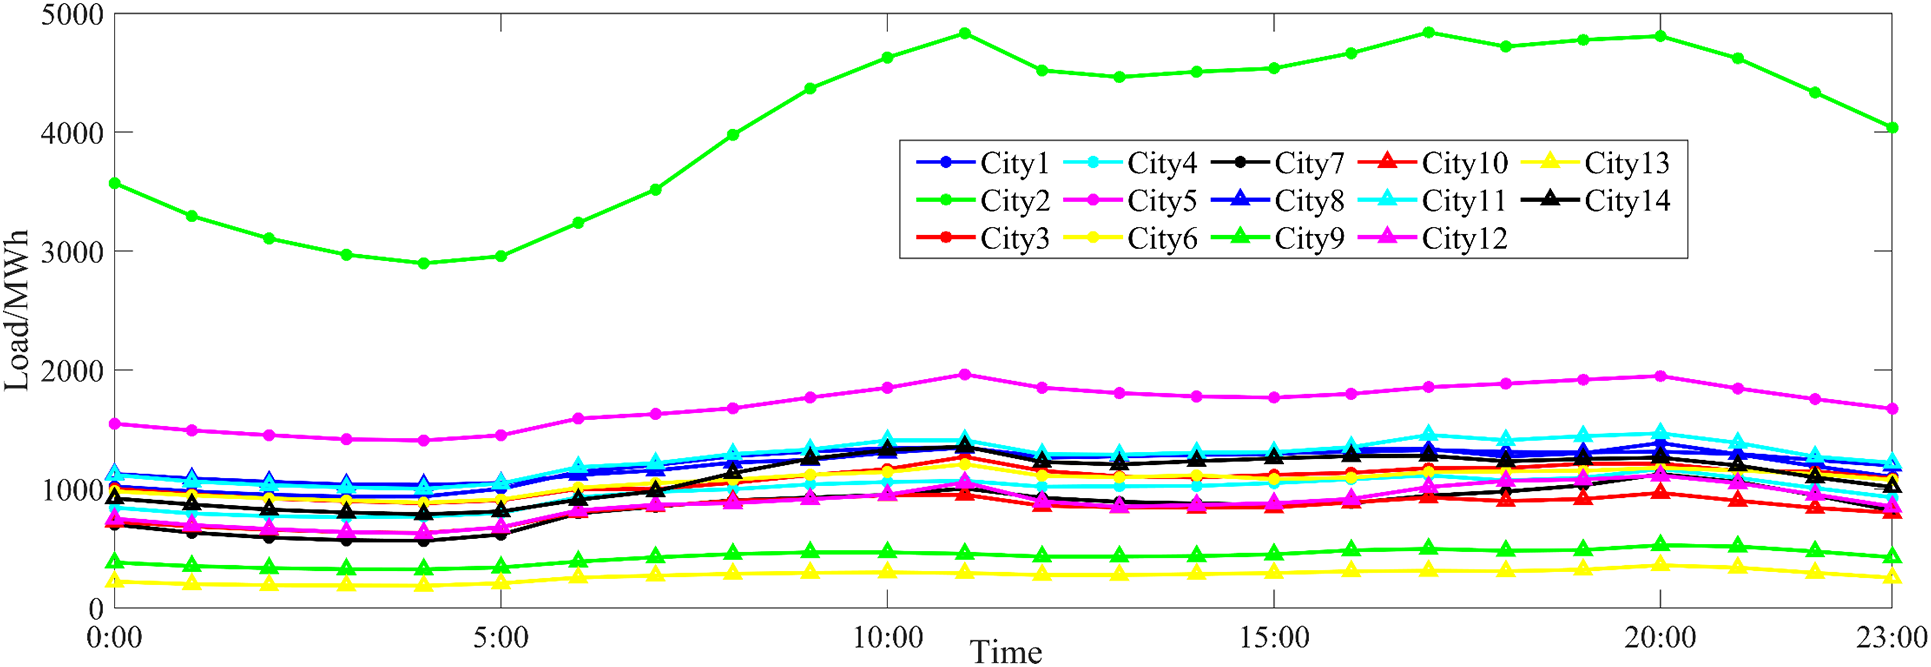
Figure 6: Realistic typical data of city’s electricity consumption
Four types of users are included on the user side, so the electricity consumption of the city is composed of the electricity consumption of the four types of users. It is necessary to fit the electricity consumption of various users in a city under the simulation conditions. In the case of a kind of wind power output, the electricity consumption of industrial users in city
where
The realistic typical electricity consumption of industrial users is shown in Fig. 5, and combined with the realistic data, the electricity consumption of industrial users under the simulation conditions in city
where
Under the simulation conditions, the electricity consumption of residential and agricultural users in city
where
The total electricity consumption in city
Under the simulation conditions, the sum of electricity consumption of electricity purchasing agent users and low-voltage users in city
Then according to the proportion of electricity consumption of the two, the respective electricity consumption in city
where
Under the simulation conditions, the electricity of various users at other times and in other cities is obtained according to the above method, as shown in Figs. 7a and 7b.
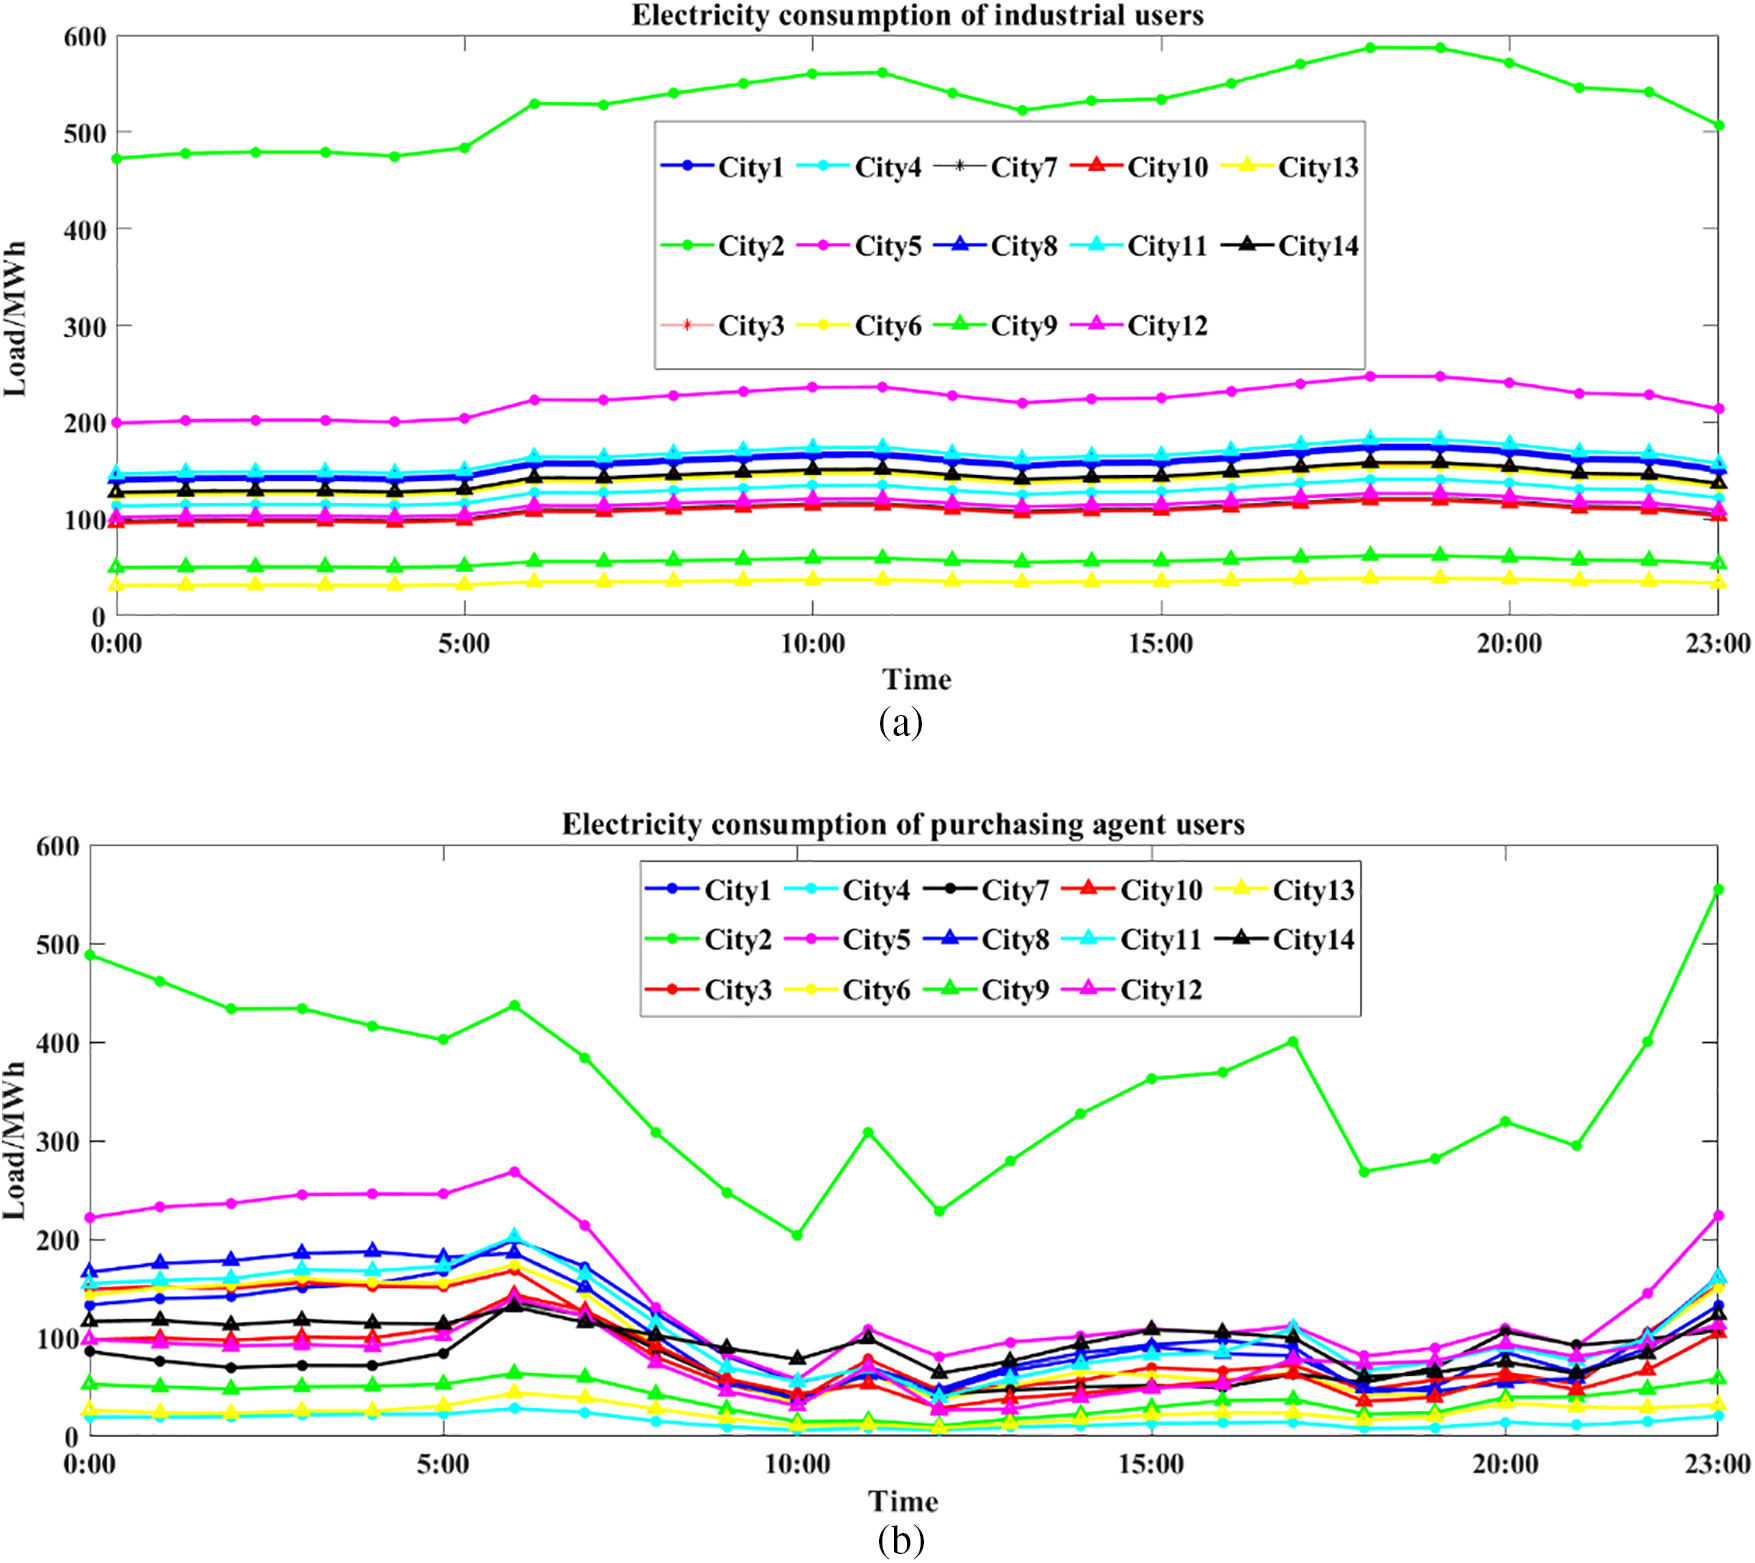
Figure 7: Simulating scenario of low percentage of wind power, and electricity consumption at all times in all cities; (a) Industrial users; (b) Electricity purchasing agent users
In the case of the other two proportions of wind power, the same calculation is carried out; and under the simulation conditions, the electricity consumption of the four types of users in each city can be obtained, as shown in Figs. 8 and 9 below. Due to the space limitations, only two types of user power are selected for display in each case.
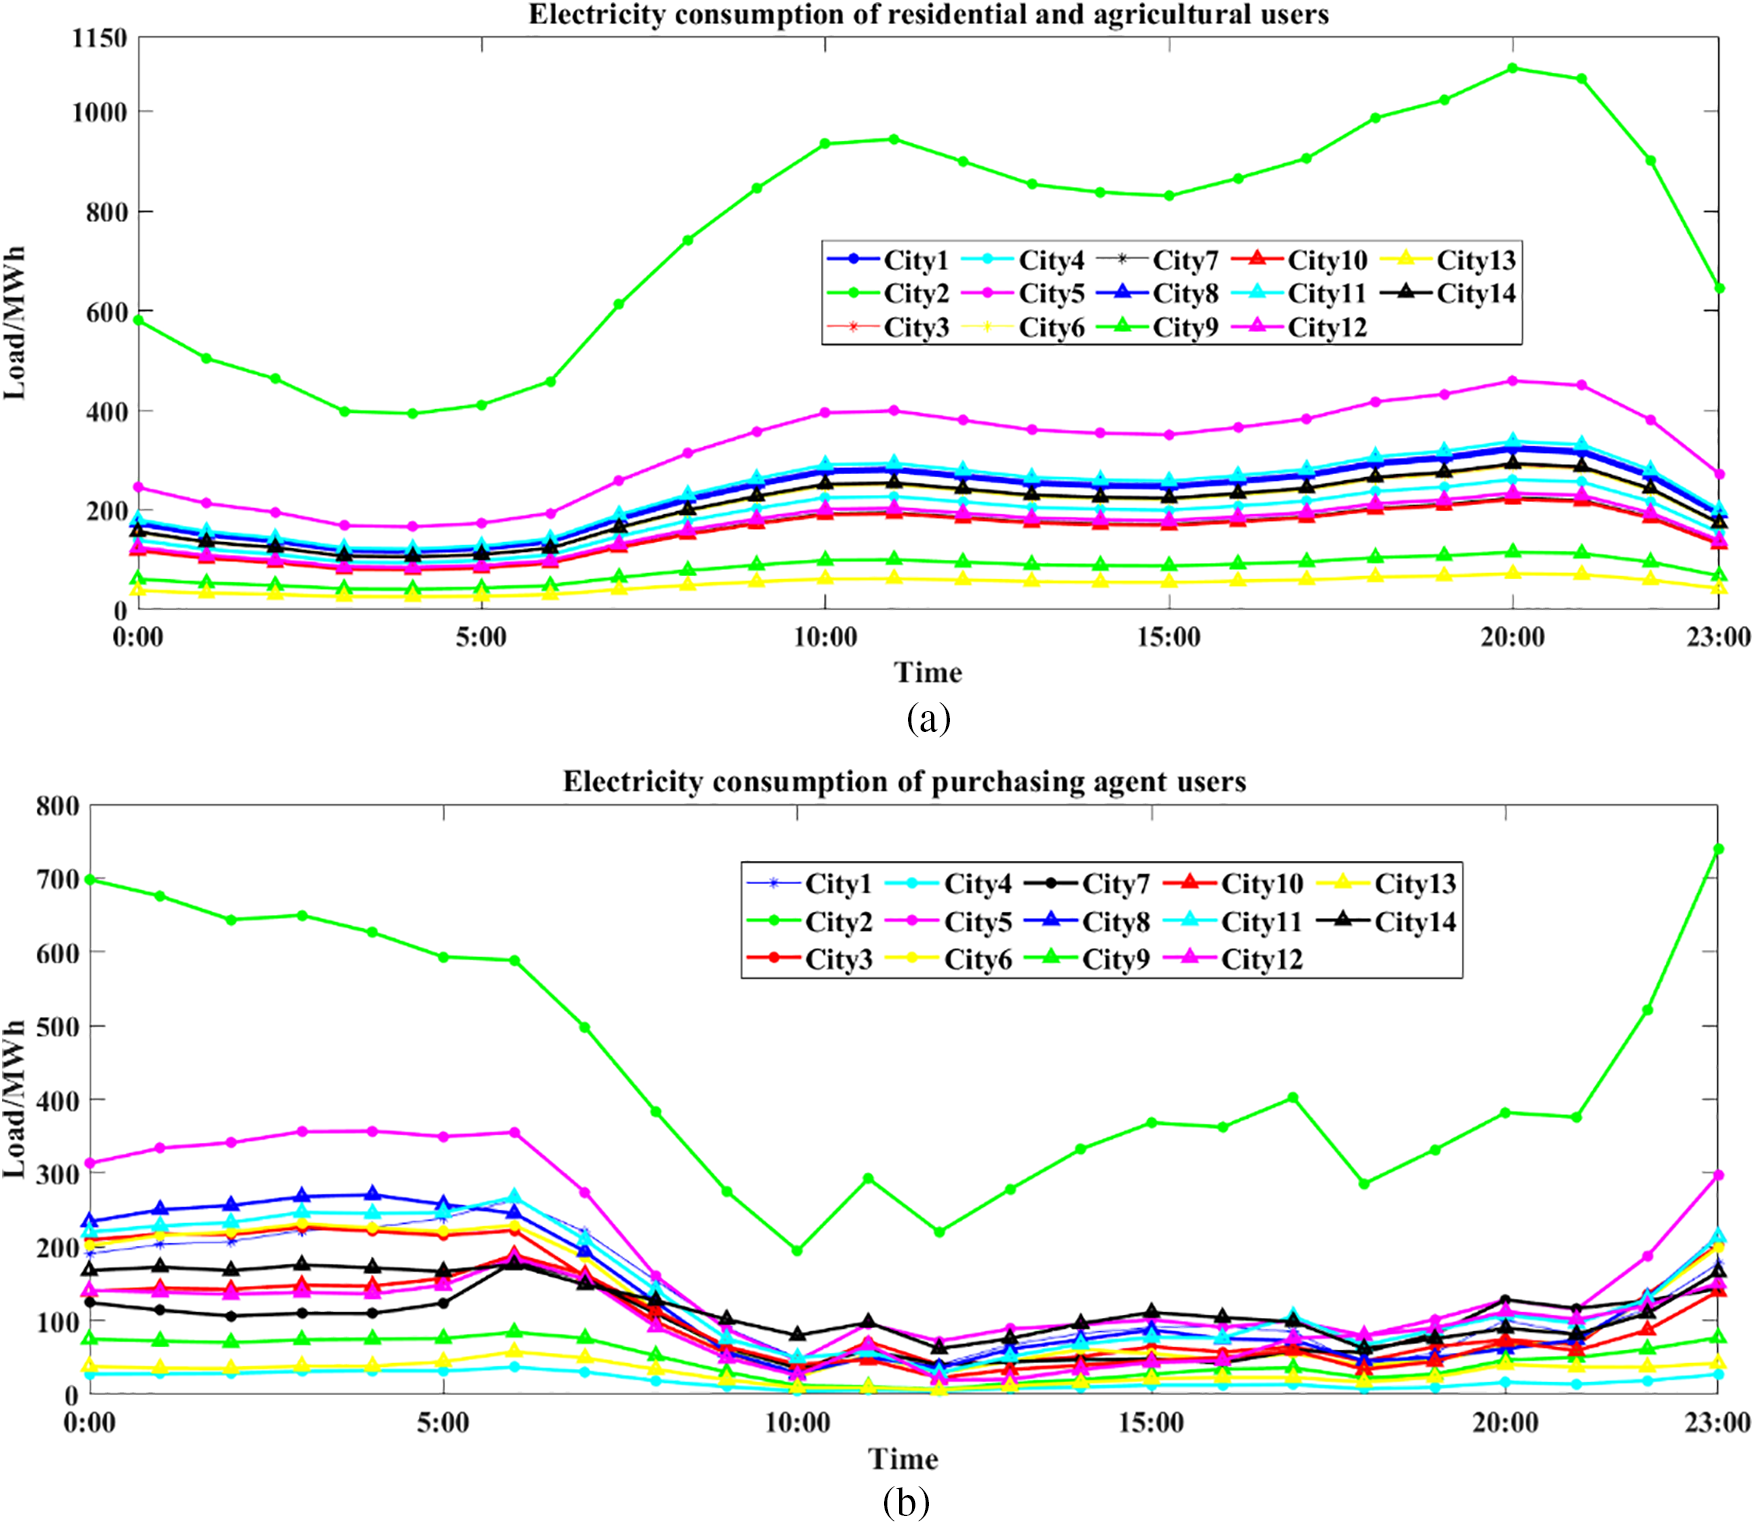
Figure 8: Simulating scenario of middle percentage of wind power, and electricity consumption at all times in all cities; (a) Residential and agricultural users; (b) Electricity purchasing agent users
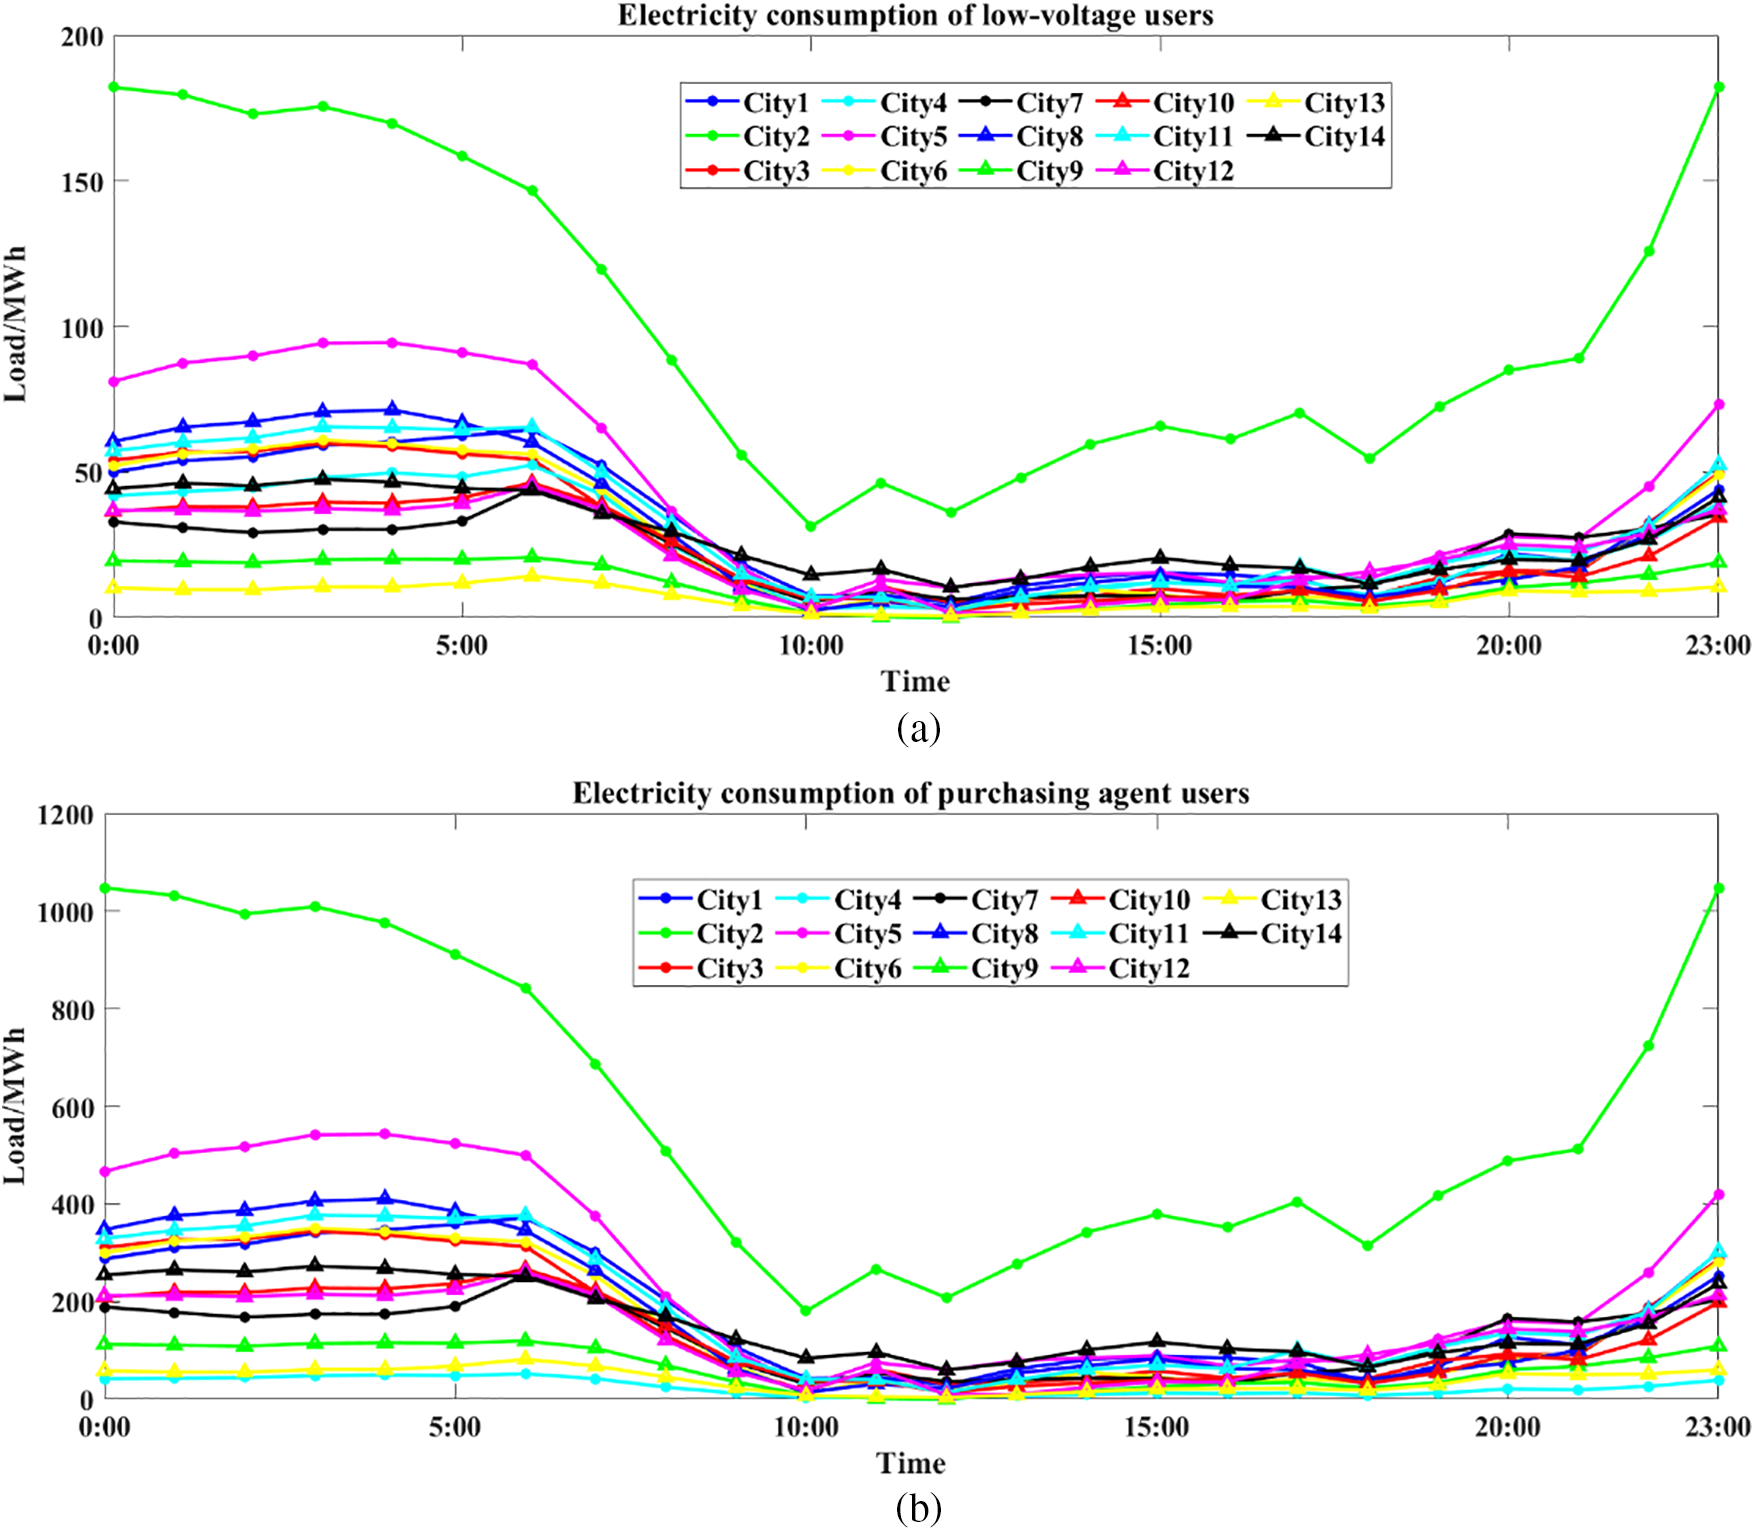
Figure 9: Simulating scenario of high percentage of wind power, and electricity consumption at all times in all cities; (a) Low-voltage users; (b) Electricity purchasing agent users
Industrial users, electricity purchasing agent users, and low-voltage users are market-oriented users, so mid- and long-term contracts need to be signed with them. It is necessary to divide peaks, flats, and valleys, with peak segments being 11:00–14:00 and 18:00–23:00; flat segments being 07:00–11:00 and 14:00–18:00; and valley segments being 23:00–07:00.
Under the simulation conditions, the mid-and-long term contractual electricity of industrial users in city
where
It should be noted that at all moments in the peak period, the contractual electricity is the same value. Under the simulation conditions, the contractual electricity consumption of other periods, other cities, and other market-oriented users are obtained using the above formula.
During the case of the low percentage of wind power, curves of various types of users’ contractual electricity under the simulation conditions are shown in Figs. 10a–10c.
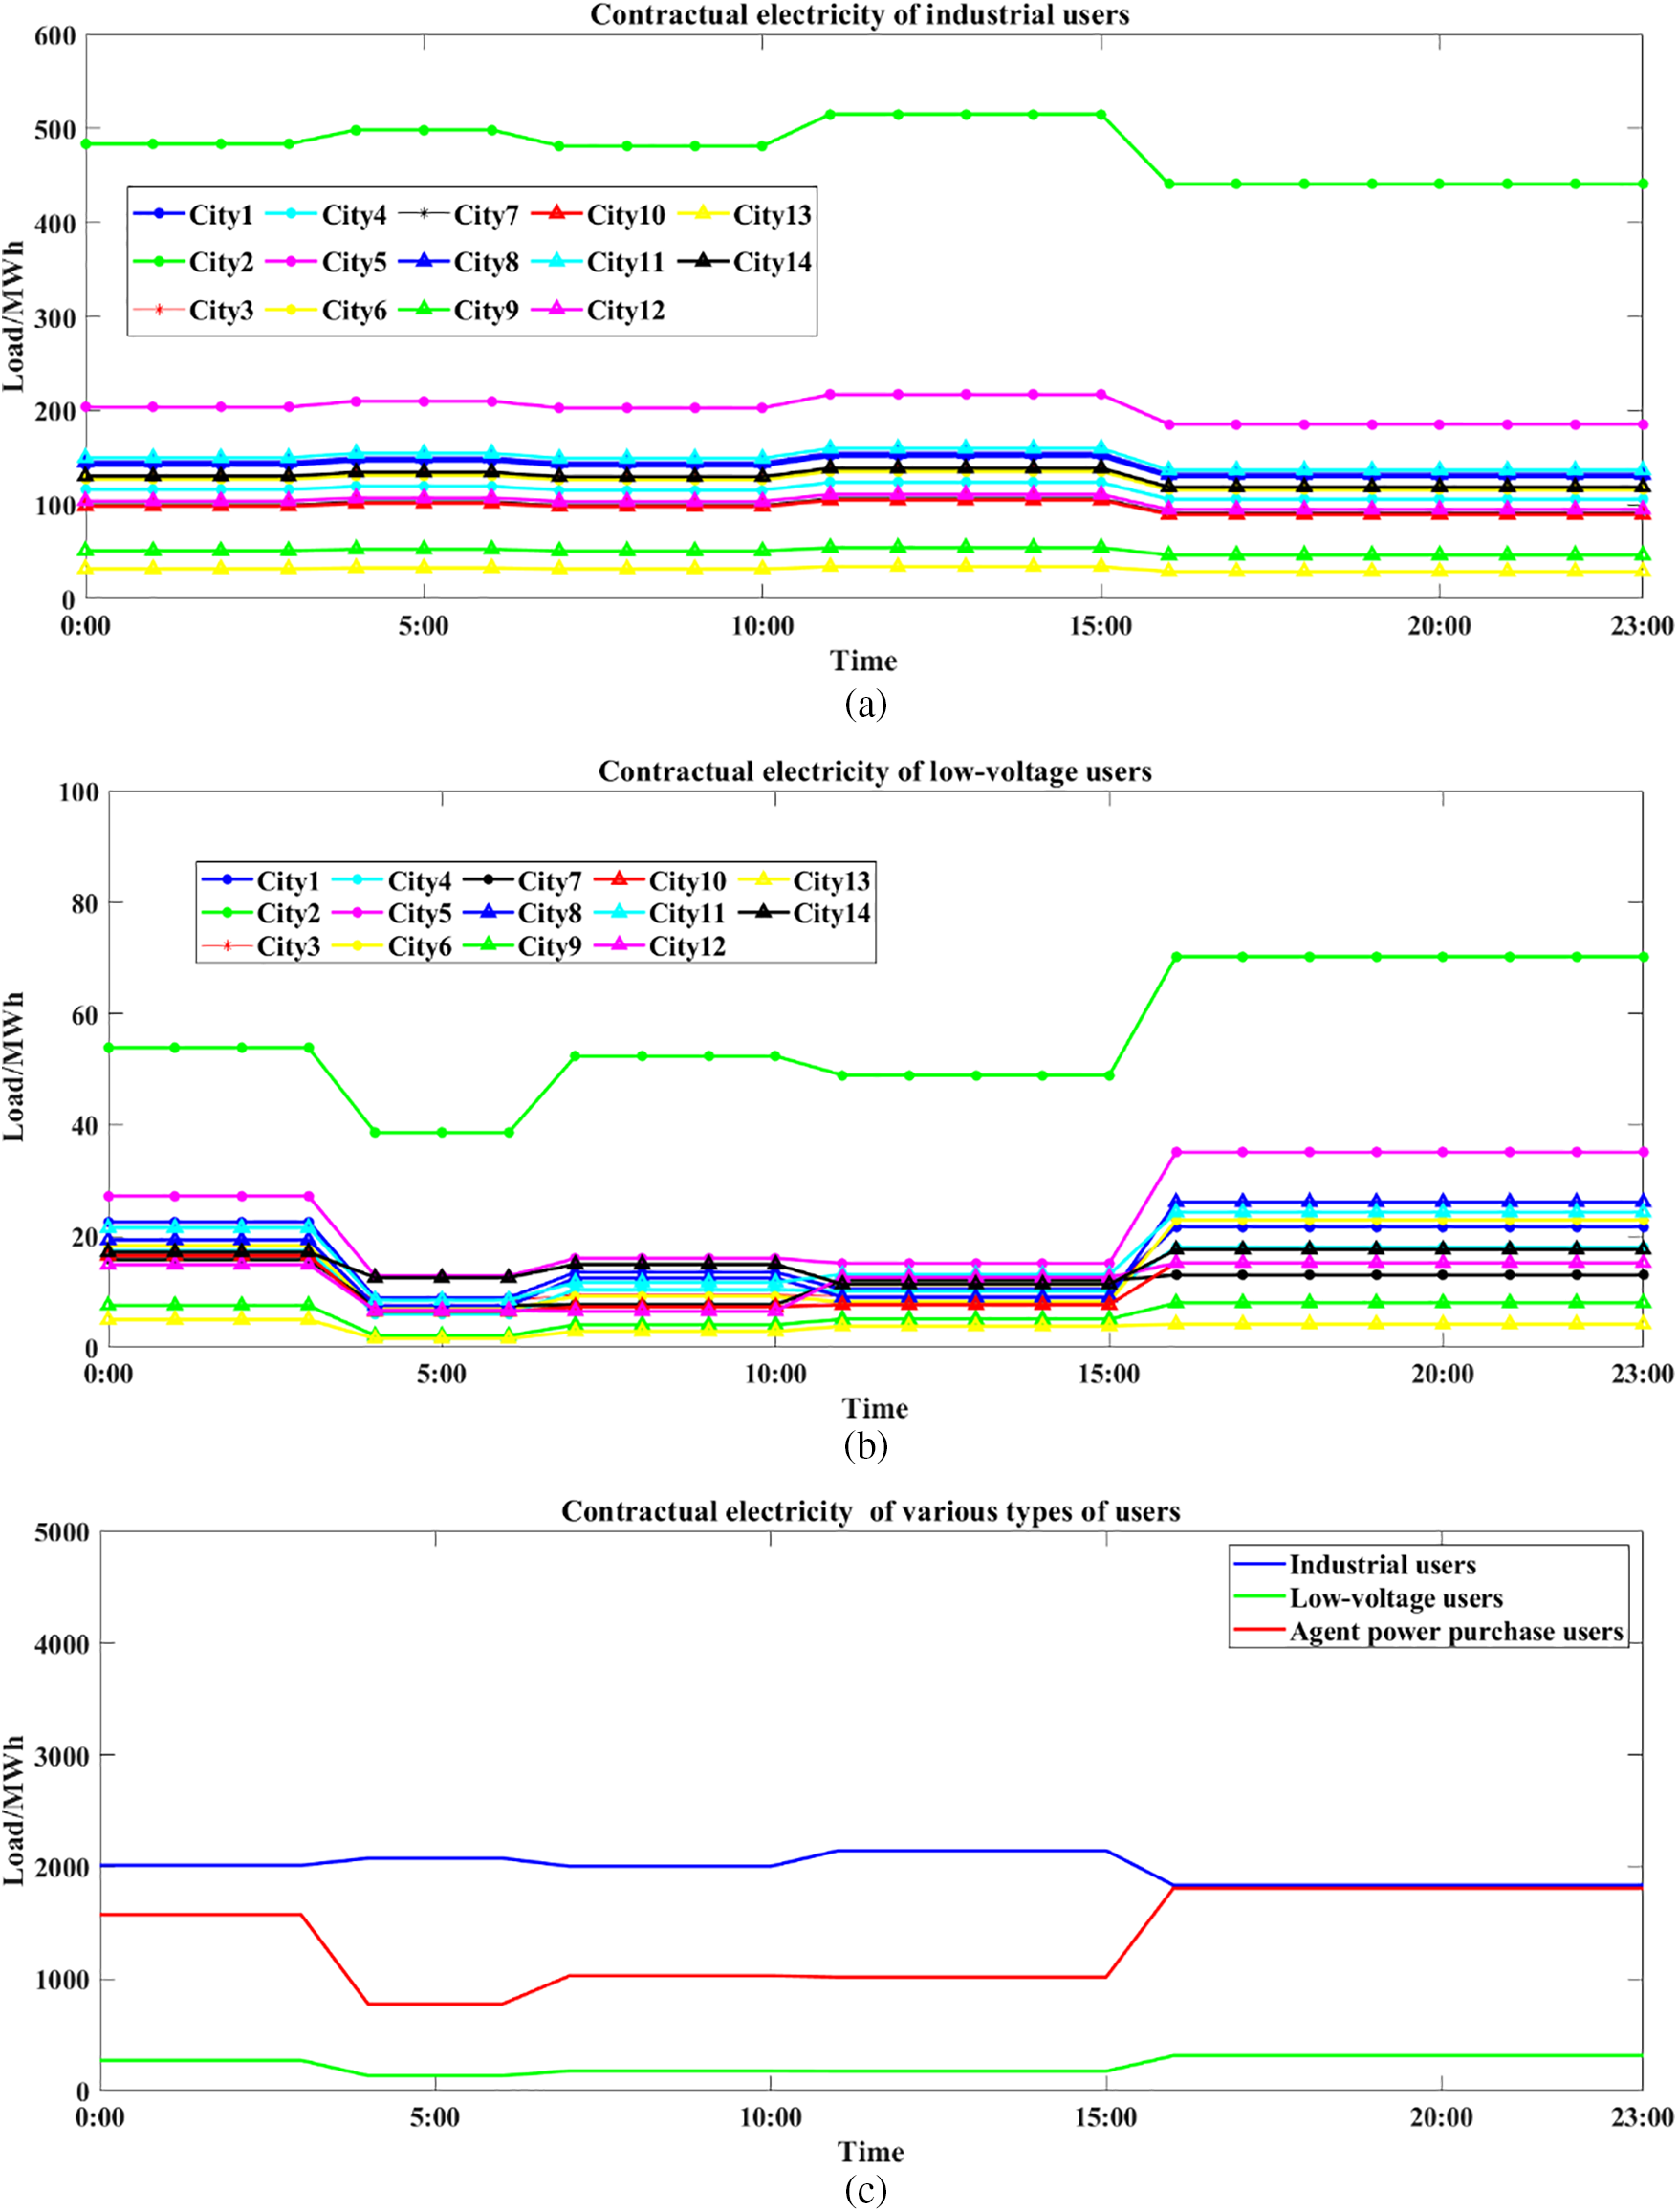
Figure 10: Simulating scenario of low percentage of wind power, contractual electricity of various types of users at all times in all cities; (a) Industrial users in different cities; (b) Low-voltage users in different cities; (c) Contractual electricity in the whole province
Thermal power units are market-oriented units, and mid- and long-term contracts need to be signed with them. In the simulation, the value of mid- and long-term contractual electricity needs to be calculated.
Under the simulation conditions, the value of contractual electricity on user side at time
where
According to the ratio of the installed capacity of the thermal power unit, the contractual electricity of thermal power unit
where
The IEEE 39-bus system is used for simulation, and four thermal units and four wind turbine clusters are set up on the generation side. The basic characteristics of the computations are listed in Table 1. The ratio of the realistic installed capacity of a province to the installed capacity in the simulation setting is 10, and the original realistic data needs to be divided by this ratio as the boundary condition of the simulation.

4.2 Results of Simulation and Calculation of Unbalanced Funds
This paper adopts Matlab 2018A software to construct a direct current power flow clearing model aimed at maximizing social welfare. The model is a mixed integer linear programming model. Various constraints are constructed using the Yalmip toolbox in Matlab, and Gurobi is utilized for solving. The simulation is conducted on a personal computer with a 2.6 GHz processor and 16 GB RAM.
Due to the limited space, the case of high proportional wind power is selected to present the clearing results, and results of day-ahead clearing and real-time clearing (including electricity generation of each unit, nodal prices on the generation side, and user side) are shown in Figs. 11–14. Unbalanced funds are calculated according to clearing results and formulations. Clearing of the day-ahead market is the full electricity clearing considering deviation of load forecast while clearing of the real-time market is the further clearing without deviation.
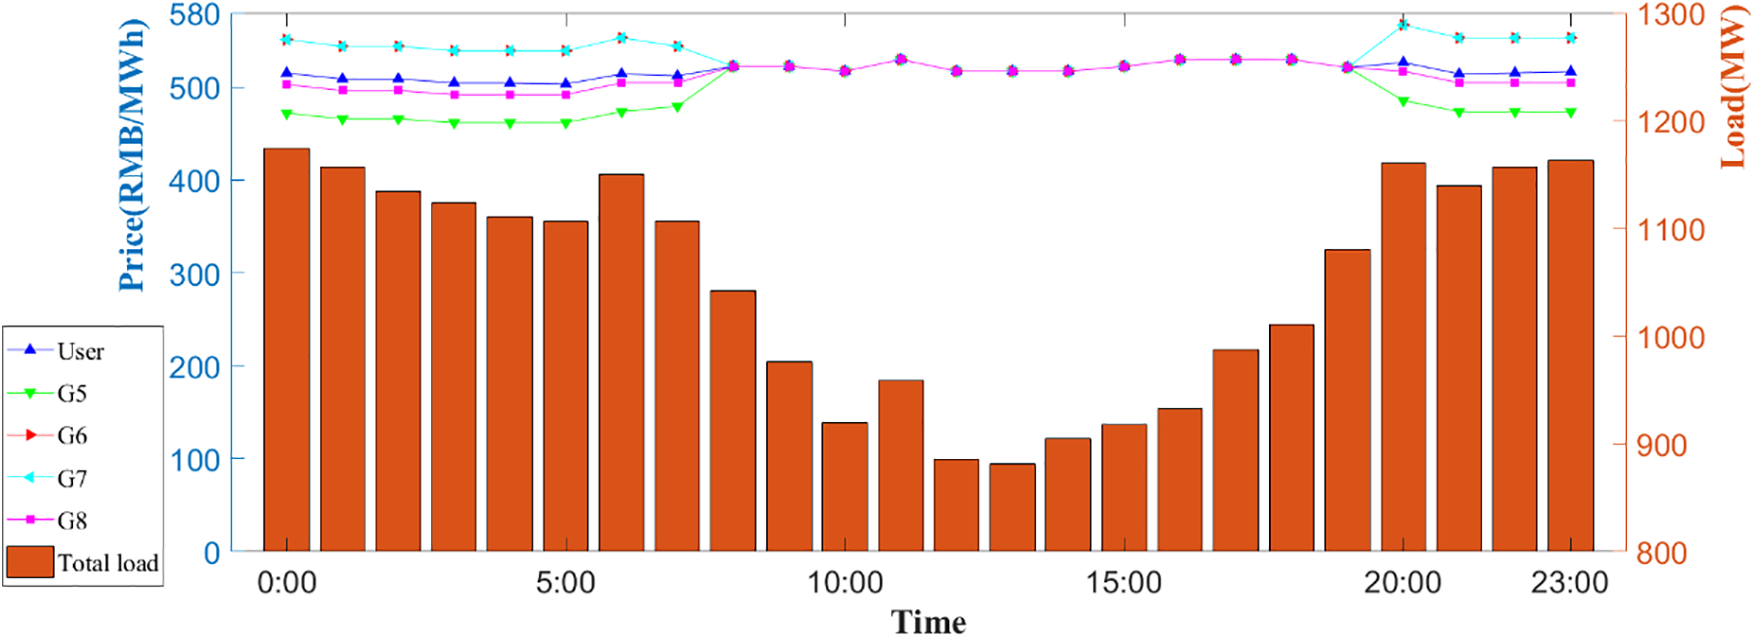
Figure 11: Simulating scenario of the low percentage of wind power,day-ahead nodal prices, and user-side load
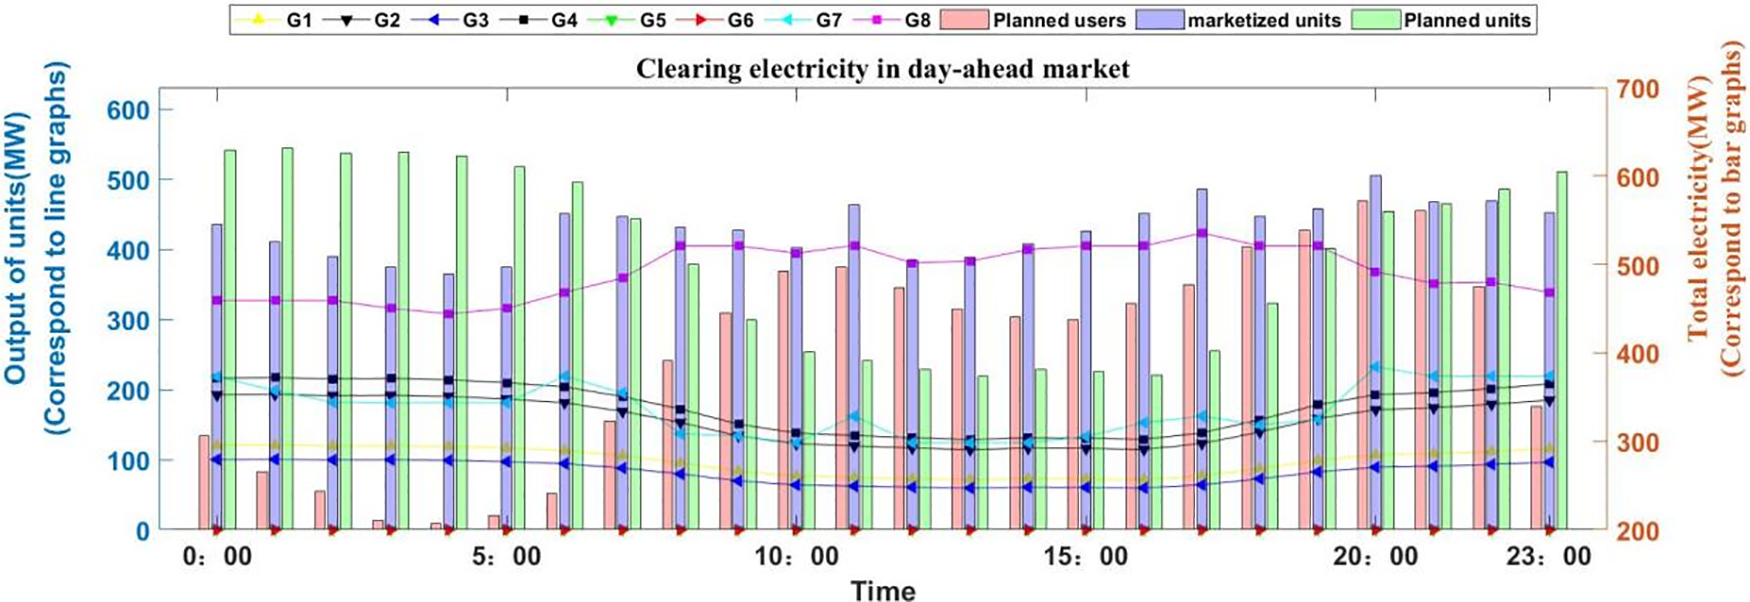
Figure 12: Simulating scenario of low percentage of wind power, day-ahead clearing electricity, and electricity consumption of non-market-oriented users
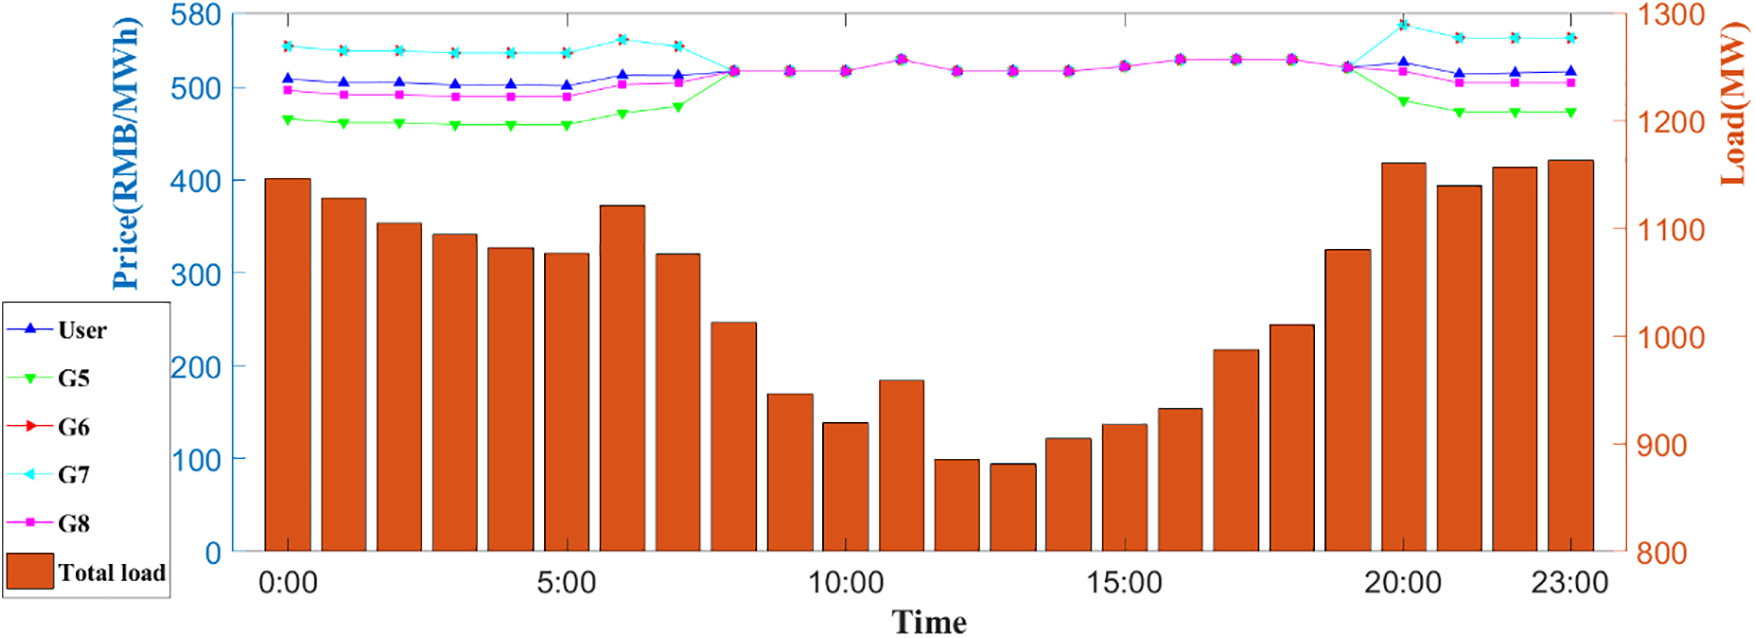
Figure 13: Simulating scenario of the low percentage of wind power, real-time nodal prices, and user-side load
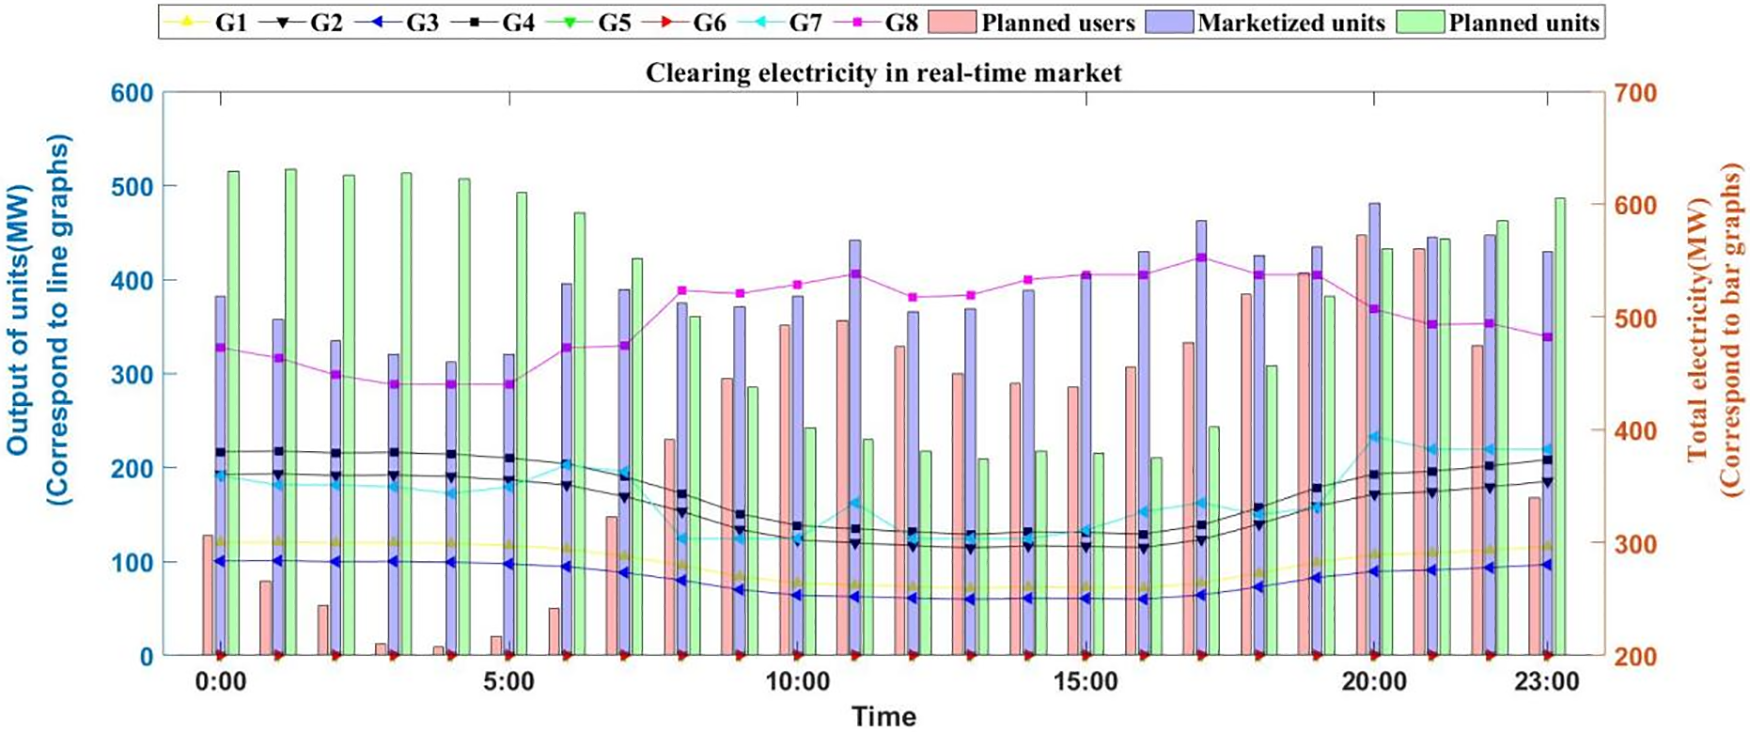
Figure 14: Simulating scenario of low percentage of wind power, real-time clearing electricity, and electricity consumption of non-market-oriented users
In the case study of this paper, only in the scenario with a high proportion of wind power, the load on the user side is high., the amount of electricity generated by power generation units may exceed the transmission capacity of the lines, leading to different electricity prices at various nodes. so only in this case, there is line congestion, which causes the differences in nodal prices.
Considering the safety constraints of generation units, thermal units G5 and G6 are not switched on, and electricity generation of thermal units G7 and G8 and wind turbines is shown in the figures above.
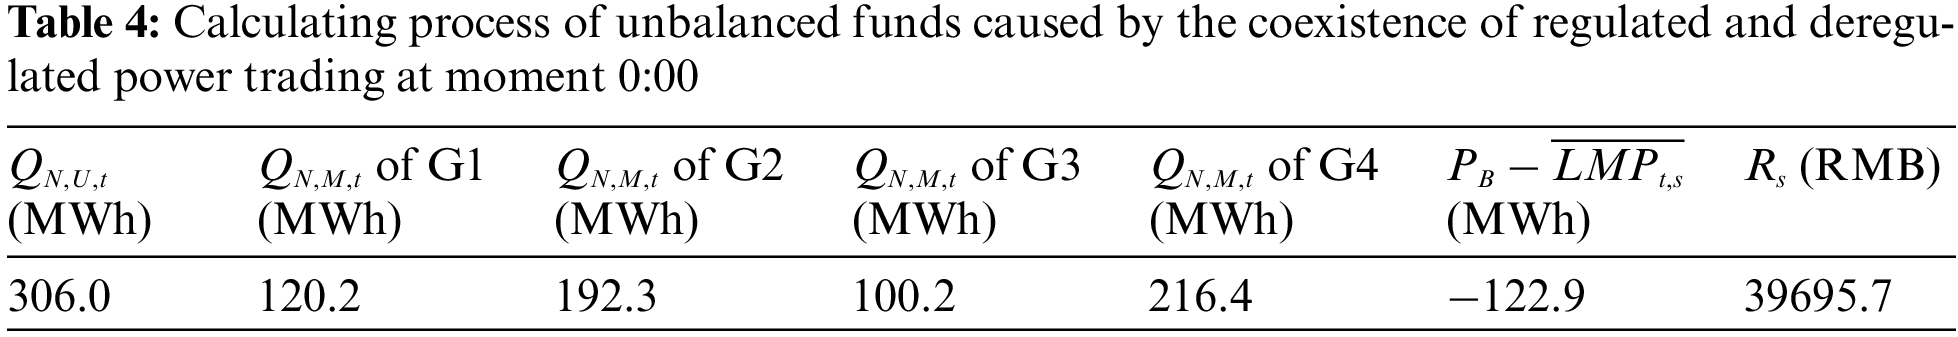
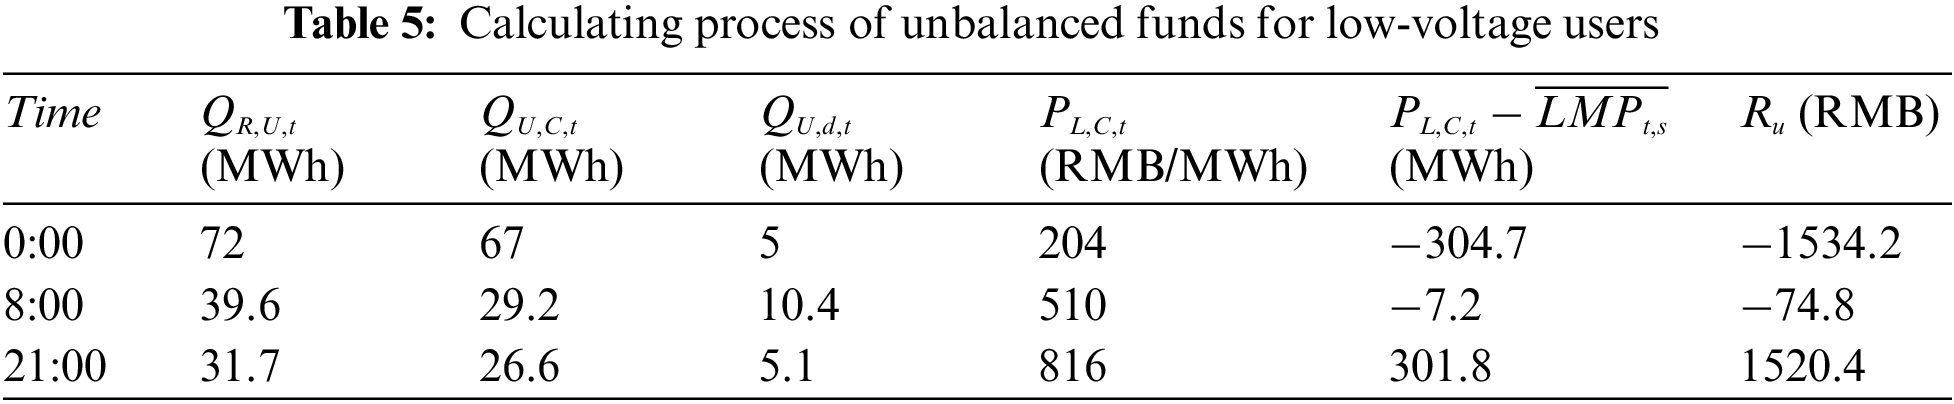
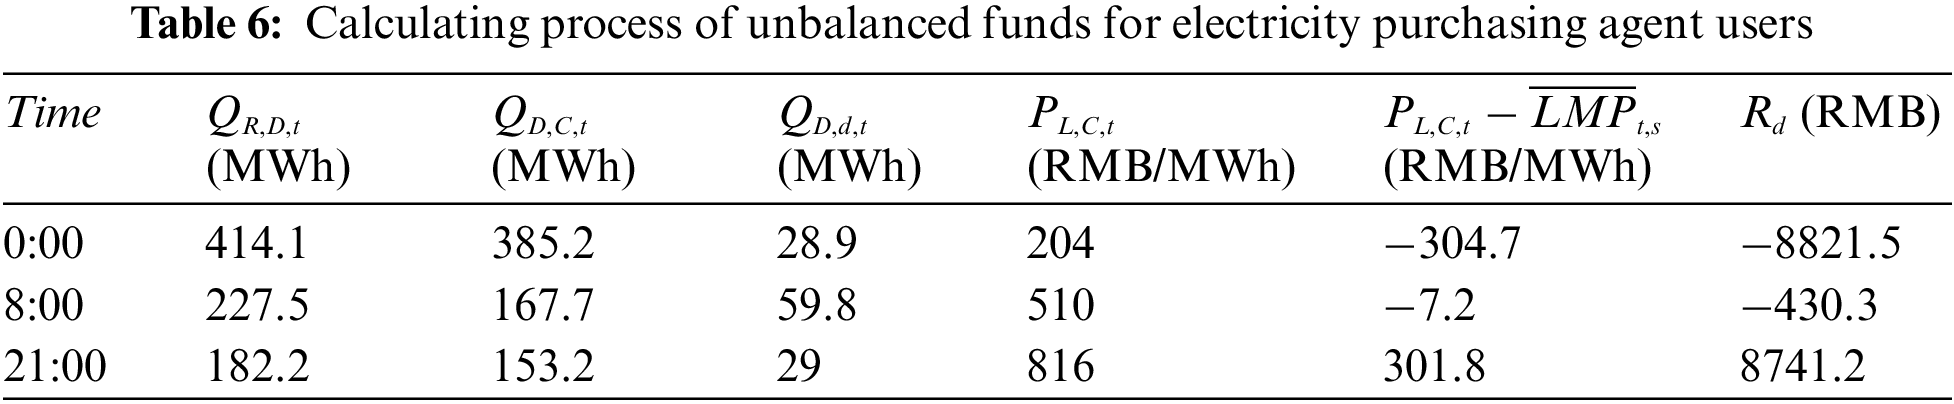
By combining generation in markets, and day-ahead and real-time nodal prices in Figs. 11 and 14, calculating processes are performed. The calculating processes at 0:00 moment are shown in Tables 2–4, as processes with three moments are shown in Tables 5 and 6.


In the calculation of congestion-unbalanced funds:
In the calculation of unbalanced funds between generation and consumption:
In the calculation of unbalanced funds caused by the coexistence of regulated and deregulated power trading: Non-market-oriented users’ electricity consumption is residential and agricultural users’ electricity consumption, and electricity generation of non-market-oriented units (wind turbines) is shown in Fig. 14; the benchmarking price is taken as 385.8 RMB/MWh, and real-time unified nodal prices are shown in Fig. 13.
In the calculation of unbalanced funds for low-voltage users: The variational electricity is equal to the difference between real-time electricity consumption and contractual electricity, and contractual prices are taken as 204 RMB/MWh for the 23:00–07:00 valley sections; 510 RMB/MWh for the 07:00–11:00 and 14:00–18:00 flat sections; 816 RMB/MWh for the 11:00–14:00 and 18:00–23:00 peak sections; and real-time unified nodal prices are shown in Fig. 13.
In the calculation of unbalanced funds for electricity purchasing agent users: The variational electricity is defined the same as that of low-voltage users; contractual prices and real-time unified nodal prices are the same as that in the previous text.
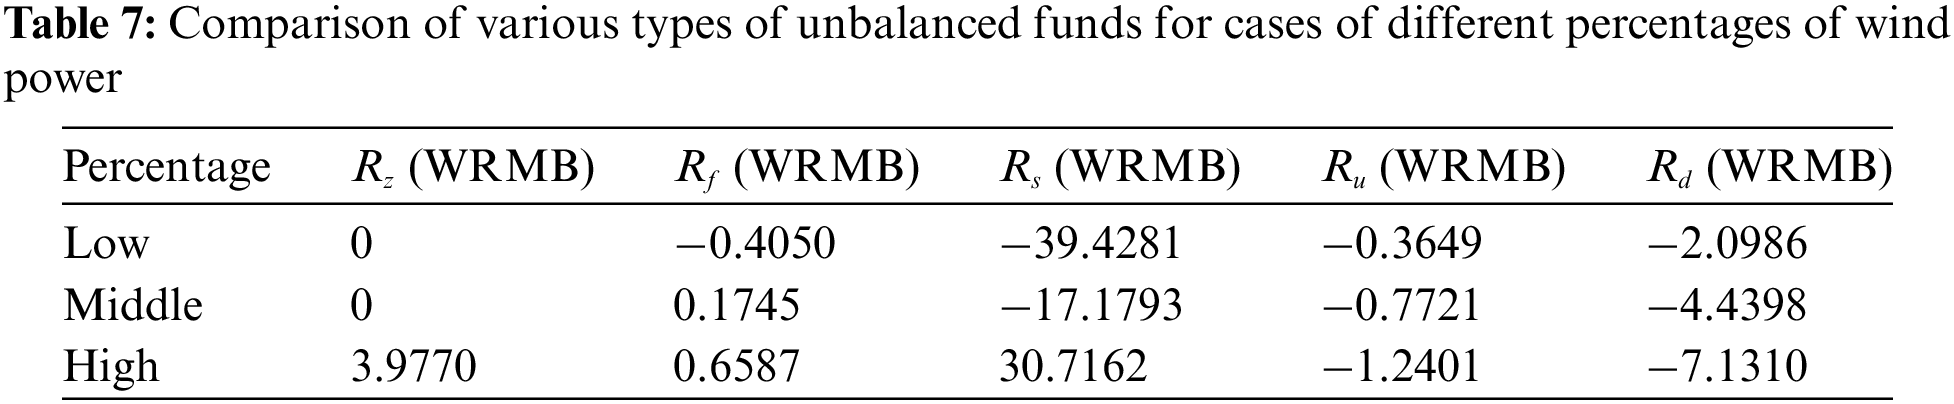
Finally, various types of unbalanced funds throughout the day for different percentages of wind power are shown in Table 7.
In the case of low proportional wind power, the overall load on the user side is the smallest, and thermal units’ cleared segments are at least, which results in the lowest nodal prices. In cases of middle and high proportional wind power, as the overall load on the user side increases, outputs and the cleared segments of thermal units are increased accordingly, which leads to a greater increase in nodal prices. In the case of high-proportional wind power, the electricity generation of wind turbines has increased greatly, and the electricity consumption of non-market-oriented users is exceeded by the electricity generation of non-market-oriented units in that case. The electricity generation of wind turbines is the boundary condition for market clearing. Under the condition of satisfying the system power flow, the number of cleared segments of G8 as a marginal unit is less than that in the period of middle proportion, and the value of nodal price, in this case, is in the middle.
In the case of low proportional wind power, among all the types of unbalanced funds, the most important is unbalanced funds caused by the coexistence of regulated and deregulated power trading. Under the trading mode, the mismatch between non-marketized electricity generation and non-marketized electricity consumption is the main cause of unbalanced funds, while the mismatch is large, respectively; and there is a significant difference between benchmarking price and nodal prices, while the value of benchmarking price is taken as ¥385.8/MWh, which is lower than nodal prices in all periods. For unbalanced funds caused by the coexistence of regulated and deregulated power trading, positive and negative signs are the same at all periods, so there is no positive or negative offset in the accumulated total value of the whole day. In the case of low proportional wind power, unbalanced funds caused by the trading mechanism are negative, while non-market-oriented units’ generation is smaller than non-market-oriented users’ electricity consumption; and the size of them is the max among three cases, while non-market-oriented generation is too small, which results to deviation between non-market-oriented generation and consumption be the largest.
There is a deviation between real-time electricity consumption and contractual electricity, which results in unbalanced funds for low-voltage users and electricity-purchasing agent users. These two types of users account for a small proportion of all users, and the deviation between contractual electricity and real-time electricity consumption is also small, so the value of these two types of unbalanced funds is relatively small. In addition, the shapes of realistic decomposed electricity curves adopted by the two users are the same; so, in the same case, the numerical ratio of unbalanced funds of the two types of users is equal to the ratio of electricity consumption of them. Total contractual electricity is 90% of total real-time electricity consumption, so the variational electricity is positive at most times; however, contractual prices are lower than real-time unified nodal prices at most times, which results in negative deviation of prices, and overall negative values of the two types of unbalanced funds. Considering the total load of users, values of the two types of unbalanced funds in the case of low proportional wind power are the smallest in the three cases.
Electricity is settled according to the amount of day-ahead clearing on the generation side, while industrial users’ electricity is settled according to the amount declared by themselves in the day-ahead market on the user side, this is the reason for unbalanced funds between generation and consumption. Electricity generation of non-market-oriented units is the least in the case of the low proportion of wind power among three cases, and non-marketized electricity generation is less than non-marketized electricity consumption in the day-ahead market, which leads to the sum of industrial users’ day-ahead declared electricity consumption and contractual electricity of electricity purchasing agent users and low-voltage users (roughly equal to market-oriented users’ day-ahead electricity consumption) being less than market-oriented units’ day-ahead electricity generation. Due to the positive variational electricity in the day-ahead market, overall day-ahead nodal prices are higher than overall real-time nodal prices, which leads to unbalanced funds between electricity generation and consumption are negative in the case. In this case, the difference between non-marketized electricity generation and consumption is in the middle of the three cases, which results in the centered size of funds in the three cases too.
In the case of middle proportional wind power, among the five types of unbalanced funds, the one with the largest value is the unbalanced funds caused by the coexistence of regulated and deregulated power trading, for the same reason as above. The amount of non-marketized electricity generation is smaller than that of non-marketized electricity consumption, and non-marketized generation increases compared with low proportional wind power, and the difference between non-marketized generation and residential and agricultural users’ electricity consumption has narrowed considerably, which leads to the negative value of the unbalanced funds caused by the coexistence of regulated and deregulated power trading, and the value of it is the smallest in the three cases. Overall load on the user side is in the middle in the three cases, so the values of unbalanced funds for electricity purchasing agent users and for low-voltage users are also centered in the three cases, with the same proportional relationship as described above. In the case, of the increasing electricity generation of wind turbines, non-marketized electricity generation is larger than non-marketized electricity consumption in the day-ahead market; and combined with the electricity fluctuation caused by the user-side predicted deviation, the value of unbalanced funds between generation and consumption is positive. Non-marketized electricity generation gets increased, and the difference between non-marketized generation and consumption gets reduced accordingly, which leads to the value of unbalanced funds between generation and consumption in the case is the smallest of three cases.
In the case of high proportional wind power, among the five types of unbalanced funds, the largest value is the unbalanced funds caused by the coexistence of regulated and deregulated power trading, for the same reason as above. In this case, electricity generation from wind turbines has increased greatly, and non-marketized electricity generation is larger than non-marketized electricity consumption, and the absolute value of deviation between non-marketized generation and consumption is in the middle; so, the value of unbalanced funds caused by the coexistence of regulated and deregulated power trading is in the middle in three cases, and value of it is positive. Overall load on the user side is the highest in three cases, so the values of unbalanced funds for electricity purchasing agent users and for low-voltage users are also the highest in three cases, with the same proportional relationship as described above. Marketized electricity generation is smaller than marketized electricity consumption in the day-ahead market in this case. In formula calculation, industrial users’ day-ahead declared electricity is larger than the second part of the formula; and combined with that day-ahead nodal prices are generally higher than real-time nodal prices in simulation, unbalanced funds between generation and consumption are positive in the case. Due to the size of the deviation between non-marketized generation and consumption, the absolute value of unbalanced funds between generation and consumption becomes the largest in the three cases.
There are differences among nodal prices due to the limitation of power flow, which leads to unbalanced funds between the generating and consuming parties, called congestion-unbalanced funds. In the article, only in the case of high proportional wind power, upper limitations of flow on branches associated with wind turbines are set; so only in the case of high proportional wind power, there are congestion-unbalanced funds. Nodal prices of nodes where units are located are different from the unified nodal price. Due to obstruction, most times, the nodal price where the market-oriented unit is located is larger than the unified nodal price, and contractual electricity and day-ahead cleared electricity of market-oriented units are both larger than the sum of contractual electricity of electricity purchasing agent users and low-voltage users. Therefore, the value of congestion-unbalanced funds is positive.
To address the issue of unbalanced funds, various trial provinces have attempted to adjust the actual settlement of prioritized electricity generation based on the curve of electricity consumption of non-market-oriented users during the settlement process, aiming to avoid the generation of unbalanced funds. However, this method places the risk of load forecasting on market-oriented units and cannot be implemented in the long term. The National Development and Reform Commission has explicitly stated that each type of unbalanced funds must be independently recorded and categorized for clear guidance. In this context, accurately calculating the scale of various unbalanced funds and specifying the entities responsible for their allocation is crucial for resolving the issue of unbalanced funds.
Based on the settlement methods of various types of users participating in the electricity spot market, the process of generating unbalanced funds at each settlement moment from the perspectives of electricity quantity and prices is conducted, and final calculating formulas are proposed, with clearly defined elements required for the formulas. Both the actual market clearing data of users can be directly incorporated into the calculation, offering a new approach to determining the scale of unbalanced funds and identifying the entities responsible for their allocation. The calculating method proposed in this paper helps determine the scale of various unbalanced funds and identify the entities responsible for their allocation based on the actual market clearing data available. This allows for adjustments to reduce the scale of unbalanced funds in the next settlement period, ensuring the safe and stable operation of the market and the interests of all market participants. The study contributes to addressing the issue of unbalanced funds to some extent.
However, the calculating method proposed in this paper has some limitations. The DC power flow clearing model used in this study requires boundary conditions to be determined, and the bidding strategy of power generation entities directly adopts empirical values from the real market. It does not utilize a two-tier model to simulate the bidding behavior of market participants, the generators are unable to adjust their bidding strategies autonomously.
With the increasing scale of generation of renewable energy sources and gradual advancement of time-of-use electricity prices, large scales of unbalanced funds are caused due to the mismatch between non-marketized generation and consumption. To understand and solve the problem of unbalanced funds in China’s electricity market, simulation analyses are conducted to dissect the generation of unbalanced funds and the factors related to their size. The main findings and suggestions are summarized as follows:
• Independently specifying the definition of unbalanced funds, studying the calculating method, exploring the influence on both generators and users and stipulating the rights and obligations of the main subjects of the market are important.
• The participation of renewable energy electricity in the market can further reduce the prioritized generation, and the scale of unbalanced funds will be reduced in turn, and the reasonable and orderly development of the market will be promoted.
• Among all types of unbalanced funds, the proportion of unbalanced funds caused by the coexistence of regulated and deregulated power trading is the largest and far exceeds others, mainly because there is a significant mismatch between the curves of prioritized electricity generation and prioritized electricity consumption at different periods, resulting in a large cumulative value throughout the day.
• The scale of unbalanced funds directly caused by electricity purchasing agent users is positively correlated with the number of such users, similar to low-voltage users. Both types of users have relatively small numbers, resulting in correspondingly small scales of unbalanced funds. Additionally, the proportion of unbalanced funds from these two types of users is equal to the ratio of the numbers of the two types of users.
• When the load on the user side is high, the amount of electricity generated by power generation units may exceed the transmission capacity of the lines, leading to line congestion and the generation of congestion-unbalanced funds, and the scale of such funds is second only to the unbalanced funds caused by the coexistence of regulated and deregulated power trading. However, when the load on the user side is low and the flow does not exceed the lines’ limit, this type of unbalanced funds will not be generated.
• The unbalanced funds between generation and consumption are associated with the forecasted declared electricity volume of industrial and commercial users in the day-ahead market. The accuracy of the forecasts used in the article is relatively high, resulting in a very small scale of such unbalanced funds. The scale of these unbalanced funds fluctuates significantly, posing high demands on load forecasting for industrial and commercial users.
Currently, residential and agricultural users and large numbers of renewable energy units still do not participate in the provincial electricity markets of China. To reduce the risk of unbalanced funds, it is important to improve the safeguarding mechanism of renewable energy, as the mechanism should be shifted from a traditional planning model to the model of “market competition and extra-market subsidies”; at the same time, sustainable development and orderly competition of renewable energy industry will be promoted through the measures.
Acknowledgement: None.
Funding Statement: This paper is supported by the National Natural Science Foundation of China (No. 52207104) and China Postdoctoral Science Foundation (No. 2022M711202).
Author Contributions: Methodology, Investigation, Formal analysis, Data curation: Yirui Li; Writing–review & editing, Conceptualization: Haoyong Chen & Dongliang Xiao; Supervision, Investigation: Weijun Cai & Josue Campos do Prado.
Availability of Data and Materials: Data will be made available on reasonable request.
Conflicts of Interest: The authors declare that they have no conflicts of interest to report regarding the present study.
References
1. M. Shatat, M. Worall, and S. Riffat, “Opportunities for solar water desalination worldwide,” Sustain. Cities. Soc., vol. 9, pp. 67–80, Dec. 2013. doi: 10.1016/j.scs.2013.03.004 [Google Scholar] [CrossRef]
2. V. Mishra and A. Sadhu, “Towards the effect of climate change in structural loads of urban infrastructure: A review,” Sustain. Cities. Soc., vol. 89, pp. 104352, Dec. 2022. doi: 10.1016/j.scs.2022.104352. [Google Scholar] [CrossRef]
3. A. Sharif, O. Baris-Tuzemen, G. Uzuner, I. Ozturk, and A. Sinha, “Revisiting the role of renewable and non-renewable energy consumption on Turkey’s ecological footprint: Evidence from Quantile ARDL approach,” Sustain. Cities. Soc., vol. 57, pp. 102138, Jun. 2020. doi: 10.1016/j.scs.2020.102138. [Google Scholar] [CrossRef]
4. T. Ahmad, H. C. Zhang, and B. Yan, “A review on renewable energy and electricity requirement forecasting models for smart grid and buildings,” Sustain. Cities. Soc., vol. 55, pp. 102052, Apr. 2020. doi: 10.1016/j.scs.2020.102052. [Google Scholar] [CrossRef]
5. F. C. Robert, G. S. Sisodia, and S. Gopalan, “A critical review on the utilization of storage and demand response for the implementation of renewable energy microgrids,” Sustain. Cities. Soc., vol. 40, pp. 735–745, Jul. 2018. doi: 10.1016/j.scs.2018.04.008. [Google Scholar] [CrossRef]
6. P. Arévalo, D. Benavides, J. Lata-García, and F. Jurado, “Energy control and size optimization of a hybrid system (photovoltaic-hidrokinetic) using various storage technologies,” Sustain. Cities. Soc., vol. 52, pp. 101773, Jan. 2020. doi: 10.1016/j.scs.2019.101773. [Google Scholar] [CrossRef]
7. Y. Y. Liang, B. Y. Yu, and L. Wang, “Costs and benefits of renewable energy development in China’s power industry,” Renew. Energy, vol. 131, pp. 700–712, Feb. 2019. doi: 10.1016/j.renene.2018.07.079. [Google Scholar] [CrossRef]
8. J. F. Zhang, A. Daniela, Y. J. Fang, A. Desmonda, and E. O. Antwi, “Review on China’s renewable energy and future projections,” Int. J. Smart Grid Clean Energy, vol. 7, no. 3, pp. 218–224, Jul. 2018. doi: 10.12720/sgce.7.3.218-224. [Google Scholar] [CrossRef]
9. S. F. Zhang, P. Andrews-Speed, and S. Li, “To what extent will China’s ongoing electricity market reforms assist the integration of renewable energy?” Energ Policy, vol. 114, pp. 165–172, Mar. 2018. doi: 10.1016/j.enpol.2017.12.002. [Google Scholar] [CrossRef]
10. C. T. Cheng et al., “Reform and renewables in China: The architecture of Yunnan’s hydropower dominated electricity market,” Renew. Sustain. Energy Rev., vol. 94, pp. 682–693, Oct. 2018. doi: 10.1016/j.rser.2018.06.033. [Google Scholar] [CrossRef]
11. D. B. Fang, C. Y. Zhao, and Q. Yu, “Government regulation of renewable energy generation and transmission in China’s electricity market,” Renew. Sustain. Energy Rev., vol. 93, pp. 775–793, Oct. 2018. doi: 10.1016/j.rser.2018.05.039. [Google Scholar] [CrossRef]
12. X. Fang, H. T. Cui, E. S. Du, F. X. Li, and C. Q.Kang, “Characteristics of locational uncertainty marginal price for correlated uncertainties of variable renewable generation and demands,” Appl. Energ., vol. 282, pp. 116064, Jan. 2021. doi: 10.1016/j.apenergy.2020.116064. [Google Scholar] [CrossRef]
13. H. X. Ye, Y. Y. Ge, M. Shahidehpour, and Z. Y. Li, “Uncertainty marginal price, transmission reserve, and day-ahead market clearing with robust unit commitment,” IEEE Trans. Power Syst., vol. 32, no. 3, pp. 1782–1795, May. 2017. doi: 10.1109/TPWRS.2016.2595621. [Google Scholar] [CrossRef]
14. C. A. Li, A. J. Svoboda, X. H. Guan, and H. Singh, “Revenue adequate bidding strategies in competitive electricity markets,” IEEE Trans. Power Syst., vol. 14, no. 2, pp. 492–497, May 1999. doi: 10.1109/59.761871. [Google Scholar] [CrossRef]
15. M. Milligan et al., “Wholesale electricity market design with increasing levels of renewable generation: Revenue sufficiency and long-term reliability,” Electr. J., vol. 29, no. 2, pp. 26–38, Mar. 2016. doi: 10.1016/j.tej.2016.02.005. [Google Scholar] [CrossRef]
16. S. A. Mozdawar, A. A. Foroud, and M. Amirahmadi, “Multiple electricity markets design undergoing asymmetric policies on renewables expansion: Capacity adequacy and revenue sufficiency,” Arab. J. Sci. Eng., vol. 47, no. 3, pp. 2781–2796, Mar. 2022. doi: 10.1007/s13369-021-05751-z. [Google Scholar] [CrossRef]
17. H. Ming, A. A. Thatte, and L. Xie, “Revenue inadequacy with demand response providers: A critical appraisal,” IEEE Trans. Smart Grid, vol. 10, no. 3, pp. 3282–3291, May 2019. doi: 10.1109/TSG.2018.2822778. [Google Scholar] [CrossRef]
18. Q. Wang and X. Chen, “China’s electricity market-oriented reform: From an absolute to a relative monopoly,” Energy Policy, vol. 51, pp. 143–148, Dec. 2012. doi: 10.1016/j.enpol.2012.08.039. [Google Scholar] [CrossRef]
19. H. W. Ngan, “Electricity regulation and electricity market reforms in China,” Energy Policy, vol. 38, no. 75, pp. 2142–2148, May 2010. doi: 10.1016/j.enpol.2009.06.044. [Google Scholar] [CrossRef]
20. D. Mou, “Understanding China’s electricity market reform from the perspective of the coal-fired power disparity,” Energy Policy, vol. 74, pp. 224–234, Nov. 2014. doi: 10.1016/j.enpol.2014.09.002. [Google Scholar] [CrossRef]
21. B. Q. Lin and X. Liu, “Electricity tariff reform and rebound effect of residential electricity consumption in China,” Energy, vol. 59, pp. 240–247, Sep. 2013. doi: 10.1016/j.energy.2013.07.021. [Google Scholar] [CrossRef]
22. X. L. Wang and B. Q. Lin, “Impacts of residential electricity subsidy reform in China,” Energy Effic., vol. 10, no. 2, pp. 499–511, Apr. 2017. doi: 10.1007/s12053-016-9466-3. [Google Scholar] [CrossRef]
23. Y. X. He and J. X. Zhang, “Real-time electricity pricing mechanism in China based on system dynamics,” Energy Convers. Manage., vol. 94, pp. 394–405, Apr. 2015. doi: 10.1016/j.enconman.2015.02.007. [Google Scholar] [CrossRef]
24. P. L. Lam, “Pricing of electricity in China,” Energy, vol. 29, no. 2, pp. 287–300, Feb. 2004. doi: 10.1016/j.energy.2003.08.010. [Google Scholar] [CrossRef]
25. R. Ge, L. X. Chen, Y. Y. Wang, and D. N. Liu, “Optimization and design of construction route for electricity market in China,” Autom. Electron. Power Syst., vol. 41, no. 24, pp. 10–15, Dec. 2017. doi: 10.7500/AEPS20170601008. [Google Scholar] [CrossRef]
26. Y. J. Zhu and T. Chen, “Research on Brazil’s electricity market trading mechanism and its enlightenment to China,” Electric Power, vol. 53, no. 6, pp. 124–132, Apr. 2020. doi: 10.11930/j.issn.1004-9649.202003174. [Google Scholar] [CrossRef]
27. Z. Y. Zhao et al., “Unbalanced funds analysis under the background of coexistence of planning and market,” Electric Power, vol. 53, no. 9, pp. 47–54, Sep. 2020. doi: 10.11930/j.issn.1004-9649.202001057. [Google Scholar] [CrossRef]
28. T. Zhang, J. Zhang, Y. Hu, L. Han, H. Liu and Y. Chen, “Research on settlement mechanism of electricity spot market double-track mode,” Guangdong Electric Power, vol. 34, no. 2, pp. 10–18, Feb. 2021. doi: 10.3969/j.issn.1007-290X.2001.002.002. [Google Scholar] [CrossRef]
29. Z. X. Jing et al., “Summary of unbalanced funds in power market: Causes, countermeasures and prospects,” Power System Technol., vol. 47, no. 9, pp. 3586–3600, Feb. 2023. doi: 10.13335/j.1000-3673.pst.2022.2033. [Google Scholar] [CrossRef]
30. Z. Song, “The approach of ‘using fixed generation to meet demand’ is not the correct way to resolve imbalance funds,” (in ChineseChina Electr. Council, vol. 619, no. 34, pp. 37–39, Dec, 2020. [Google Scholar]
31. Z. Ye, N. B. Chen, and Q. Xie, “The formation mechanism and management countermeasures of imbalance funds in electricity markets,” (in ChineseChina Electr. Council, vol. 640, no. 19, pp. 36–41, Jul, 2021. [Google Scholar]
32. S. Y. Long, K. Feng, J. Xu, Z. L. Yang, and S. H. Feng, “Research on unbalanced cost composition and allocation mechanism in spot electricity market,” Power System Technol., vol. 43, no. 8, pp. 2649–2658, Jul. 2019. doi: 10.13335/j.1000-3673.pst.2019.0541. [Google Scholar] [CrossRef]
33. C. Zhang, W. B. Peng, and S. X. Huang, “Unbalanced cost risk management strategy based on electricity price swaps in electricity spot market,” South. Power Syst. Technol., vol. 15, no. 12, pp. 36–44, Dec. 2021. doi: 10.13648/j.cnki.issn1674-0629.2021.12.005. [Google Scholar] [CrossRef]
34. Z. Y. Wu, M. Zhou, Y. G. Kou, P. B. Sun, J. X. Wang and G. Y. Li, “Imbalance capital allocation mechanism based on agent-based model,” Power Syst. Technol., vol. 45, no. 9, pp. 3408–3416, Jun. 2021. doi: 10.13335/j.1000-3673.pst.2020.1580. [Google Scholar] [CrossRef]
35. L. Z. Zhu et al., “Analysis of unbalanced funds under unilateral market mode,” (in ChinesePower Demand Side Manage., vol. 25, no. 1, pp. 92–97, Jan. 2023. doi: 10.3969/j.issn.1009-1831.2023.01.015. [Google Scholar] [CrossRef]
Cite This Article
 Copyright © 2024 The Author(s). Published by Tech Science Press.
This work is licensed under a Creative Commons Attribution 4.0 International License , which permits unrestricted use, distribution, and reproduction in any medium, provided the original work is properly cited.
 Downloads
 Citation Tools