
 Submit a Paper
 Propose a Special lssue
 Open Access
ARTICLE

Smart Micro Grid Energy System Management Based on Optimum Running Cost for Rural Communities in Rwanda
1 Electrical and Electronic Engineering Department, University of Rwanda, Kigali, Rwanda
2 Electrical Engineering Department, University of Dar es Salaam, Dar es Salaam, Tanzania
* Corresponding Author: Fabien Mukundufite. Email:
Energy Engineering 2024, 121(7), 1805-1821. https://doi.org/10.32604/ee.2024.051398
Received 05 March 2024; Accepted 11 April 2024; Issue published 11 June 2024
 View Full Text
 Download PDF
Abstract
The governmental electric utility and the private sector are joining hands to meet the target of electrifying all households by 2024. However, the aforementioned goal is challenged by households that are scattered in remote areas. So far, Solar Home Systems (SHS) have mostly been applied to increase electricity access in rural areas. SHSs have continuous constraints to meet electricity demands and cannot run income-generating activities. The current research presents the feasibility study of electrifying Remera village with the smart microgrid as a case study. The renewable energy resources available in Remera are the key sources of electricity in that village. The generation capacity is estimated based on the load profile. The microgrid configurations are simulated with HOMER, and the genetic algorithm is used to analyze the optimum cost. By analyzing the impact of operation and maintenance costs, the results show that the absence of subsidies increases the levelized cost of electricity (COE) five times greater than the electricity price from the public utility. The microgrid made up of PV, diesel generator, and batteries proved to be the most viable solution and ensured continuous power supply to customers. By considering the subsidies, COE reaches 0.186 $/kWh, a competitive price with electricity from public utilities in Rwanda.Keywords
Nomenclature
| COE | Levelized cost of electricity |
| NPC | Total Net Present Cost |
| US Dollar | |
| MV | Medium Voltage |
Electrical energy is a pillar of economic development in the world [1–3]. In that regard, the Government of Rwanda (GoR) has set an ambitious goal of electrifying all households (100%) by 2024 whereby 48% of the total households will have a connection through the off-grid system, through both standalone solar home systems (SHS) and microgrids [4]. So far, the SHSs are being applied to increase access to electricity in Rwanda as they offer various advantages including the possibility of electrifying many households at a low initial cost, less qualified technician requirements for distribution and installation of SHSs, absence of tariff schemes as well as low initial investment to electrifying rural communities with low population densities [5]. However, SHSs have limitations which puts a curb on the economic development of the population. They cannot support high power demand activities leading to poor reliability. As such, SHSs have little impact on the health, education, and business sectors. Smart Micro Grid development is a good alternative to rural electrification to ensure continuous electricity supply, economic benefits, and clean energy to customers in rural communities of Rwanda [6,7]. The end-users benefit greatly from a well-designed and well-managed microgrid based on optimum running costs. To satisfy the electricity load demand with improved reliability, the smart microgrid will have more than one type of electrical energy source. The smart microgrid increases the use of renewable energy sources available in Remera village. Real-time energy consumption tracking for effective electricity utilization monitoring is proposed and this will be implemented by using smart meters to manage electricity usage more smartly.
Many authors researched the use of microgrids in rural communities. The research findings provide an overview of the possibilities of modeling sustainable mini-grids, a Rolling-horizon dispatch strategy comparing the PV and diesel sources of electricity; Suggestion of a cycle-charging dispatch strategy. Gaps have been identified in the past research as summarized in Table 1.

The current research adopts an approach centered on integrating smart technologies into the management of Smart Micro Grid Energy Systems. This approach enables customers to track their energy use through mobile apps and predict future needs. It analyzes the collaboration between governmental electric utilities and the private sector to tackle electrification challenges, primarily through subsidies aimed at significantly reducing the levelized cost of electricity (COE). This aims to enhance the competitiveness of microgrids compared to grid-supplied systems. Furthermore, the utilization of HOMER as a simulation tool, genetic algorithms for optimizing microgrid configurations, and cost analysis represents a novel methodology for designing efficient and cost-effective energy solutions with the flexibility to evaluate various scenarios leading to the identification of the most viable options for electrification projects.
2 Electrification Road Plan in Rwanda
The National Electrification Plan (NEP) report conducted in 2018 indicated the number of villages and the corresponding number of customers in each village, which will be connected to the off-grid scheme. Table 2 indicates that out of 14,816 villages; 2,488 villages will be connected on off-grid. Table 3 shows that in total; 221,142 households will be electrified via the off-grid scheme. Where the medium voltage (MV) lines are crossing, customers can be electrified via the grid.


3 Smart Microgrid Architecture
Smart microgrids represent compact, low-voltage electrical networks utilizing renewable energy sources to power both controllable and non-controllable loads. These systems necessitate a sophisticated management infrastructure capable of overseeing, directing, and optimizing their performance to ensure efficiency, cost-effectiveness, and reliability [11]. Typically, a microgrid’s energy management operates across three hierarchical levels. The primary level focuses on local control of generation units, the secondary level addresses primary deviations in key variables like frequency and voltage, and the tertiary level, also known as the energy management system (EMS), adds intelligence to facilitate optimal power flow coordination. This article’s focus lies specifically on the tertiary level. The primary functions of an EMS include enhancing energy availability for each customer to bolster system reliability, Reducing energy losses and operational expenses, and Optimizing the utilization of renewable energy resources. The Smart Microgrid Architectural Model, developed by the Smart Grids Coordination Group of the European Committee for Electrotechnical Standardization CEN-CENELEC-ETSI, serves as a framework for smart microgrid architectures [12,13].
The layers, domains, and zones presented in Fig. 1 illustrate how smart microgrids are a total solution to modern energy systems that embed distributed generation renewable sources and business models. For efficiency, reliability, and customer convenience, there are smart operation systems, which monitor and control the systems. The component layer is the physical device which is smart and able to communicate on the respective layer. The communication layer can be split into a physical and a logical layer that must fit each other. The information layer contains data models and information objects, which form the semantics for interoperability. Finally, the function layer describes functions and services provided within a smart grid independent of their implementation. Interoperability with SCADA functions for control, notification, and others is required. The top layer describes the exchange of information from the business administrative perspective. The smart microgrid for Remera Village is based on location and remote microgrid type using an AC distribution system. Genetic algorithms for optimizing microgrid configurations are selected. This proposed GA approach was generated to lower the microgrid system’s cost. Using the genetic algorithm approach, we investigated the energy management of a freestanding hybrid microgrid that included solar panels, a diesel generator, and a battery. The model of the Remera village case study was represented and simulated in Homer. The data related to the generation of energy, LCOE, operation, and reliability constraints of the network are forecasted.
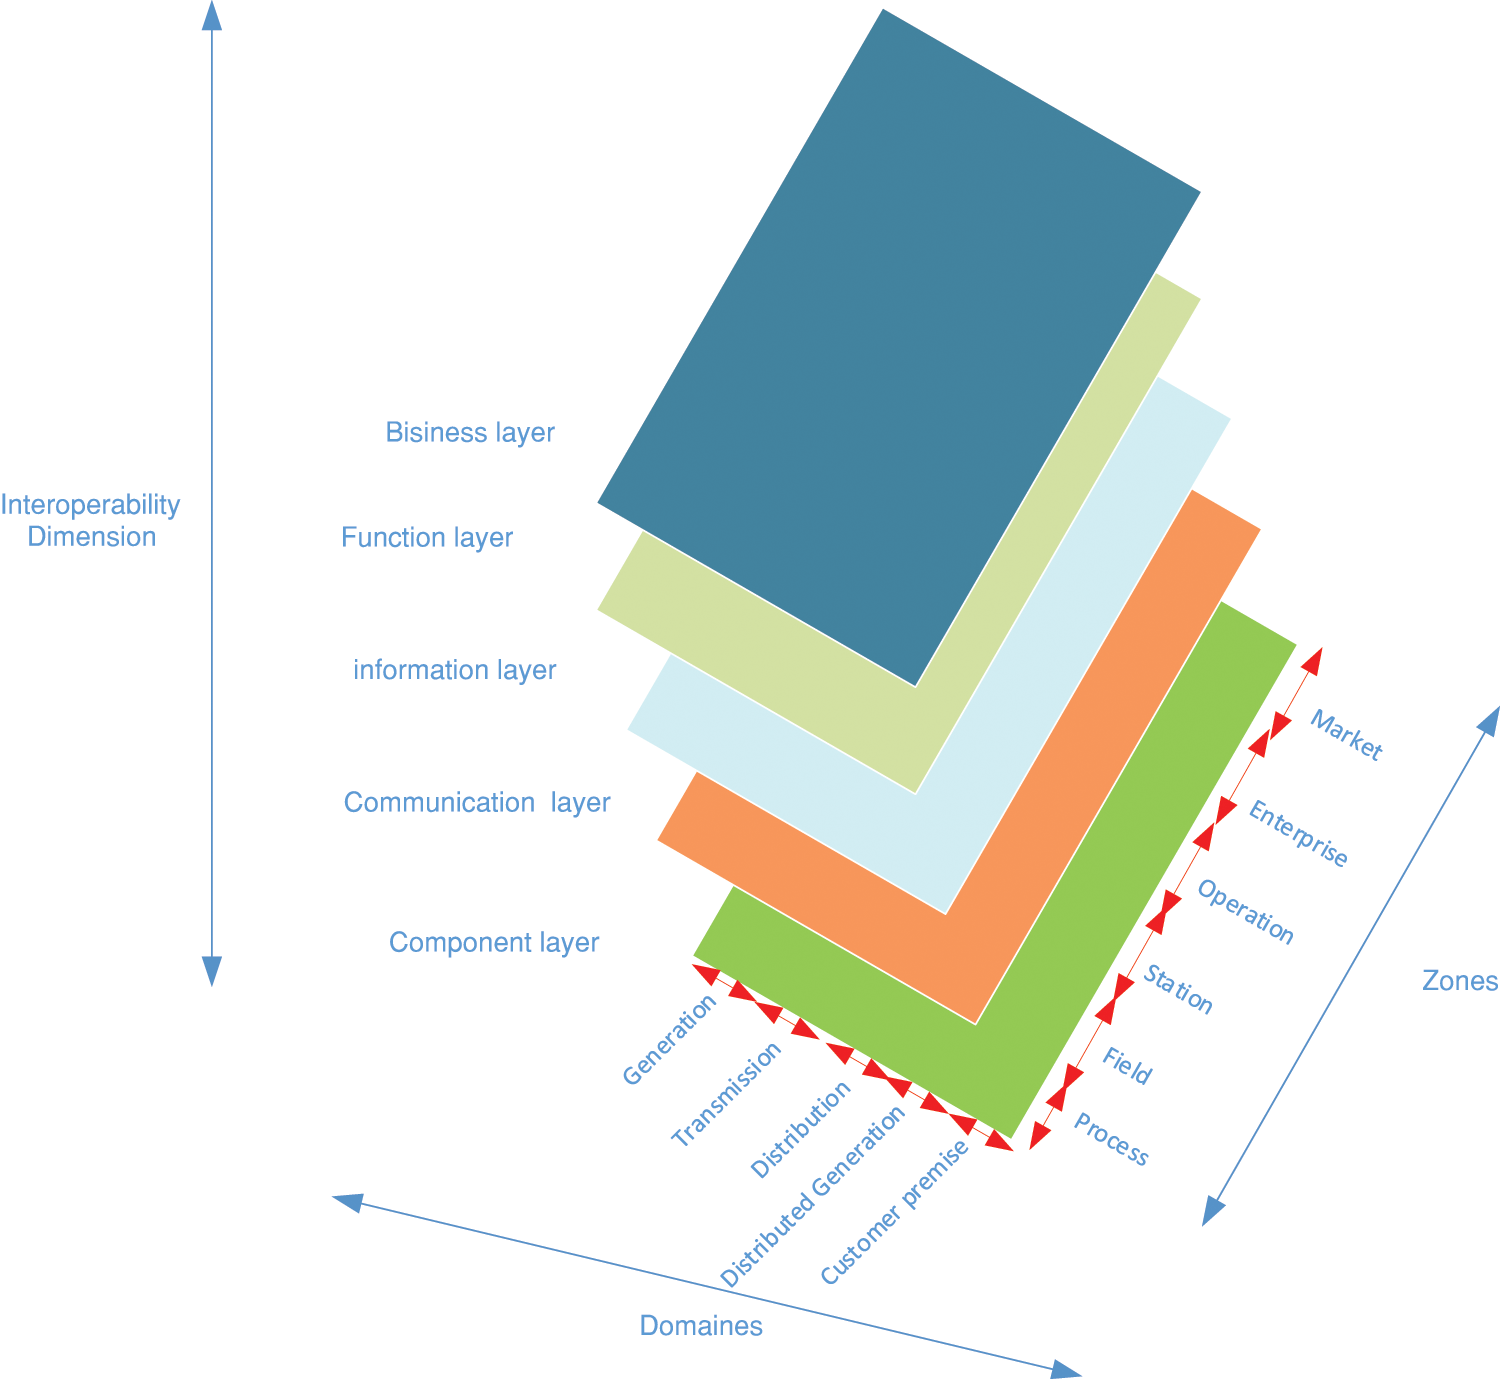
Figure 1: Smart microgrid architecture
The current research focuses on the electrification of one village, which is planned to be electrified using an off-grid scheme. Remera Village in the Northern Province was selected as it must be off-grid electrified as per the requirement of the government electrification plan. The village has 224 households. Based on daily load profiles, the maximum load demand of the selected site is estimated, taking into consideration the utilization and simultaneity factors. The potential renewable energy resources available in Remera village were assessed, and those that are abundant in the village and have no conflict of interest with other investors were identified. The optimum running cost of the smart microgrid was analyzed using Homer software, and a generic algorithm was applied. The continuous electricity supply is an added feature, which is considered as it is one of the important indicators of smart microgrid reliability. Fig. 2 summarizes the research methodology applied in this article.
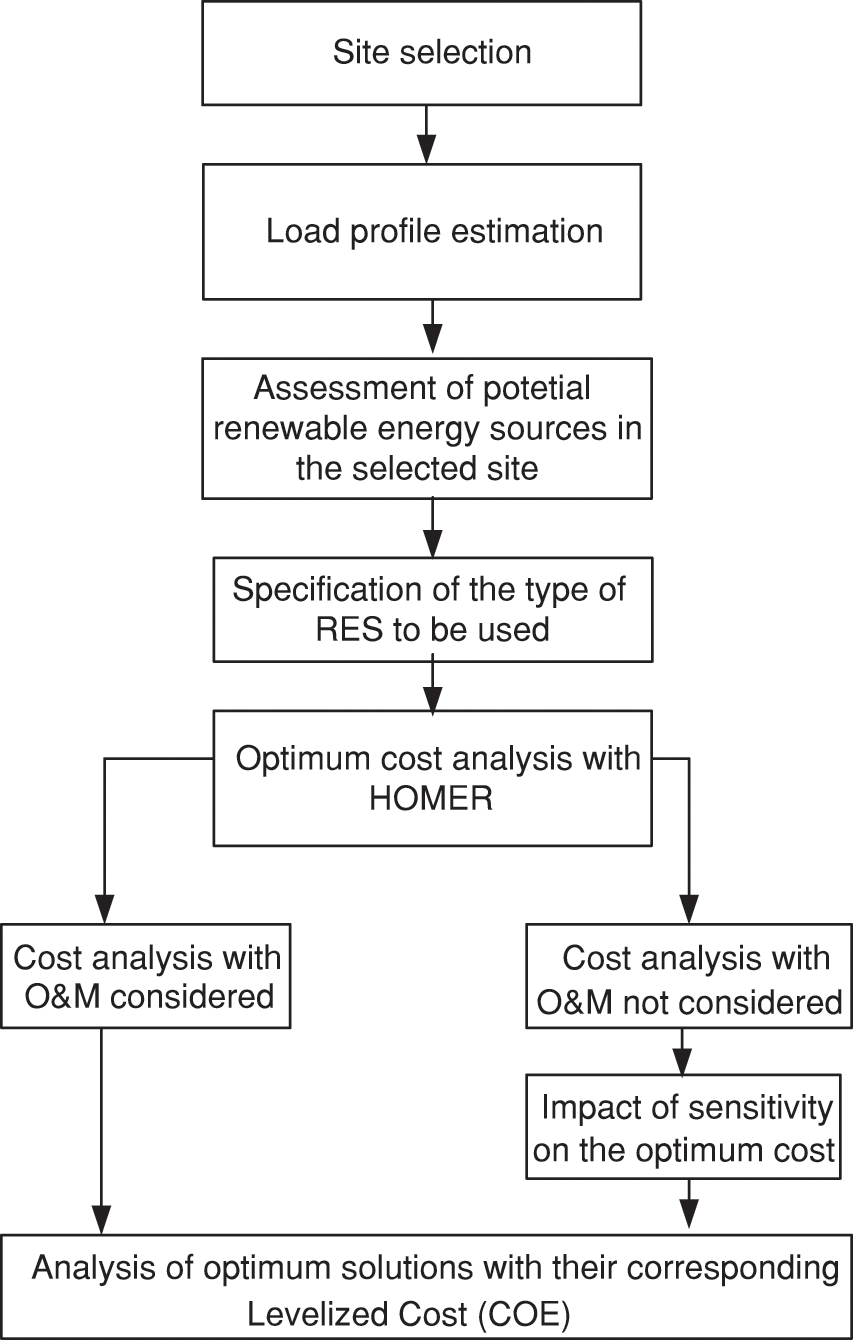
Figure 2: Diagram of applied research methodology
4.1 Renewable Energy Resource Assessment in Remera Village
The geographical coordinates of Remera village are 1°32′11.328′′S latitude and 29°43′29.64′′E longitude. The village has renewable energy resources mostly solar and hydro sources. PVGIS2016 provided the global horizontal irradiation and ambient temperature as shown in Fig. 3, the blue curved horizontal line presents the day-to-day ambient temperature with an average of 20.51°C over the year. The vertical orange lines represent the available average daily solar insolation in kWh/m2/day for a year, which ranges between 4.5 and 5.5 kWh/m2/day.
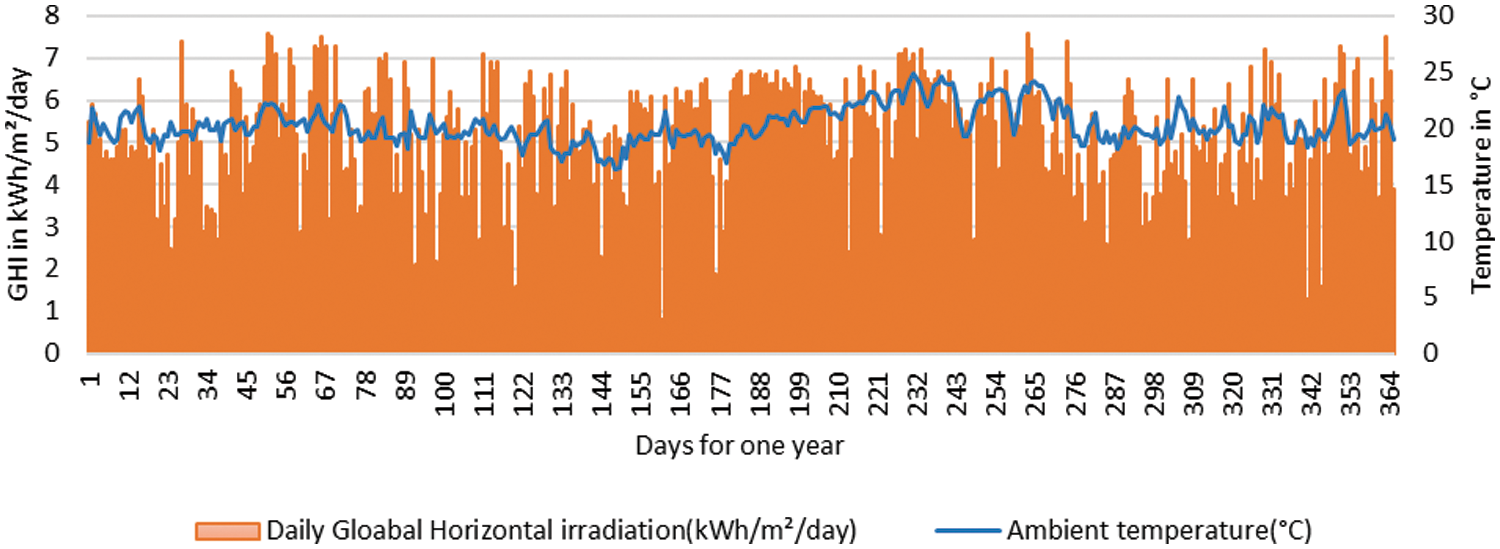
Figure 3: Monthly radiation in Remera village
In Remera Village, there are two lakes, Ruhondo and Burera, which serve as the sources for the Mukungwa and Ntaruka Hydropower plants. However, Rwanda faced a hydrological vulnerability, which caused an electricity supply crisis [14,15]. The latter caused a sharp decline in Ntaruka and Mukungwa hydropower station’s generation capacities, which provided 90% of the country’s electricity. The main cause of Ntaruka’s reduced electricity generation was attributed to a significant drop in the depth of Lake Burera, which acts as the station’s reservoir. In response to this electricity crisis, the GoR sought to restore the degraded Burera and Ruhondo lakes by banning all activities involving the use of water from the aforementioned reservoirs. Therefore, the current research did not opt to use any portion of water from Ruhondo and Burera lakes for the generation of electricity. There is no potential wind that can be exploited for electricity generation. Therefore, only solar energy is considered a viable potential renewable energy source in this village.
4.2 Remera Village Load Profile
The electricity demand in rural areas is much less than the demand in urban centers [16–19]. On the domestic level, electricity is used to power domestic appliances like radio, television, light lamps, refrigerators, computers, ceiling fans, an iron, and cell phones. The electricity is also used to power rural community halls, commercial, and small-scale industrial activities, but these are not covered in this current research. The maximum peak demand for the whole village is estimated in Table 4. Utilization and simultaneity factors are considered aiming at avoiding the risk of oversizing the electricity sources and cables. In normal operating conditions the power consumption of a load is sometimes less than that indicated as its nominal power rating, a fairly common occurrence that justifies the application of a utilization factor in the estimation of realistic values. In addition, it is known that the simultaneous operation of all installed loads of a given installation never occurs in practice. After applying the aforementioned factors to the total installed power, it was found that the maximum peak demand for the whole village is estimated at 20.2 kW. This is also used to calculate the daily energy demand. The load profile is depicted in Fig. 4.

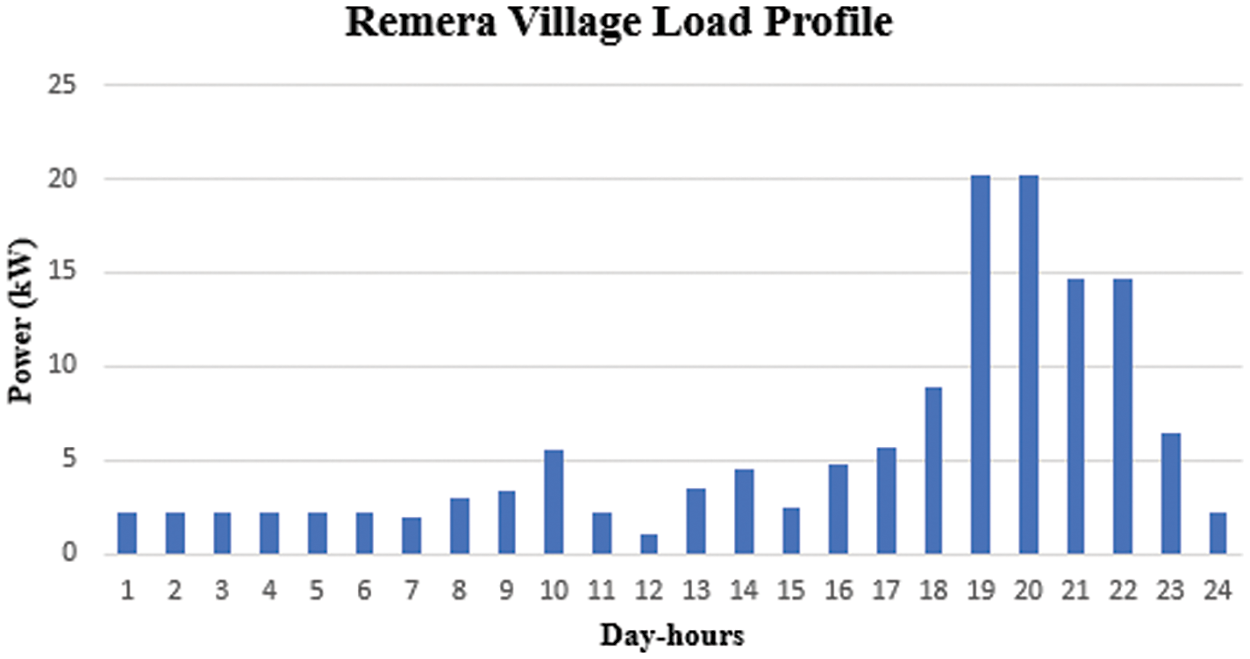
Figure 4: Remera village load profile
The maximum load demand occurs between 6:00 and 10:00 PM when lighting circuits are operating as shown in Fig. 4.
The maximum load demand is estimated at 20.2 kW and off-grid renewable energy-based power systems cannot provide this level of continuous supply of electricity without a storage medium. To ensure the continuity of power supply, the diesel generator is added to the micro grid system.
4.3 Smart Micro Grid Configuration for Remera Village
In designing the operational smart micro grid, the designer shall consider the capital expenditure related to purchasing equipment, plots, power plant, and building construction. The cost of operating, controlling, real-time electricity consumption monitoring, and maintaining the smart micro grid is considered [20]. The main components of the smart micro grid are photovoltaic (PV) generators, electricity storage systems, and diesel-fired generators. A smart bidirectional converter is required to convert DC to AC energy and vice versa. The smartness of the converter relies on the ability of the inverter to control the overcharging and excess discharge of the storage batteries. Diesel diesel-fired generator is used only during peak hours to satisfy the increased load demand. For the rest of the time, PV generators and batteries supply the loads. The running optimum cost of the smart grid described in this research depends on performance and the cost of smart grid components [21]. HOMER will deal with the optimal system and specify the placement of the array [22]. The PV cost is proportional to the size of the system [23]. The default prices of 72 Poly-crystalline Solar Panel Canadian Solar Max-Power CS6X-325P, converter, and battery are indicated by Homer. In this project, a generator of 10 kW initially costs $7,000, $6,500 for replacement, and $0.70/h for O&M [24]. The arrangement of the described micro grid components is shown in Fig. 5.

Figure 5: Micro grid model
4.4 Operation and Maintenance of Diesel-Fired Generators
The monthly fuel cost of generators is primarily dependent on the size of the generator and the brand of the generator. In this research, the fuel price is considered to be $1.6 per litter in Rwanda. The selected size of a generator is 10 kW as it is indicated in Section 4.3 above. A generator’s life expectancy is an essential factor to consider when investing in backup power systems. The life expectancy depends on daily running hours and other various aspects including maintenance schemes [25]. Adherence to routine and corrective maintenance plans is the best way to manage the life expectancy and efficiency of diesel-fired generators [26]. The estimated costs corresponding with the maintenance service time are shown in Table 5.

4.5 Estimated Cost and Life Expectance of the Smart Micro Grid in Remera Village
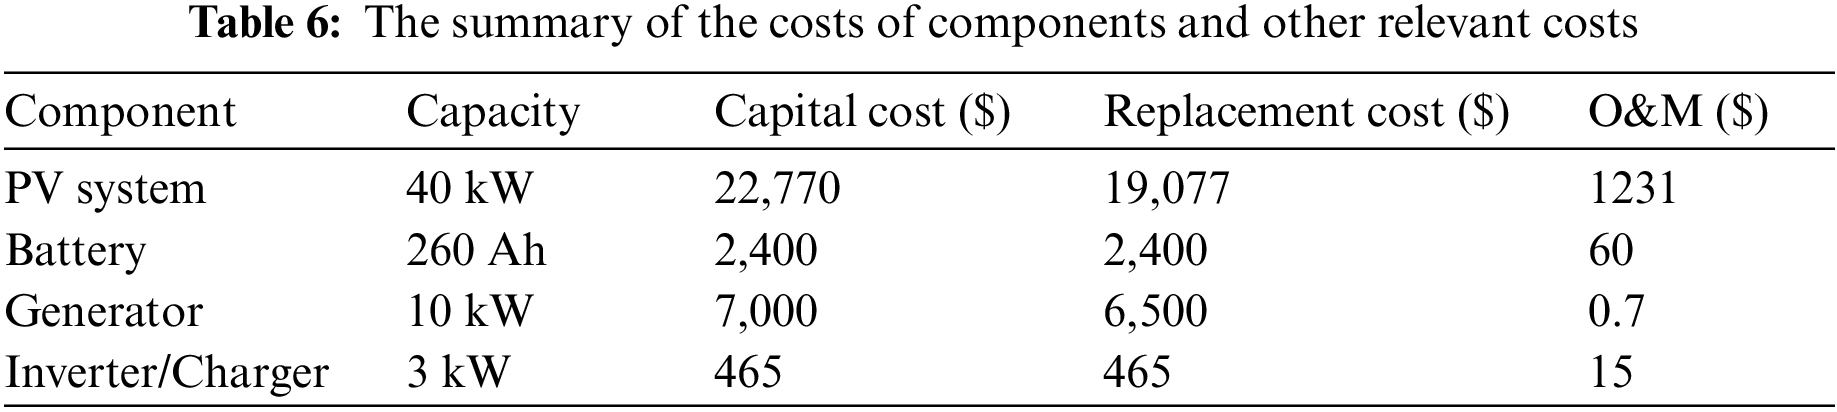
The cost estimation is presented in Table 6. It comprises the total capital expenditure, operation, and maintenance expenditure. The capital expenditure of the system consists of the amount of money invested for the development of the smart microgrid facility until it is commissioned. It also considers the construction of three-phase distribution power lines at a radius of four kilometers in Remera village, and the payment of experts and technicians involved in all construction activities of the smart microgrid. The capital expenditure which is also taken as fixed capital cost is estimated at $40,000. The operation and maintenance expenditure consists of the amount of money spent on diesel fuel, salaries of workers, and insurance costs. It is estimated at $4,000 per year. For proper analysis of the optimum running cost of the smart microgrid, the current research considers the possible lifetime of the power plant as one entity, taking into consideration the replacement of some components, technology evolvement, economic development in the country, and the payback requirements of smart microgrids [27]. During the simulation with Homer, the life expectancy of twenty years was considered.
4.6 Mathematical Analysis of LCOE
The overall Net Present Cost (NPC) of the system comprises the variance between the present values of all costs incurred throughout the project’s lifespan and the present values of all revenue generated during the project’s lifespan. The Eq. (1) illustrates the present value of the costs that will have been made after n-year:
where i′ stands for the annual inflation rate (%) and d stands for the nominal interest rate (%).
To determine the LCOE, it is necessary to convert the total NPC of the project into a series of equal annual cash flows, referred to as the total annualized cost, as calculated by Eq. (2).
Here, CPF represents the capital recovery factor, which is determined by the use of Eq. (3).
where N represents the number of years and i stands for the real interest rate.
In this analysis, the project’s duration examined is 20 years, thus N equals 20. The real interest rate is calculated based on the nominal interest rate (d) and the annual inflation rate (i′), as depicted in Eq. (4).
The levelized cost of electricity denotes the cost per kWh of electrical energy. The Eq. (5) illustrates the computation of LCOE.
5 Integration of Smart Metering System for Real-Time Monitoring of Electricity Consumption
The smart metering system is integrated into the microgrid to enable the smart management of electrical energy in the microgrid. Electricity consumption is monitored on the load side, and customers can manage their electricity demand all the time. Energy consumption and electrical feeders are monitored through SCADA, and real-time information is shared with the customers via their mobile cell phones. Fig. 6 illustrates the smart metering system diagram.

Figure 6: Smart metering system block diagram
The smart metering system shown in Fig. 6 monitors and manages instantaneously the customers’ electricity usage. The electricity consumption rate of all loads and indicated current flow rate in each feeder. The relay circuit can switch off any electrical feeder carrying overcurrent. Customers are recommended to consumption patterns change on their mobile devices. This enables the management of unnecessary energy wastage and optimizes electricity usage. The smart microgrid operation is monitored through SCADA. Fig. 7 illustrates the algorithm of the smart electricity consumption monitor.

Figure 7: Algorithm for the electricity consumption monitor
When the loads are connected to the power supply, electrical parameters that indicate the functionality status of the micro-grid are measured by the smart metering system, and the values obtained are notified to the customers through their portable smartphones. The parameters are compared to predefined values, in case of abnormal discrepancies; the smart relays are remotely actuated to stop any electrical feeders under abnormal operation. On the contrary, if the measured parameters meet the functionality requirements, the loads keep running as intended.
With Homer software, an optimal smart microgrid system is determined as the system, which can supply electricity needs at the lowest price. In addition, it should satisfy the electricity demand.
For the off-grid electrification of Remera village, various combinations of microgrid systems were considered obtained with a PV system, Diesel Generator, batteries, and converters from the HOMER optimization simulation. The optimal system configuration for the cycle charging dispatch strategy is 4.78 kW PV, 10 kW Diesel Generator, 16 Discover 12VRE-3000TF batteries, and 3.18 kW bidirectional converter. The NPC, COE, and operating costs of the system are $264, 547, $1.31, and $3,991, respectively.
From the results obtained for the Load Following Dispatch Strategy, it was seen that the optimal system configuration for this dispatch strategy is 4.10 kW PV, 10 kW Diesel Generator, 16 Discover 12VRE-3000TF batteries, and 2.68 kW bidirectional converter. The NPC, COE, and operating costs of the system are $263, 463, $1.31, and $3,977, respectively. By use of Results for the Combined Dispatch Strategy, the results show that the optimal system configuration for this dispatch strategy is 5.19 kW PV, 10 kW Diesel Generator, 14 Discover 12VRE-3000TF batteries, and 2.29 kW bidirectional converter. The NPC, COE, and operating costs of the system are $264, 184, $1.31, and $4,029, respectively. All optimization results described above are summarized in Table 7.

The optimal solutions listed in Table 7 have relatively equal values of NPC, COE, and Operating Cost. All of them can be considered for implementing a microgrid in Remera village, but the optimal solution under the Load Following dispatch strategy is selected as it has the lowest value of NPC compared to the remaining optimal solutions of the other dispatch strategies.
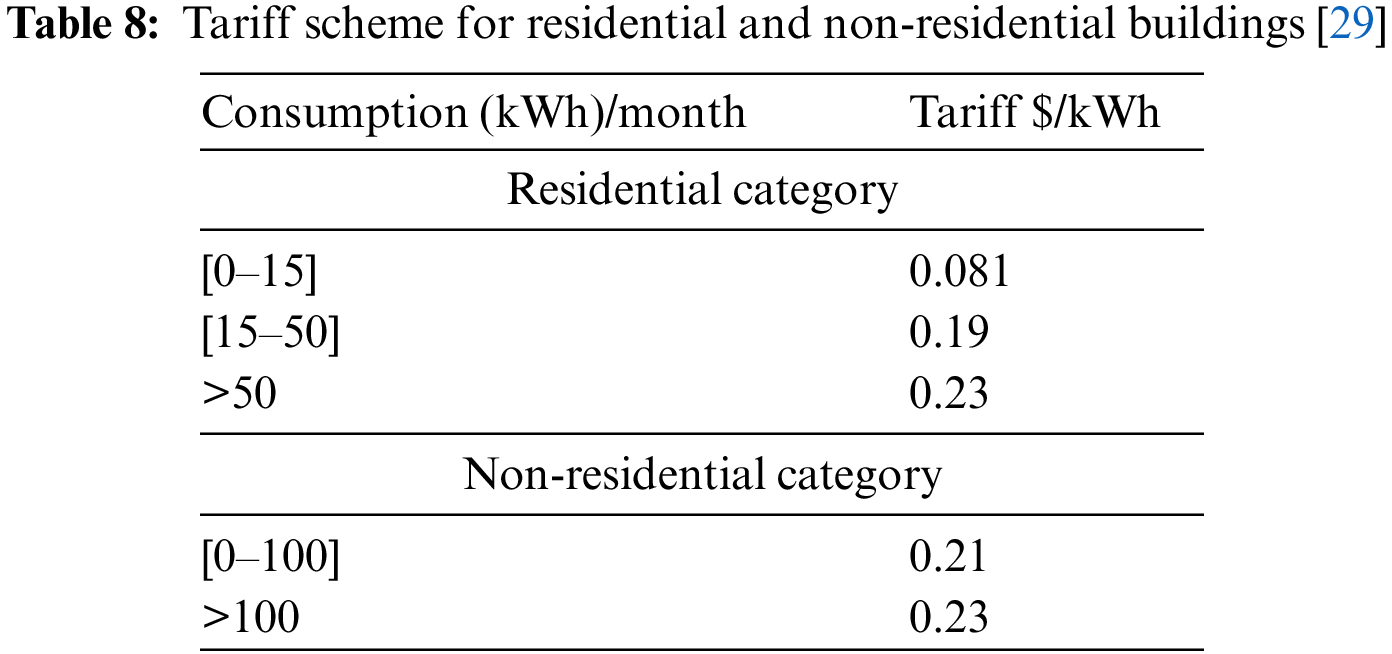
From Table 7, it is seen that the levelized cost of electricity from the proposed smart microgrid is $1.31/kWh. However, the utility sells the electricity at variable prices to encourage customers to manage their electrical energy consumption as shown in Table 8 [28]. Table 7 indicates that in the absence of subsidies, the levelized cost of electricity from the smart microgrid in Remera village is much greater than the price of electricity from the national grid.
6.2 Impact of Insolation and Fuel Price Uncertainties
The impact of insolation and fuel price uncertainties is called sensitivity impact. In Remera village, there can be some fluctuations in solar radiation [29]. In addition, there can be uncertainties in the estimated diesel price. The current research analyses the impact of fluctuating solar irradiance ranging from 4.3 to 5.3 kWh/m2/day, and the fluctuation of diesel prices ranging between $1.5 and $1.8 per litter. The techno-economic optimum configuration system has been simulated to check the behaviors of the optimum cost and reliability of the microgrid vs. the aforementioned fuel price and insolation intermittence.
According to Fig. 8, it is seen that the COE decreases as the solar-scaled average increases. In the case of diesel price, as it is shown in Fig. 9, the COE increases due to an increase in the fuel cost [30]. The decrease in the COE for the variation in solar-scaled average in the range of 4.3–5.3 kWh/m2/day is approximately $0.008/kWh, whereas the increase in COE for the variation in diesel price is approximately $0.0005/kWh; which is negligible. Henceforth, the fuel price and insolation intermittence have less impact on the optimum running cost of the smart microgrid in Remera village.
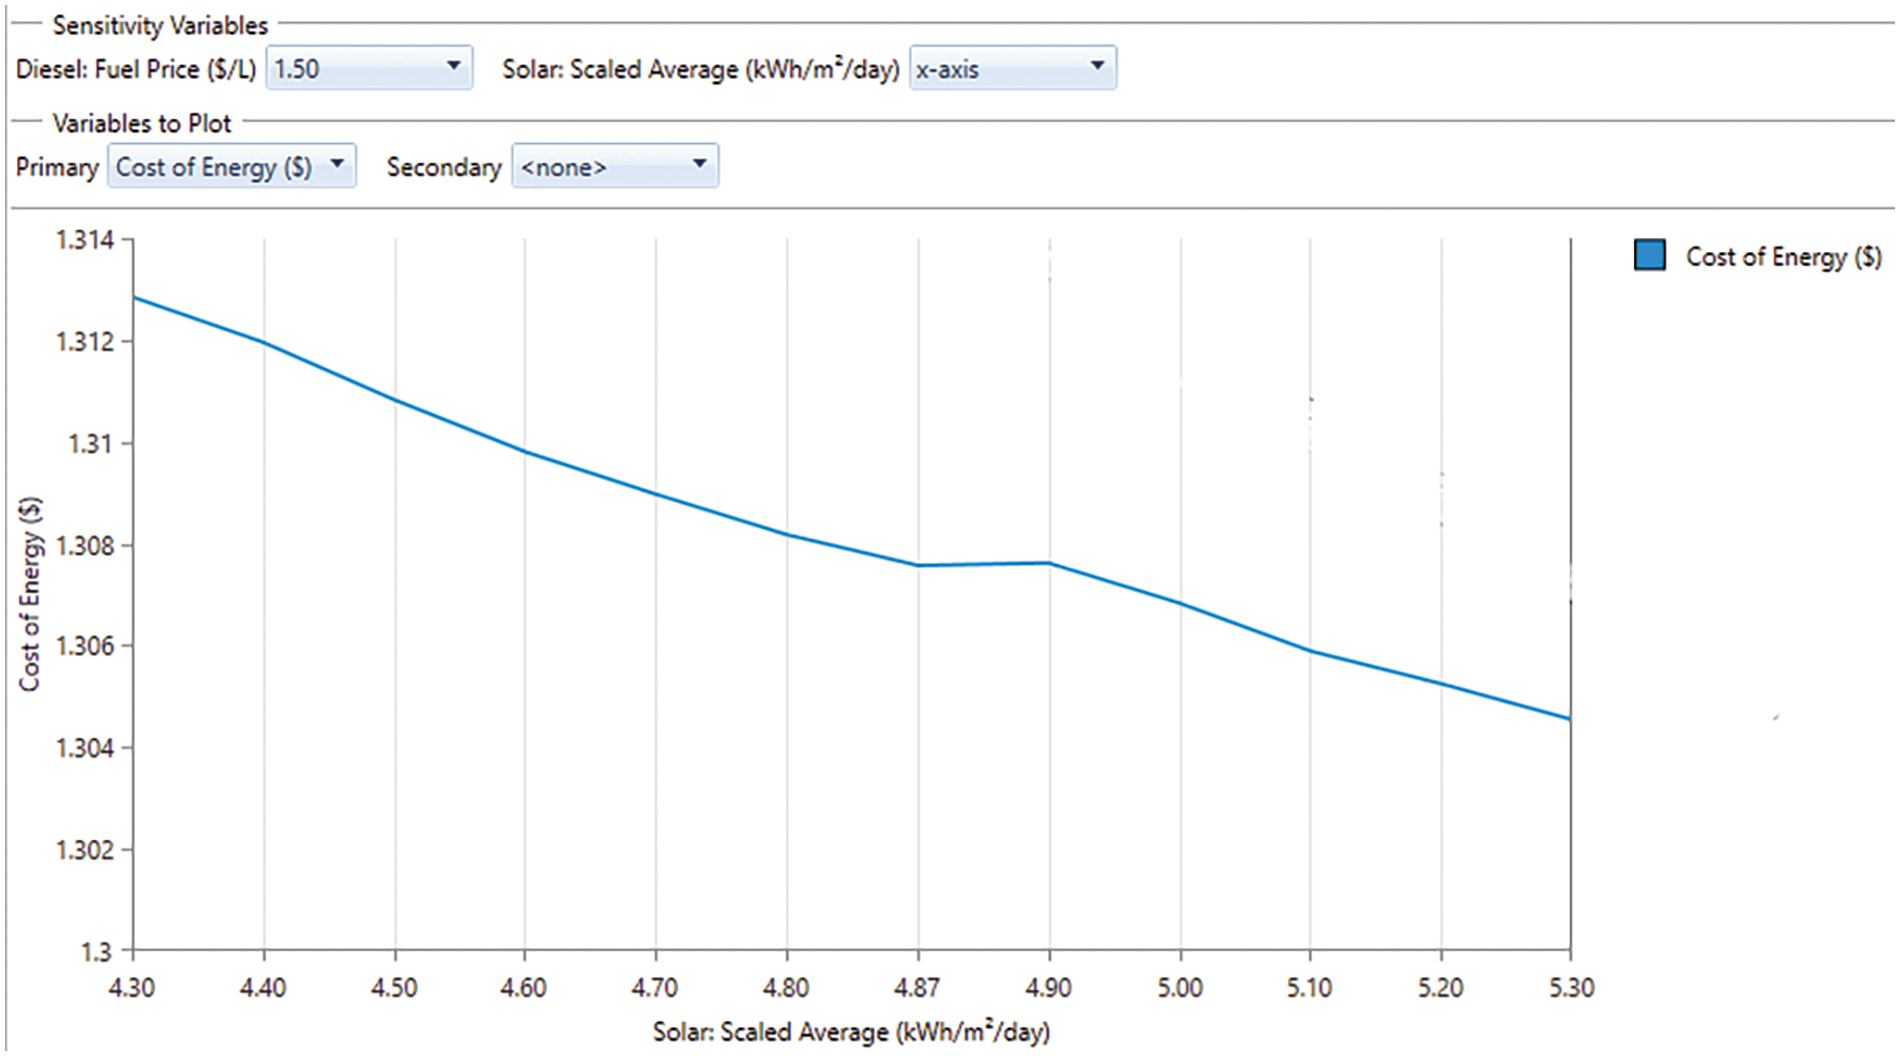
Figure 8: COE at different solar-scaled average

Figure 9: COE at different diesel prices
The initial capital of $68,679 was estimated to realize the rural electrification project for Remera village. This system is designed to supply 224 households in that village. The contribution of the government, private sector, and non-governmental organizations is essential to ensure the satisfaction of the end users and the sustainability of the system [31]. In the absence of subsidies, the tariff of electricity of 1.31 $/kWh is 16.17 times greater than the price of the electricity from the national grid if the customer does not exceed 15 kWh per month, and 5.7 times greater than the price of the customer consuming more than 50 kWh per month, respectively. Particularly in developing countries, the electricity price of rural electrification schemes cannot be equalized with the national grid tariff which already incorporates subsidies.
If the government and other non-governmental organizations donate the system fixed capital cost of $40,000, the initial capital will decrease by $40,000 to $28,695. This is an average amount that can attract investors. Other than capital investment-based subsidies, the government and non-governmental organizations can develop other subsidy schemes. If subsidies can cover the $3,800 out of the $4,000 system fixed O&M cost, the COE can drop up to 0.186 $/kWh. This is an acceptable and affordable price for rural consumers.
This subsidy will be realized by implementing a proper Operation and Maintenance scheme to ensure the sustainable operation of the project. This involves training local people to do basic maintenance of the system and to collect monthly fees from the consumers depending on energy consumption rates as indicated by smart metering systems. Purposive training can be offered to local people to equip them with requisite skills in smart microgrid operation and maintenance to offset the cost of employing a full-time technician.
The main objective of this study was to find the optimum cost of a smart microgrid to supply Remera village in the Northern province of Rwanda. The development of the typical load profile of the village and identification of the potential renewable energy resources was done. Hydropower seemed not to be feasible because of the need to preserve the two lakes in the area, Ruhondo and Burera. After selecting the appropriate components and studying their characteristics, the current research modeled the microgrid system using HOMER Pro software to simulate and find the optimal solution. It was found that a combination of PV plant, diesel generator, and battery storage systems provided the better optimum option for the smart microgrid with the generation capacities of 4.11 kW, 10 kW, and 16 for PV, diesel-fired generator, and batteries, respectively. The estimated levelized cost of energy for the system was initially 1.31 $/kWh when no subsidies were taken into consideration. The tariff was so high compared to the price of electricity from the Rwandan power network. It was proposed that government donations and local village training could lower the cost to $0.186/kWh. The levelized cost of electricity equivalent to 0.186 $/kWh is acceptable and affordable for rural consumers of Remera, which led to the conclusion that this microgrid power system is the optimum solution to electrify the community’s households. A smart metering system was proposed with the capability to monitor and communicate directly the electricity consumption status to the customers.
Acknowledgement: The acknowledgment and warmest thanks are addressed to the University of Rwanda (UR) and the African Center of Excellence in Energy and Sustainable Development (ACE-ESD). As a Ph.D. student in the ACE-ESD running under UR, my research works are financially supported by the above-mentioned institutions. I am delighted to thank also my Ph.D. studies supervisors, Dr. Bikoimana Jean Marie Vianney and Dr. Kyaruzi Lugatona Alexander for their guidance and moral support. They contributed much to data collection and manuscript writing.
Funding Statement: The African Center of Excellence in Energy and Sustainable Development (ACE-ESD) financially supports the research by paying the data collection fees and all charges related to this article’s publication. The University of Rwanda is in charge of tuition fees.
Author Contributions: The authors confirm their contribution to the paper as follows: study conception and design: Mukundufite Fabien; data collection: Mukundufite Fabien; analysis and interpretation of results: Mukundufite Fabien, Bikorimana Jean Marie Vianney, Kyaruzi Lugatona Alexander; draft manuscript preparation: Mukundufite Fabien. All authors reviewed the results and approved the final version of the manuscript.
Availability of Data and Materials: The reviewers of this research can access the data through the Google links shown below. The simulation was done in Homer Pro docs.google.com/spreadsheets/d/1nYtSwgKemIf9IBB39UCZ3C_lqwCcVvBT/edit#gid=2107806168.
Conflicts of Interest: The authors declare that they have no conflicts of interest to report regarding the present study.
References
1. Hu, J. L., Chen, Y. C., Yang, Y. P. (2022). The development and issues of energy-ICT: A review of literature with economic and managerial viewpoints. Energies, 15(594), 3–4. https://doi.org/10.3390/en15020594 [Google Scholar] [CrossRef]
2. Benoit, P. (2019). Energy and development in a changing world: A framework for the 21st century. SIPA Center on Global Energy Policy, Columbia. [Google Scholar]
3. Day, W. J., D’Elia, C., Wiegman, R. H. A. (2018). The energy pillars of society: Perverse interactions of human resource use, the economy, and environmental degradation. BioPhysical Economics and Resource Quality, 3(1), 1–16. https://doi.org/10.1007/s41247-018-0035-6 [Google Scholar] [CrossRef]
4. Consortium of Tata Power DDL, MIT–COMILLAS UEA Lab & EcoSecure Holding (2019). The national electrification plan: Report on definition of technologies (On-grid and off-grid) at village level. Rwanda Energy Group. [Google Scholar]
5. Chang, K. C., Hagumimana, N., Zheng, J., Asemota, G. N. O. (2021). Standalone and minigrid-connected solar energy systems for rural application in rwanda: An in situ study. International Journal of Photoenergy, 2021, 1–22. https://doi.org/10.1155/2021/1211953 [Google Scholar] [CrossRef]
6. Hirscha, A., Paraga, Y., Guerrerob, J. (2018). Micro grids: A review of technologies, key drivers, and outstanding issues. Renewable and Sustainable Energy Reviews, 90, 402–411. [Google Scholar]
7. Aydin, Ö., Demir, Z. (2019). Smart grid integrated with hybrid renewable energy systems. Eskişehir Technical University Journal of Science and Technology A–Applied Sciences and Engineering, 20, 120–131. https://doi.org/10.18038/estubtda.649075 [Google Scholar] [CrossRef]
8. Alonso, J. B., Sandwell, P., Nelson, J. (2021). The potential for solar-diesel hybrid mini-grids in refugee camps: A case study of Nyabiheke camp, Rwanda. Sustainable Energy Technologies and Assessments, 44, 1–37. https://doi.org/10.1016/j.seta.2021.101095 [Google Scholar] [CrossRef]
9. Fioriti, D., Giglioli, R., Poli, D., Lutzemberger, G., Micangeli, A. et al. (2018). Stochastic sizing of isolated rural mini-grids, including effects of fuel procurement and operational strategies. Electric Power Systems Research, 160, 419–428. [Google Scholar]
10. Bedadi, L. A., Mulugeta GebreMichael, G. M. (2021). Design and optimization of off-grid hybrid renewable power plant with storage system for rural area in Rwanda. IET Renewable Power Generation, 15(15), 3715–3731. https://doi.org/10.1049/rpg2.12267 [Google Scholar] [CrossRef]
11. de Durana, J. G., Barambones, O., Kremers, E. (2013). Multi-agent modelling for the simulation of a simple smart microgrid. Energy Conversion and Management, 75, 643–650. [Google Scholar]
12. Pochacker, M. R. (2016). Modeling and simulation of smart microgrids and power profiles (Ph.D. Dissertation). Alpen-Adria-Universitat, Klagenfurt. [Google Scholar]
13. Björk, P. (2019). Smart micro grids and business models. HANKEN School of Economics, Marketing Department, University of Vaasa, Finland. [Google Scholar]
14. Hove, H., Parry, J., Lujara, N. (2011). Maintenance of Hydropower Potential in Rwanda through EcosystemRestoration. World Resources Report. Washington DC, USA. [Google Scholar]
15. Hakizimana, E., Wali, U. G., Sandoval, D. (2020). Environmental impact assessment of hydropower plants in rwanda: Nyabarongo I hydropower plant (NHPP I). Energy and Environmental Engineering, 7(2), 27–37. https://doi.org/10.13189/eee.2020.070202 [Google Scholar] [CrossRef]
16. Weilong, W., Youna, L. (2022). The impact of rapid urbanization on residential energy consumption in China. PLoS One, 17(7), 1–21. https://doi.org/10.1371/journal.pone.0270226 [Google Scholar] [PubMed] [CrossRef]
17. Milin, I. A., C.MungiuPupazan, M., Rehman, A., Chirtoc, I. E., Ecobici, N. (2022). Examining the relationship between rural and urban populations’ access to electricity and economic growth: A new evidence. Sustainability, 14(13), 1–16. https://doi.org/10.3390/su14138125 [Google Scholar] [CrossRef]
18. Yukseltan, E., Yucekaya, A., Bilge, A. H. (2020). Hourly electricity demand forecasting using Fourier analysis with feedback. Energy Strategy Reviews, 31, 1–11. https://doi.org/10.1016/j.esr.2020 [Google Scholar] [CrossRef]
19. Chicco, G., Mazza, A. (2021). Chapter 13-load profiling revisited: Prosumer profiling for local energy markets. In: Local electricity market, pp. 215–242. https://doi.org/10.1016/B978-0-12-820074-2.00004-6 [Google Scholar] [CrossRef]
20. Aghenta, L. O., Iqbal, M. T. (2019). Design and dynamic modelling of a hybrid power system for a house in Nigeria. International Journal of Photoenergy, 2019(13), 1–13. https://doi.org/10.1155/2019/6501785 [Google Scholar] [CrossRef]
21. Chong, L., Dequn, Z., Wang, H., Huanbo, C. (2019). Feasibility assessment of a hybrid PV/diesel/battery power system for a housing estate in the severe cold zone—A case study of Harbin, China. Energy, 185(8), 671–681. https://doi.org/10.1016/j.energy.2019.07.079 [Google Scholar] [CrossRef]
22. Mohammed, O. H., Amirat, Y., Mohamed, B., Elbast, A. (2014). Optimal design of a PV/fuel cell hybrid power system for the City of Brest in France. 2014 First International Conference on Green Energy, pp. 119–123. Sfax, Tunisia. [Google Scholar]
23. Väisänen, J., Kosonen, A., Ahola, J., Sallinen, T., Hannula, T. (2019). Optimal sizing ratio of a solar PV inverter for minimizing the levelized cost of electricity in Finnish irradiation conditions. Solar Energy, 185, 350–362. https://doi.org/10.1016/j.solener.2019.04.064 [Google Scholar] [CrossRef]
24. Lee, B., Trcka, M., Hensen, J. L. M. (2013). Rooftop photovoltaic (PV) systems: A cost-benefit analysis study of industrial halls. International Journal of Low-Carbon Technologies, 9(4), 319–326. https://doi.org/10.1093/ijlct/ctt008 [Google Scholar] [CrossRef]
25. Benton, K. (2016). Alife cycle assessment of a diesel generator set (M.S. Thesis). Environmental Engineering, University of Montana, USA. [Google Scholar]
26. Mobarra, M., Rezkallah, M., Ilinca, A. (2022). Variable speed diesel generators: Performance and characteristic comparison. Energies, 15(2), 1–31. https://doi.org/10.3390/en15020592 [Google Scholar] [CrossRef]
27. Shafiullah, M., Refat, A. M., Haque, M. E., Chowdhury, D. M. H., Hossain, M. S. et al. (2022). Review of recent developments in microgrid energy management strategies. Sustainability, 14(22), 1–30. https://doi.org/10.3390/su142214794 [Google Scholar] [CrossRef]
28. Rwanda Utilities Regulatory Authority (2020). Electricity tariffs. Rwanda Energy Group. [Google Scholar]
29. Silsirivanich, N. (2017). Fluctuation characteristics effect analysis of solar irradiance data by wavelet transform. Energy Procedia, 138, 301–306. [Google Scholar]
30. Farret, F. A., Simões, M. G. (2006). Micro power system modeling with homer. In: Integration of alternative sources of energy, pp. 379–418. Wiley-IEEE Press. https://doi.org/10.1002/0471755621.ch15 [Google Scholar] [CrossRef]
31. Kyriakarakos, G., Balafoutis, A. T., Bochtis, D. (2020). Proposing a paradigm shift in rural electrification investments in Sub-Saharan Africa through agriculture. Sustainability, 12(8), 1–19. https://doi.org/10.3390/su12083096 [Google Scholar] [CrossRef]
Cite This Article
 Copyright © 2024 The Author(s). Published by Tech Science Press.
This work is licensed under a Creative Commons Attribution 4.0 International License , which permits unrestricted use, distribution, and reproduction in any medium, provided the original work is properly cited.
 Downloads
 Citation Tools