
 Submit a Paper
 Propose a Special lssue
 Open Access
ARTICLE

Shale Fracturability Graphic Template Based on Mixed Analytic Hierar-chy Process and Mutation Theory
1 College of Petroleum Engineering, Yangtze University, Wuhan, 430100, China
2 Hubei Drilling and Recovery Engineering for Oil and Gas Key Laboratory, Wuhan, 430100, China
* Corresponding Author: Dehua Liu. Email:
(This article belongs to the Special Issue: Hydraulic Fracturing Theory and Application for Geo-energy Development)
Energy Engineering 2024, 121(7), 1921-1943. https://doi.org/10.32604/ee.2024.049906
Received 22 January 2024; Accepted 28 February 2024; Issue published 11 June 2024
 View Full Text
 Download PDF
Abstract
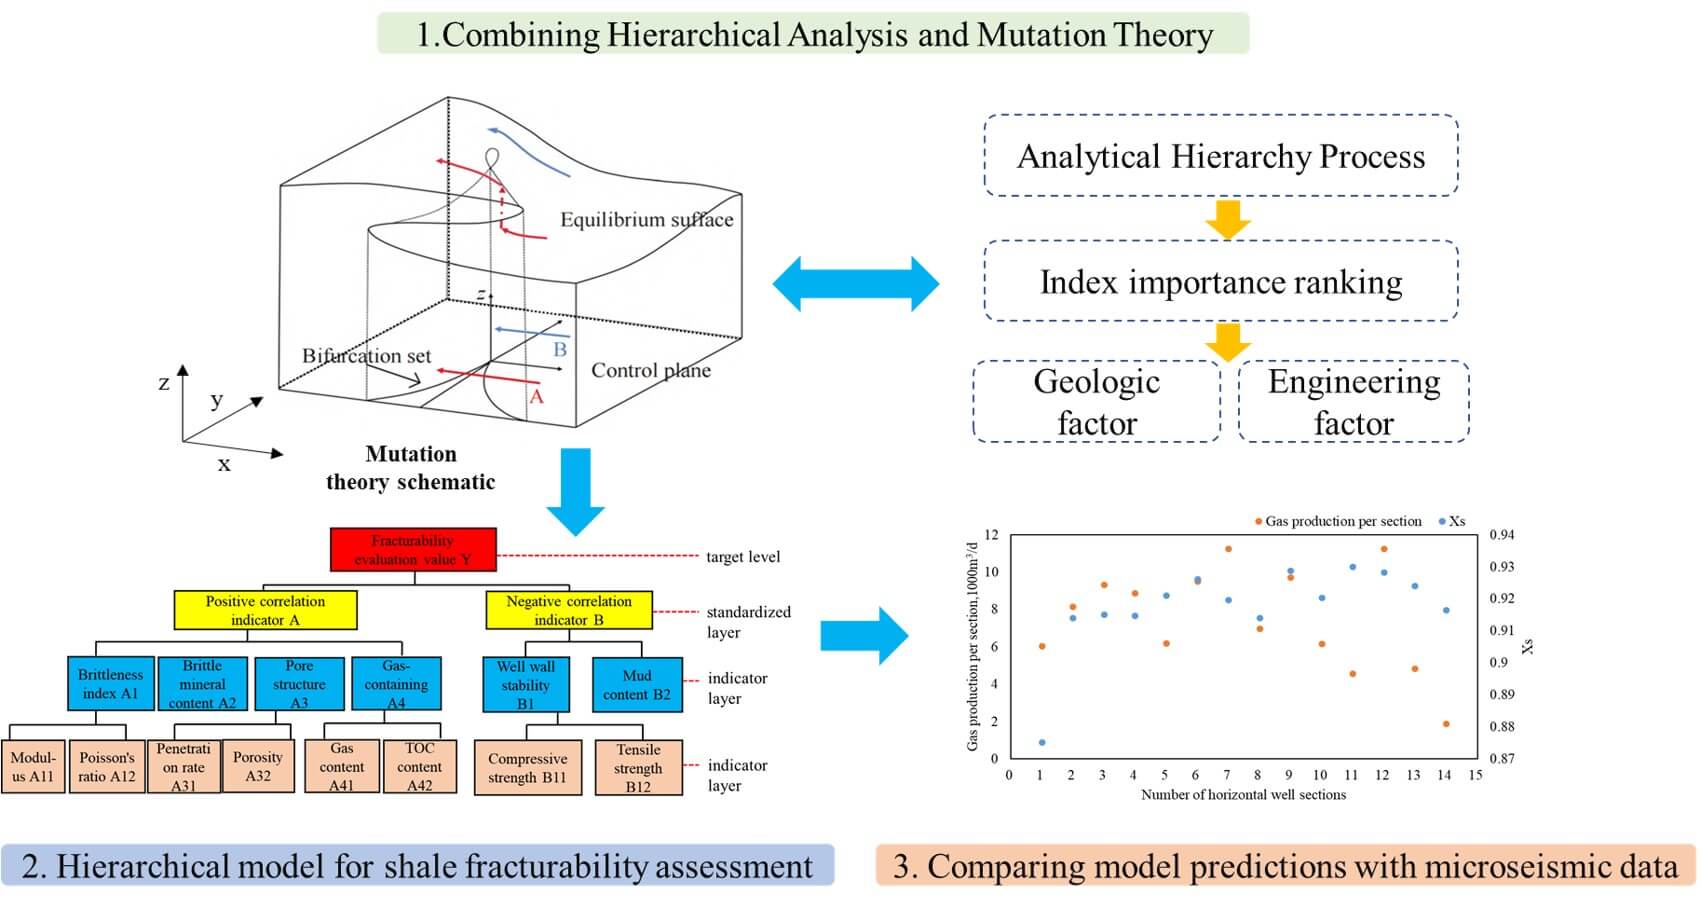
Due to the depletion of conventional energy reserves, there has been a global shift towards non-conventional energy sources. Shale oil and gas have emerged as key alternatives. These resources have dense and heterogeneous reservoirs, which require hydraulic fracturing to extract. This process depends on identifying optimal fracturing layers, also known as ‘sweet spots’. However, there is currently no uniform standard for locating these sweet spots. This paper presents a new model for evaluating fracturability that aims to address the current gap in the field. The model utilizes a hierarchical analysis approach and a mutation model, and is distinct in its use of original logging data to generate a fracturability evaluation map. Using this paper’s shale fracturing sweet spot evaluation method based on a two-step mutation model, four wells in different blocks of Fuling and Nanchuan Districts in China were validated, and the results showed that the proportion of high-yielding wells on the sweet spot line could reach 97.6%, while the proportion of low-producing wells was only 78.67%. Meanwhile, the evaluation results of the model were compared with the microseismic data, and the matching results were consistent.Graphic Abstract
Keywords
Nomenclature
| μ | Shear modulus |
| λ | Lamé’s coefficient |
| E | Young’s modulus |
| Δtp | P-wave travel time differences |
| Δts | S-wave travel time differences |
| vs | S-wave velocity |
| ρ | Density |
| σ | Poisson’s ratio |
| SC | Compressive strength |
| ST | Tensile strength |
| IR | Random consistency index |
| IC | Consistency index |
| ICR | Consistency ratio |
The current global economic downturn and transition towards renewable energy have resulted in historically low investment in oil and gas exploration [1]. As conventional oil and gas resources become increasingly scarce, shale oil and gas have emerged as key areas in global energy exploration. The United States, being the first country to exploit shale oil and gas and conduct related research, has led the shale oil and gas revolution, achieving large-scale production of shale fields [2–5]. After that, Canada [6–8], South Africa [9,10], Argentina [11,12], and some European countries [13] have begun research on shale gas exploration and development. According to the statistics [14], in 2021, the US produced 5.49 × 10⁸ tons of crude oil, of which shale oil contributed 3.62 × 10⁸ tons, accounting for 65.9% of total crude oil production. Natural gas production was 9736 × 108 m3, with shale gas contributing 7643 × 108 m3, or 78.5% of total natural gas production. China is among the countries with the largest shale oil and gas reserves and has extensively explored and developed these resources domestically. In 2021, China National Petroleum Corporation reported that the cumulative proven geological reserves of shale oil reached 13.05 × 10⁸ tons, and shale gas reserves reached 1.7 × 10¹² m3. Yet, in the same year, China’s shale oil production was just 257 × 104 tons and shale gas 128.7 × 10⁸ m3, constituting only 2.5% and 9.3% of its total oil and gas output, respectively. It is evident that China is still in the initial stages of shale oil and gas exploration and development. China should learn from countries like the United States and adapt this knowledge to its unique shale characteristics to devise an appropriate exploitation strategy.
In recent years, China has made significant progress in shale gas development, with a national output exceeding 200 × 108 m3 in 2021. Large-scale commercial exploitation of shale gas has been conducted in formations within 3500 m, and significant breakthroughs have been made in deeper formations (over 3500 m), making China the third country in the world to achieve commercial development of shale gas. In the development of shale oil and gas, the initial step is to explore the geochemical characteristics of the reservoir to identify high-quality reservoirs for development, known as geological sweet spots. Subsequently, it is necessary to evaluate the physical properties of the reservoir to ensure effective fracturing development and determine the most favorable fracturing target window, or sweet spot, known as fracturability evaluation [15,16]. However, establishing a highly applicable fracturability evaluation standard for shale in China is challenging due to the burial depth of shale oil and gas, which can reach 2100–4500 m. The mechanical properties of shale are affected by pressure, temperature, and tectonic movements, making it difficult to determine its fracturability. Additionally, unlike conventional sandstone and carbonate rocks, fracturability for shale does not simply refer to whether the formation can be fractured, but rather its suitability for fracturing. Fracturing is a prerequisite for extracting shale. Therefore, shale fracturability is evaluated to determine if a fracture network can be effectively formed, ensuring the feasibility of volume fracturing [17,18]. Field practices suggest that the development of deep shale gas in China is still challenging due to the extremely dense pore structure of shale, resulting in very low permeability. Evaluating ‘sweet spots’ using foreign parameters like Total Organic Carbon (TOC), pressure coefficient, gas content, and brittleness index is not effectively applicable under the complex geological conditions of southern China. Fracturing involves rock skeleton deformation, crack generation and extension, and fluid flow in fractures, making it a multifield coupled complex mechanical problem. China’s shale oil and gas have different characteristics from those in the United States, which presents greater development challenges. Therefore, foreign fracturability evaluation methods cannot be fully adopted. Currently, there is a lack of clear understanding regarding the initiation and extension mechanisms of fractures, as well as the difficulty in identifying relatively frackable layers during fracturing. This leads to ambiguity in engineering sweet spots. Based on the current state of shale oil and gas development, it is important to conduct a comprehensive evaluation in conjunction with geological sweet spots, rather than solely seeking engineering sweet spots. Therefore, it is crucial to establish an accurate method for evaluating the fracturability of shale.
Shale fracturability is influenced by various factors due to its comprehensive reflection of geological and reservoir characteristics [19,20]. Scholars worldwide have conducted research on evaluating the fracturability of shale reservoirs. The brittleness index is a crucial parameter for determining whether rocks can form fractures under stress and their fracture morphology. It is mainly classified into two types: calculated directly using well log data and empirical formulas or determined by X-Ray Diffraction (XRD) indoor core tests to identify reservoir mineral types, and then evaluating the brittleness index based on the content of brittle minerals. In 2007, Jarvie et al. [21] proposed determining the brittleness index based on the proportion of quartz in the total minerals. Subsequently, others suggested that the calculation of the brittleness index should also include dolomite, quartz-dominated siliceous minerals, and carbonate minerals [22–24]. Later, scholars Tao et al. [25] combined Rickman’s [26] brittleness index calculation method based on Young’s modulus and Poisson’s ratio with indoor core experiment methods to propose a related brittleness index evaluation method. However, numerous field data have shown that the brittleness index is not the only indicator for evaluating shale fracturability. Using the brittleness index alone to evaluate shale fracturability is unreasonable, incomplete, and inaccurate. Mullen et al. [27] mentioned in their paper that factors affecting shale reservoir fracturability include not only the content of brittle minerals but also their corresponding sedimentary structures and the development of natural weak planes in the original strata. Chinese scholars conducted indoor experiments and mechanism analyses on the characteristics of shale reservoirs in Yongchuan of Sichuan Basin, Baojing in Hunan Province, and Luzhou in southern Sichuan Province. They established a shale reservoir fracturability evaluation model that comprehensively considers the rock brittleness index, fracture toughness, and reservoir porosity and permeability, achieving good results. However, due to the high cost of indoor experimental analyses, the unavoidable impact of experimental data errors on evaluation results, and the inability to continuously and completely reflect the fracturability of horizontal well sections, there are limitations. Consequently, some scholars have considered the continuity of fracturability evaluation and established a shale reservoir fracturability evaluation model based on well log data and the Analytic Hierarchy Process. However, this method requires mutual independence among various data, while in reality, the influencing factors cannot maintain their independence, thus reducing its applicability. The process of fracturing occurs within a complex system, so changes in external factors can lead to changes in the system’s state. This characteristic aligns well with the mutation theory proposed by French scientist Rene Thom, which is a method based on topology, structural stability, and singularity theory to study discontinuous changes and catastrophic phenomena. Mutation theory has become a key mathematical tool for solving complex problems in engineering and covers a wide range of fields, including economics, physics, biology, and psychology. However, traditional mutation models, based on experience and existing data to determine control factors, lack scientific rigor, making the selection of variables a challenge. Currently, common variable selection methods include wrapper, filter, and embedded methods, each with its own limitations. For instance, methods like wrapping and embedding can achieve good modeling results, but the selection of variable subsets dependent on specific models greatly risks overfitting. The filtering method, although independent of specific learning techniques and quite applicable, struggles to achieve satisfactory modeling outcomes. The Analytic Hierarchy Process (AHP) mentioned earlier, in the process of selecting variables, not only covers effective variable information in the fracturing process but also organizes and structures the evaluation model efficiently. Therefore, by utilizing hierarchical analysis and mutation theory to compensate for each other’s deficiencies, an effective and more complete evaluation model can be established.
This paper presents a two-step method for constructing a mutation model to establish a fracturability evaluation model that meets the characteristics of Chinese shale reservoirs. Firstly, a structural model of shale fracturability evaluation is established based on hierarchical analysis, with clear organization and hierarchy. The evaluation parameters’ correlation and contradiction are reduced based on the mutation theory to meet the data independence requirement of hierarchical analysis. Then, the parameters are standardized and normalized to calculate the affiliation value of each control variable and the total mutation of the evaluation system. Finally, the results are sorted according to the calculation results. Finally, the evaluation model’s effectiveness and applicability are verified by combining it with the actual fracturing effect in the field.
The two-step method is utilized to construct the shale fracturability evaluation method, which is a hierarchical and organized model based on various factors of shale reservoir fracturability evaluation. The evaluation model is divided into three layers: the objective layer, the criterion layer, and the index layer. Firstly, a multilevel structural model is established to evaluate shale reservoir fracturability indexes, consisting of the target layer, criterion layer, and index layer. The evaluation of fracturability value S for mudstone and limestone reservoirs is considered the objective layer. The criteria that determine the relationship between the indicators and the objective layer are the criterion layer, which is divided into positive indicators A and negative indicators B. When applying mutation theory, it is crucial to choose appropriate control variables. The selection of control variables should be systematic and capable of influencing the system’s state while maintaining exclusivity to avoid simultaneous changes. It is crucial that the selected control variables align with the specific objectives of the study and are consistent with the application goals of mutation theory. The selection of positive and negative indicators is particularly important. The selection of positive indicator A (brittleness index, brittle mineral content, reservoir porosity, permeability, and gas content) and negative indicator B (well wall stability and mud content) was based on the development experience of unconventional reservoirs and the advice of fracturing site experts. The brittleness index includes Young’s modulus and Poisson’s ratio, porosity and permeability parameters include porosity and permeability, gas content includes gas content and TOC, and wellbore stability includes compressive strength and tensile strength. To ensure the accuracy and continuity of evaluation parameters, well logging data is chosen as the fundamental data for calculating these parameters.
The method for calculating the parameters is as follows:
(1) Young’s Modulus
In the formula: μ, λ, and E represent the shear modulus, Lamé’s coefficient, and Young’s modulus, respectively, in GPa; Δtp and Δts are the P-wave and S-wave travel time differences, in μs/m; vs is the S-wave velocity, in m/μs; ρ is the formation density, in g/cm3.
(2) Poisson’s Ratio
(3) Brittleness Mineral Content
(4) Brittleness Index
(5) Compressive Strength SC and Tensile Strength ST
(6) Other Parameters
Other parameters involved in this model, including porosity, permeability, gas content, and TOC, can be directly obtained from well logging data.
After calculating the above evaluation parameters, it is necessary to use the Analytic Hierarchy Process (AHP) to score and rank these parameters, and then combine them with the mutation model to calculate the fracturability coefficient.
2.1 Analytic Hierarchy Process (AHP)
The purpose of the Analytic Hierarchy Process (AHP) is to solve multi-objective complex problems by combining qualitative and quantitative approaches to calculate decision weights. This method combines quantitative and qualitative analyses, utilizing the decision-maker’s experience to judge the relative importance of criteria for achieving various objectives and to assign reasonable weights to each criterion for every decision option. By using these weights to determine the relative merit of each option, AHP effectively addresses problems that are difficult to solve with purely quantitative methods.
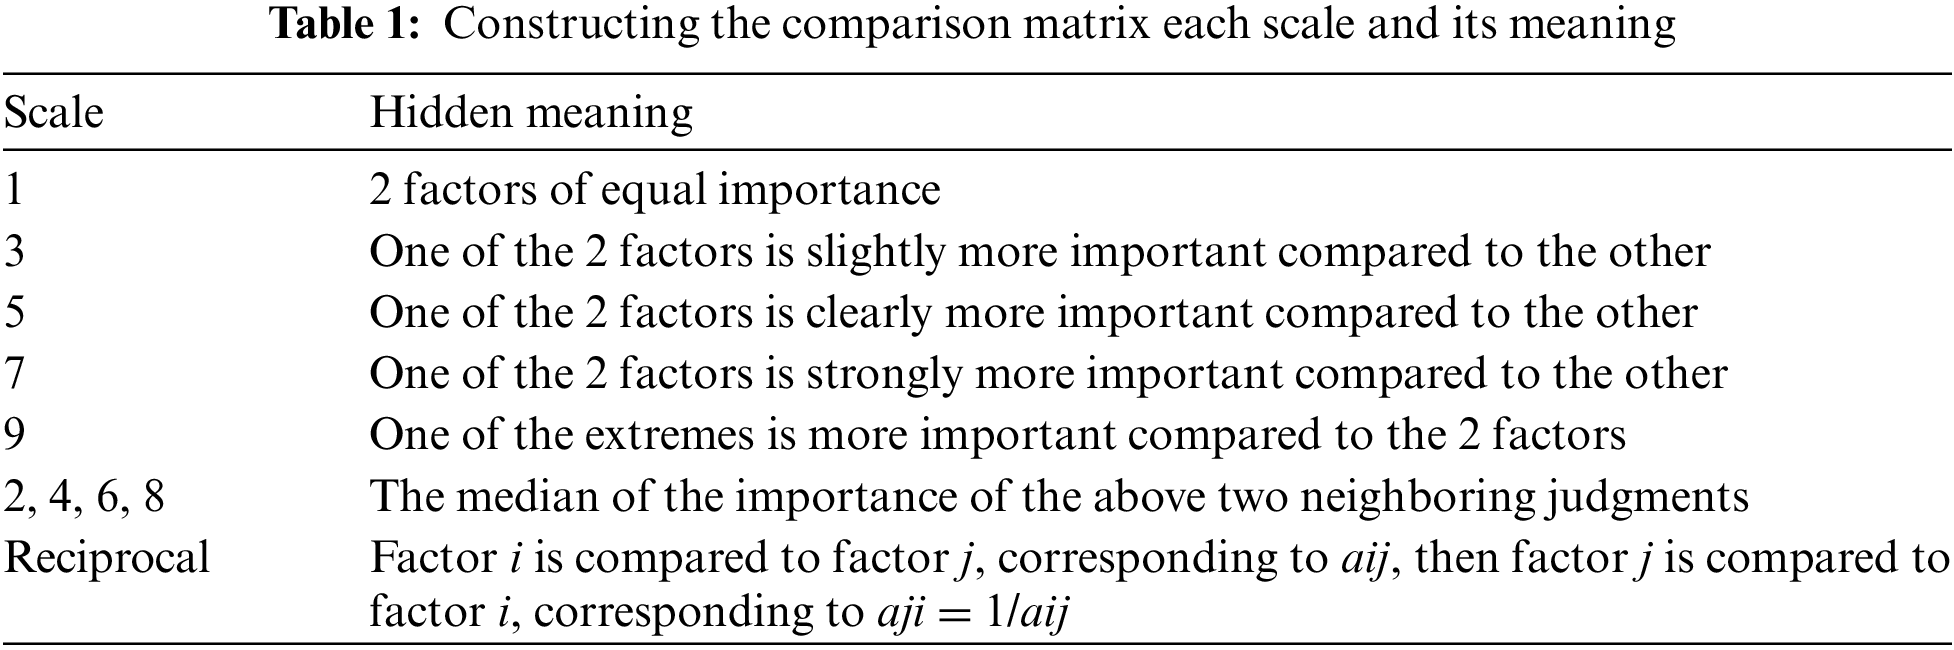
The principle primarily involves constructing a judgment matrix after determining the scale, as shown in Table 1. Subsequently, the final judgment matrix is determined through expert scoring, and the matrix is solved to obtain eigenvectors, eigenvalues, and weights. During the calculation, to avoid logical errors in constructing the judgment matrix, a consistency check is required. The general consistency check index is the CR value, and the matrix is considered consistent if the CR value is less than 0.1. The specific steps are as follows:
(1) Establish a Judgment Matrix
In the formula: A represents the weight ratio matrix; W is the weight vector; λmax is the maximum eigenvalue.
(2) By calculating the weight vector W using the eigenvector from the judgment matrix established by the Analytic Hierarchy Process, one can obtain the coefficient I, which is relevant to the problem in question.
(3) Conduct a consistency check on the judgment matrix using its eigenvalues
In the formula: n is the number of elements chosen; IR is the Random Consistency Index, IC is the Consistency Index, whose values are given in a standard table, as shown in Table 2. ICR is the Consistency Ratio.
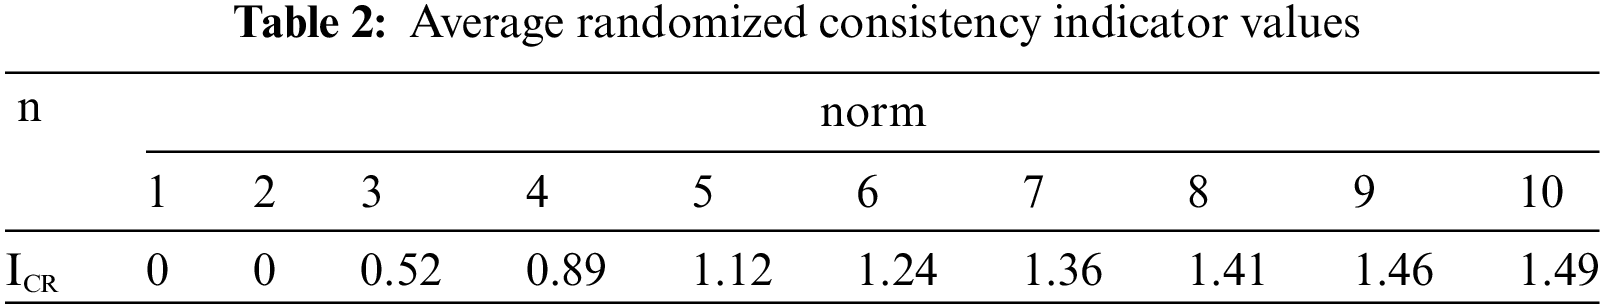
When ICR < 0.1, the consistency test is passed; otherwise, the logic in the matrix needs to be further checked and modified.
By using the Analytic Hierarchy Process to score and rank the numerous factors affecting shale fracturability, and considering the previously mentioned limitations of the AHP, it is necessary to apply a mutation model to the ranked indicators.
2.2 Two-Step Construction of a Mutation Model
The previous section introduced application scenarios of the mutation model. Mutation theory employs mathematical models to describe the process where continuous motion is suddenly interrupted, leading to a qualitative change. It is related to Chaos Theory and is now commonly considered a part of it. The theory studies the potential function and classifies critical points based on it, thereby investigating the discontinuous characteristics near these critical points. The model’s specific process involves the system approaching the maximum and minimum values of the potential function under fixed control factors until it reaches a state of equilibrium, as shown in Fig. 1.
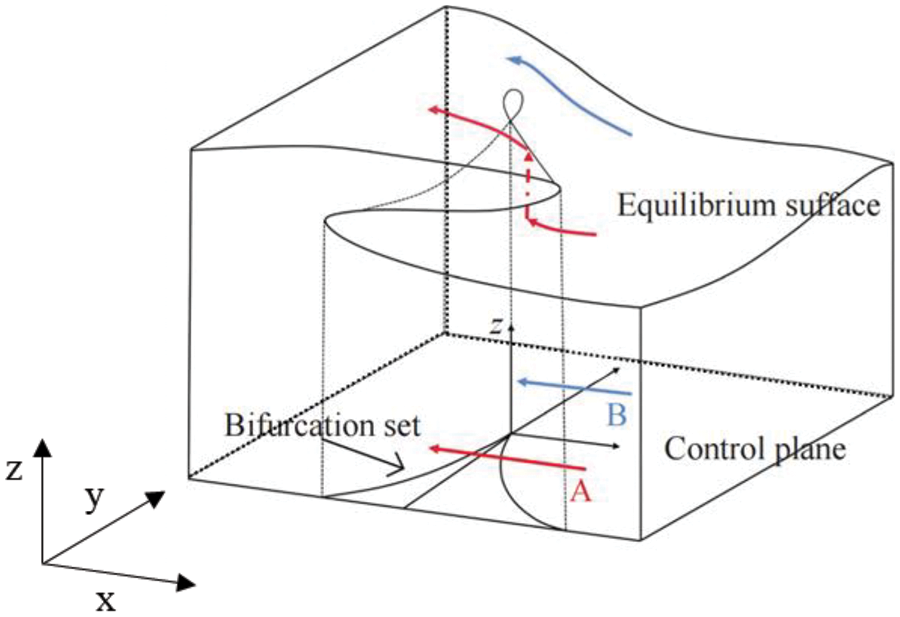
Figure 1: Schematic diagram of cusp mutation model
The relationship of the state factor x and the control factor a with time t in the system can be described by the expression of the dynamical system.
Here, V(x,a) is the potential function of the system, with different mutation models composed of various control factors and state factors. The equilibrium surface equation is obtained when its first derivative equals zero. By differentiating the equilibrium surface equation, we can determine the singular set of the potential function, which is known as the bifurcation set equation. The bifurcation set equation indicates that the system will undergo a mutation when the control factors satisfy this equation. Decomposing the bifurcation set equation in Table 3 leads to the derivation of a normalized formula for the mutation model. This formula normalizes the different states of each control factor into states represented by state factors. In the subsequent data processing of this article, cusp, swallowtail, and butterfly mutation models will be used. The bifurcation set equations are as shown in Table 3.
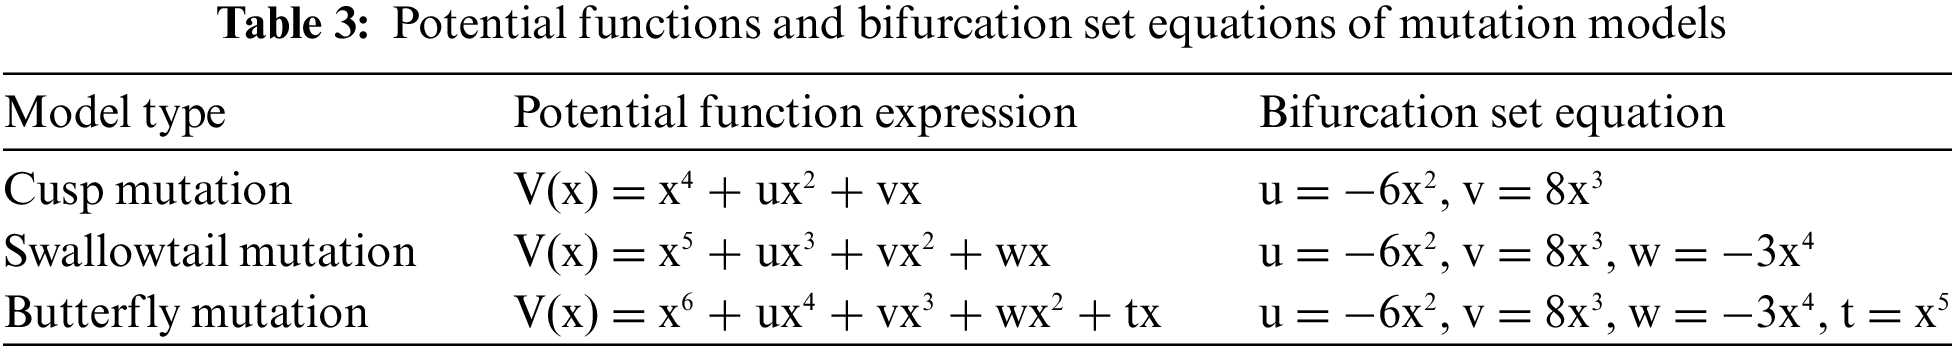
The normalization formulas are as follows:
Cusp Mutation:
Swallowtail Mutation:
Butterfly Mutation:
In the formula: The values of the system state factor (x) and control factors (u, v, w, t) range from 0 to 1. Utilizing the normalization formula, one can calculate the system mutation membership function values that characterize the system state features. This is the fundamental calculation formula needed for the comprehensive analysis and evaluation of fracturability in shale reservoirs.
In summary, the method of shale fracturing sweet spot analysis based on the two-step construction of mutation models is as follows: First, use the Analytic Hierarchy Process to construct the hierarchy of the entire evaluation system and determine the mutation model for each level. Then, standardize and normalize the necessary data to obtain the membership values of the evaluation system. Finally, the process of evaluating fracturability in compressible reservoirs can be summarized as follows: Initially, decompose the evaluation system into multiple subsystems composed of various evaluation indicators, establish a hierarchical model of evaluation indicators, and determine the corresponding mutation model for each level. Next, standardize the basic data, decompose the bifurcation set equation to obtain the normalization formula, calculate the corresponding x-values of each control variable within the same system, and derive the total mutation membership function values for different evaluation systems. Lastly, determine the final fracturability evaluation values for each subsystem from smallest to largest, and rank them from highest to lowest, selecting the most compressible layers. The hierarchical structure model of shale horizontal well fracturability established in this article is shown in Fig. 2:
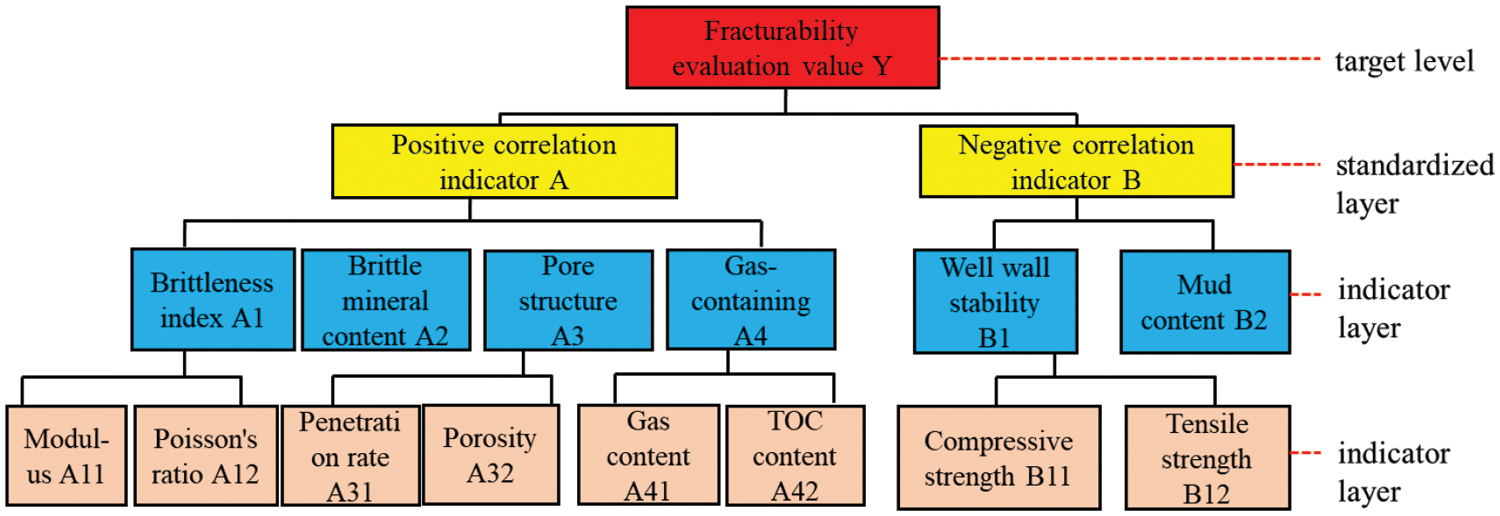
Figure 2: A recursive hierarchical model of fracturability for horizontal mud shale wells
3 Numerical Implementation Process
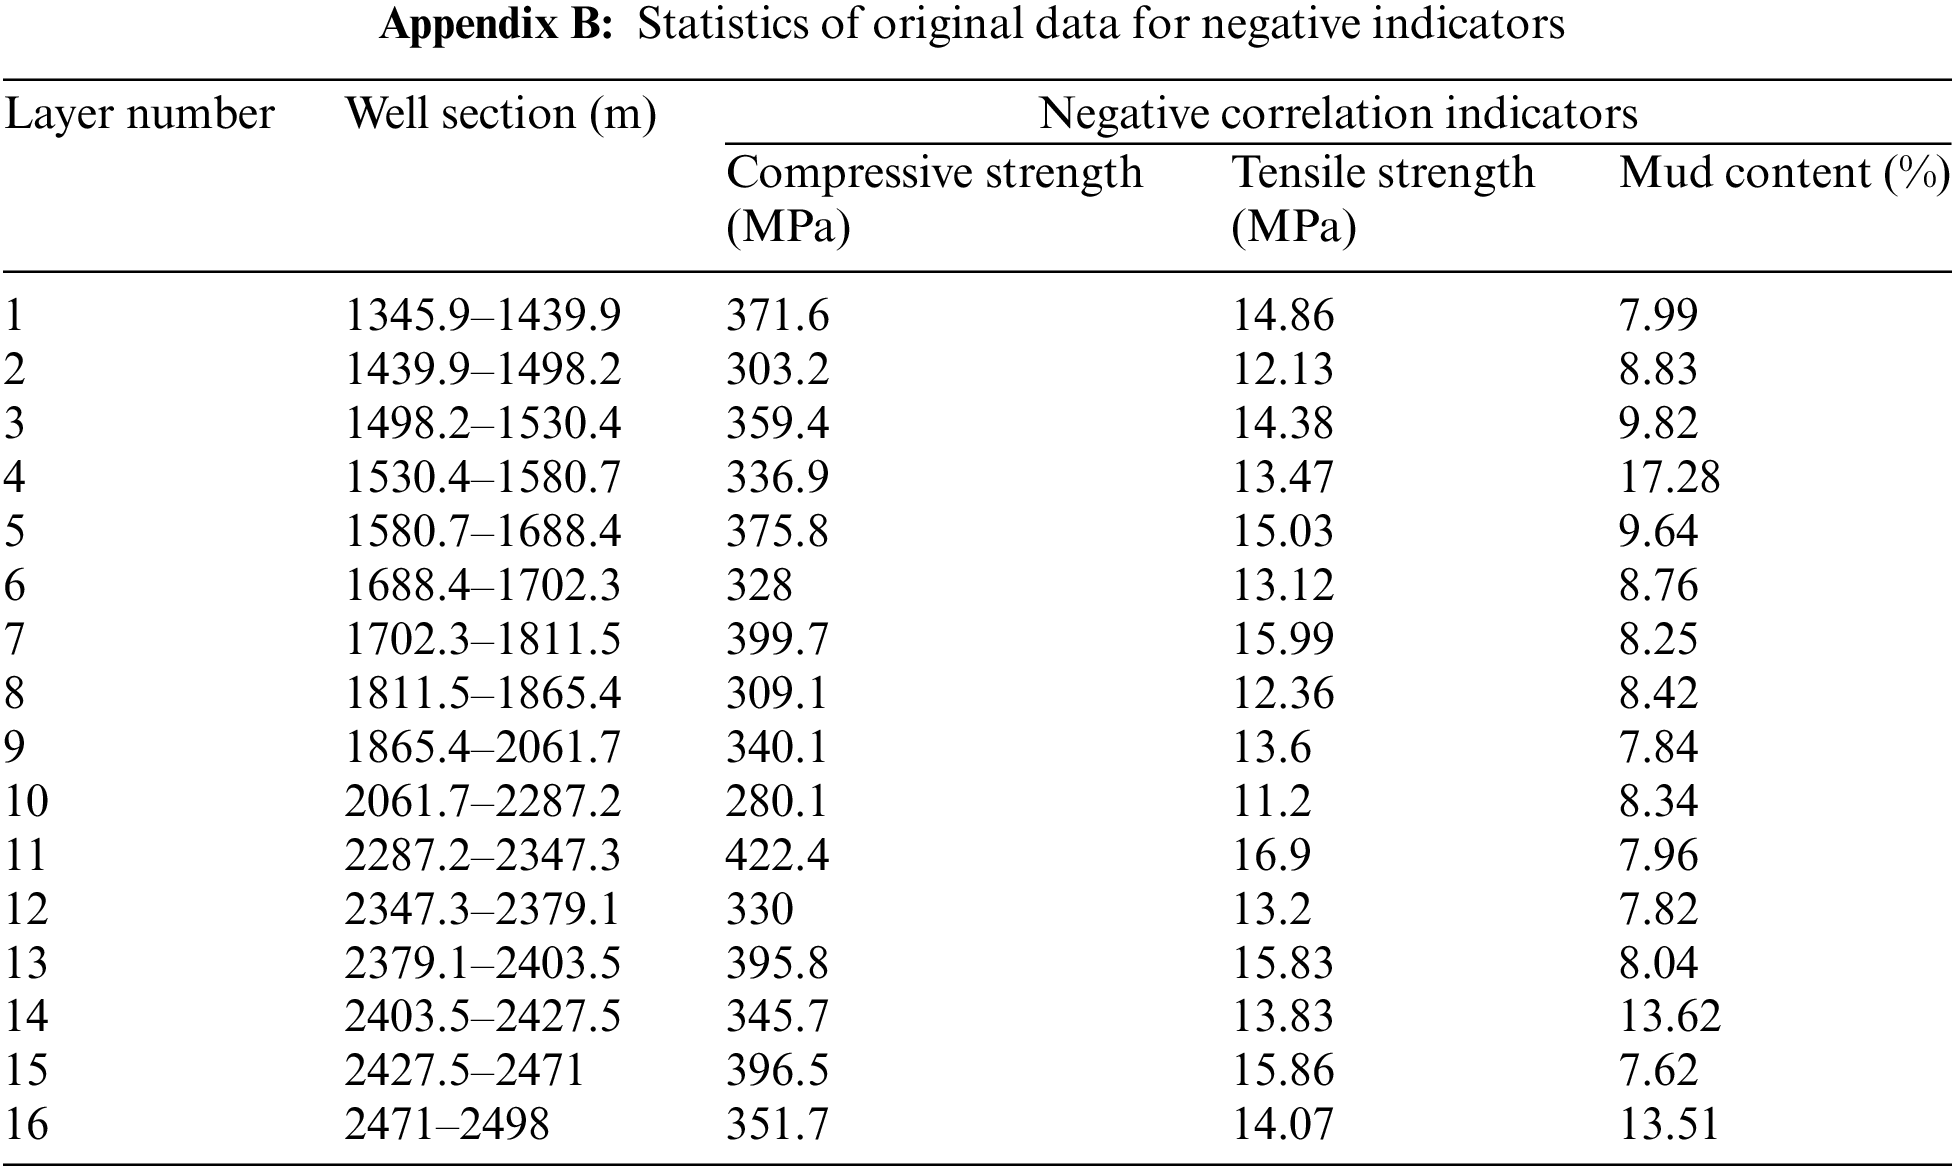
3.1 Statistics of Original Data for Positive and Negative Indicators
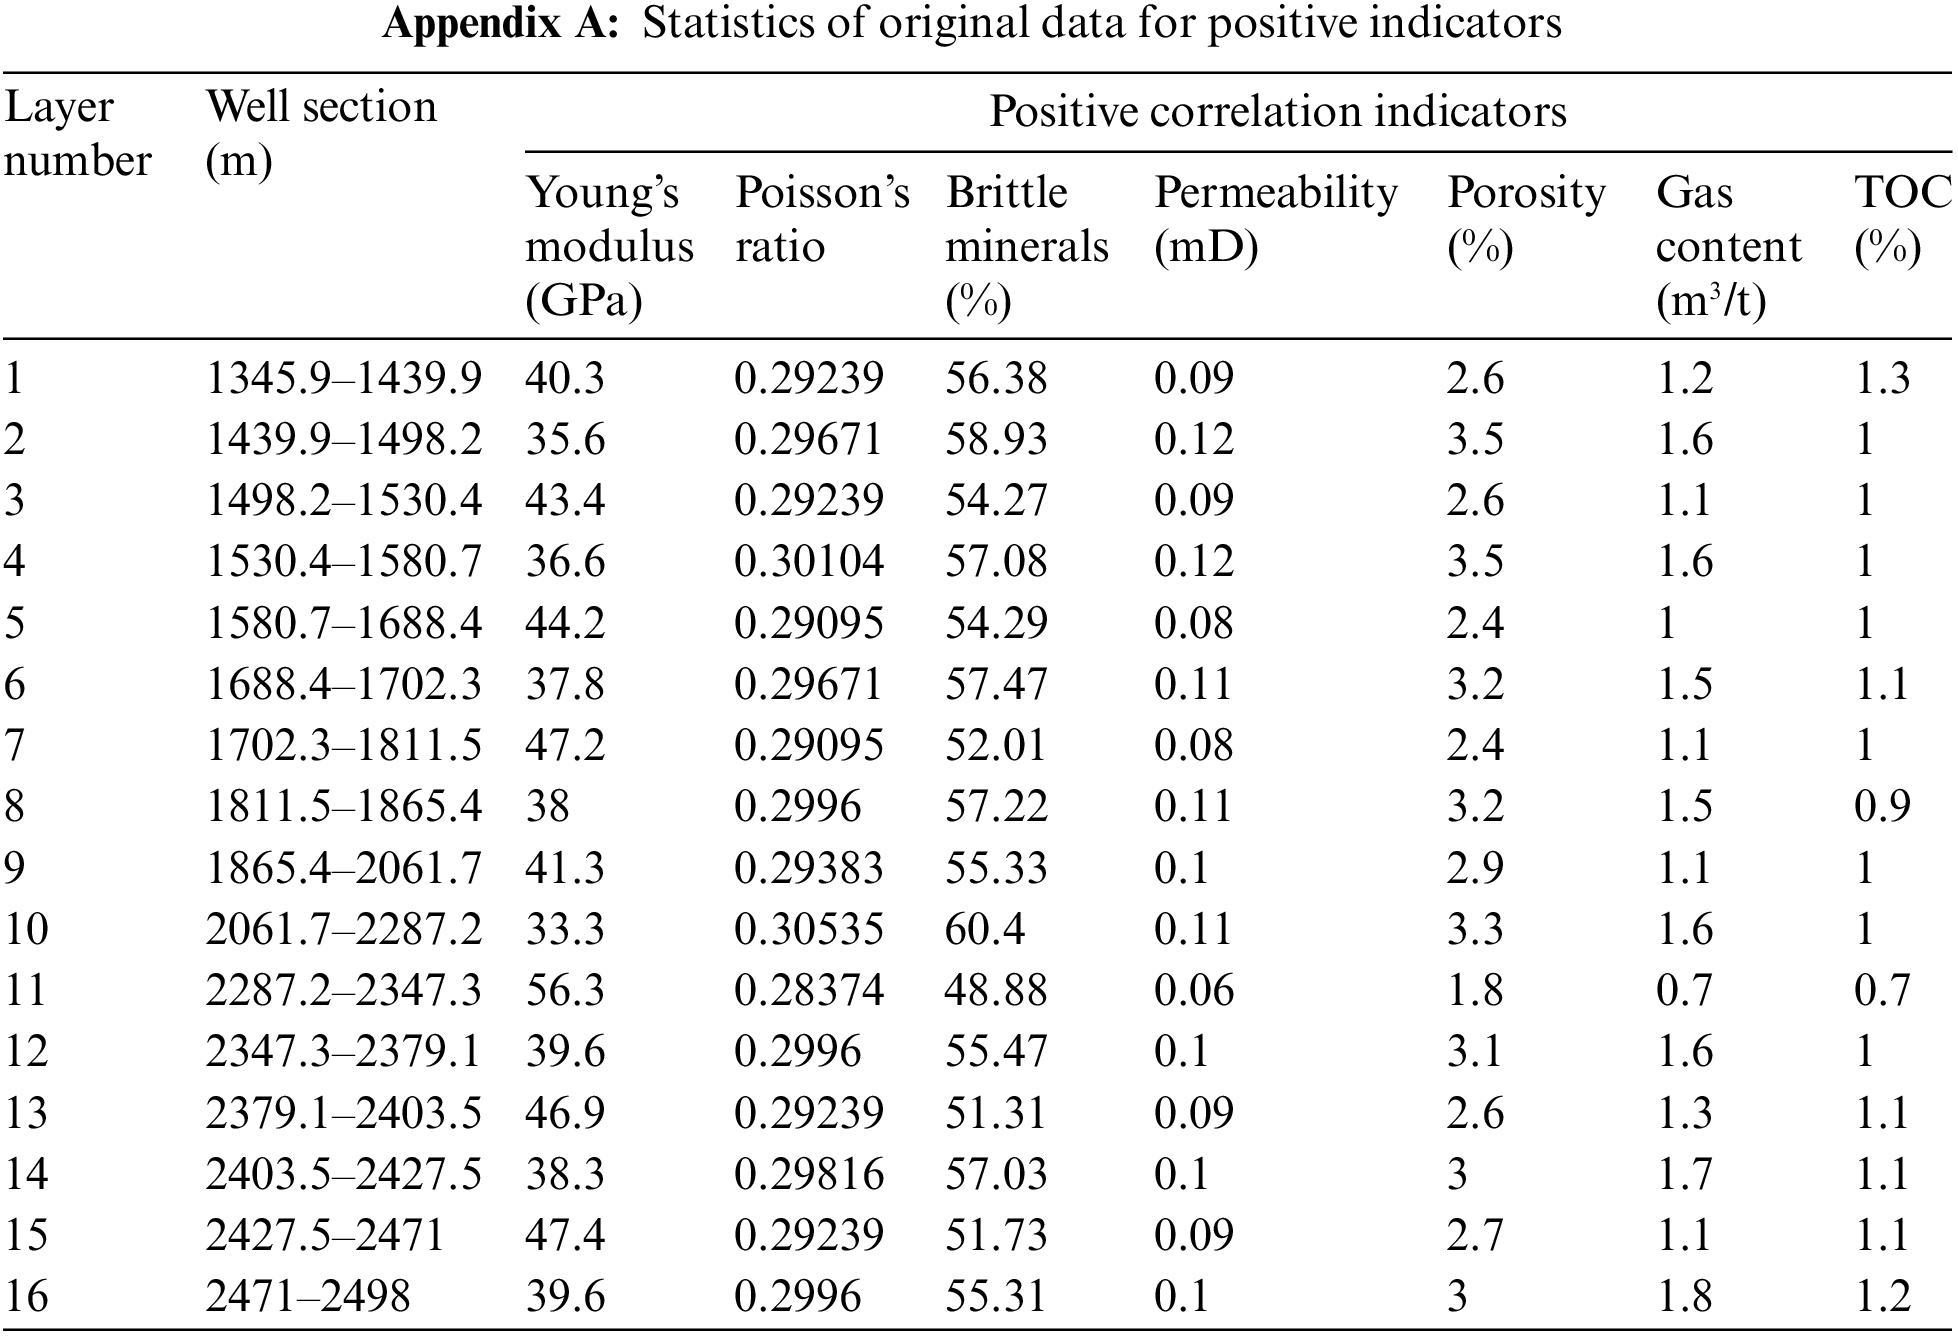
The results of the original evaluation parameters calculated from well logging data are shown in Appendixes A and B.
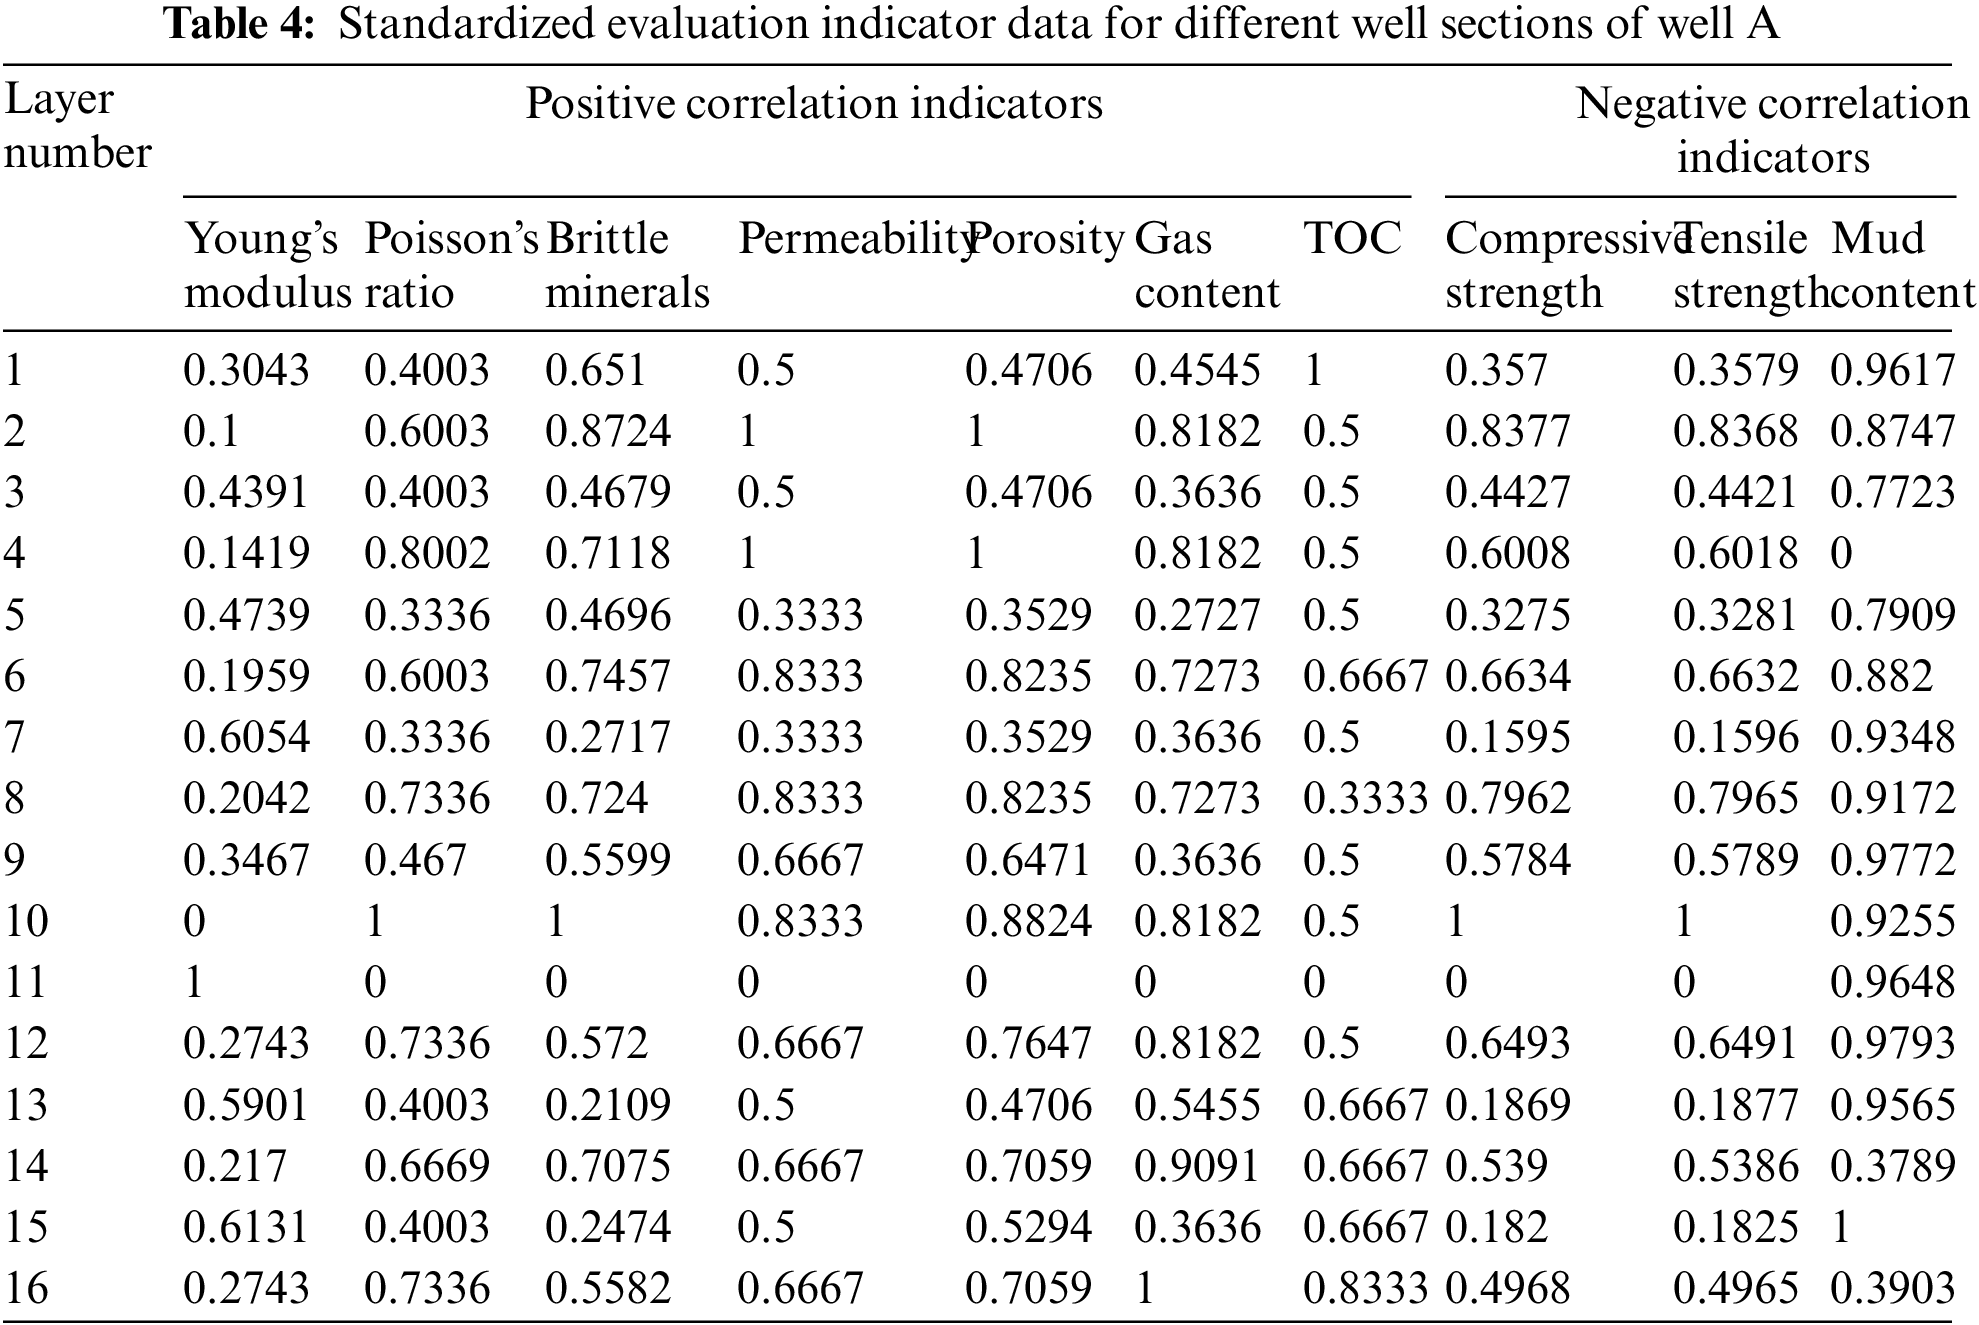
Due to the different dimensions of the evaluation parameters, it is necessary to standardize the data based on the classification of positive and negative correlations. Eqs. (16) and (17) represent the formulas for positive and negative correlation processing, respectively.
The processed data is shown in Table 4:
3.3 Using Mutation Theory to Calculate Fracturability Index
To facilitate the understanding of the calculation method proposed in this paper, we will use the first layer as an example. Based on the relevant evaluation principles and following the hierarchy of the target layer, criterion layer, and indicator layer, we will calculate the system’s mutation membership values step by step. The specific calculation steps are as follows:
(1) Calculate the system’s mutation membership values for the indicator layer
Based on the hierarchical relationship previously presented, A11 and A12 constitute the cusp mutation model. Calculate the brittleness index A1 using Eq. (13):
The remaining constituent functions of the indicator layer’s mutation functions can be calculated using the formulas mentioned above.
(2) Calculating the system’s mutation membership functions for the criteria layer
The process of calculating the mutation membership functions for the criteria layer’s positive indicator A and brittleness index A1, as well as brittleness mineral content A2, reservoir porosity and permeability parameters A3, and gas content A4, which form the butterfly model, is as follows according to Eq. (15):
The calculation of the negative indicator B for the criteria layer, along with rock wellbore stability B1 and clay mineral content B2, which constitute the cusp mutation model, can be obtained using Eq. (13):
(3) Calculate the final fracturability evaluation factor
The calculation of the system’s catastrophic change membership function value for the target layer S can be obtained by considering S along with the positive indicator A and negative indicator B, which constitute the cusp mutation model. Based on the principles of interplay between criteria layers and the complementary relationship between criteria layers and the target layer, as outlined in the evaluation criteria, we can derive the first layer comprehensive fracturability assessment value S:
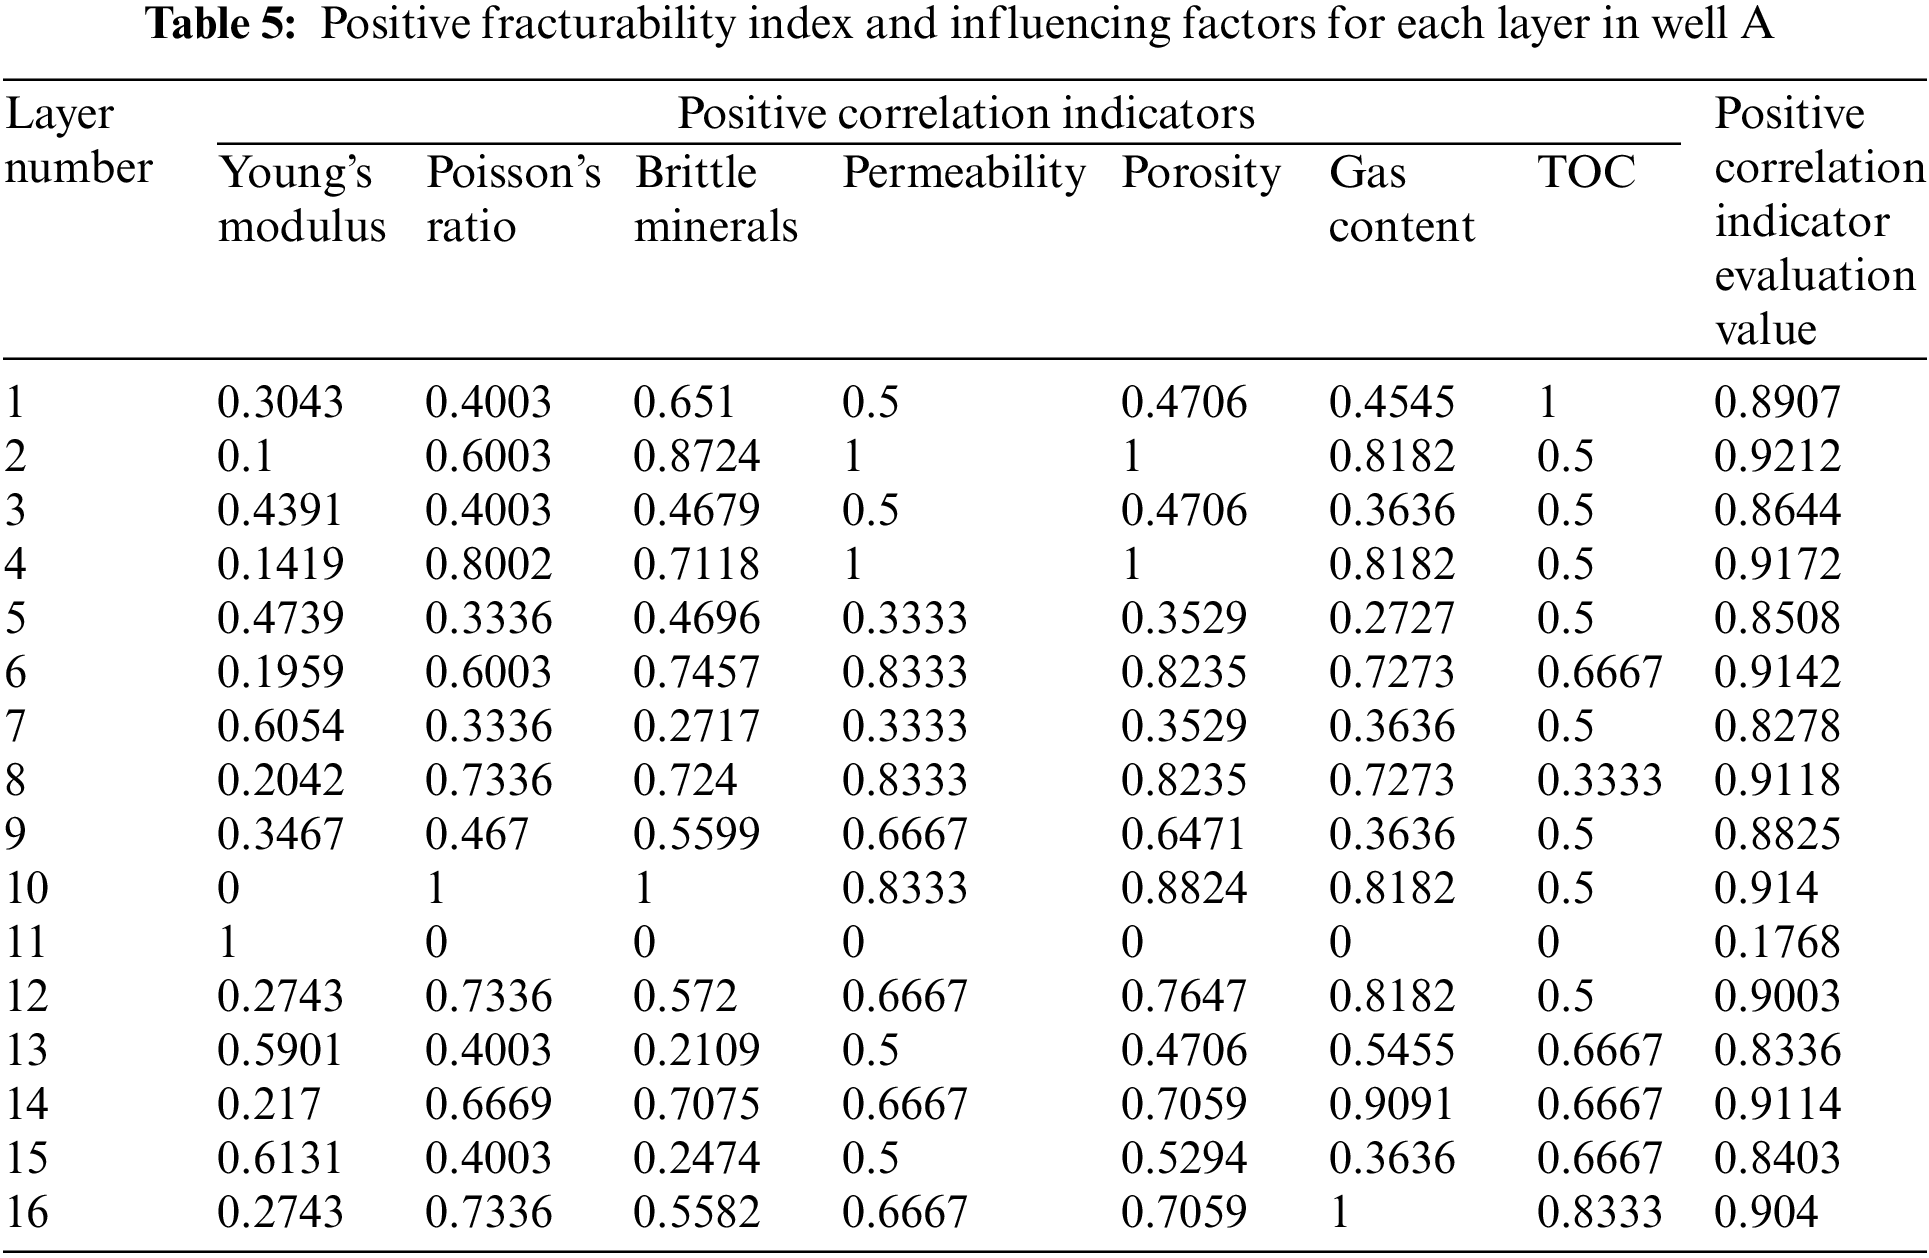
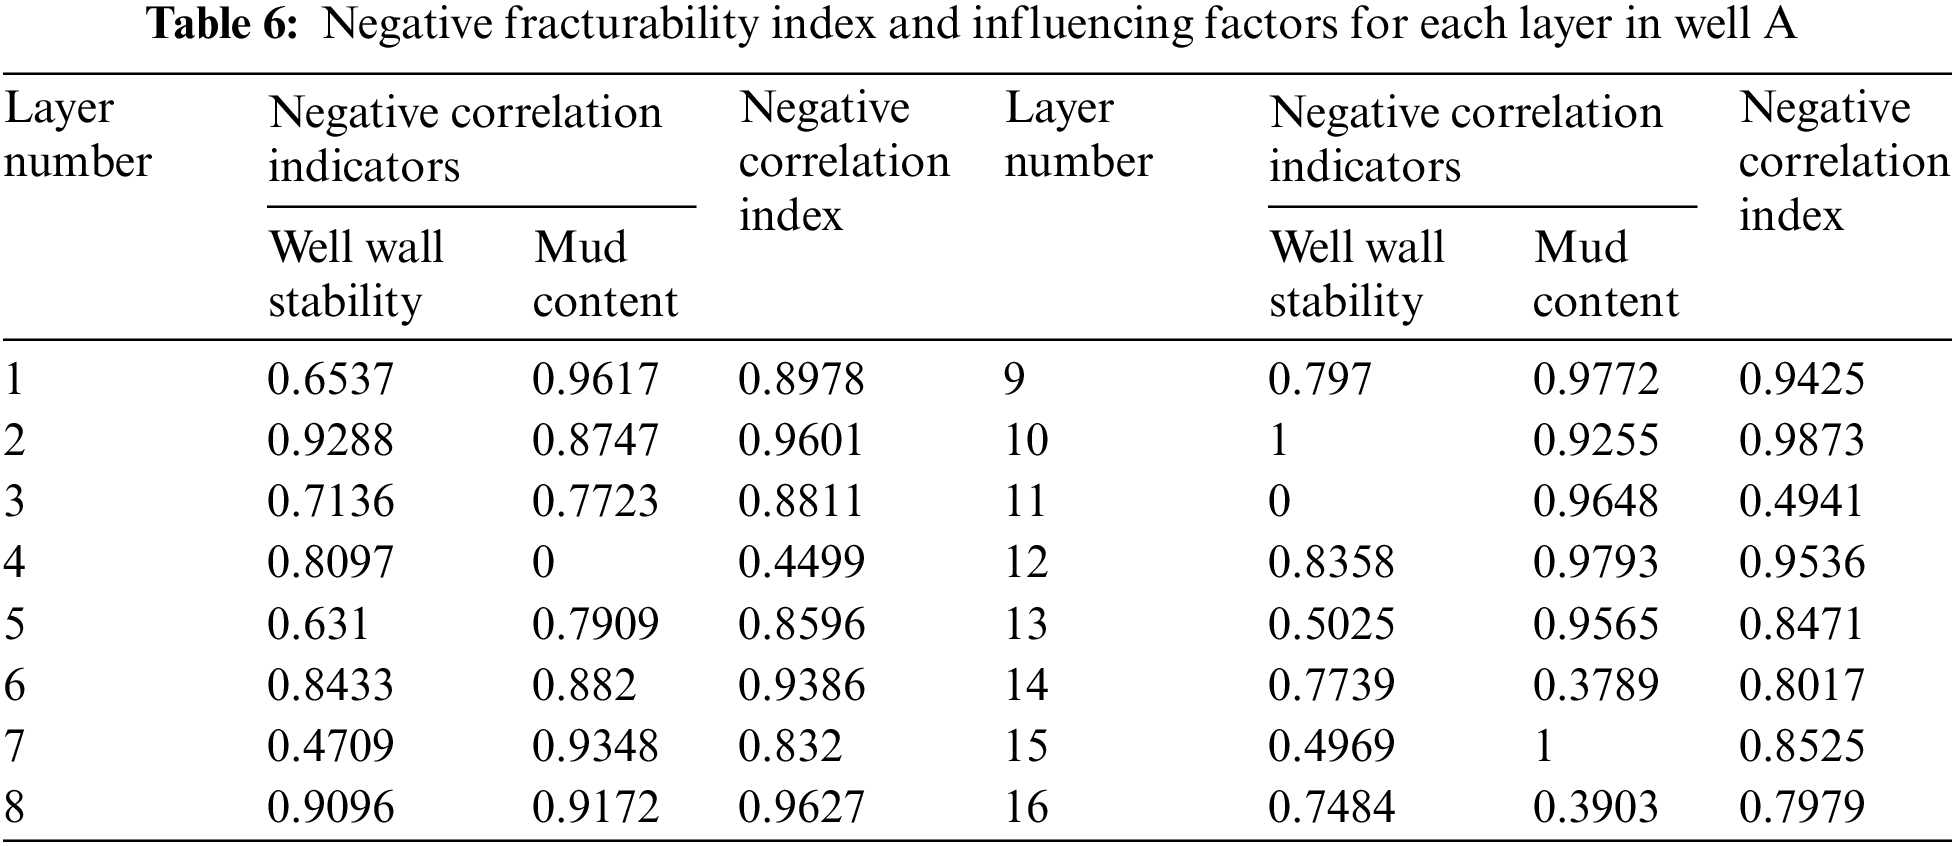
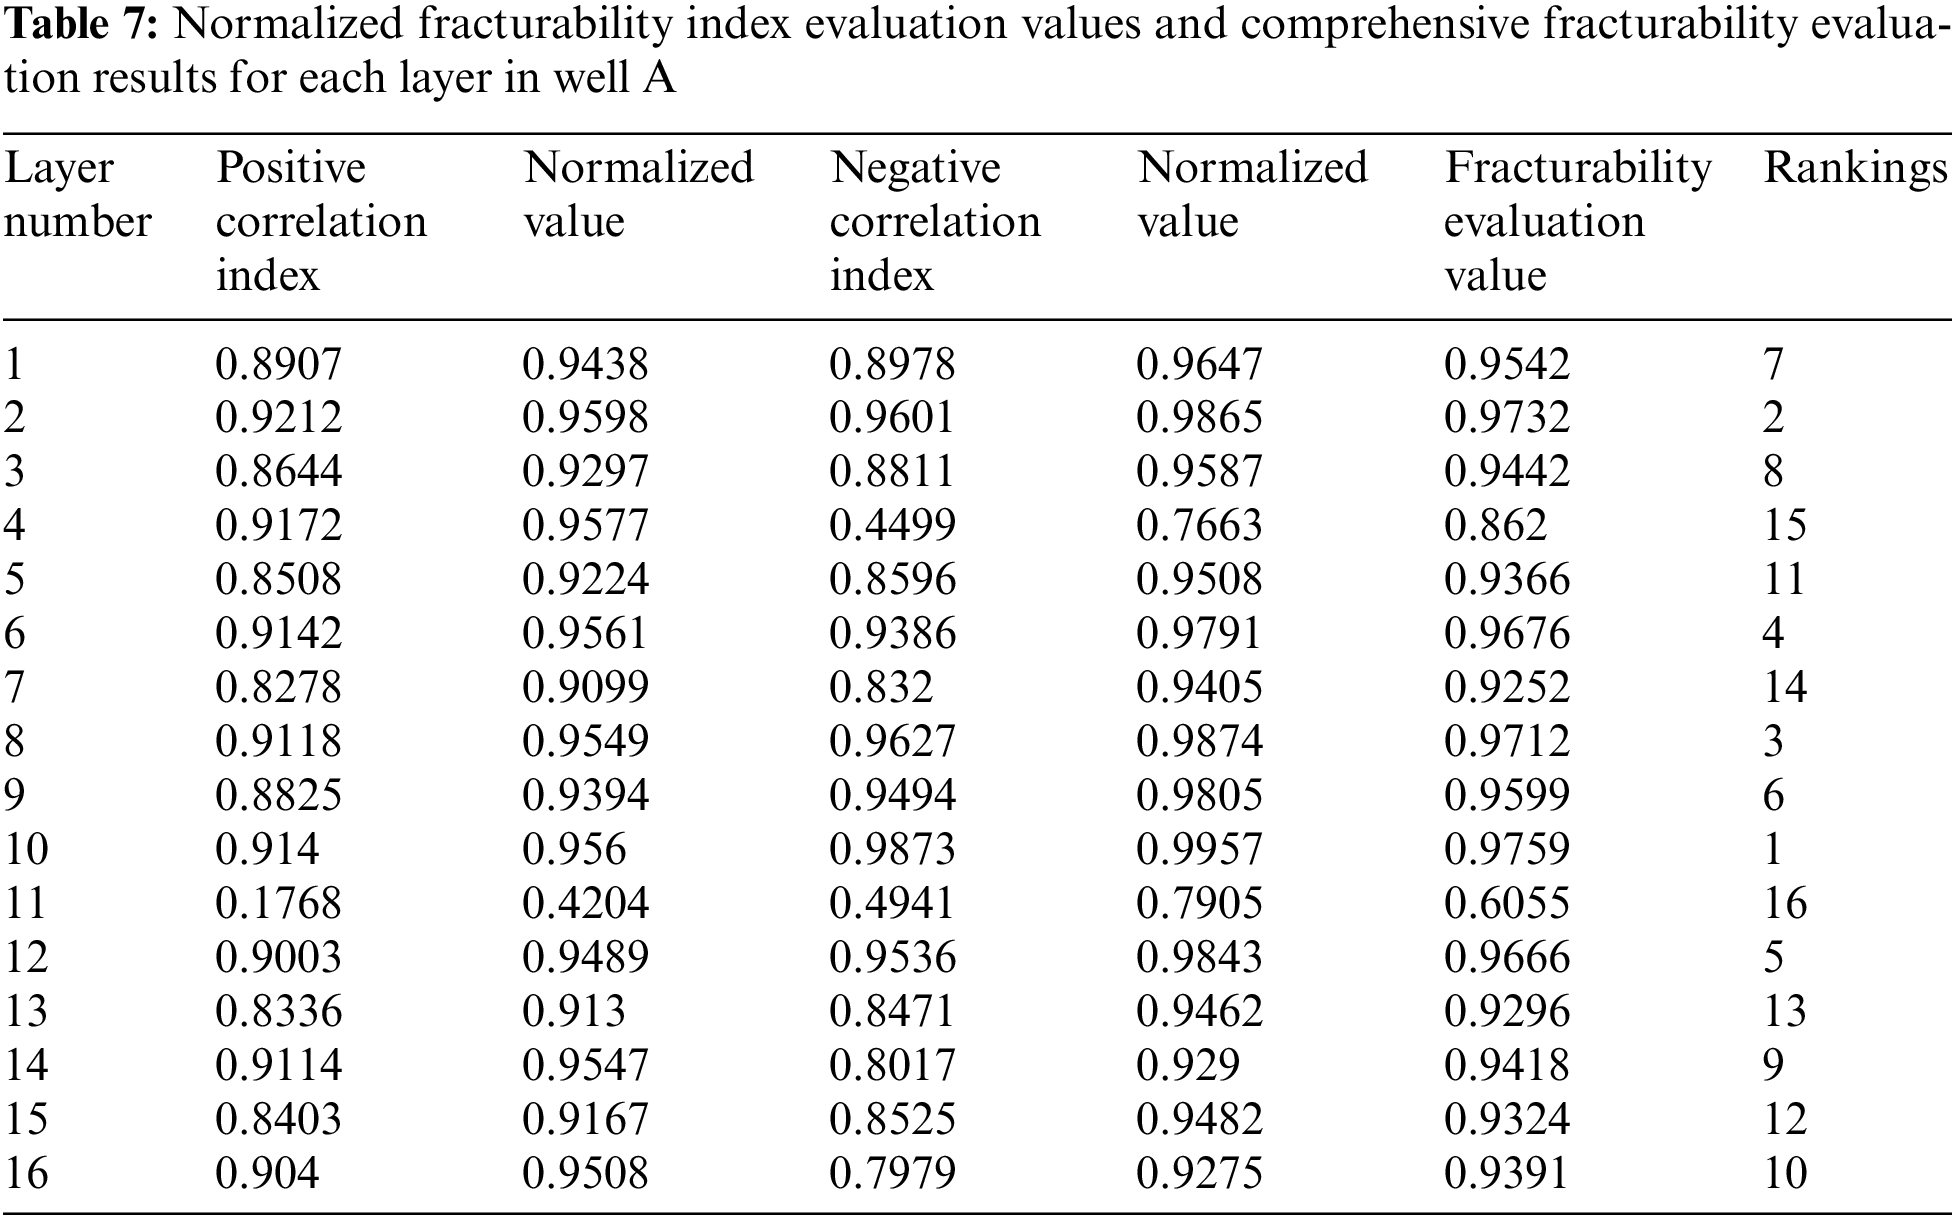
In the established model, the principles of the mutation model are satisfied between upper and lower levels. Therefore, the same method can be used to calculate the positive and negative evaluation indicators between different layers and the comprehensive fracturing coefficient evaluation values following the steps. The final results of the calculations are shown in Tables 5 to 7.
4 Modeling Results and Discussion
4.1 Comparison and Verification of Model Computation Results with Logging Interpretation by the Construction Party
Since the well is currently only in the logging phase and has not been put into production, it is not possible to compare production with calculation results. Therefore, we compared the ranking of the calculated fracturability evaluation values with the actual interpretation results obtained by the construction party during logging. It can be seen that the top 5 ranked intervals are all interpreted as gas reservoirs with a reservoir type of Class II. In contrast, among the intervals ranked from 6th onwards, 5 intervals are interpreted as gas-bearing layers with a reservoir type of Class III. The verification results confirm the accuracy and applicability of this method. The specific data is shown in Table 8.
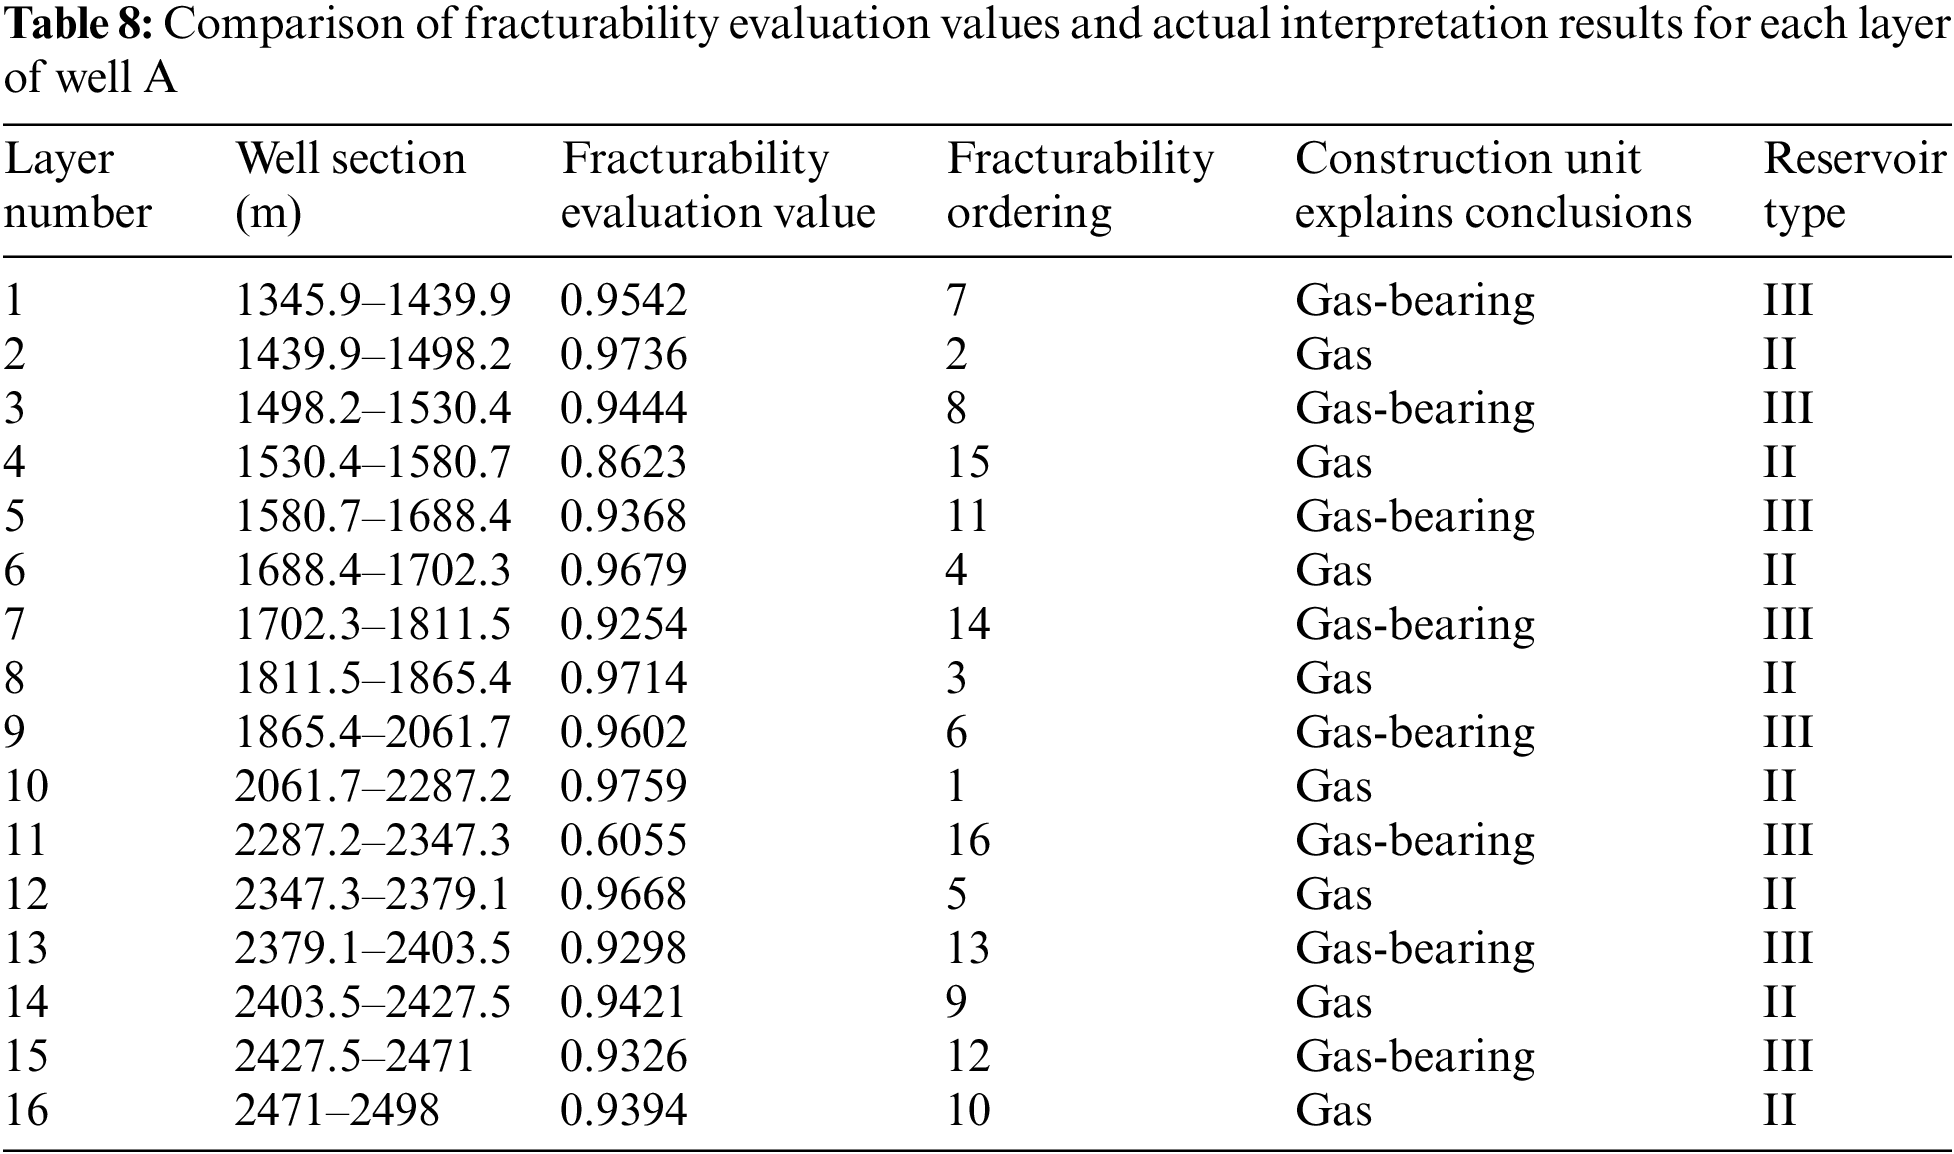
From the final calculation results, it can be observed that layers 10, 2, 8, 6, and 12 exhibit higher fracturability levels. Referring to Appendix A, it can be noted that these thinner layers have a brittle mineral content of ≥55%, clay content of <10%, tensile strength ≤330 MPa, gas content ≥1.5%, porosity ≥3.1%, and permeability ≥0.1 mD. However, it is worth noting that the commonly used criterion for evaluating brittleness, Young’s modulus, does not necessarily exhibit the highest values when comparing these layers. This suggests that the fracturability of reservoirs cannot be solely evaluated based on the brittleness index, and establishing a model that includes both positive and negative influencing factors provides a more accurate assessment of reservoir fracturability.
As delineated in Fig. 3, a degree of association is evident between the model’s computational results and the positive indicators, namely Young’s modulus, Poisson’s ratio, and the brittleness index. However, it is noteworthy that the coefficient of determination (R2) values associated with these correlations are not particularly robust.
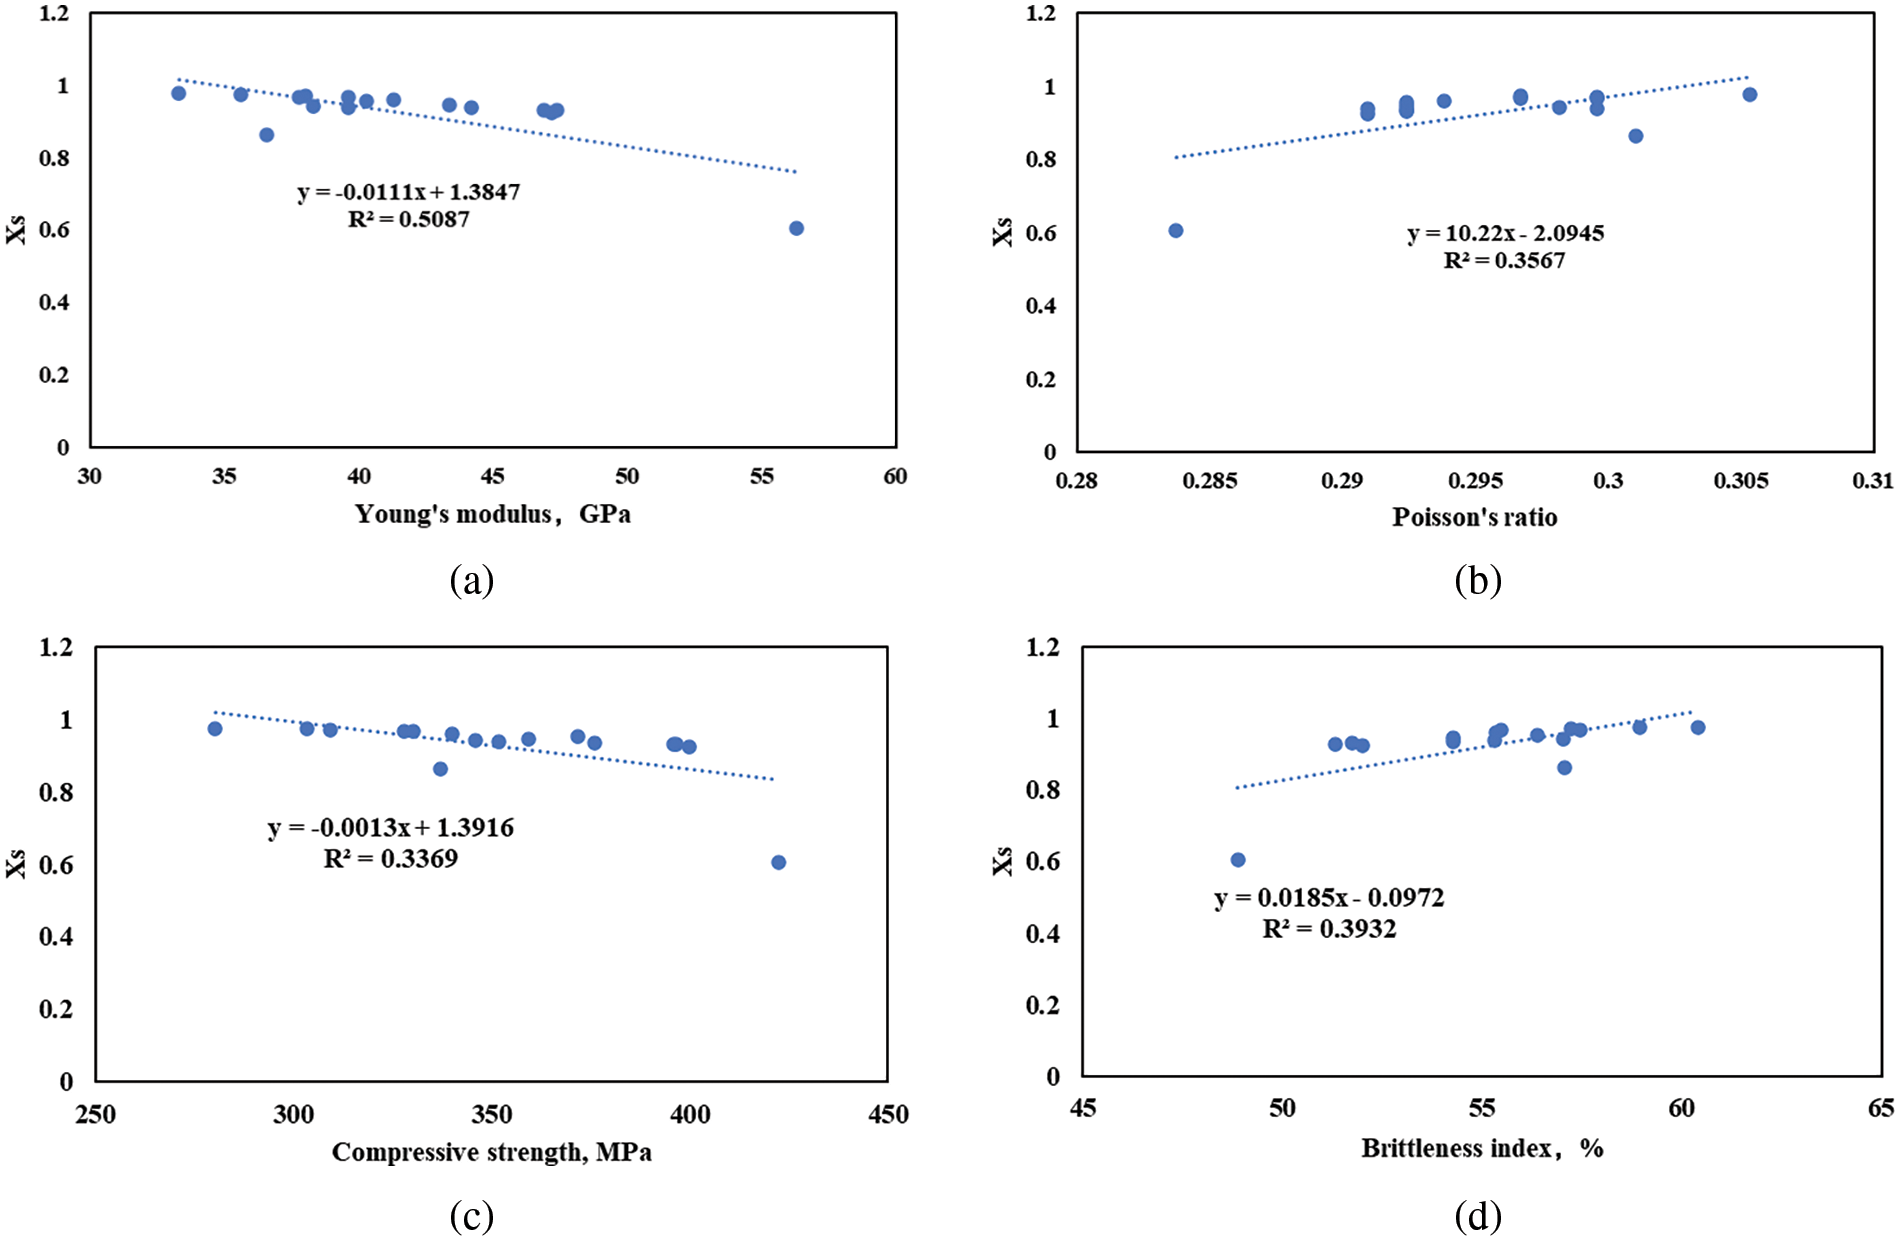
Figure 3: Correlation of some evaluation metrics with model calculations, (a) Young’s modulus, (b) Poisson’s ratio, (c) compressive strength, (d) brittleness index
This observation lends credence to the assertion that relying solely on conventional geological or engineering indices to ascertain the fracturability sweet spot is insufficient. The nuanced nature of these relationships underscores the complexity inherent in accurately predicting fracturability sweet spots. For example, there is an outlier in Fig. 3, a section with a Young’s modulus of 56.3 GPa and a gas content of only 0.7 m3/t, which is ranked last in the calculations. Consequently, this reinforces the need for a more comprehensive and integrated approach, such as that offered by our model, which goes beyond traditional indicators to enhance the precision and reliability of fracturability assessments in unconventional reservoirs.
The two-step mutation model utilized to calculate factors affecting fracturability and create a comprehensive fracturability index enables the plotting of evaluation parameter variations with depth, as depicted in Fig. 4. This figure clearly illustrates horizontal and vertical comparisons between different layers. The analysis indicates that layers with lower rankings in the comprehensive fracturability index correspond to lower values in their curves when integrating selection results with evaluation parameter trends.
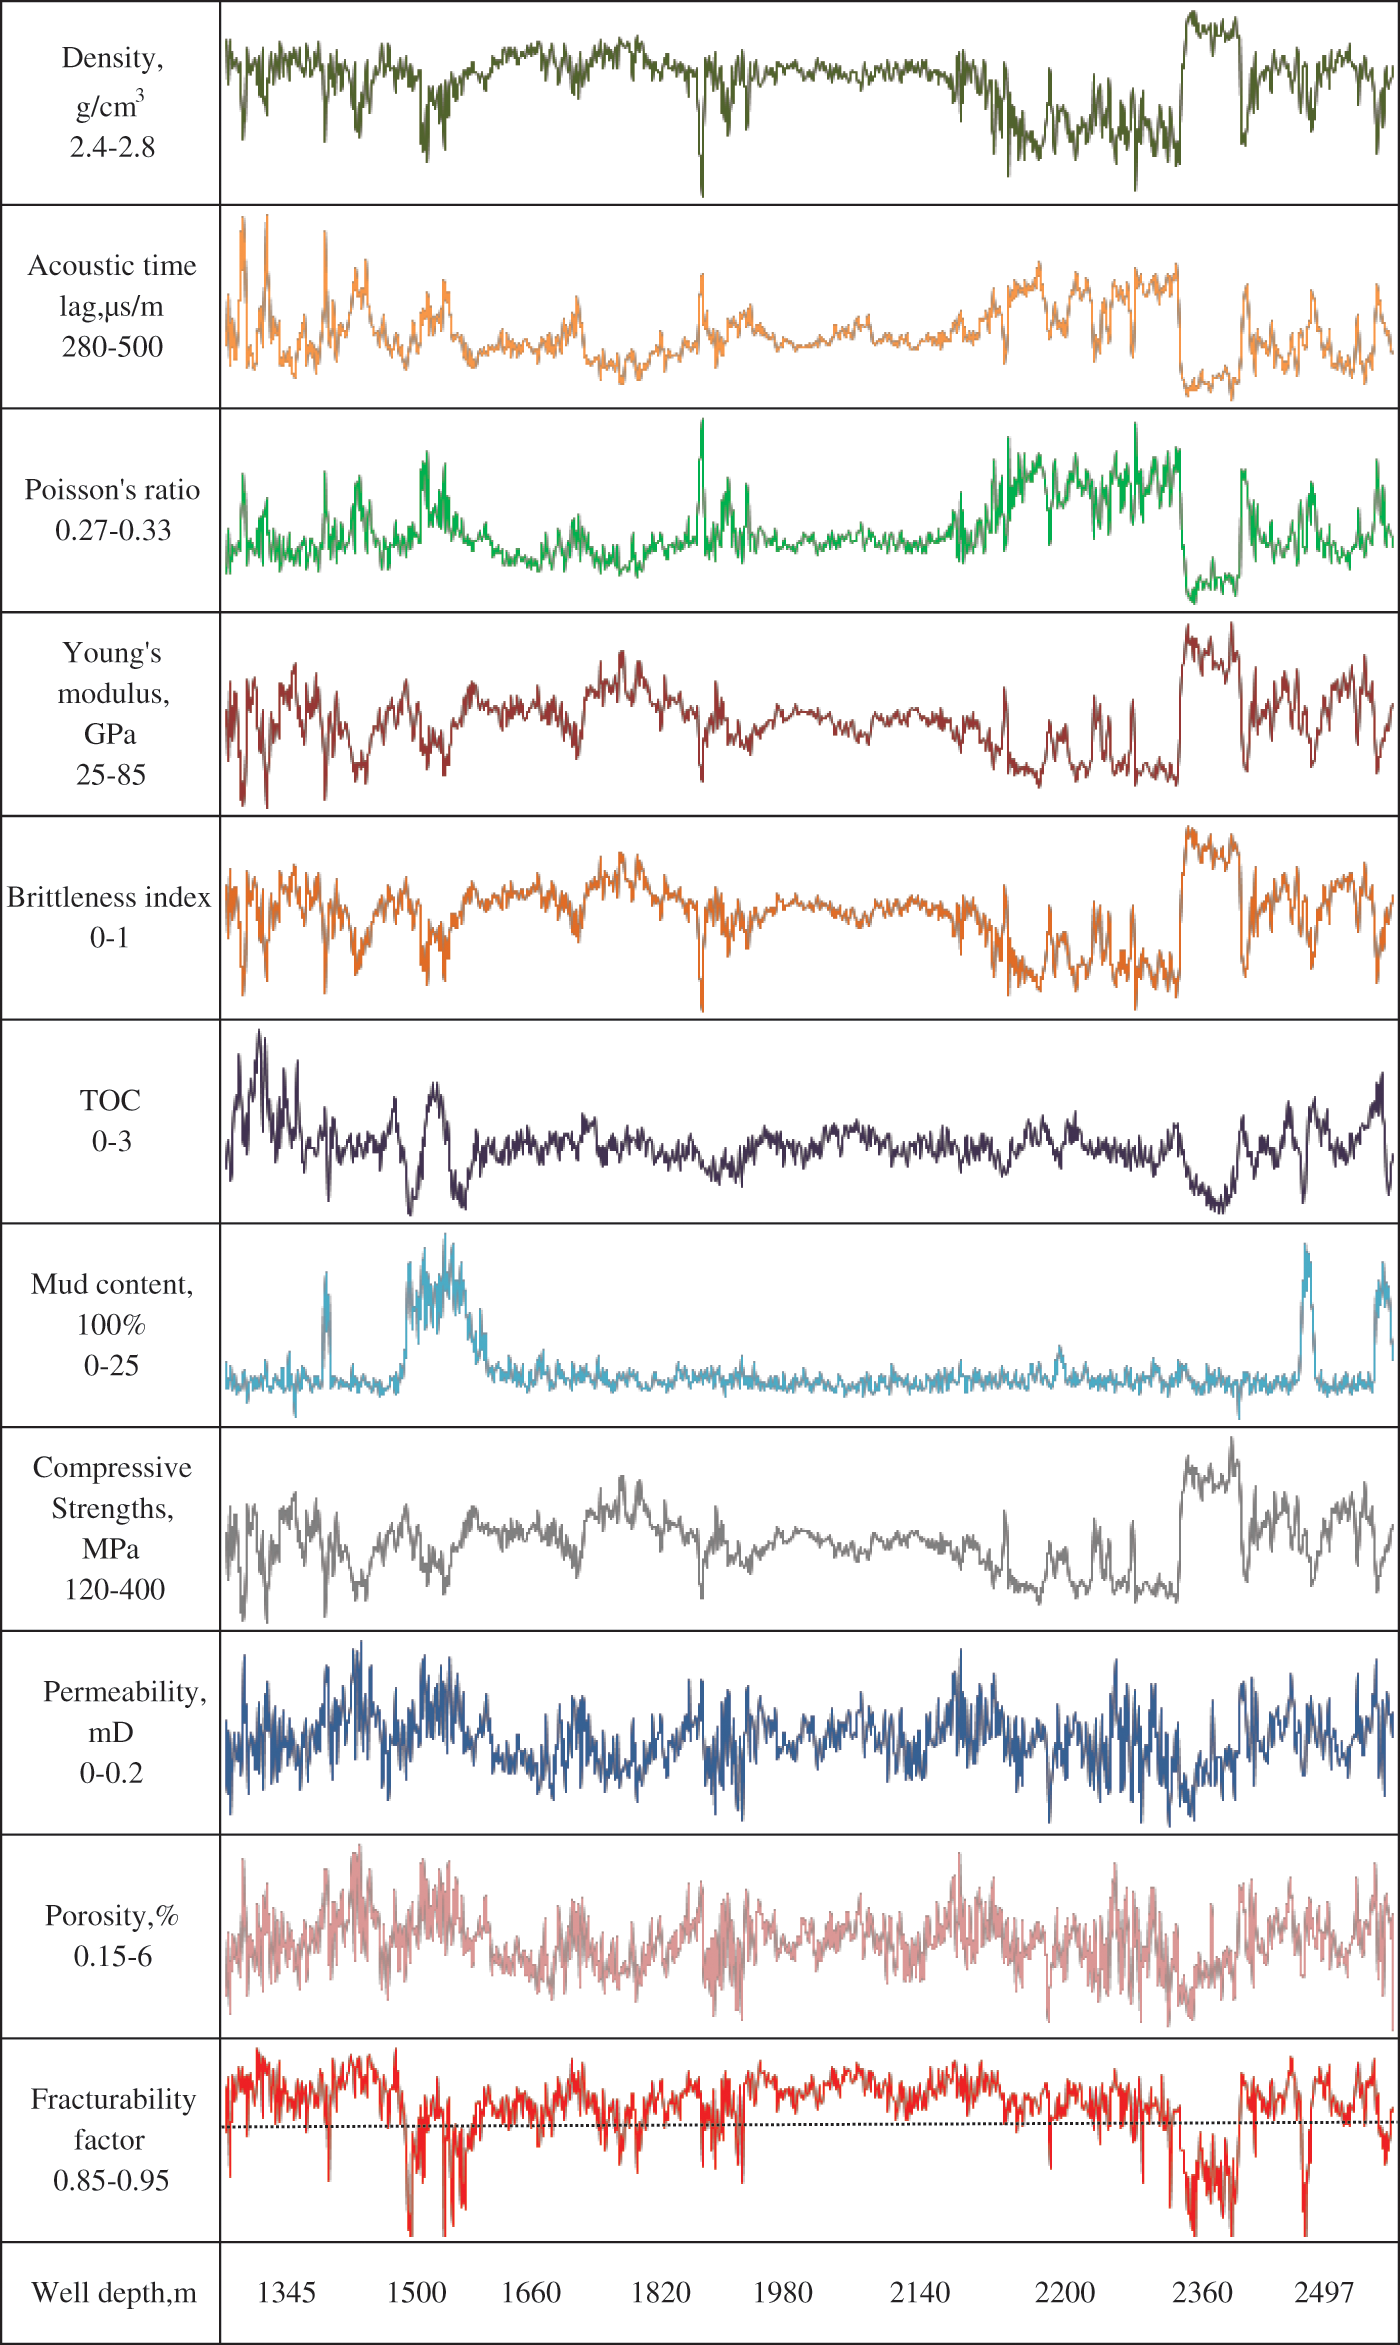
Figure 4: Parameter map of fracturability evaluation indices for well A in the fuling area
Between 2287.2 and 2347.3 m, the low values of gas content, TOC, and horizontal principal stress difference hinder fracturing operations, despite the high Young’s modulus and low clay mineral content. Similarly, between 1530.4 and 1580.7 m, fracturing operations are impeded by the low Young’s modulus, natural gamma, and high clay mineral content, despite the high TOC and horizontal principal stress difference. In the interval from 1811.5 to 1865.4 m, Young’s modulus and TOC exhibit medium to high values, while natural gamma and Poisson’s ratio exhibit relatively low values. These indicators align well with the preferred criteria for fracturability, indicating a high level of fracturability.
Based on the assessment of the comprehensive fracturability coefficient for the entire interval, a threshold of 0.91 is set as the benchmark for the optimal fracturing interval (as shown by the dashed line in Fig. 4). According to this standard, it is recommended that the optimal fracturing intervals are from 1811.5 to 2287.2 m (first priority) and from 1439.9 to 1702.3 m (second priority). It is not recommended to perform fracturing in the intervals from 1530.4 to 1580.7 m, 1702.3 to 1811.5 m, 2287.2 to 2347.3 m, and 2379.1 to 2471.0 m.
4.2 Validation of the Model in Other Developed Shale Gas Wells
To verify the non-uniqueness of this model, we selected other shale gas wells that have already been developed in different work areas. The selected blocks are located in the southern part of China, specifically in the Nanchuan work area, which consists of three blocks: PQ South Block, JY 10 Block, and DS Block. We chose one well from each of these three blocks to validate the results of the model proposed in this paper, as shown in Figs. 5 to 7.
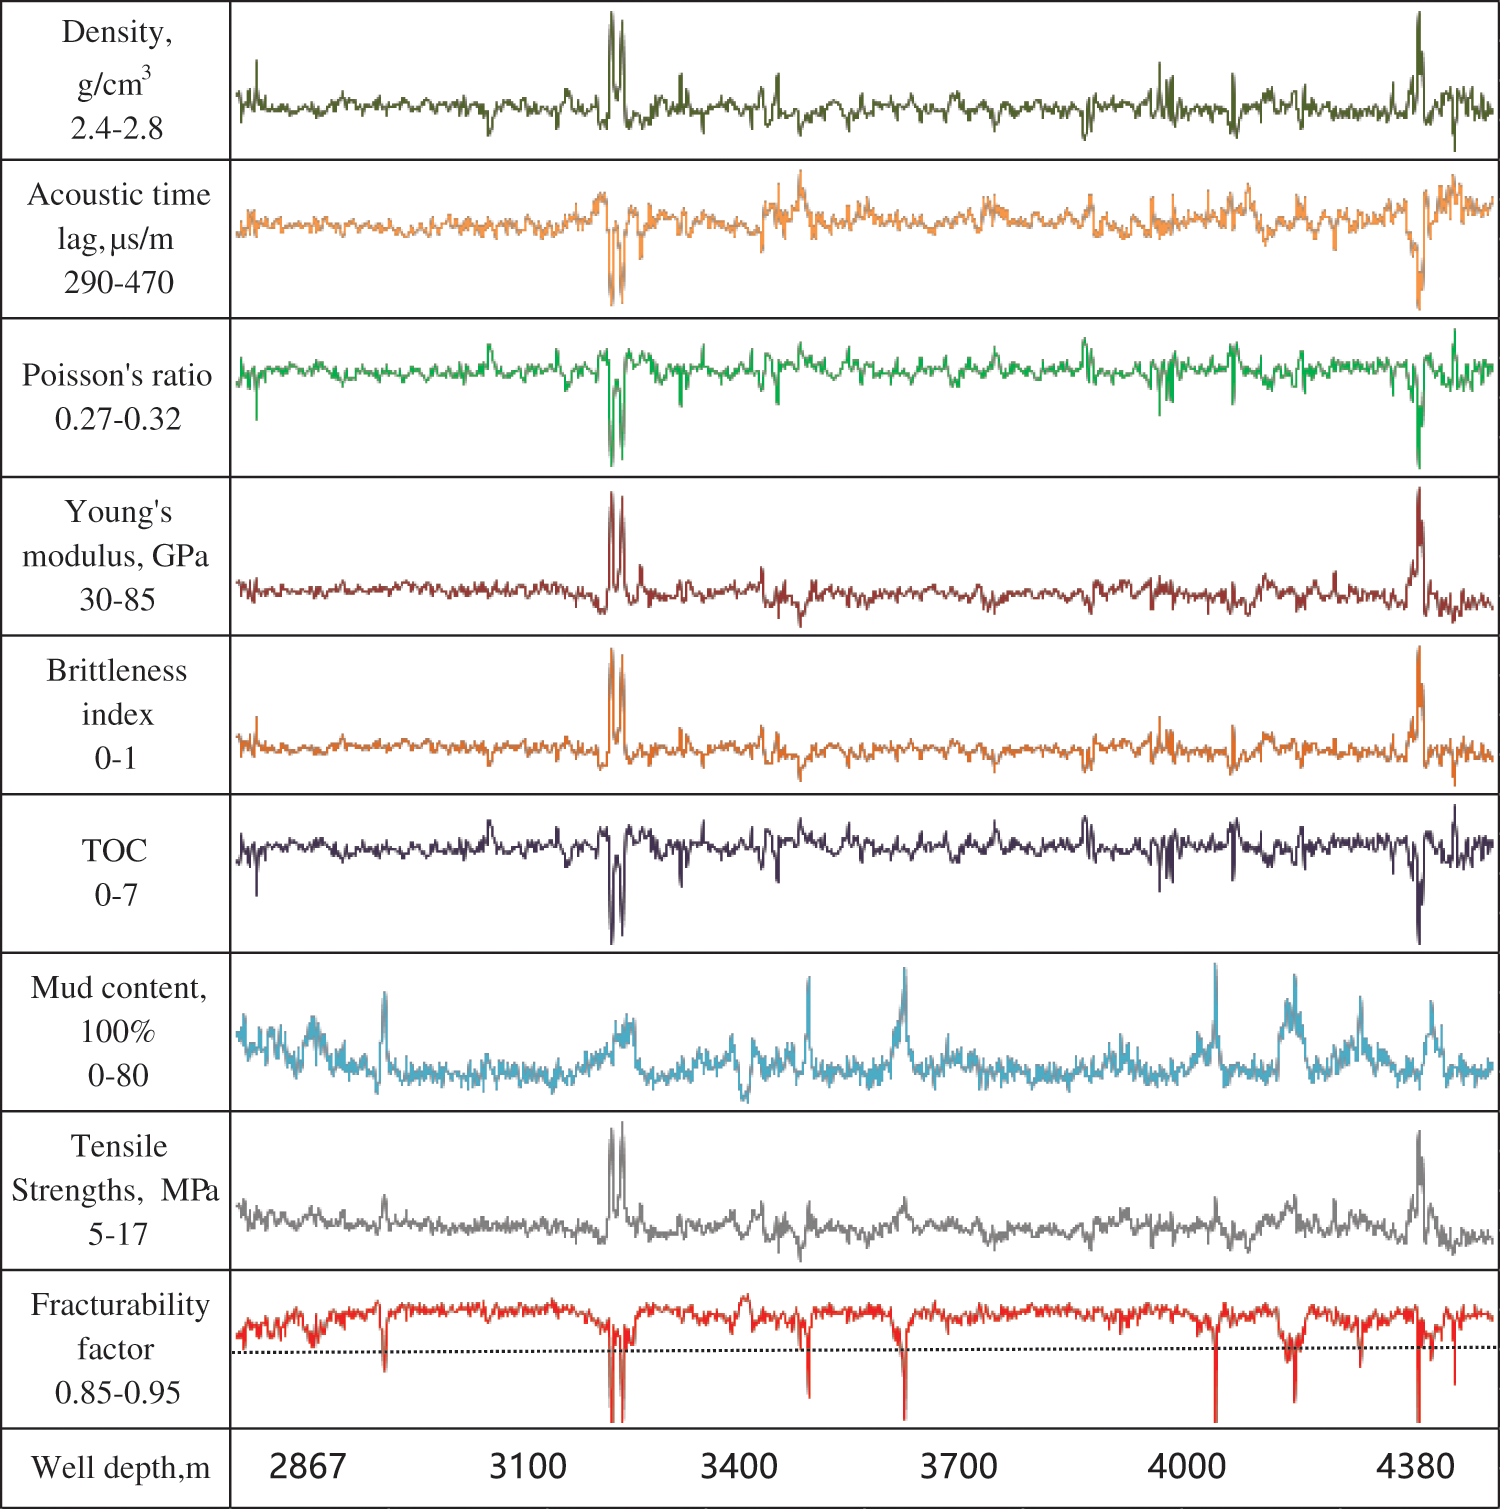
Figure 5: Fracturability evaluation index parameter map for well B in PQ block
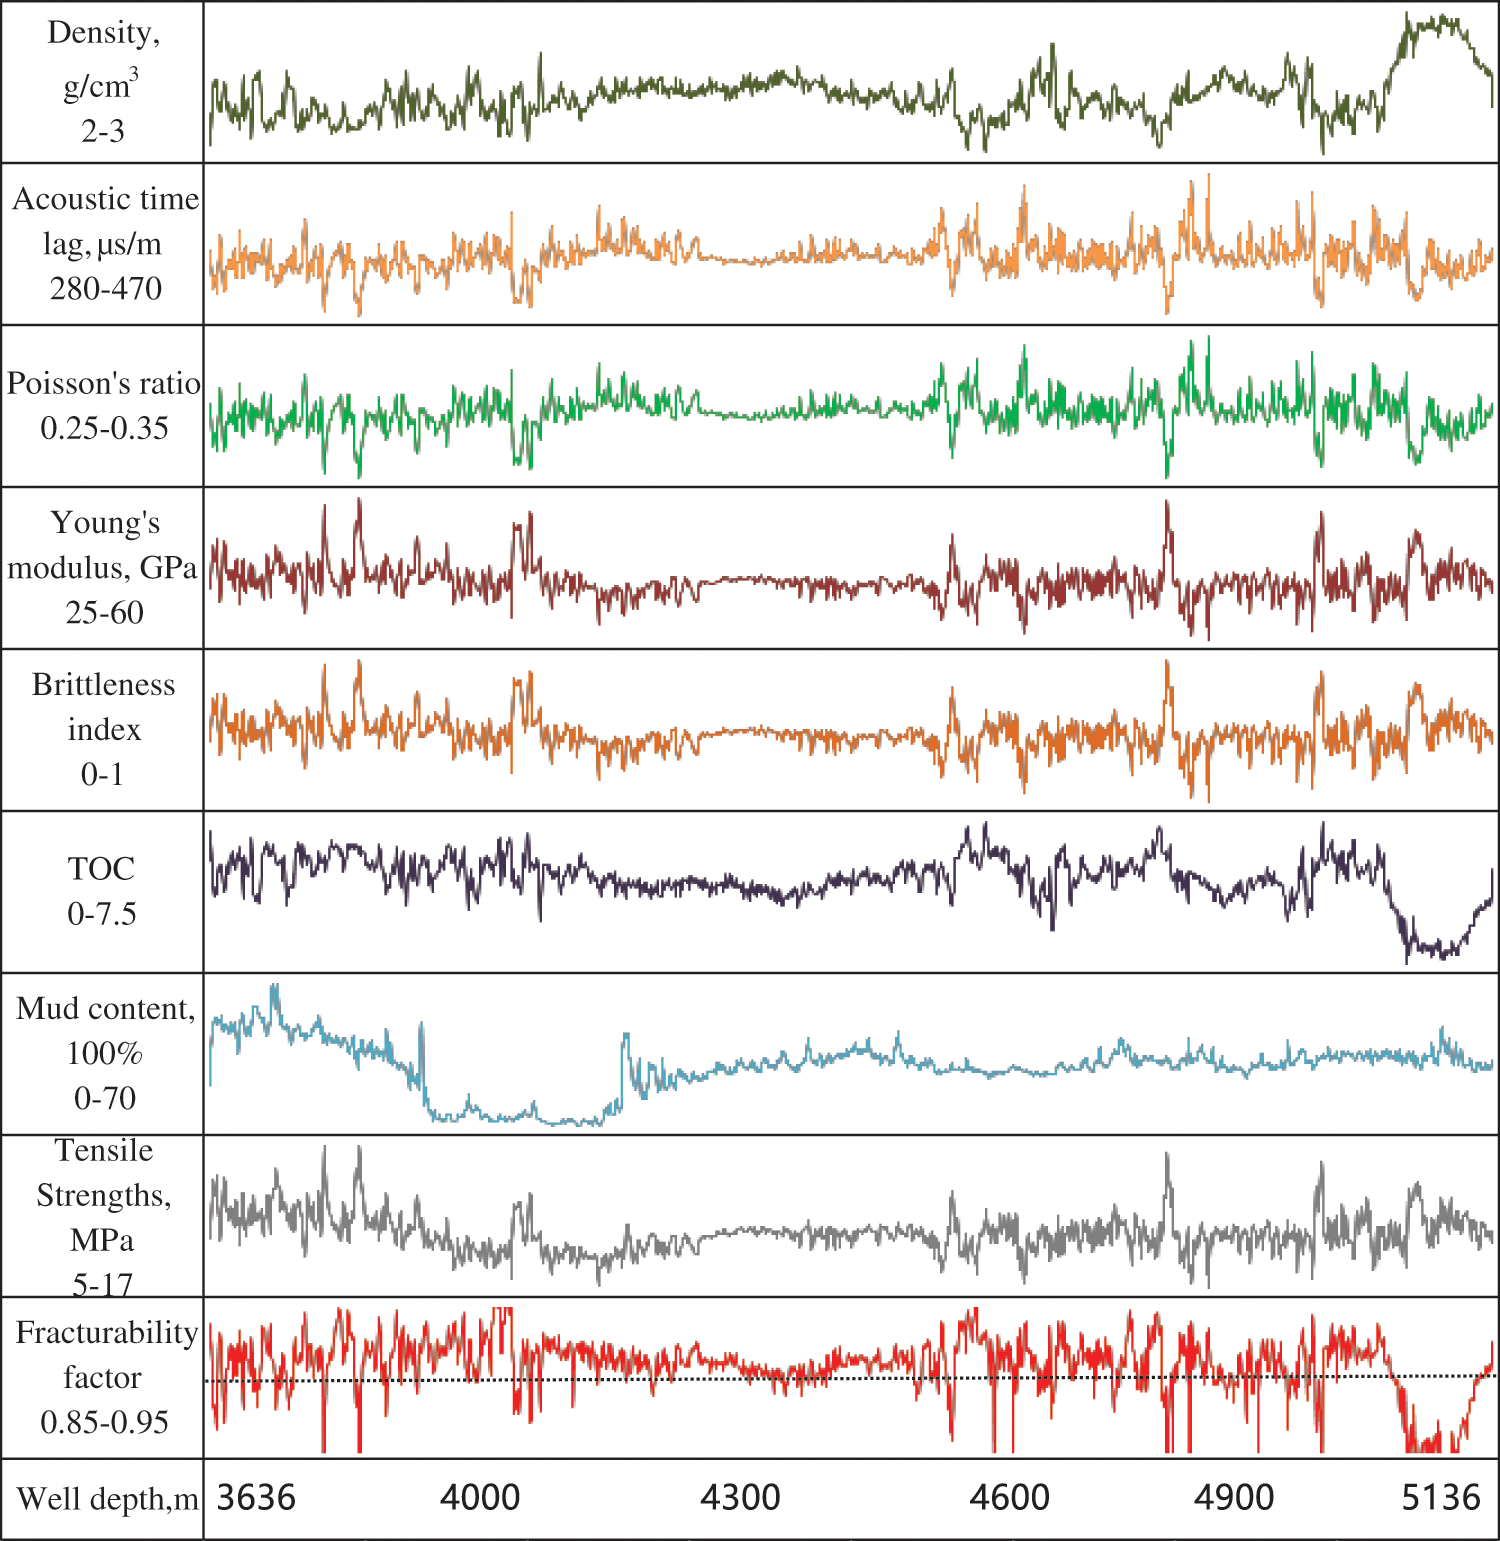
Figure 6: Fracturability evaluation index parameter map for well C in JY 10 block
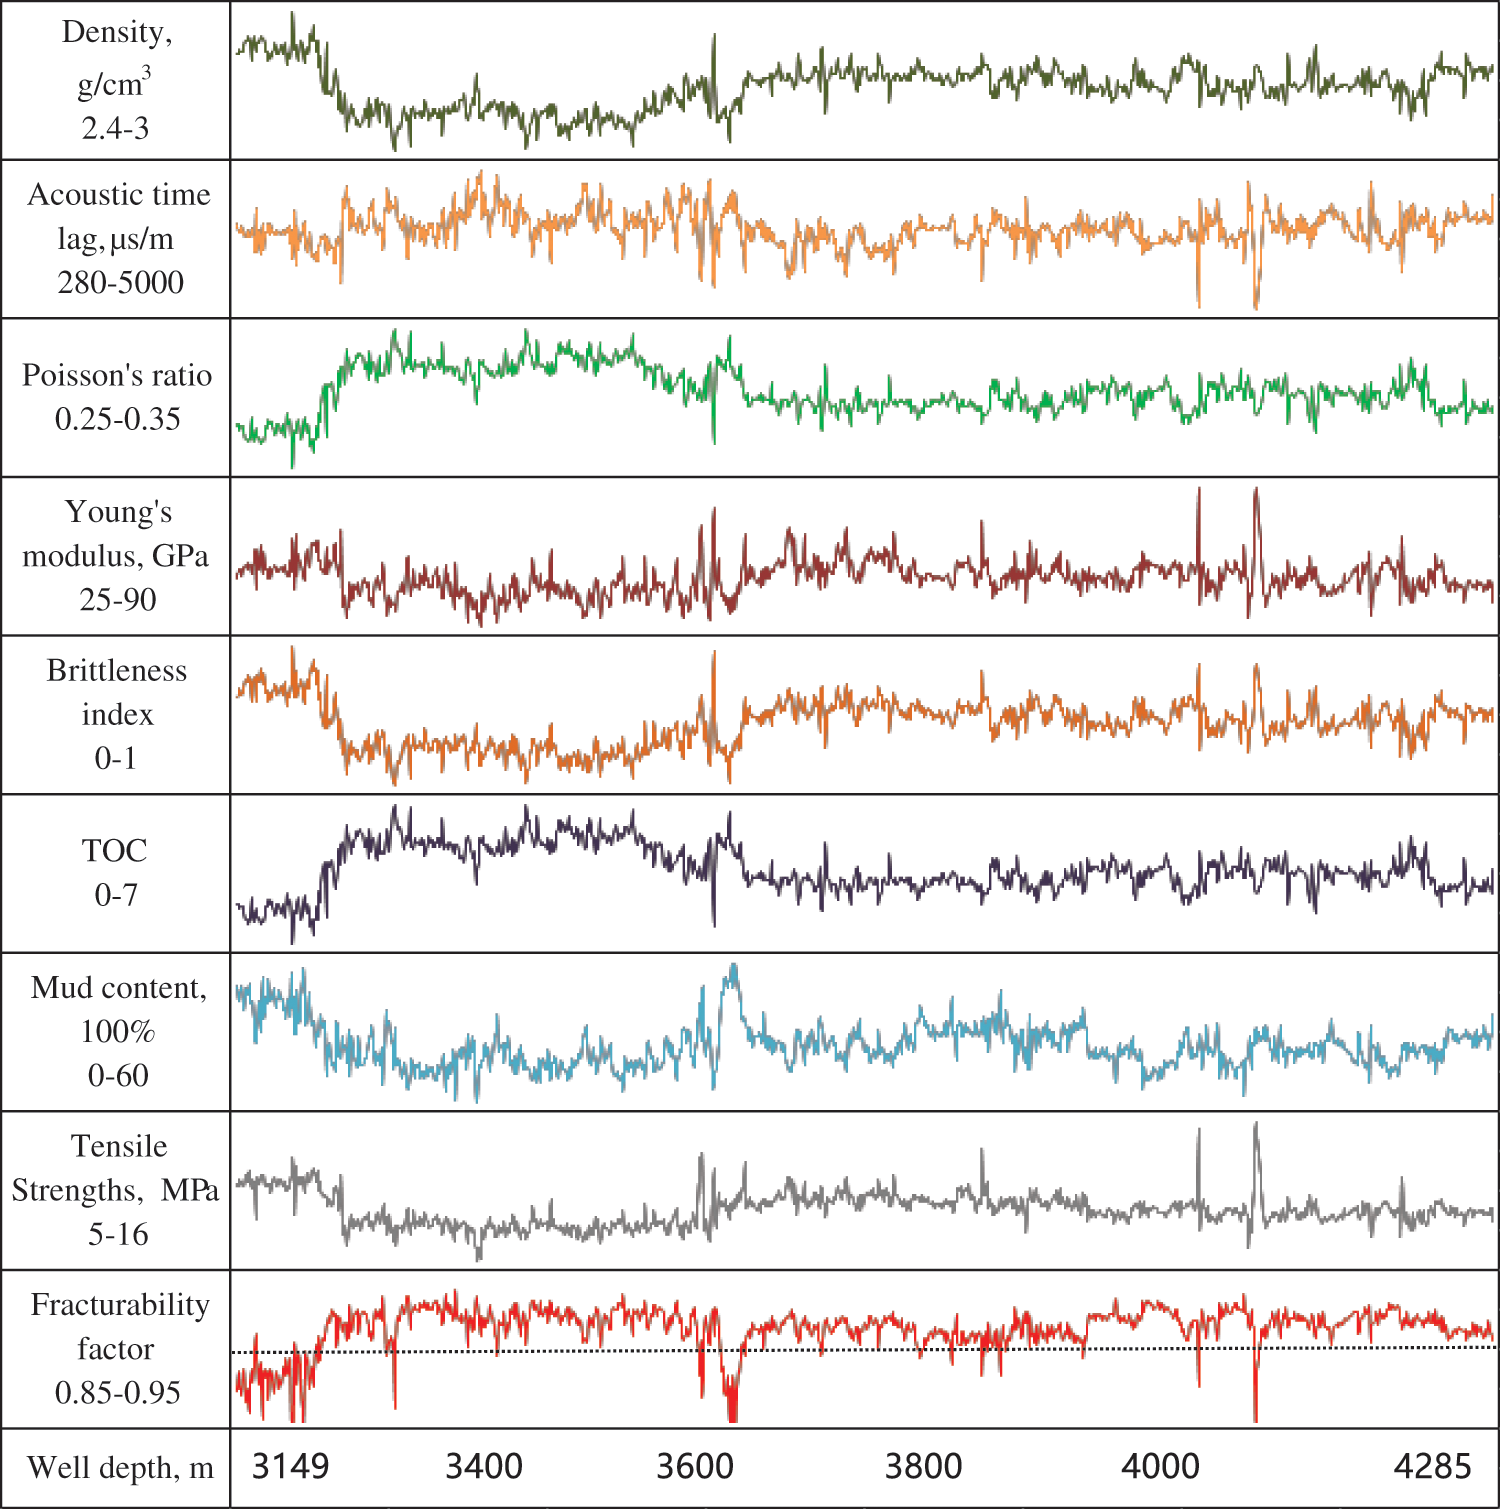
Figure 7: Fracturability evaluation index parameter map for well D in DS block
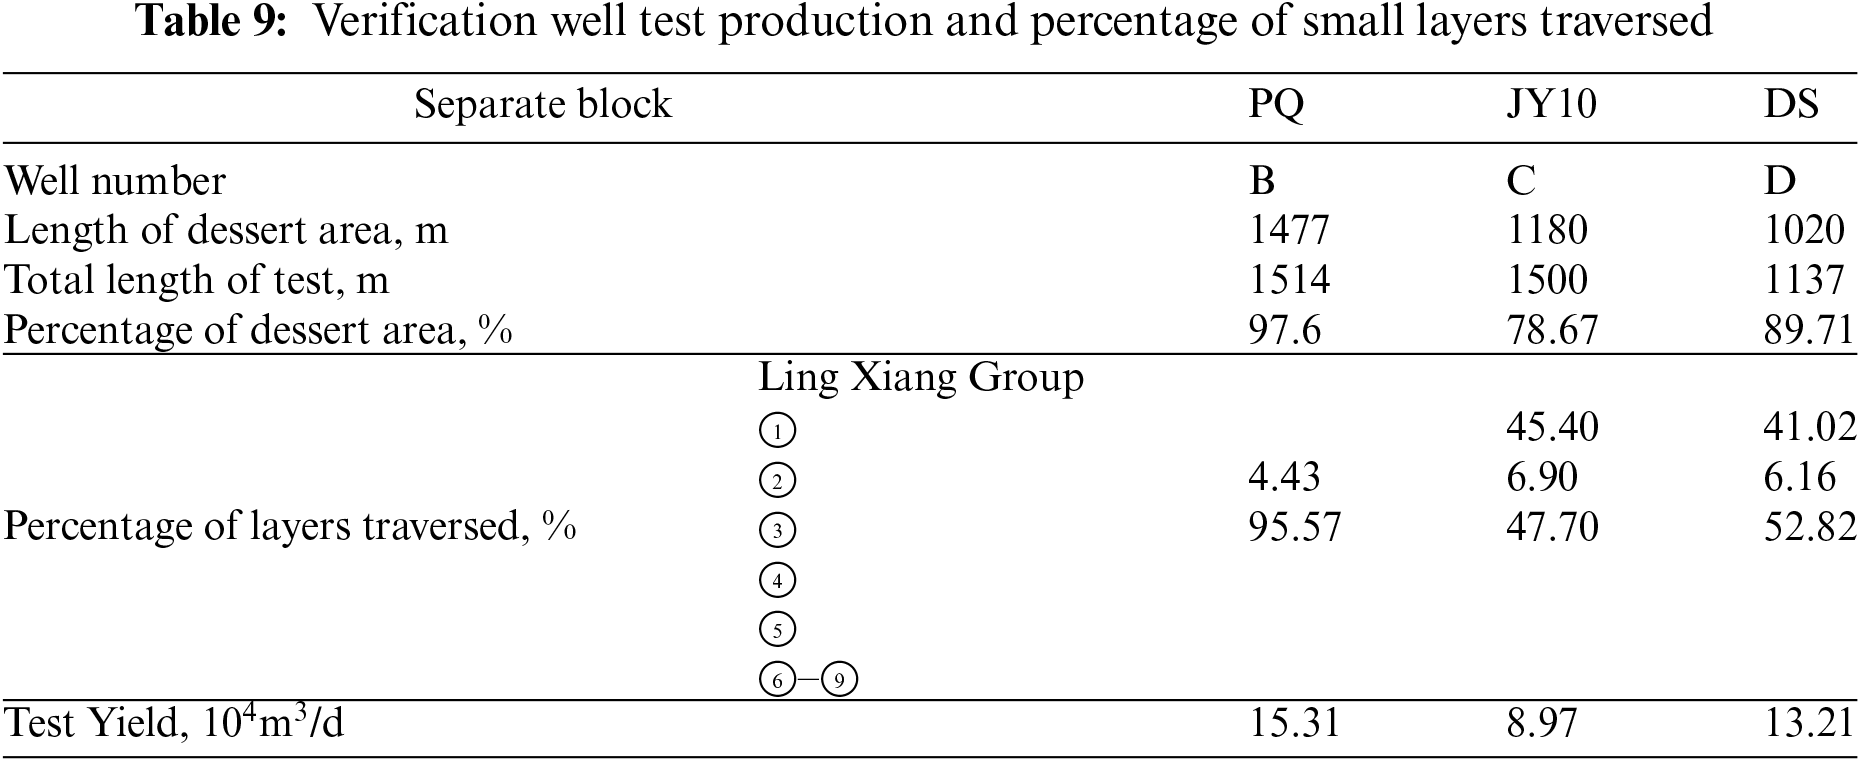
Due to the fact that these three wells are located in different blocks within the same region, the evaluation model provides a targeted assessment of its accuracy. According to the model calculations, the percentage of wells B, C, and D with comprehensive fracturing coefficients greater than or equal to 0.91 (sweet spots) is 97.6% (1477 m/1514 m), 78.67% (1180 m/1500 m), and 89.71% (1020 m/1137 m), respectively. By comparing the production test results of the three wells (as shown in Table 9), it can be observed that well B achieved a production test rate of 15.31 × 10⁴ m3/d, higher than wells C and D. Well D, with a fracturing sweet spot length representing only 78.67% of the testing interval length, had the lowest production test rate. Additionally, it is evident that the majority of the highest-producing well crosses the ③ small layer. Therefore, the fracturing sweet spot evaluation model proposed in this paper demonstrates wide applicability in different blocks and production areas.
Furthermore, this study extends its analysis to the practical application of the proposed model, with a specific focus on Well C, for which production profile data were comprehensively analyzed. Well C features a horizontal section measuring 1500 m in length, and it underwent a total of 14 hydraulic fracturing stages. The data, illustrated in Fig. 8, reveal a noteworthy congruence between the integrated fracturability coefficient and the production data from each individual fracturing section.
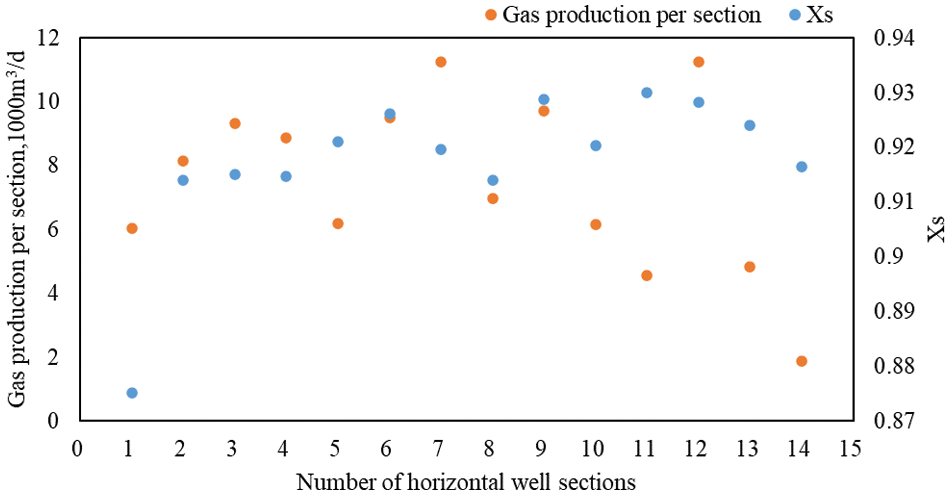
Figure 8: Relationship between integrated fracturability coefficient XS and production profile data
This correlation serves as a robust validation of the model’s accuracy. The alignment of the model’s predictions with the actual production data from Well C not only demonstrates the model’s practical utility but also reinforces its potential as a reliable tool in optimizing hydraulic fracturing operations. The ability to accurately predict production outcomes based on geological and mechanical parameters is a significant advancement, offering a more data-driven approach to enhance the efficiency and effectiveness of unconventional energy extraction methods.
Microseismic monitoring is currently the most credible method for assessing fracturing effects in field operations. This study incorporates and verifies the microseismic approach. Fig. 9 illustrates the morphology of the fracture networks post-fracturing as monitored by microseismic techniques. It is noteworthy that the network displayed in Fig. 9c is the smallest among them. The complexity of the fracture networks, particularly in sections 8, 9, and 12 of Fig. 9 is evident. The proposed model was utilized to calculate data that quantifies the complexity of the fracture networks. The integrated fracturability coefficients for sections 1, 8, 9, and 12 were found to be 0.875, 0.914, 0.929, and 0.928, respectively. These results suggest that a higher integrated fracturability coefficient corresponds to increased complexity in the fracture network.
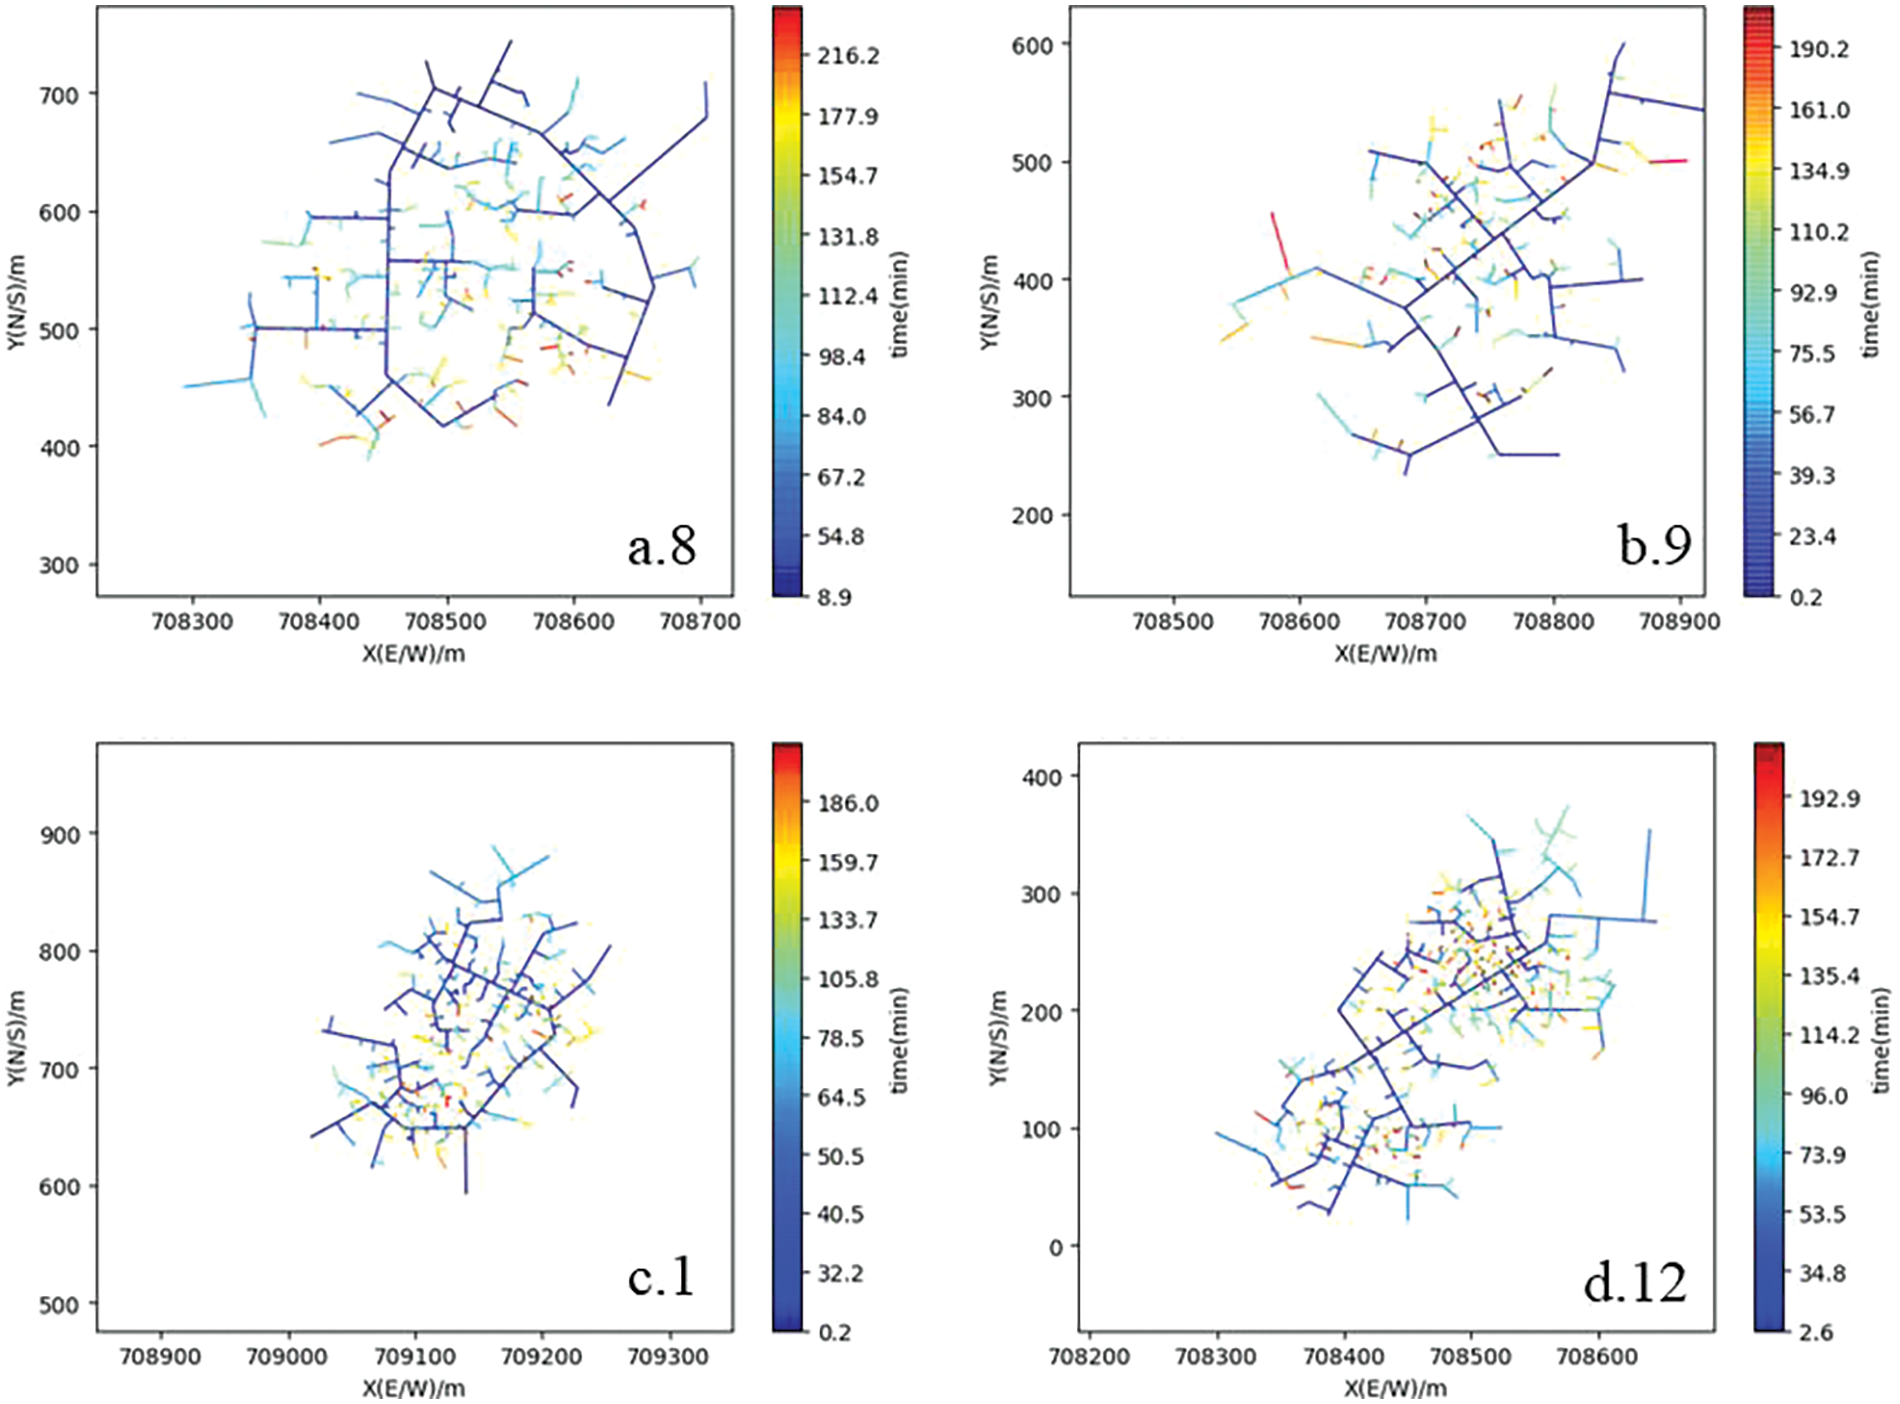
Figure 9: Fracture patterns monitored by microseismic
(1) This paper proposes a shale fracturability evaluation method based on the AHP and mutation model, which accurately identifies the sweet spot regions in shale reservoirs. The unique aspect of this method is that it identifies not only engineering or geological sweet spots but also dual sweet spots that align with post-fracturing production goals. This definition of sweet spots is more practical and aligns better with the true concept of sweet spots.
(2) Most existing fracturability evaluation methods are often tailored to specific reservoir blocks and lack general applicability. This paper validates the proposed two-step mutation model-based shale fracturing sweet spot evaluation method by comparing it to four wells in two different regions with different blocks. The results show high compatibility and strong applicability. Therefore, the method presented in this paper can be applied in different blocks, making it versatile and widely applicable.
(3) Using the improved mutation model based on the AHP proposed in this paper, it is still applicable in the absence of some evaluation parameters. In the evaluation of three different blocks in the Nanchuan area in this paper, due to the lack of porosity and permeability in this model in the region, the positive indicator A3 in the original model is removed. The calculation method of the positive indicator A in the criterion layer is changed from the butterfly mutation model to the swallowtail mutation model, and the evaluation results are still accurate.
Acknowledgement: None.
Funding Statement: This work was supported by the National Science and Technology Major Project during the 13th Five-Year Plan under Grant Number 2016ZX05060004.
Author Contributions: The authors confirm contribution to the paper as follows: study conception and design: S.L., D.L.; data collection: L.C.; analysis and interpretation of results: P.M., S.L.; draft manuscript preparation: S.L. All authors reviewed the results and approved the final version of the manuscript.
Availability of Data and Materials: All data generated or analyzed during this study are included in the publishes article.
Conflicts of Interest: The authors declare that they have no conflicts of interest to report regarding the present study.
References
1. Cruz, C. S., Stimpson, S. (2022). Keeping the lights on: Oil and gas development in a low-carbon world. Journal of Energy & Natural Resources Law, 40(4), 491–494. [Google Scholar]
2. Middleton, R. S., Gupta, R., Hyman, J. D., Viswanathan, H. S. (2017). The shale gas revolution: Barriers, sustainability, and emerging opportunities. Applied Energy, 199, 88–95. [Google Scholar]
3. Tathed, P., Han, Y., Misra, S. (2018). Hydrocarbon saturation in upper Wolfcamp shale formation. Fuel, 219, 375–388. [Google Scholar]
4. Ko, L. T., Loucks, R. G., Ruppel, S. C., Zhang, T. W., Peng, S. (2017). Origin and characterization of Eagle Ford pore networks in the south Texas Upper Cretaceous shelf. AAPG Bulletin, 101, 387–418. [Google Scholar]
5. Shao, D. Y., Zhang, T. W., Ko, L. T., Li, Y. F., Yan, J. P. et al. (2019). Experimental investigation of oil generation, retention, and expulsion within Type II kerogen-dominated marine shales: Insights from gold-tube nonhydrous pyrolysis of Barnett and Woodford Shales using miniature core plugs. International Journal of Coal Geology, 217, 103337. [Google Scholar]
6. Bustin, R., Bustin, A., Ross, D., Chalmers, G. M., Chikatamarla, V. et al. (2009). Shale gas opportunities and challenges. Search and Discovery Articles, 40832, 20–23. [Google Scholar]
7. U.S. Energy Information Administration (2023). Crude oil and natural gas resource development. Washington DC: USA Energy Information Administration. https://www.eia.gov/totalenergy/data/monthly/pdf/sec5_n.pdf (accessed on 02/05/2023). [Google Scholar]
8. Johnson Jr, R. L., Hopkins, C. W., Zuber, M. D. (2000). Technical challenges in the development of unconventional gas resources in Australia. The APPEA Journal, 40(1), 450–468. [Google Scholar]
9. Muhssen, H. S., Masuri, S. U., Sahari, B. B., Hairuddin, A. A. (2021). Design improvement of compressed natural gas (CNG)-air mixer for diesel dual-fuel engines using computational fluid dynamics. Energy, 216, 118957. [Google Scholar]
10. Kim, S., Park, C., Jang, H., Kim, C., Kim, Y. (2021). Effect of boosting on performance and emissions in a port fuel injection natural gas engine with variable intake and exhaust valve timing. Energy Reports, 7, 4941–4950. [Google Scholar]
11. Wiesbaden, S. F. (2014). Current gas engine developments will set the pattern for the next 30 years. MTZ Industrial, 4(2), 20–23. [Google Scholar]
12. Pan, K., Wallace, J. (2022). Soot and combustion models for direct-injection natural gas engines. International Journal of Engine Research, 23(1), 150–166. [Google Scholar]
13. Li, M. H., Liu, G. F., Liu, X. R., Li, Z. J., Zhang, Q. et al. (2019). Performance of a direct-injection natural gas engine with multiple injection strategies. Energy, 189, 116363. [Google Scholar]
14. Lei, Q., Weng, D., Guan, B., Shi, J. F., Cai, B. et al. (2023). Comparison of shale oil and gas extraction engineering technologies between China and the United States and development suggestions. Petroleum Exploration and Development, 50(4), 824–831 (In Chinese). [Google Scholar]
15. Guo, H., Guo, T. (2013). Experimental evaluation of crushability of shale reservoirs in Luojia area, Shengli Oilfield. Petroleum Geology & Experiment, 35(3), 339–346 (In Chinese). [Google Scholar]
16. Zheng, M., Li, J., Wu, X., Wang, S., Guo, Q. et al. (2018). China’s conventional and unconventional natural gas resources: Potential and exploration targets. Journal of Natural Gas Geoscience, 3(6), 295–309. https://doi.org/10.1016/j.jnggs.2018.11.007 [Google Scholar] [CrossRef]
17. Cipolla, C. L., Warpinski, N. R., Mayerhofer, M. J., Lolon, E. P., Vincent, M. C. (2008). The relationship between fracture complexity, reservoir properties, and fracture treatment design. SPE Annual Technical Conference and Exhibition, Denver, Colorado, USA. https://doi.org/10.2118/115769-MS [Google Scholar] [CrossRef]
18. Maulianda, B., Prakasan, A., Wong, R. C. K., Eaton, D., Gates, L. D. (2019). Integrated approach for fracture characterization of hydraulically stimulated volume in tight gas reservoir. Journal of Petroleum Exploration and Production Technology, 9, 2429–2440. [Google Scholar]
19. Sun, F., Du, S., Zhao, Y. P. (2022). Fluctuation of fracturing curves indicates in-situ brittleness and reservoir fracturing characteristics in unconventional energy exploitation. Energy, 252, 124043. [Google Scholar]
20. Zhao, Y. P. (2022). Physical mechanics investigation into carbon utilization and storage with enhancing shale oil and gas recovery. Science China Technological Sciences, 65, 490–492. https://doi.org/10.1007/s11431-021-1985-y [Google Scholar] [CrossRef]
21. Jarvie, D. M., Hill, R. J., Ruble, T. E., Pollastro, R. M. (2007). Unconventional shale-gas systems: The Mississippian Barnett Shale of North-Central Texas as one model for thermogenic shale-gas assessment. AAPG Bulletin, 91(4), 475–499. [Google Scholar]
22. Wang, F. P., Gale, J. F. (2009). Screening criteria for shale-gas systems. Gulf Coast Association of Geological Societies Transactions, 59, 779–793. [Google Scholar]
23. Chen, J., Xiao, X. M. (2013). Mineral composition and brittleness of three sets of Paleozoic organic-rich shales in China South area. Journal of China Coal Society, 38(5), 822–826 (In Chinese). [Google Scholar]
24. Rybacki, E., Meier, T., Dresen, G. (2016). What controls the mechanical properties of shale rocks?—Part II: Brittleness. Journal of Petroleum Science & Engineering, 144, 39–58. [Google Scholar]
25. Tao, W., Tang, H., Wang, Y. (2020). Brittleness evaluation based on the energy evolution throughout the failure process of rocks. Journal of Petroleum Science and Engineering, 194, 107361. [Google Scholar]
26. Rickman, R., Mullen, M., Petre, E., Grieser, B., Kundert, D. (2008). A practical use of shale petrophysics for stimulation design optimization: All shale plays are not clones of the barnett shale. SPE Annual Technical Conference and Exhibition. Denver, Colorado, USA. [Google Scholar]
27. Mullen, M., Enderlin, M. (2012). Fracability index—more than just calculating rock properties. SPE Annual Technical Conference and Exhibition. San Antonio, Texas, USA. [Google Scholar]
Appendix
Cite This Article
 Copyright © 2024 The Author(s). Published by Tech Science Press.
This work is licensed under a Creative Commons Attribution 4.0 International License , which permits unrestricted use, distribution, and reproduction in any medium, provided the original work is properly cited.
 Downloads
 Citation Tools