
 Submit a Paper
 Propose a Special lssue
 Open Access
ARTICLE

Optimization Study of Active-Passive Heating System Parameters in Village Houses in the Southern Xinjiang Province
1 College of Water Conservancy & Architectural Engineering, Shihezi University, Shihezi, 823000, China
2 Scientific Research Department, Shihezi University, Shihezi, 823000, China
* Corresponding Author: Jie Li. Email:
Energy Engineering 2024, 121(7), 1963-1990. https://doi.org/10.32604/ee.2024.048477
Received 08 December 2023; Accepted 07 March 2024; Issue published 11 June 2024
 View Full Text
 Download PDF
Abstract
Aiming at the problems of large energy consumption and serious pollution of winter heating existing in the rural buildings in Southern Xinjiang, a combined active-passive heating system was proposed, and the simulation software was used to optimize the parameters of the system, according to the parameters obtained from the optimization, a test platform was built and winter heating test was carried out. The simulation results showed that the thickness of the air layer of 75 mm, the total area of the vent holes of 0.24 m, and the thickness of the insulation layer of 120 mm were the optimal construction for the passive part; solar collector area of 28 m, hot water storage tank volume of 1.4 m, mass flow rate of 800 kg/h on the collector side, mass flow rate of 400 kg/h on the heat exchanger side, and output power of auxiliary heat source of 5~9 kW were the optimal constructions for active heating system. Test results showed that during the heating period, the system could provide sufficient heat to the room under different heating modes, and the indoor temperature reached over 18°C, which met the heating demand. The economic and environmental benefits of the system were analyzed, and the economic benefits of the system were better than coal-fired heating, and the CO emissions were reduced by 3,292.25 kg compared with coal-fired heating. The results of the study showed that the combined active-passive heating system could effectively solve the heating problems existing in rural buildings in Southern Xinjiang, and it also laid the theoretical foundation for the popularization of the combined heating systems.Keywords
Southern Xinjiang region has a temperate continental arid climate [1], with cold winters and a long heating period, to meet the heating demand, a large amount of energy is consumed while a large amount of harmful gases are emitted, and this problem is even more significant in rural areas. The reason for this is that there are many rural buildings in Southern Xinjiang and their distribution is relatively decentralized, residents use coal-fired boilers for heating, which has low thermal efficiency and consumes a large amount of non-renewable energy while generating a large amount of harmful gases and exacerbating air pollution. Thus, improving the heating methods of rural buildings in the Southern Xinjiang areas is an urgent problem to be solved nowadays.
Scholars in various countries have carried out a large number of studies to solve the heating problems of rural buildings, and these studies include optimization studies on Trombe walls and active heating equipment as well as the analysis of the application effect of combined active-passive heating systems: Abdeen et al. [2] modeled the Trombe wall and studied the construction parameters of the Trombe wall in relation to the climatic characteristics of the City of Alexandria. The results of the study show that the construction of the Trombe wall is optimal when the height of the wall is 1.7 m, the thickness of the wall is 0.3 m, and the thickness of the air layer is 0.22 m. The model improves the thermal comfort by 38.19%. during the simulation period. Jaber et al. [3] studied the Trombe wall in terms of heating, environmental, and economic aspects and found that the Trombe wall is optimal when it covers 37% of the building’s south wall area, reduces auxiliary heating by 32.1% per year and reduces CO2 emissions by 445 kg per year. Combined with the climatic characteristics of Lhasa, Liu et al. [4] used TRNSYS software to study the solar heating system and found that the net benefit of the system is maximum when the solar collector area is 87.2 m2 and the tank volume is 9.0 m3. Feng et al. [5] proposed a heating system with solar energy combined with electromagnetic energy and optimized the system parameters using TRNSYS software, and found that when the heating area is 97.74 m2, the solar collector area is taken to be 15 m2, the volume of the water tank is taken to be 2 m3, and the power of the electromagnetic energy is 12 kW, the system has the highest economic efficiency. Li et al. [6] established an air source heat pump-assisted solar collector heating system in Lanzhou and studied the system, which was found to be able to stably heat the building and reduce CO2 emissions by 12,323.55 kg throughout the heating period. Zhou et al. [7] proposed a heating system that combined an air-source heat pump with a water-source heat pump and phase-change heat accumulator, which was investigated using a combination of simulation and experimental testing, and it was found that the system kept the indoor temperature of the building at more than 18°C, and that the system had a good energy-saving effect. Ma et al. [8] proposed a solar combined air source heat pump system, which was tested and found to be able to keep the indoor temperature above 14°C and meet the heating demand. Li et al. [9] considered utilizing solar energy to replace part of the traditional energy sources and established a heating system of solar energy combined with a coal-fired boiler, using which the indoor temperature of the building can be maintained above 11°C, which meets the heating needs of the residents. Li et al. [10] proposed a time-controlled solar-assisted air source heat pump system, which was found to maintain the average indoor temperature of the building above 18°C to meet the heating demand. The coal consumption of this system during the heating period is only 25% of that of a coal-fired boiler, which can effectively reduce harmful gas emissions. Using the TRNSYS simulation platform, Wang et al. [11] conducted a simulation study of active and passive dual-effect collector air heating applied to a solar demonstration building and found that when the weather is sunny, the indoor temperatures of the building’s south and north rooms can reach a comfortable temperature of 20°C.
All of the above studies have achieved certain results, but there is a lack of studies on the improvement of rural building heating methods in Southern Xinjiang. Based on the above studies, this study proposed a Trombe wall coupled with a solar collector and biomass boiler as auxiliary heat sources as a combined active-passive heating system, taking into account the abundant solar energy resources and biomass resources in the Southern Xinjiang [12–14]. Combined with the climatic characteristics of Southern Xinjiang, this study optimized the parameters of the passive and active parts of the heating system, obtained the optimal parameters of the system, built a test platform based on the obtained parameters, and carried out a winter heating test, analyzed the operating effect of the combined heating system, and provided a reference for the application of the combined active-passive heating systems in the rural areas of the Southern Xinjiang.
2.1 Overview of the Test House
The test house is located in Company 8th of the 51st Regiment in Tumushuke City, Xinjiang, and is a brick-concrete structure. The building is one floor above ground, facing south, with a floor area of 114.49 m2 and a floor height of 3 m. The external appearance and layout of the test house can be seen in Figs. 1a and 1b, respectively, Table 1 provides details of the building’s envelope structure.
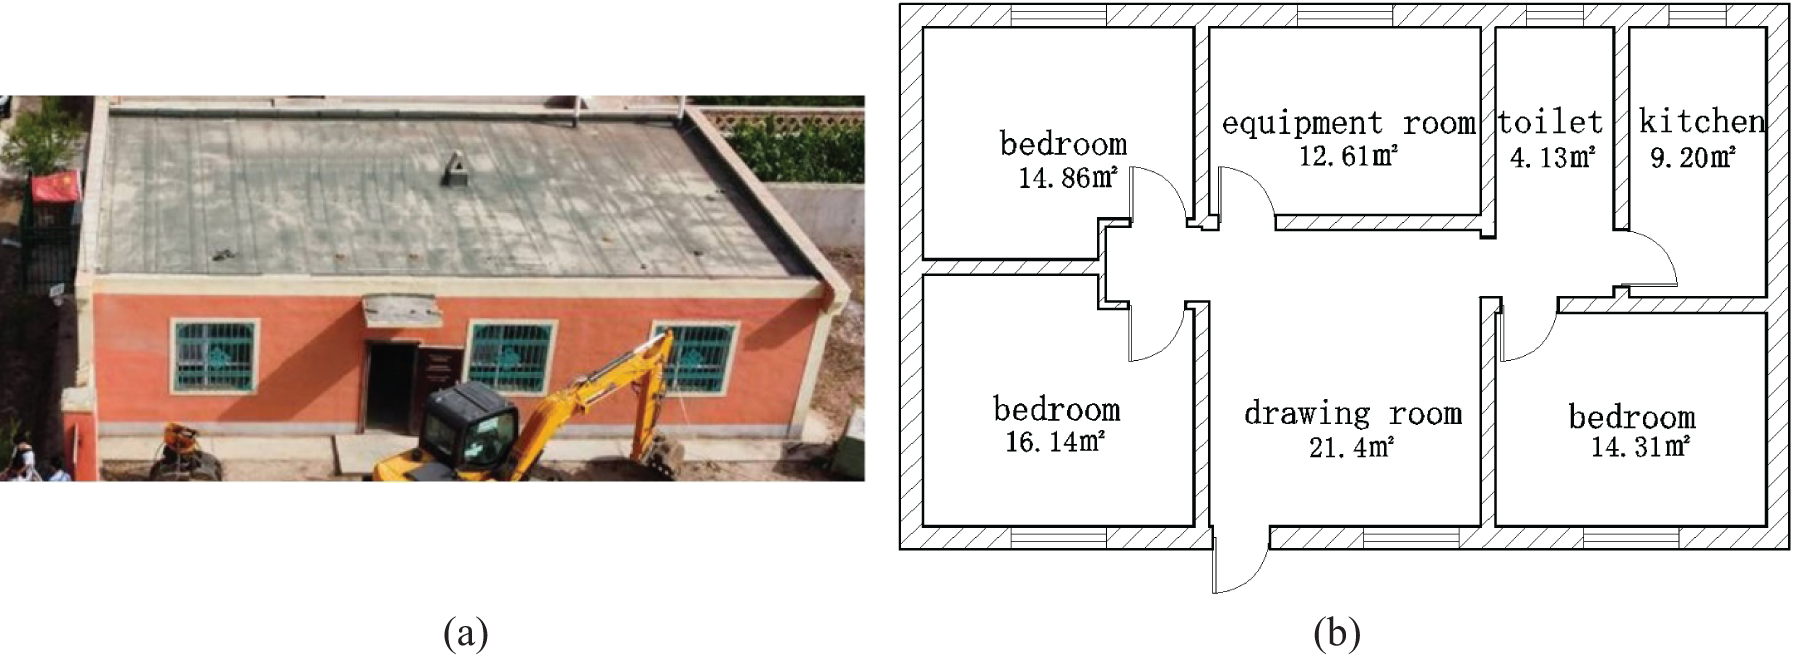
Figure 1: Exterior view of the test room and room layout: (a) External appearance of the test house; (b) Room Layout
2.2 Research Methodology and Content
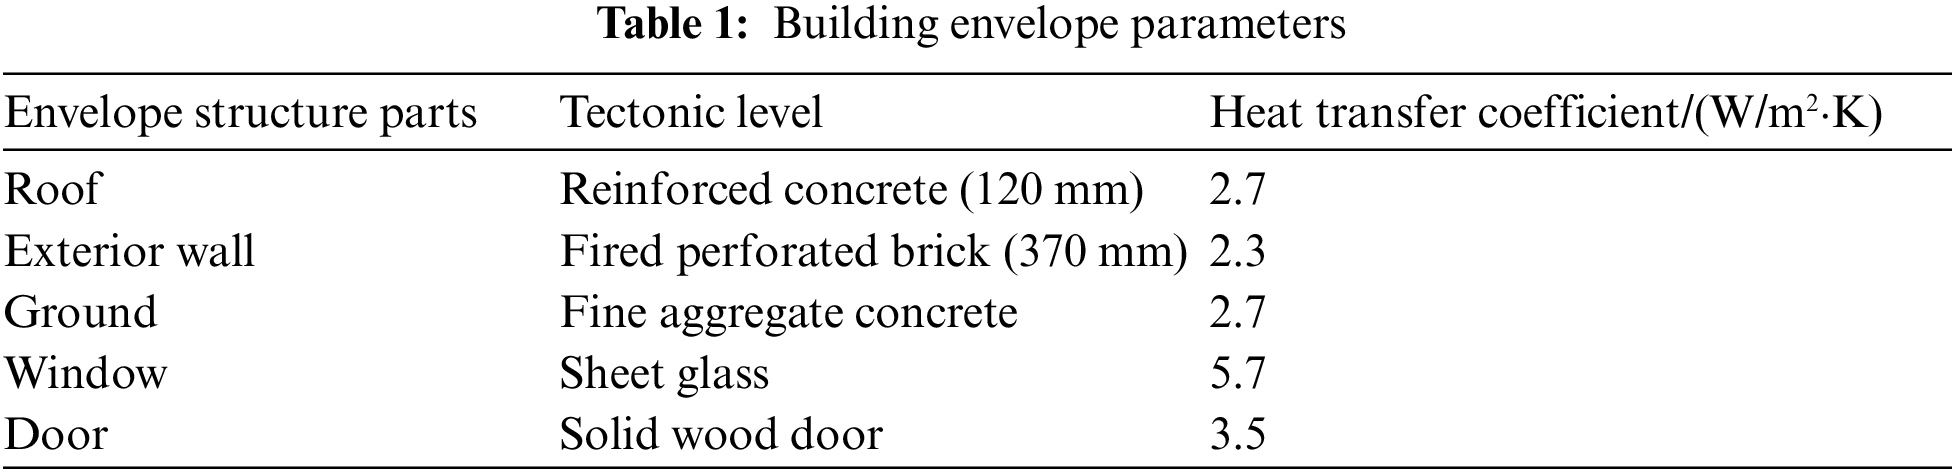
The research methodology of numerical simulation combined with experimental testing was used in this study. Numerical simulation includes: ANSYS software was used to optimize the thickness of the air layer, the area of the upper and lower vents, and the thickness of the insulation layer of the Trombe wall; and the parameters of the active heating system were optimized using the TRNSYS software, which included the solar collector area, volume of the hot water storage tank, flow rate of system pipes, and power of the biomass boiler. The experimental test includes: according to the parameters of the combined heating system obtained from numerical simulation, the test platform was established and the winter heating effect was tested. The specific research process is shown in Fig. 2.
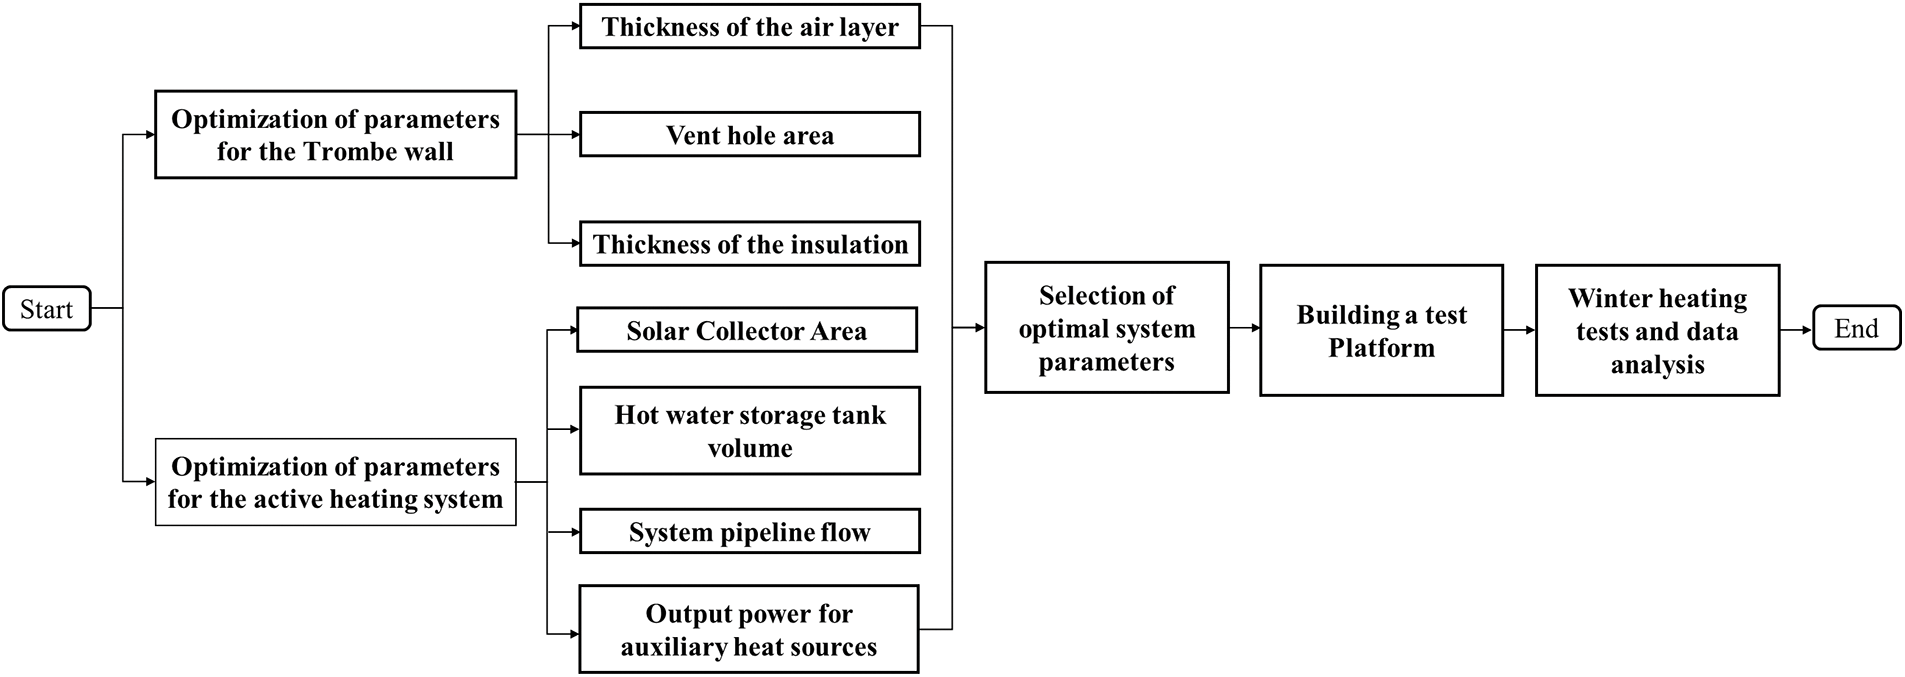
Figure 2: Method flowchart
2.3 Test Platform Construction
According to the system parameters obtained from the simulation, a test platform for the combined active-passive heating system was built, which consisted of two parts: the conversion of the south wall of the building into a Trombe wall and the installation of the active heating system. The completed test platform is shown in Fig. 3.
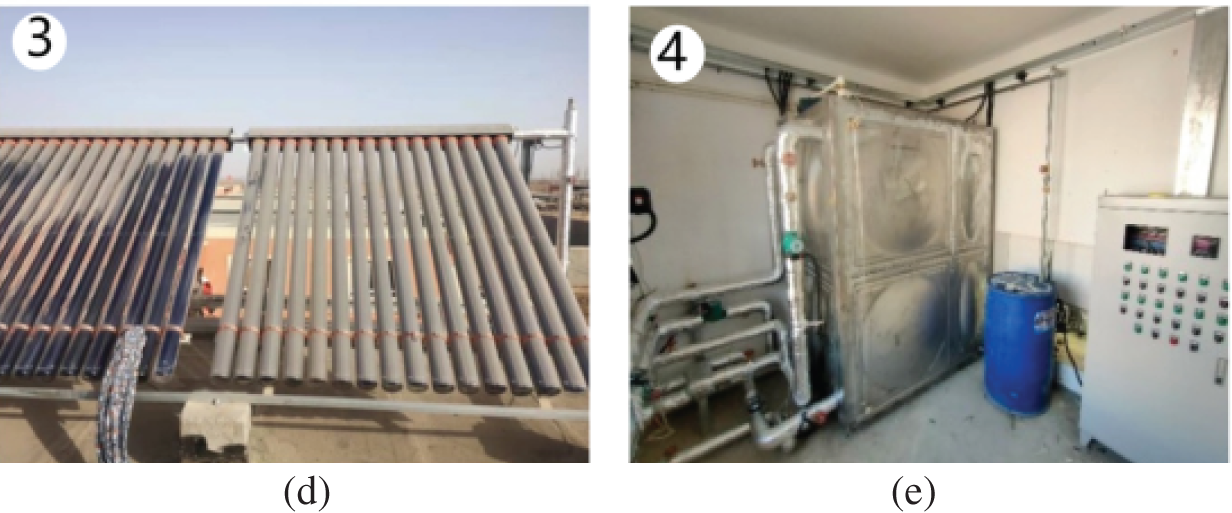
Figure 3: Exterior view of the test platform and active heating equipment: (a) Trombe wall; (b) Floor heating coil; (c) Biomass boiler; (d) Solar collector; (e) Hot water storage tank
2.4 Test Content and Instruments
After the test platform was built, its winter heating effect was tested. This study aims to test three components: the indoor environment, the performance of the active heating system, and the outdoor environment. The indoor environment testing includes: indoor temperature and humidity, the temperature and wind speed at the upper and lower vents of the Trombe wall, heat flow as well as temperature of the internal and external wall surfaces, and temperature and heat flow of other enclosures. The outdoor environment tests consist of outdoor temperature, humidity, and solar radiation intensity. Active heating system tests include: inlet and outlet water temperatures of solar collectors, inlet and outlet water temperatures of hot water storage tanks, inlet and outlet water temperatures of biomass boilers and electric auxiliary heaters, and inlet and outlet water temperatures of low-temperature radiant floor systems. The layout of the test points is presented in Fig. 4.
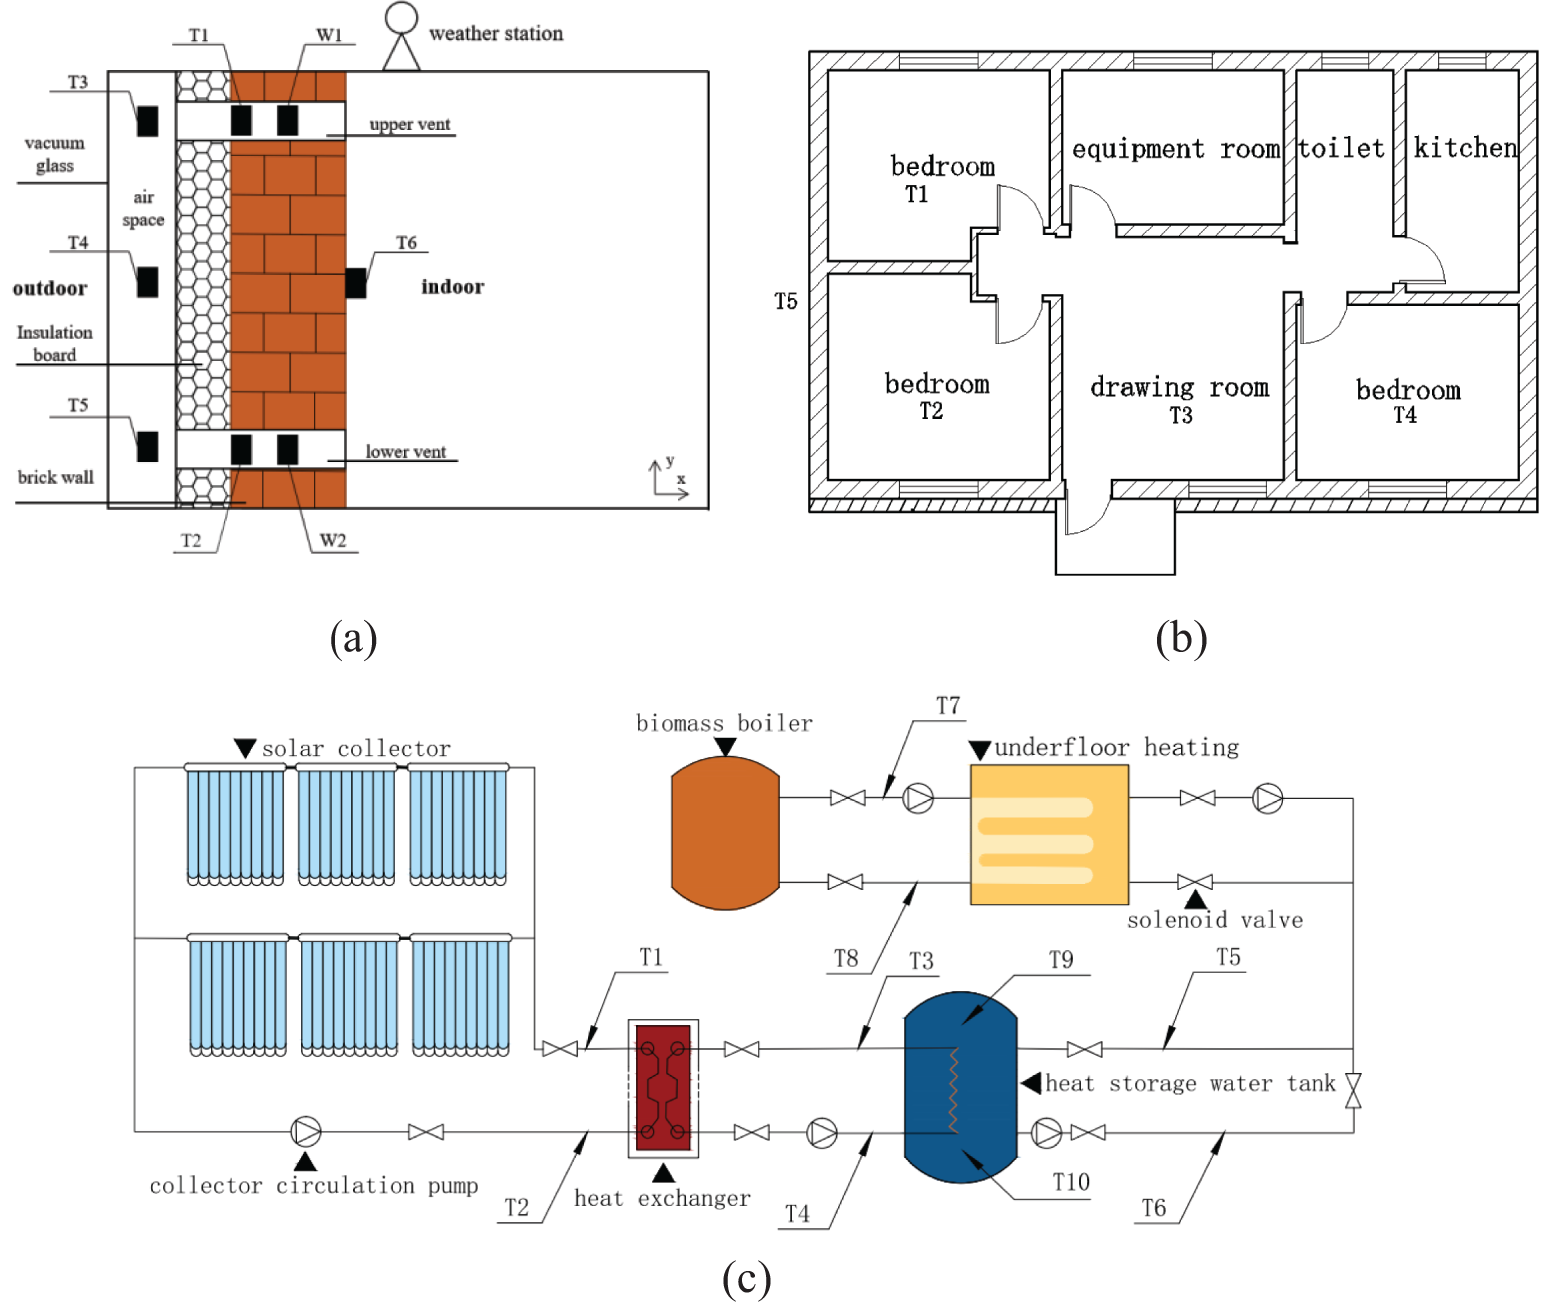
Figure 4: Layout of test points: (a) Layout of test points for the Trombe wall; (b) Room test point layout plan; (c) Layout of test points for active heating systems
Fig. 4a shows the layout of the test points of the Trombe wall, where: T1-temperature of the upper vent; T2-temperature of the lower vent; T3-temperature of the upper air layer; T4-temperature of the middle air layer; T5-temperature of the lower air layer; T6-inner surface temperature and heat flux of the Trombe wall; W1-wind speed of the upper vent; W2-wind speed of the lower vent; and the meteorological station is arranged on the roof to test the temperature and humidity as well as the solar radiation from the outdoor area.
Fig. 4b shows the layout of temperature and humidity test points in the test room: T1-air temperature at a height of 1.5 m above the floor in room 1; T2-air temperature at a height of 1.5 m above the floor in room 2; T3-air temperature at a height of 1.5 m above the floor in room 3; T4-air temperature at a height of 1.5 m above the floor in room 4; T5-outdoor temperature.
Fig. 4c shows the active heating system layout of the test point: T1-return water temperature of the solar collector-plate heat exchanger side; T2-water supply temperature of the solar collector-plate heat exchanger side; T3-water supply temperature of the plate heat exchanger-water tank side; T4-return water temperature of the plate heat exchanger-water tank side; T5-water supply temperature of the water tank-underfloor heating side water supply temperature; T6-return water temperature of the tank-underfloor heating side; T7-return water temperature of the biomass boiler-underfloor heating side; T8-water supply temperature of the biomass-underfloor heating side; T9-temperature of the upper part of the water tank; T10-temperature of the lower part of the water tank.
The specific operation is as follows: using RR002 temperature and humidity recorder every 10 min to record the indoor temperature and humidity, according to the “Civil Building Indoor Heat and Humidity Environment Evaluation Standard” [15], the horizontal distance of the sensor’s layout point position from the wall is more than 0.5 m, and the vertical distance from the floor is 1.5 m. Thermocouples and heat flow plates were attached to the wall surface, and the wall temperature was recorded every 10 min using the JTDL-80 Temperature and Heat Flow Dynamic Data Acquisition System. The Vantage Pro2 automatic weather station was installed on the roof of the building and recorded ambient outdoor temperature, humidity, and solar radiation every 30 min; Parameters such as system water supply and return temperatures, thermal efficiency of solar collectors and biomass boilers were recorded at 1 min intervals using an active heating system automated control system program.
3.1.1 Establishment of the Trombe Wall Model
The Trombe wall was modeled and simulated using ANSYS software and its air layer thickness upper and lower vent area and insulation thickness were optimized. Fig. 5 shows the model of the Trombe wall.

Figure 5: Model of the Trombe wall: (a) Section view; (b) Elevation
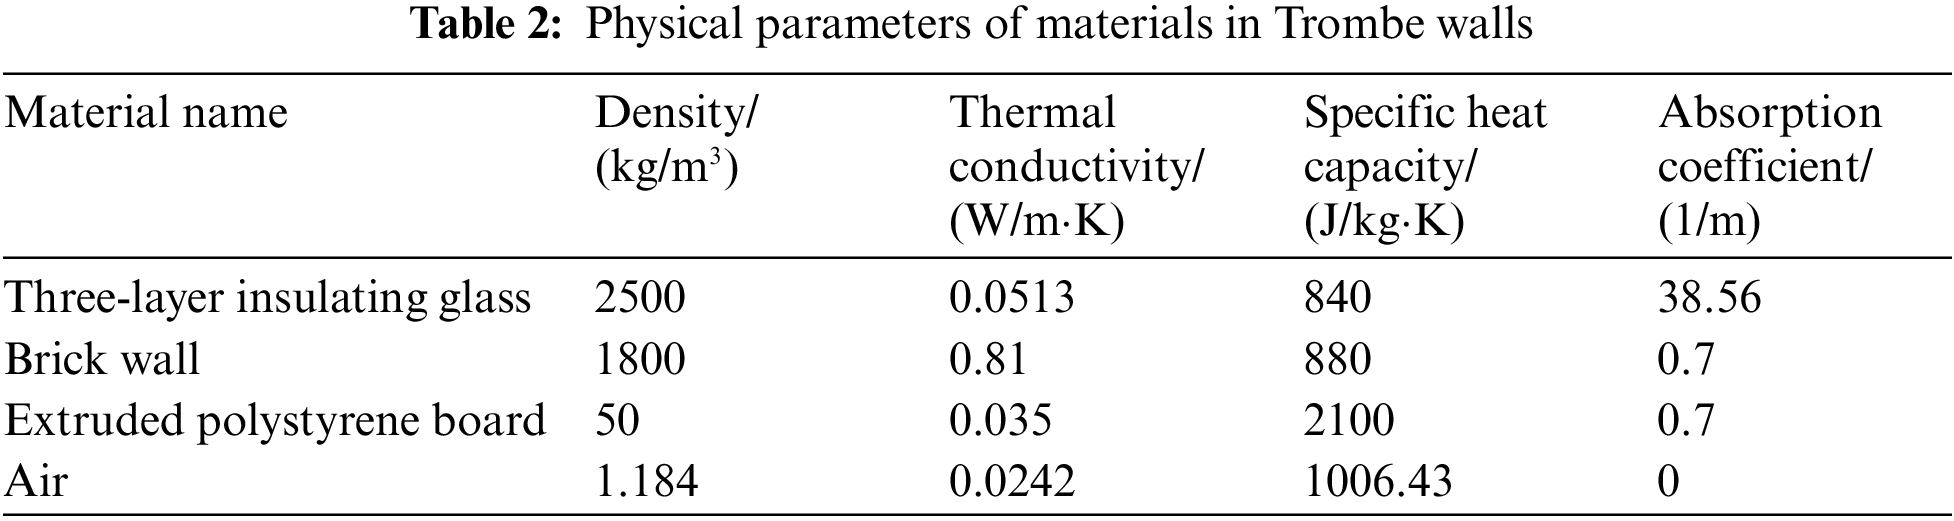
The model was imported into the Fluent solver and then the computational model was set up, including: adding the energy equation and the viscosity model as an RNG k-ε model. The Boussinesq assumption was used in the simulation considering the small variation in air pressure at the Trombe wall; the gravitational acceleration was set to be in the negative direction along the y-axis. In addition, no-slip boundary conditions were used on the walls by default, since the viscosity of the air was considered in the simulation. The SIMLEC scheme and the second-order upwind space discretization method were used for the simulation. The physical parameters of the materials used for the simulation are shown in Table 2.
According to the Thermal Design Code for Civil Buildings, the code set the convective heat transfer coefficient for the inner surface of the Trombe wall at 8.0 W/m2·K [16], and for the outer surface of the double-glazed panel at 20.0 W/m2·K. The upper and lower vents were established as the inlet and outlet boundaries for pressure and were open from 11:00 AM to 6:00 PM. This numerical simulation adopted the transient calculation method to study the dynamic heating characteristics of walls throughout the day. The outdoor temperature used in the simulation was obtained by querying meteorological data from previous years, and the solar radiation utilized the Solar Ray Tracing and Solar Calculator functions of Fluent software to combine the two activities. In this study, the outdoor temperature on December 21 was selected for simulation. The outdoor parameters used for the simulation are shown in Fig. 6.
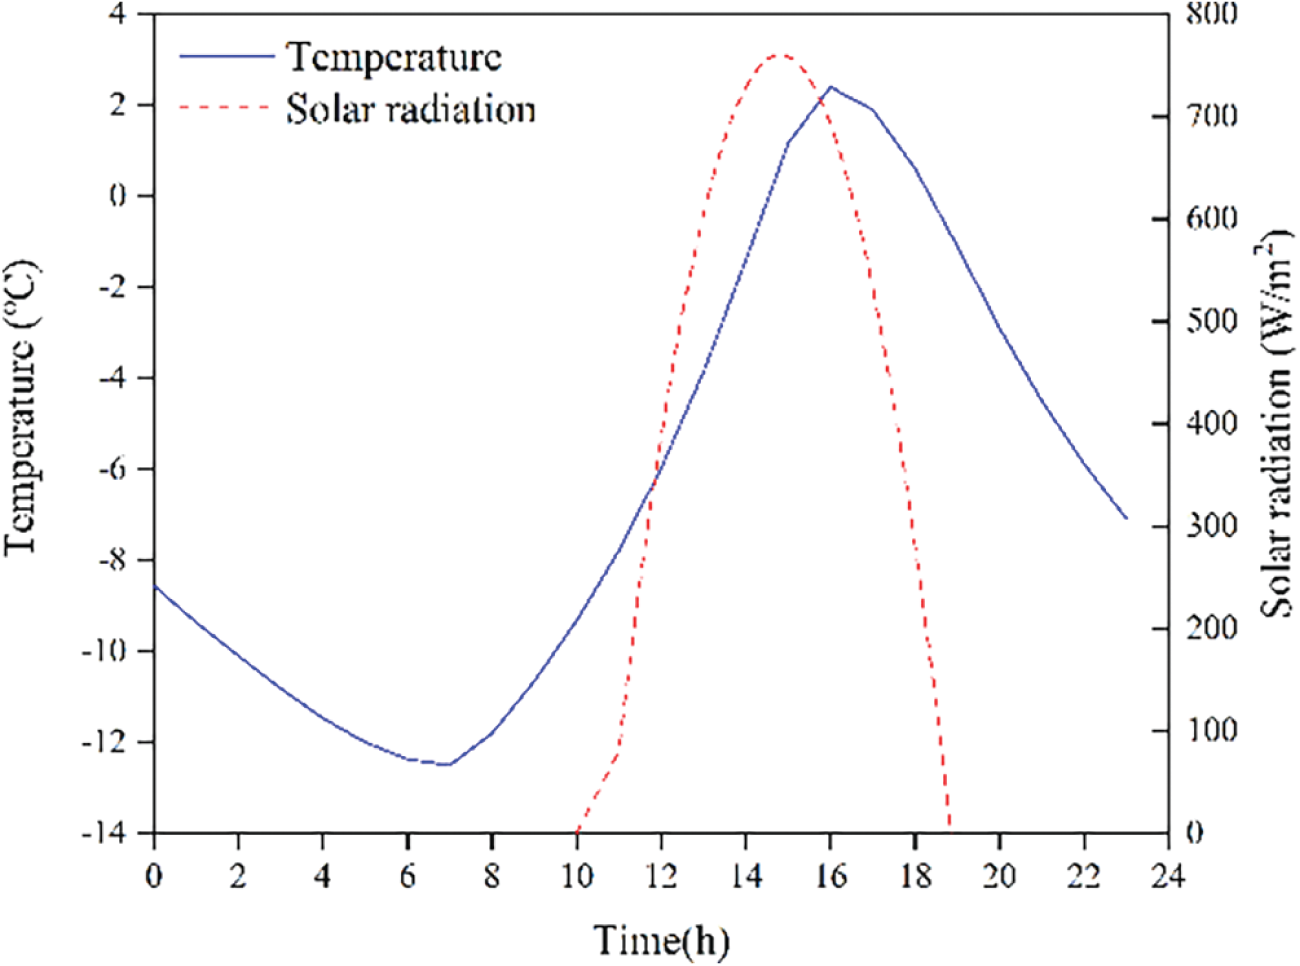
Figure 6: Outdoor parameters used for simulation
As shown in Fig. 6, the outdoor temperature on the simulated day was low, fluctuating between 2.4°C and −12.5°C; there was sufficient solar radiation, up to 760 W/m2.
3.1.2 The Principle of Heating with Trombe Walls
Based on the Trombe wall model, this study optimized the air layer thickness, upper and lower vent areas, and insulation thickness of the wall, and determined the optimal construction parameters of the Trombe wall by comparing the amount of heat supplied to the building by differently constructed walls.
The convective heating capacity of a Trombe wall can be calculated according to the following equation:
where: ca is the specific heat capacity of air, 1006.34 kJ/kg·°C; ΔTa is the air temperature difference between the upper and lower vents of the Trombe wall, °C; ma(τ) is the mass flow rate through the vents, kg/s; ma(τ) = ρ(τ)v(τ)A, where ρ(τ) is the density corresponding to the hourly average air temperature of the upper and lower vents, kg/m3, v(τ) is the wind speed of the vents, taking the wind speed of the upper vents, m/s, and A is the area of the vents, m2.
The quantity of conductive heat delivered by a Trombe wall can be computed using the following equation:
where: A is the inner surface of the wall, taken as 13.206 m2; K is the integrated heat transfer coefficient of the Trombe wall, W/(m2·K); ΔTb (τ) is the difference between the temperature of the air layer and the indoor temperature, °C.
The total heating capacity of a Trombe wall can be calculated using the following equation:
3.1.3 Establishment of Active Heating Systems
The study’s simulation of the active heating system includes utilizing TRNSYS system transient simulation software to analyze the active heating system with varying solar collector area, hot water storage tank volume, system piping flow parameters, and biomass boiler output power. Furthermore, it entails selecting the specific parameters of the combined heating system in conjunction with economic factors.
The simulation module is chosen based on the active heating system’s operating principle. According to the actual situation of the test house, TRNSYS is used to build the model, and the model built is shown in Fig. 7.

Figure 7: TRNSYS system model diagram
3.2.1 Optimization of Air Layer Thickness
To study the effect of the air layer on the Trombe wall, simulations were carried out for Trombe walls with air layer thicknesses of 25, 50, 75, 100, 125, 150, 175, and 200 mm, respectively.
Fig. 8a shows the trend of heat supply in the Trombe wall over time for varying air layer thicknesses. As the thickness of the air layer increased from 25 to 75 mm, the hourly heat supply of the Trombe wall gradually increased; In contrast, when the air layer thickness increased from 75 to 200 mm, the heat supply of the wall decreased over time, with fluctuations between 100 and 200 mm. Fig. 8b shows the correlation between the total heat supply of the Trombe wall and the thickness of the air layer. The Trombe wall’s total heat supply increased from 32.76 to 44.96 MJ as the air layer thickness increased from 25 to 75 mm. However, the heat supply gradually decreased to 35.63 MJ when the air layer thickness increased from 75 to 200 mm. Based on the data in Figs. 8a and 8b, the Trombe wall performed best when the air layer thickness was 75 mm, providing the highest heat supply to the building.

Figure 8: Influence of air layer thickness on the heating capacity of trombe walls: (a) Hourly heat supply of the Trombe wall at different air layer thicknesses; (b) Total heat supply of the Trombe wall with different air layer thicknesses
The total heat supply of the Trombe wall shows an increasing and then decreasing trend with the increase in the thickness of the air layer. This is because the airflow within the air layer of the Trombe wall belongs to the natural convection in a space of finite thickness, whereas the airflow pattern within the air layer can be categorized into laminar and turbulent states, which are determined on the basis of the Gerashov number. When the airflow is laminar, the greater the thermal efficiency of the Trombe wall, the greater the amount of heat supplied as the thickness of the air layer increases. When the airflow is turbulent, the turbulence is gradually enhanced with the increase of the thickness of the air layer, and the convective heat transfer between the air inside the air layer and the surface of the Trombe wall is intensified, promoting the heat transfer process of the Trombe wall. However, as the thickness of the air layer increases, the air thermal resistance gradually increases, inhibiting the heat transfer process in the Trombe wall. Therefore, when the airflow is turbulent, as the thickness of the air layer increases, the increase or decrease in the amount of heat supplied by the Trombe wall is determined by the strength of the effect of the above two factors.
3.2.2 Optimization of Vent Holes Area
In order to study the effect of vent hole area on heat supply, simulations were carried out on Trombe walls with vent holes of varying areas (0.1, 0.12, 0.14, 0.16, 0.18, 0.2, 0.24, 0.26, 0.28 and 0.3 m2).
Fig. 9a shows the hourly heat supply trend over time for the Trombe wall with varying vent areas. The figure shows that an increase in vent area from 0.1 to 0.24 m2 results in a rise in hourly heat supply. However, when the vent area increased from 0.24 to 0.3 m2, the hourly heat supply experienced gentle fluctuations. The Trombe wall’s heat supply achieved its greatest value at 18:00, with a minimum of 4325.30 kJ at a 0.1 m2 vent area and a maximum of 5423.23 kJ at a 0.24 m2 vent area. Fig. 9b shows the correlation between the area of vent holes and the total heat supply of the Trombe wall. It is noteworthy that the wall’s total heat supply increased and then decreased as the vent area increased from 0.1 to0.3 m2. At 0.24 m2, the total heat supply hit its peak at 41.36 MJ, which indicated that this value represented the optimal area of the vent holes.

Figure 9: Influence of vent hole area on the amount of heat supplied by the Trombe wall: (a) Hourly heat supply of the Trombe wall with different vent hole areas; (b) Total heat supply of the Trombe wall with different vent hole areas
Reason for the varying total heat supply of a Trombe wall in relation to the size of ventilation holes: as the area of vent holes is increased, the airflow rate across the air layer rises, and the airflow rate into and out of the air layer also increases, resulting in an initial increase followed by a decrease in heat supply. At the same time, the convective heat supply of the Trombe wall increases due to the increased air flow rate, which enhances the convective heat transfer between the air within the air layer and the outer surface of the Trombe wall. However, as the area of vent holes is increased, the Trombe wall’s temperature decreases due to an increase in convection heat transfer. This decrease in temperature leads to a reduction in conductive heat supply from the Trombe wall to the room. When the convective heat supply increase is less than the conductive heat supply decrease, the total heat supply from the Trombe wall decreases.
3.2.3 Optimization of Insulation Thickness
In order to study the effect of insulation thickness on the heat supply of Trombe walls, simulations were carried out for Trombe walls with insulation thicknesses of 0, 20, 40, 60, 80, 100, 120, 140, 160, 180 and 200 mm, respectively.
Fig. 10a shows the trend of hourly heat supply of the Trombe wall with different insulation thicknesses. During the period when the vents were opened, there was a growth in the average hourly heat supply of the Trombe wall from 2325.88 to 3067.35 kJ·h−1 as the thickness of the insulation was increased from 0 to 120 mm. The average hourly heat supply increased from 3067.35 to 3084.34 kJ.h−1 as the insulation layer’s thickness increased from 120 to 200 mm. Fig. 10b shows the correlation between the thickness of insulation and the total heat supply of the Trombe wall. As thickness increases from 0 to 120 mm, the total heat supply of the Trombe wall increased from 35.17 to 41.35 MJ. When the thickness of the insulation was increased from 120 to 200 mm, the total heat supply of the Trombe wall ranged from 40 to 41 MJ. In summary, the Trombe wall supplied the maximum amount of heat to the building at an insulation thickness of 120 mm.

Figure 10: Influence of insulation thickness on heat supplied by the trombe wall: (a) Hourly heat supply of Trombe walls with different insulation thicknesses; (b) Total heat supply of the Trombe wall with different insulation thicknesses
The total heat supply of the Trombe wall shows a trend of first increasing and then decreasing with the increase of the thickness of the insulation layer. This is due to the fact that as the thickness of the insulation increases, the thermal inertia of the Trombe wall increases and the amount of conductive heat transfer from the wall decreases, but the amount of hot air entering the room through the vents increases and the amount of convective heat supply increases, and when the increased amount of convective heat supply is less than the decreased amount of conductive heat supply, the total heat supply of the Trombe wall decreases.
3.2.4 Optimization of Solar Collector Area
In line with the low-temperature radiant floor systems heating requirements outlined in the “Design Code for Heating, Ventilation and Air Conditioning of Civil Buildings” (GB50736-2012), the target minimum heating water inlet temperature for low-temperature radiant floor systems is 30°C. In this study, collector areas of 20 to 40 m2 were selected to simulate and analyze the heat supply and solar energy guarantee of systems with different collector areas. The TRNSYS simulation results are presented in Table 3 and Fig. 11.
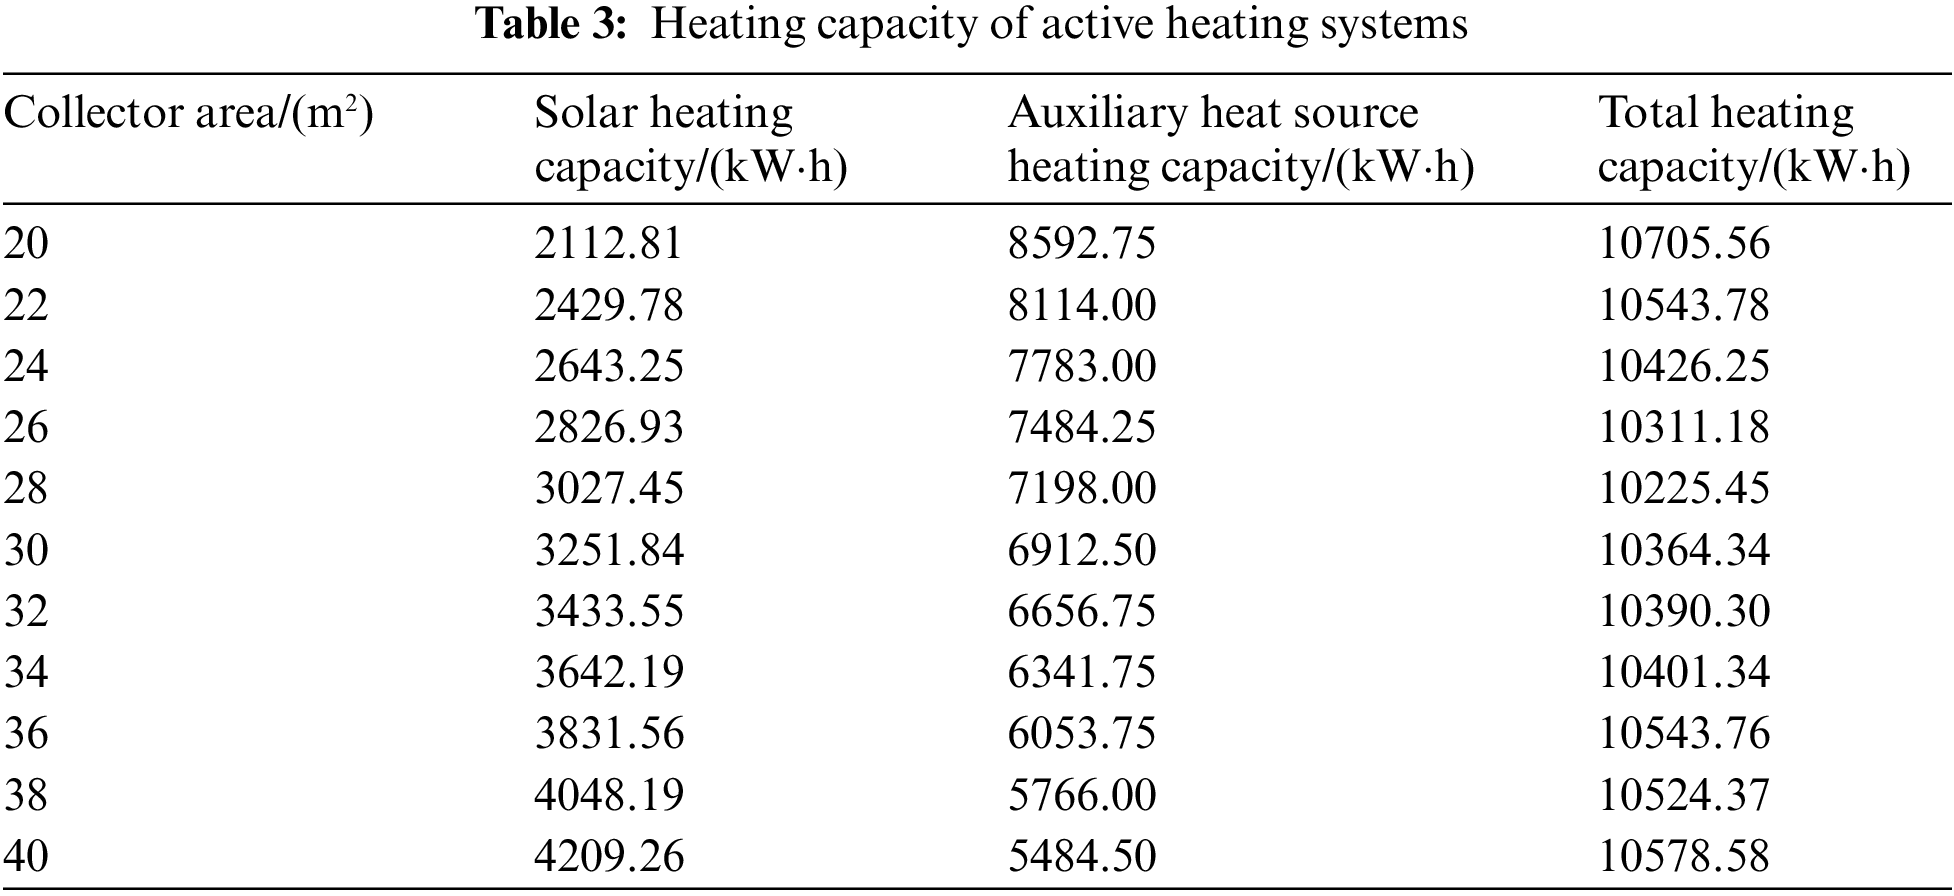

Figure 11: Variation of solar guarantee rate with solar collector area
As the collector area increased, the amount of solar heat supplied increased gradually, but the rate of increase diminished; conversely, the amount of auxiliary heat supplied decreased gradually as the collector area increased, but the rate of decrease slowed down. The solar guarantee rate’s growth rate decreased substantially between 26 and 30 m2 of collector area, with both changes being minimized at 28 m2 of collector area. Therefore, the collector area of the active heating system in the test house was selected to be about 28 m2 as the best, taking into account the economy of the system.
3.2.5 Optimization of Hot Water Storage Tank Volume
When designing a solar collector and determining its heat storage capacity, it is important to consider that a higher storage temperature in the tank results in a smaller volume of hot water storage, but greater heat loss for the system. Conversely, a lower storage temperature leads to a larger volume of hot water storage and lower heat loss. It is essential to find the optimal volume for the tank.
The study analyzed the impact of varying hot water storage tank volumes on the energy supply for the system, ranging from 0.6 to 2.0 m3. The findings from the TRNSYS simulation analysis are presented in Fig. 12.

Figure 12: Changes in system performance for different storage tank capacities
As the volume of the heat storage tank increased, so did its heat supply. At a volume of 1.4 m3, the tank’s heat supply peaked at 467 kW·h before gradually decreasing. Ultimately, the ideal volume for the water tank is 1.4 m3.
3.2.6 Optimization of System Pipeline Flow
The exchange of heat between the water tank and solar collector is carried out by the plate heat exchanger, so the mass flow on both sides of the plate heat exchanger has a direct impact on the thermal efficiency of the system. There is an optimal combination of mass flow on both sides to maximize the heat collection of the system (Collector side: mass flow between the plate heat exchanger and solar collector; Heat exchanger side: mass flow between the storage tank and the plate heat exchanger).
In this study, TRNSYS software was used to simulate the system’s performance, with flow rates ranging from 200 to 800 kg/h on both the collector and heat exchanger sides. The heat of the tanks was compared during the test period of the orthogonal test to determine the optimal mass flow rates at both ends of the plate heat exchanger. The orthogonal test results are shown in Table 4.
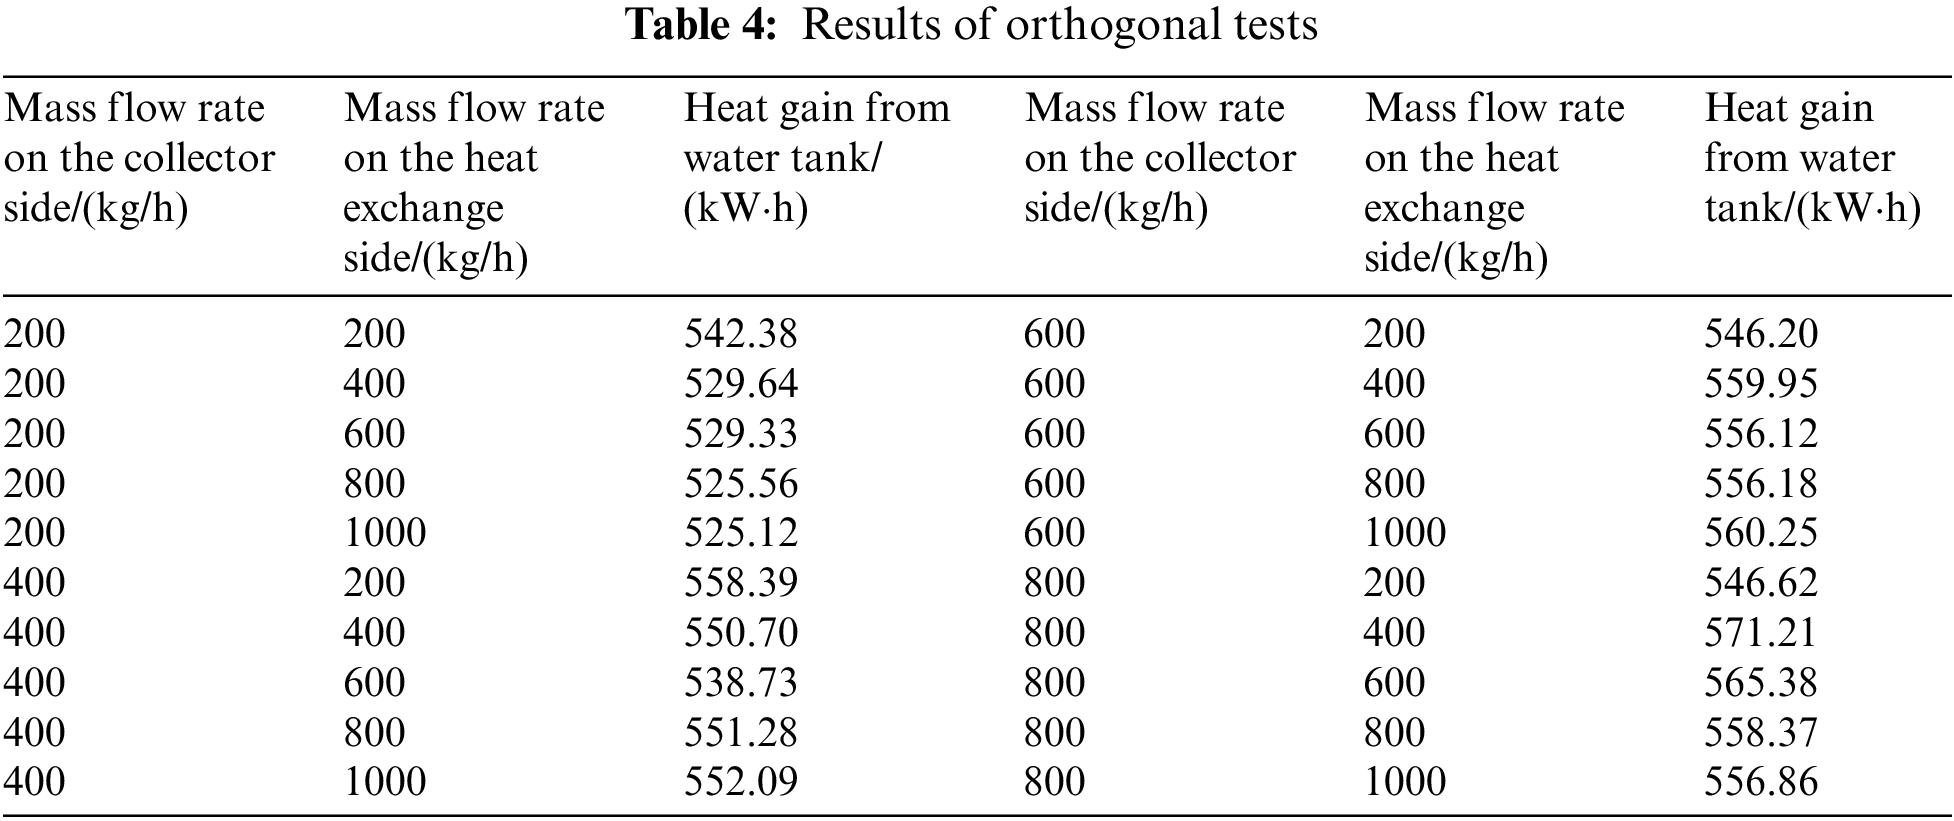
When the collector side’s mass flow rate was 800 kg/h and the heat exchanger side’s mass flow rate was 400 kg/h, the hot water storage tank gained the most heat. Therefore, the collector side’s flow rate should be set to 800 kg/h and the heat exchanger side’s mass flow rate should be set to 400 kg/h when the system was in operation.
3.2.7 Optimization of Output Power for Auxiliary Heat Sources
Inadequate power output from the auxiliary heat source can cause inadequate indoor heating. However, if the power output is too great, heat loss may increase, significantly reducing efficiency and overall cost-effectiveness. Therefore, selecting the appropriate power output is critical to the efficient operation of the system. According to GB50736-2012, the design code for heating, ventilation, and air conditioning in civil buildings [17], the optimal temperature range for low-temperature radiant floor system piping is between 35°C and 45°C, and should not exceed 60°C. Additionally, in order to meet specification requirements for thermal comfort in the test building during the heating period, the extreme weather conditions must be taken into account by the auxiliary heat source heating situation. Based on the above considerations, TRNSYS software was used in this study to simulate the heating effect of the auxiliary heat source in the absence of solar heating, and the results are shown in Fig. 13.

Figure 13: Variation of maximum and average daily inlet water temperatures for underfloor heating with the power of the auxiliary heat source during the test period
As shown in the figure, when the auxiliary power of the heating system was within the scope of 5 to 9 kW, the average temperature of the water entering the underfloor heating network was 35°C to 45°C. Thus, the auxiliary heat source may be chosen from the range of 5 to 9 kW. In this study, an auxiliary heat source of a biomass boiler with a rated power and fuel quantity of 7 kW and 6 kg·h−1 was chosen.
4 Experimental Results and Validation
4.1 Comparative Analysis of Simulation and Test Results
To verify the accuracy of the above model, the indoor thermal environment was simulated under measured climatic conditions. In this study, the climatic conditions of December 21, 2021 were selected for simulation, and the outdoor environmental parameters on that date are shown in Fig. 14.

Figure 14: Outdoor environmental parameters on test day
As shown in the figure, the outdoor temperature fluctuated between 1.5°C and −10.6°C on that day, with a maximum solar radiation of 716.567 W/m2 and an average daily solar radiation of 206.45 W/m2.
4.1.1 Comparison of Simulation and Testing of the Trombe Wall
Fig. 15a displays the velocity distribution of vectors at X = 0.3 m for various moments of the vent holes located on the top of the Trombe wall. It was evident that the wind velocity of the vent holes decreased as it got nearer to the Trombe wall, with the maximum velocity located at the center. The wind velocity at the top vent hole had a minimum value of 0.73 m/s at 11:00 and reached a maximum value of 1.68 m/s at 14:00, representing an increase of 130% in wind velocity. Fig. 15b displays the temperature distribution of the upper vent hole located at Z = −0.665 m on the Trombe wall. The highest temperature recorded was 45.32°C at 14:00, while the lowest temperature was 21.30°C at 11:00. Figs. 16a and 16b display the differences between simulated and measured values, as well as the relative errors over time, for the temperature and wind speed of the upper vent. As shown in the figure, the simulated values and measured values exhibit a similar trend, and the maximum relative errors between simulated and measured values were below 15%, thereby satisfying stipulated criteria [18].

Figure 15: Simulation results: (a) The vent holes at the top of the heat storage wall are distributed at X = 0.3 m at different moments; (b) Temperature contour of different moments at the top vent at Z = −0.665 m of the Trombe wall

Figure 16: Comparison of simulated and measured values: (a) Simulated vs. measured values and relative errors of upper vent temperatures over time; (b) Simulated vs. measured values and relative errors of upper vent wind speed over time
In summary, by comparing the differences between the simulated and measured values of temperature and wind speed at the upper vent holes, it could be concluded that the model of the Trombe wall constructed in this study was accurate, and the above optimization study of the Trombe wall was reliable.
4.1.2 Comparison of Simulations and Tests of Active Heating Systems
To ensure model accuracy and minimize experimental error due to initial conditions, this study preheated the test building three days prior, pre-stored the water tank, and compared and analyzed the last day’s test data with data simulated by the TRNSYS model. Four key parameters were chosen for analysis: inlet and return water temperatures at the heating end, indoor temperature, solar heating power, and auxiliary heat source power, as illustrated in Fig. 17. Table 5 shows the calculated relative errors between simulated and measured values for the indoor temperature, and the inlet and return water temperatures for the underfloor heating, as well as the solar and auxiliary heat source power.

Figure 17: Simulation and experimental comparison of active heating systems: (a) Comparison of inlet and outlet water temperatures for underfloor heating; (b) Indoor temperature comparison; (c) Comparison of solar and auxiliary heat source heating power
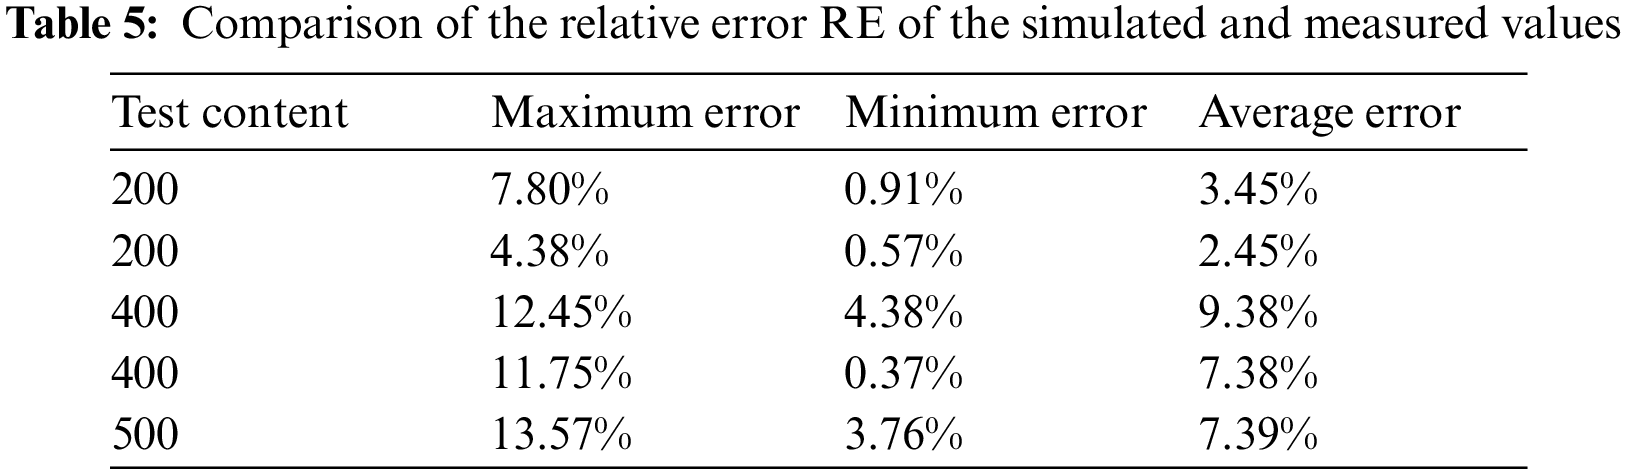
It could be seen that the trend of the TRNSYS simulation value was basically the same as that of the measured value. The relative errors RE of the five exemplary parameters remain below 15%. Therefore, the optimization design of the active heating system using TRNSYS reflects actual observations to some extent and the TRNSYS model aptly represents the active heating system’s real operational state.
The heating period in Tumushuku City, Xinjiang, extends from 15 November 2021 to 15 March 2022 and covers a duration of four months. To analyze the combined active-passive heating system’s performance during the heating period and the test room’s thermal environment, this study conducted experimental tests on three system modes: solar heating mode, biomass heating mode, and solar combined biomass mode.
At the end of the heating period, the intensity of solar radiation matches the heat load of the building and the heating system is switched on in solar heating mode. The data from 01 to 02 March 2022 was selected for analysis and the outdoor climatic conditions and system operation were shown in Fig. 18.

Figure 18: Operational test data for combined heating systems
During the test period depicted in Fig. 18, the outdoor temperature ranged from −3°C to 10°C and had an average temperature of 6.25°C. The solar radiation intensity attained a maximum of 678 W/m2 and had an average radiation intensity of 467 W/m2. In addition, the indoor temperature varied from 18°C to 23.16°C, with an average temperature of 20.15°C. The solar collector generated 98.27 kW·h of heat throughout the system’s operation.
As shown in Fig. 19, on 01 March, from 11:00 to 15:00, the temperature and wind speed in both upper and lower vents of the Trombe wall exhibited a gradual increase with time, and reached a maximum of 43.1°C, 25.4°C, 0.44 and 0.45 m/s at 16:00, and the temperature difference between the upper and lower vents reached a maximum of 17.7°C, which indicated that there was a significant temperature gradient within the air layer. This suggests the presence of an obvious temperature gradient inside the air layer of the Trombe wall. Between 3 PM and 7 PM, the temperature and wind speed in the upper and lower vents gradually decreased due to the outdoor temperature lowering and solar radiation intensity weakening. On 02 March, the temperature and wind speed changes in the upper and lower vents of the Trombe wall were similar to those on 01 March. At 3 PM, the temperature and wind speed in the upper and lower vents reached their maximum values of 57.3°C, 37.5°C, 0.53 and 0.47 m/s, respectively. The Trombe wall exhibited a heating capacity of 20.35 kW·h during the testing period.

Figure 19: Trombe wall operation test data
4.2.2 Solar Combined with Biomass Heating Model
When the building heat load exceeds the capacity of solar energy, the system activates the solar combined biomass heating mode. For analysis purposes, data from 08 January to 09 January 2022 has been selected. Fig. 17 shows the outdoor climatic conditions and system operation.
As shown in Fig. 20, the test period recorded an average outdoor temperature of −7.45°C, with maximum solar radiation intensity reaching 363.76 W/m2 and an average radiation intensity of 225.37 W/m2. The indoor temperature averaged at 20.02°C with minor fluctuations from 18°C to 22°C. When there is insufficient solar energy to heat the room solely, the biomass boiler is activated to consume biomass fuel in order to generate the necessary heat. The solar collector provided 28.26 kW·h of heat for the room, while the biomass boiler provided an additional 66.45 kW·h.

Figure 20: Running experiment data
On 08–09 January 2022, Fig. 21 shows that the upper and lower vents of the Trombe wall were opened at 11:00 and closed at 19:00. Between 12:00 and 15:00 on 08 January, the temperature and wind speed of the upper and lower vents gradually increased. The upper and lower vents’ temperature and wind speed peaked at 40.1°C, 27.4°C, 0.38 and 0.39 m/s at 15:00, with a maximum temperature difference of 15.7°C. Between 3:00 pm and 7:00 pm, the temperature and wind speed in the upper and lower vents gradually decreased due to the outdoor temperature drop and reduced solar radiation intensity. On 09 January, the temperature and wind speed in the lower vents of Trombe wall exhibited a changing trend that was similar to that of 8th January. The highest temperature and wind speed of the upper and lower vents were at their peak, hitting 41.3°C, 30.01°C, 0.43 and 0.41 m/s, respectively, at 3:00 PM. During the test period, the heating capacity of the Trombe wall amounted to 13.62 kW·h. In comparison with the solar heating mode, the capability of the Trombe wall in heating the test building was significantly reduced.

Figure 21: Trombe wall operation test data
In the event of continuous cloudy, rainy, or snowy weather, rendering solar energy unusable for heating, the active heating system is employed to warm the room. The testing phase spans from the 1st to the 2nd of January 2022, Fig. 22 shows the outdoor climate conditions and the operation of the system.

Figure 22: Test data of the biomass heating system
During the testing period, the figure shows that the mean outdoor temperature was −3.19°C, with a maximum solar radiation intensity of 382.35 W/m2 and an average radiation intensity of 172.68 W/m2. The indoor temperature varied between 18°C and 22°C, with an average temperature of 19.37°C. During system operation, the solar collectors solely received heat, whilst the biomass boiler consumed 24.05 kg of biomass fuel and generated 89.28 kW·h of heat to heat the rooms.
4.3 Analysis of Economic and Environmental Benefits of the System
4.3.1 Analysis of Economic Benefits
The economic efficiency of the system was an important evaluation index, and in this study, the economic efficiency of the combined heating system was analyzed using the levelized heating cost index, which was calculated by the following equation [19]:
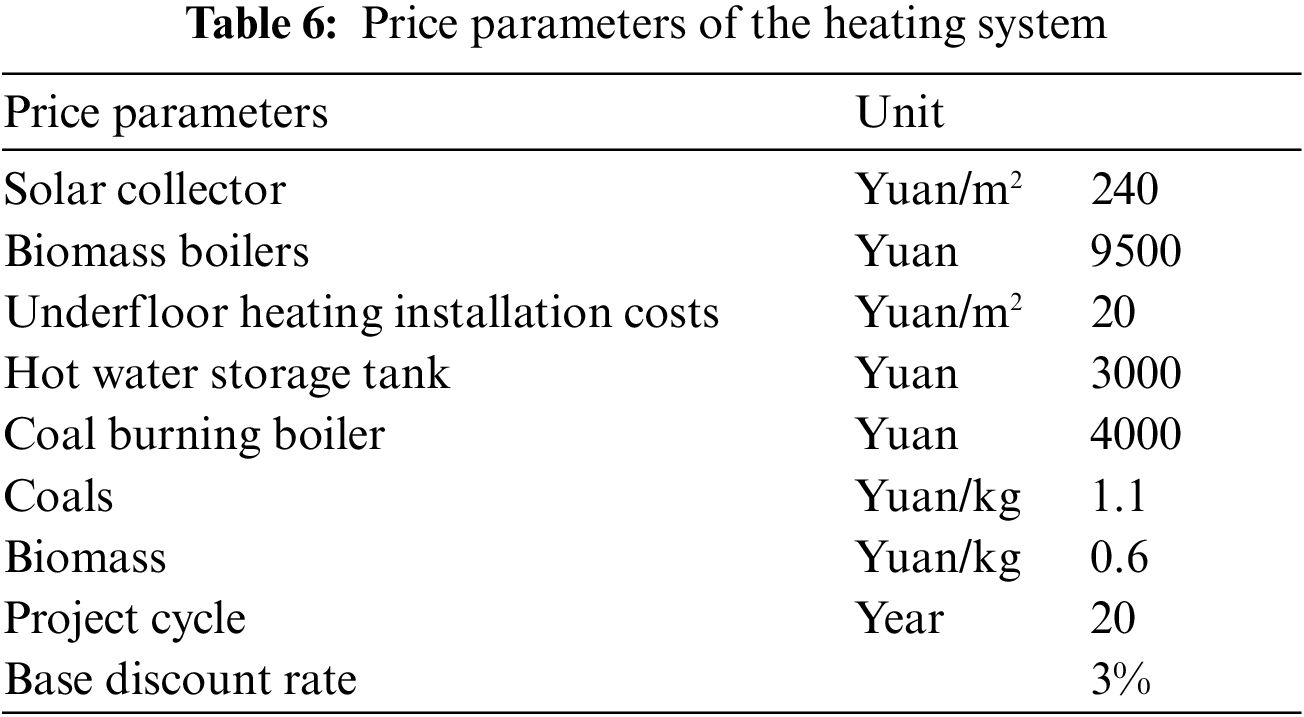
where: LCoH is the levelized cost of heating, Yuan/kW·h; Io is the initial investment in the system; CO is the operating cost of the system, including its environmental economic cost and fuel cost; r is the discount rate, which is taken as 3% according to the National Bureau of Statistics of China; Pt is the dynamic analysis period; Qt is the energy consumption of the building, kW·h; Pb is the price of biomass fuel, 0.6 Yuan/kW·h; Mb is the consumption of biomass pellet fuel, kg; E is the power consumption of the system, kW·h; and Pe is the electricity price, which is taken as 0.27 Yuan/kW·h.
During the test period, the combined heating system required no additional inputs other than daily operation after the installation was completed, and the initial investment in the combined heating system was 20,908 Yuan with an operating cost of 491.78 Yuan; The initial investment of the coal-fired heating system was 6,280 Yuan and the operating cost was 2,330.21 Yuan. The initial investment and price parameters of the system are shown in Table 6. Assuming that the service life of the system was 20 years, the results could be obtained by calculation as shown in Tables 7 and 8.
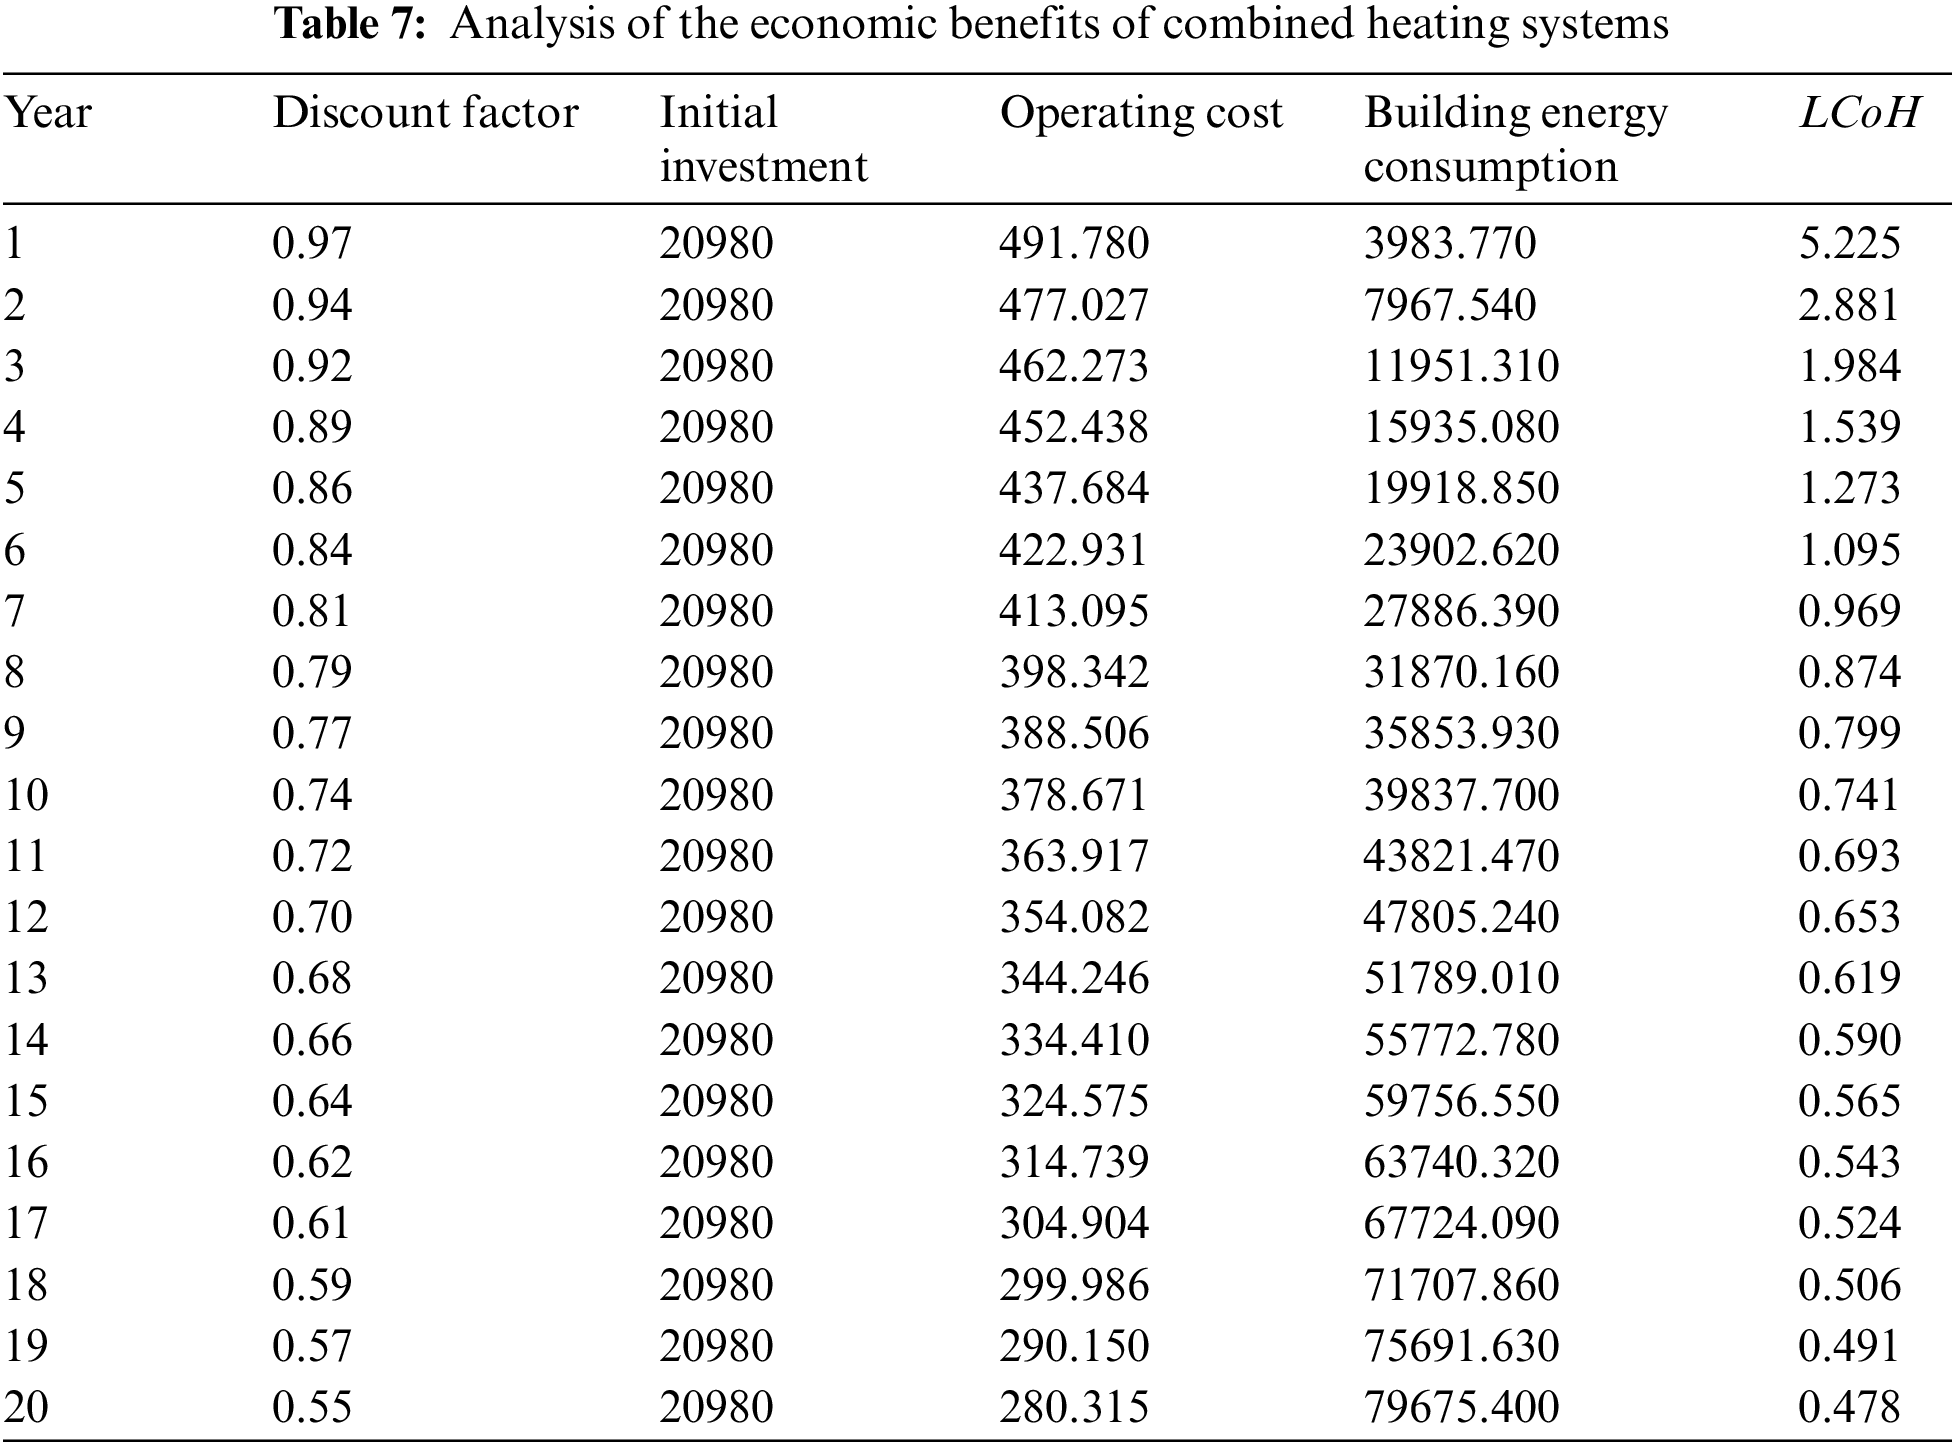
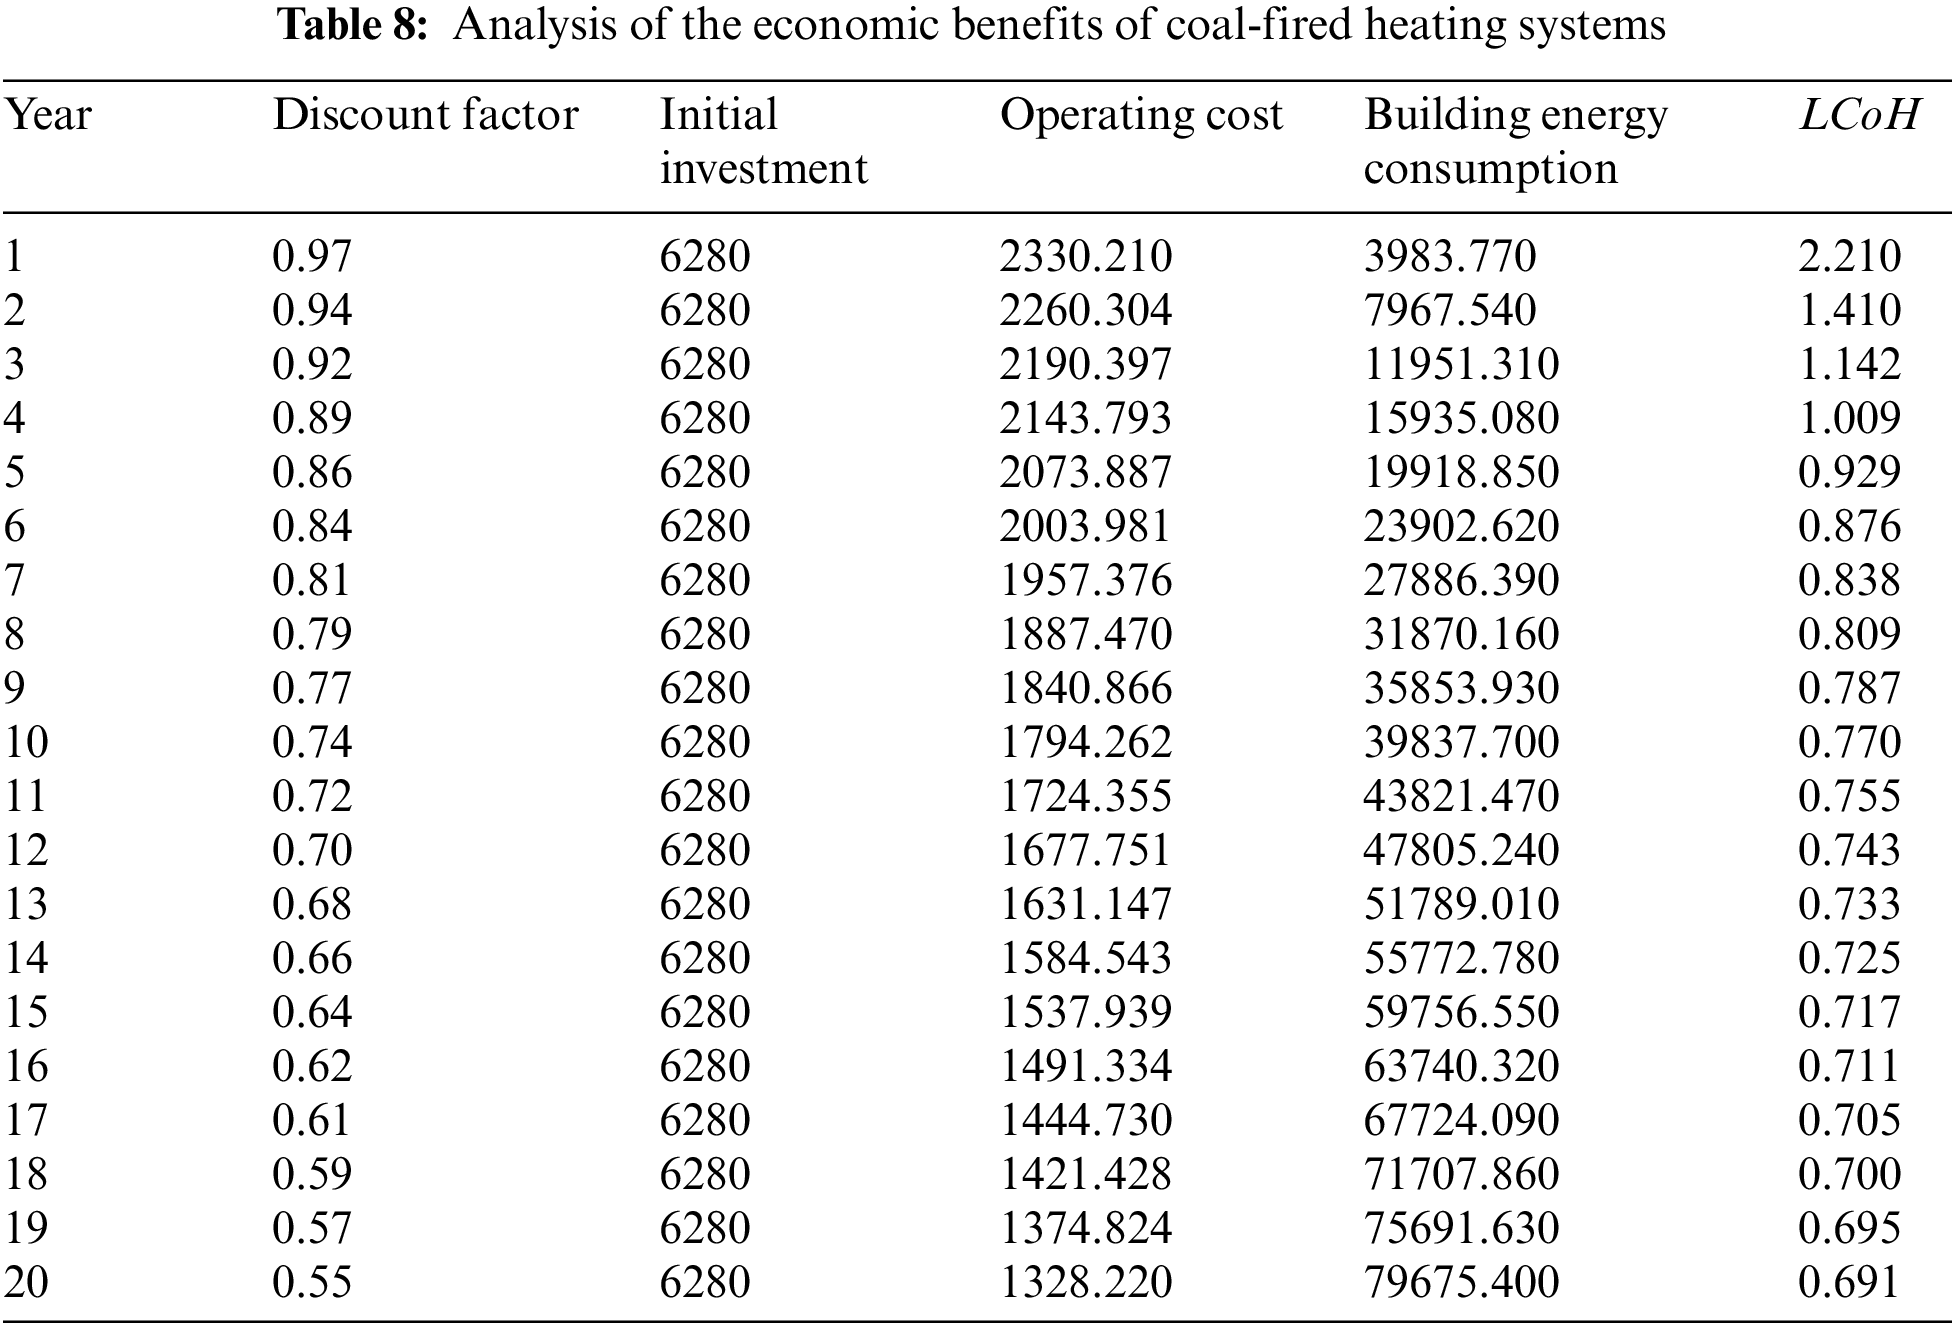
By comparing Tables 7 and 8, the combined heating system was economically better than the coal-fired heating system at the end of 10 years, and the benefits were substantial.
4.3.2 Analysis of Environmental Benefits
In order to analyze the environmental benefits of the combined heating system, this study used TRNSYS to analyze the CO2 emissions of the combined heating system as well as the coal-fired heating system.
As shown in Fig. 23, the CO2 emissions of the coal-fired heating system were more than the combined heating system, and the total CO2 emissions of the combined heating system and the coal-fired heating system during the test period were 1,139.57 and 4,431.82 kg, respectively. The high CO2 emissions of the coal-fired heating system were due to the fact that the coal-fired heating system had a single heat source, low combustion efficiency, and relied on burning coal for heating only.

Figure 23: Comparison of CO2 emissions from coal-fired heating systems and combined heating systems: (a) coal-fired heating systems; (b) combined heating systems
The distribution of residential areas in rural Southern Xinjiang is relatively scattered, and most of the residential buildings are small single buildings, that cannot realize centralized heating, and most of them use coal-fired boilers for heating. This heating mode has poor heating efficiency and serious environmental pollution, and there is a large waste of energy consumption. In addition, Southern Xinjiang has the advantages of abundant solar energy resources and biomass resources. This study shows that the Trombe wall coupled with a solar collector and biomass boiler as an auxiliary heat source has the advantage of a combined active-passive heating system applied to the rural areas in Southern Xinjiang.
Hei et al. [20] proposed that the greater the intensity of solar radiation, the higher the temperature of the upper vents of the Trombe wall, by monitoring the temperature of the upper vents of the Trombe wall in real-time, suggesting that the change in the temperature of the Trombe wall has a positive correlation effect with the intensity of solar radiation, which was confirmed by the measured results of the present study. Xu et al. [21] suggested that for rural residential solar systems in Xinjiang focusing on heating season use, it is more reasonable to select a collector area with a solar guarantee between 55% and 60%, in terms of energy savings. This is different from the results shown in this paper that the solar energy guarantee of 50% for the required collector area in the Southern Xinjiang region. This is due to the differences in winter temperatures in the Northern and Southern Xinjiang regions, which lead to differences in the required heating loads, and the winter temperatures in the Southern Xinjiang region are higher than the winter temperatures in the Northern Xinjiang region, so the solar energy guarantee rate of the required collector area in this study is slightly lower than the results of the scholar’s study. Li et al. [22] found that the heat supply of the Trombe wall is affected by the thickness of the air layer, which shows a change in general with the inter-air layer firstly increasing and then decreasing, which is consistent with the findings of this study. It is proved that a moderate thickness of the inter-air layer is more favorable for heat transfer for Trombe walls.
Applying the combined active-passive heating system proposed in this study to Southern Xinjiang not only meets the heating demand of the region but also effectively utilizes the local biomass energy source, which realizes the current requirement of “open source and cut down on expenses” for energy consumption. Future research should focus on reducing system costs and developing energy-saving technologies suitable for cold regions.
In this study, a combined active-passive heating system was proposed, and the parameters of the heating system were simulated and optimized using simulation software, and a test platform was established based on the simulation results. The test platform was tested for winter heating, and the test results show that:
(1) Based on the aim of maximizing the amount of heat provided to the room via the Trombe wall, it was concluded that the optimal air layer thickness of the wall is 75 mm, the best area for the top ventilation openings is 0.24 m2, and the ideal insulation thickness is 120 mm.
(2) Given the consideration of heating performance and economic viability of the combined heating system, the most ideal collector area for the active heating system in the test room is approximately 28 m2. Additionally, the optimal hot water storage tank volume is 1.4 m3. The flow rate on the collector side of the system should be 800 kg/h, whilst the mass flow rate on the heat exchanger side should be 400 kg/h. In order to achieve the best results, it is advised that the auxiliary heat source should possess an optimal output power of 5~9 kW.
(3) When there is an abundance of solar energy, it is utilized for heating the room. In the test period, the solar collectors supplied 98.27 kW·h of heat, while the Trombe wall provided 20.35 kW·h of heat. When the building’s heating demand surpasses the capacity of solar energy, a combination of biomass and solar energy is used. In the test period, the solar collector provided 28.26 kW·h worth of heat, while the biomass boiler added 66.45 kW·h, and the Trombe wall contributed an additional 13.62 kW·h. When solar energy is not available, the biomass boiler is used to burn biomass fuel and provide heat to the room. During the test period, 24.05 kg of biomass fuel was burned, resulting in the production of 89.28 kW·h of heat. Throughout the entire heating season, the combined heating system provides sufficient heat to meet the building’s heating demand and the indoor temperature is maintained within the range of 18 to 23°C, in compliance with the specified requirements.
(4) Combined heating systems are economically better than coal-fired heating systems after 10 years, with substantial returns; during the heating period, the total CO2 emission of the combined heating system was 1,139.57 kg, and the total CO2 emission of the coal-fired heating system was 4,431.82 kg, so the heating system had a better environmental benefit.
Acknowledgement: None.
Funding Statement: This study was funded by the Xinjiang Production and Construction Corps Southern Xinjiang Key Industry Support Program Project, Grant Number 2019DB007.
Author Contributions: Study conception and design: Xiaodan Wu, Jie Li, Yongbin Cai and Sihui Huang; data collection: Xiaodan Wu, Sihui Huang; analysis and interpretation of results: Xiaodan Wu, Sihui Huang; draft manuscript preparation: Xiaodan Wu, Sihui Huang. All authors reviewed the results and approved the final version of the manuscript.
Availability of Data and Materials: The data behind this article will be shared with the appropriate authors upon reasonable request.
Conflicts of Interest: The authors declare that they have no conflicts of interest to report regarding the present study.
References
1. Lu, Z., Li, J., He, Q., Zhao, Z. (2022). Spatiotemporal distribution of AOD in Southern Xinjiang and meteorological influencing factors. Acta Scientiae Circumstantiae, 42(3), 309–321 (In Chinese). [Google Scholar]
2. Abdeen, A., Serageldin, A. A., Ibrahim, M. G. E., El-Zafarany, A., Ookawara, S. et al. (2019). Experimental, analytical, and numerical investigation into the feasibility of integrating a passive Trombe wall into a single room. Applied Thermal Engineering, 154, 751–768. https://doi.org/10.1016/j.applthermaleng.2019.03.090 [Google Scholar] [CrossRef]
3. Jaber, S., Ajib, S. (2011). Optimum design of Trombe wall system in mediterranean region. Solar Energy, 85(9), 1891–1898. [Google Scholar]
4. Liu, Y., Cao, Y., Wang, D., Chen, Y. (2021). Matching optimization of solar heating system based on grid optimization algorithm. Acta Energiae Solaris Sinica, 42(4), 286–292. https://doi.org/10.1016/j.solener.2011.04.025 [Google Scholar] [CrossRef]
5. Feng, G., Wang, G., He, N., Li, Q., Chang, S. et al. (2022). Optimization of solar coupled electromagnetic energy heating system based on trnsYS. Building Energy Efficiency, 50(11), 72–79. [Google Scholar]
6. Li, J. P., Qu, C. F., Li, C. J., Liu, X. M., Novakovic, V. (2022). Technical and economic performance analysis of large flat plate solar collector coupled air source heat pump heating system. Energy and Buildings, 277, 112564. https://doi.org/10.1016/j.enbuild.2022.112564 [Google Scholar] [CrossRef]
7. Zhou, W. H., Wang, B., Wang, M., Chen, Y. Y. (2022). Performance analysis of the coupled heating system of the air-source heat pump, the energy accumulator and the water-source heat pump. Energies, 15(19), 7305. https://doi.org/10.3390/en15197305 [Google Scholar] [CrossRef]
8. Ma, W., Liu, J., Guo, Q., Yu, H. (2020). Experimental study on indoor thermal performance of combined active and passive solar heating house in alpine region. Acta Energiae Solaris Sinica, 41(11), 64–70. [Google Scholar]
9. Li, J., Wang, L., Zhen, X., Si, Z., Yang, A. (2018). Indoor thermal environment in northwest peasant house with incorporate heating of solar energy and coal fired boiler. Journal of Lanzhou University of Technology, 44(3), 62–67 (In Chinese). [Google Scholar]
10. Li, J., Wang, M. K., Xu, X. (2023). Exploratory research on the field application of solar assisted air source heat pump system for rural buildings in Xinjiang. Journal of Asian Architecture and Building Engineering, 22(1), 303–316. https://doi.org/10.1080/13467581.2021.2024434 [Google Scholar] [CrossRef]
11. Wang, W., Ji, J., Yu, Z., Sun, W. (2015). Simulation study of solar air heating in active and passive mode. Acta Energiae Solaris Sinica, 36(6), 1331–1336. [Google Scholar]
12. Yang, F. J., Kang, Y. M., Liu, Q. (2019). Surface solar radiation in Xinjiang and the applicability of CERES/SSF satellite data. Arid Zone Research, 36(6), 1401–1410. [Google Scholar]
13. Gu, W., Guli, J., Yin, H. M., Jiang, L. L., Zang, X. F. (2021). Spatial and temporal distribution characteristic and division research of solar energy resources in Southern Xinjiang. Arid Zone Research, 44(6), 1665–1675. https://doi.org/10.12118/j.issn.1000-6060.2021.06.15 [Google Scholar] [CrossRef]
14. Gao, Q., Zhou, L., Zhang, H., Wang, Y., Wu, P. (2021). Study on distribution and utilization of agricultural and forestry biomass resources in Southern Xinjiang. Xinjiang Agricultural Mechanization, 1, 17–22 (In Chinese). [Google Scholar]
15. Ministry of Housing and Urban-Rural Development of the People’s Republic of China (2012). Design code for heating ventilation and air conditioning of civil buildings (In Chinese). China: China Architecture & Building Press. [Google Scholar]
16. Ministry of Housing and Urban-Rural Development of the People’s Republic of China (2012). Evaluation standard for indoor thermal environment in civil buildings. China: China Architecture & Building Press. [Google Scholar]
17. Ministry of Housing and Urban-Rural Development of the People’s Republic of China (2019). Uniform standard for design of civil buildings, 50352-2019 (In Chinese). China: Standards Press of China. [Google Scholar]
18. Wu, W. (2017). Research on the application of new solar thermal technology in residential buildings. Theoretical Research in Urban Construction, 2, 155. [Google Scholar]
19. Huang, J., Fan, J., Furbo, S., Chen, D., Dai, Y. et al. (2019). Economic analysis and optimization of household solar heating technologies and systems. Sustainable Energy Technologies and Assessments, 36, 100532. https://doi.org/10.1016/j.seta.2019.100532 [Google Scholar] [CrossRef]
20. Hei, S. G., Zhang, H., Pan, W. J. (2021). A novel combined Trombe wall system for village houses in cold regions of China. Journal of Thermal Science, 30(6), 2254–2266. [Google Scholar]
21. Xu, X., Li, J., Wu, X. (2019). Study on solar heating design of rural house in Xinjiang severe cold region. Journal of Shihezi University (Natural Science), 37(1), 100–104 (In Chinese). [Google Scholar]
22. Li, J., Xu, X., Yao, X., Zhao, J. (2020). Analysis of passive reform and operation effect of rural house during the initial stage of heating in Xinjiang. Science Technology and Engineering, 20(13), 5332–5337. [Google Scholar]
Cite This Article
 Copyright © 2024 The Author(s). Published by Tech Science Press.
This work is licensed under a Creative Commons Attribution 4.0 International License , which permits unrestricted use, distribution, and reproduction in any medium, provided the original work is properly cited.
 Downloads
 Citation Tools