
 Submit a Paper
 Propose a Special lssue
 Open Access
ARTICLE

Optimal Scheduling Strategy of Source-Load-Storage Based on Wind Power Absorption Benefit
1 State Grid Henan Economic Research Institute, Zhengzhou, 450000, China
2 Zaozhuang Power Supply Company, State Grid Shandong Electric Power Company, Zaozhuang, 277000, China
3 Key Laboratory of Modern Power System Simulation and Control & Renewable Energy Technology, Ministry of Education, Northeast Electric Power University, Jilin, 132012, China
* Corresponding Author: Junhui Li. Email:
Energy Engineering 2024, 121(7), 1823-1846. https://doi.org/10.32604/ee.2024.048225
Received 01 December 2023; Accepted 22 January 2024; Issue published 11 June 2024
 View Full Text
 Download PDF
Abstract
In recent years, the proportion of installed wind power in the three north regions where wind power bases are concentrated is increasing, but the peak regulation capacity of the power grid in the three north regions of China is limited, resulting in insufficient local wind power consumption capacity. Therefore, this paper proposes a two-layer optimal scheduling strategy based on wind power consumption benefits to improve the power grid's wind power consumption capacity. The objective of the upper model is to minimize the peak-valley difference of the system load, which is mainly to optimize the system load by using the demand response resources, and to reduce the peak-valley difference of the system load to improve the peak load regulation capacity of the grid. The lower scheduling model is aimed at maximizing the system operation benefit, and the scheduling model is selected based on the rolling scheduling method. The load-side scheduling model needs to reallocate the absorbed wind power according to the response speed, absorption benefit, and curtailment penalty cost of the two DR dispatching resources. Finally, the measured data of a power grid are simulated by MATLAB, and the results show that: the proposed strategy can improve the power grid’s wind power consumption capacity and get a large wind power consumption benefit.Keywords
Nomenclature
| DR | Demand response |
| PDR | Price-based demand response |
| IDR | Incentive-based demand response |
| SOC | State of charge |
| Pwind,av | Average annual wind curtailment power of wind farms |
| Pz (t) | Wind farm group t wind power at time t |
| Pwindx(t) | The power grid can absorb the wind abandon power of the wind farm group at time t |
| Pz,max(t) | The scheduling model has the maximum operational power at time t |
| μqf | Wind curtailment penalty coefficient |
| μ | Scheduling model unit operating cost coefficient |
| Gz(t) | Feeding wind curtailment income |
| Cz(t) | Self-operating cost |
| Ploadmax,i | Load power in the jth sampling cycle during the load trough period. |
| Gth opg(d) | Operating power efficiency of thermal power station on day d |
| Gth cpg(d) | Operation compensation benefit of thermal power station on day d |
| Pthi,t | Power generation power of the thermal power unit i at time t |
| Pwindj,t | Wind turbine output power j at time t |
In order to achieve the carbon peak and carbon neutrality goals outlined in the “14th Five-Year Plan”, China is actively promoting the construction of new energy projects such as wind power and photovoltaics. By the end of 2021, China's total installed capacity of wind power reached 328 million kilowatts, with a newly added grid-connected capacity of 47.57 million kilowatts in 2021 alone. The national wind power installed capacity reached 652.6 billion kilowatt-hours, marking a 40.5% year-on-year growth [1]. However, the rapid growth in wind power installed capacity, regional distribution factors, and the inherent characteristics of wind power have resulted in a severe lack of peak-shifting capacity in certain regions of the power grid. The capacity for wind power integration remains insufficient, with regions like Xinjiang and Gansu in the western part of the country still exhibiting lower utilization rates compared to the national average [2,3]. As the scale of new energy consumption and wind power outward transmission is constrained, therefore, it has become a focus of attention from the perspective of source-load-storage to improve the local consumption capacity of wind power in areas with rich wind power resources.
At present, scholars both domestically and internationally have conducted extensive research on wind power integration form the aspects of the source side, load side and energy storage. Reference [4] proposes a hierarchical optimal dispatching method with a 3-tier optimization model of energy storage system-assisted deep peaking of thermal power units to reduce the peak-to-valley difference of system load and improve the space for wind power consumption. In reference [5], a renewable energy consumption method based on variational mode decomposition and combined regulation of thermal power and storage system is presented, which increases wind power absorption and reduces carbon costs. In reference [6], a battery-pack-based energy storage system is planned in a distribution system with distributed resources, especially considering the operating conditions of wind power generation and investment and operating costs. A three-stage approach is proposed to reduce the total planning and operating cost considering grid reliability; In reference [7], a master-slave game optimization model is developed for the joint dispatch of wind power with hydrogen storage and step hydro power, and a two-way tariff compensation policy is proposed to motivate the participation of hydro power in wind power consumption; In reference [8], this paper proposes a new strategy for demand response optimization scheduling based on blockchain and high-capacity enterprise priorities, and establish an optimization model of load aggregator participation in scheduling. It can effectively guarantee the income of load aggregators and improve the level of wind power consumption. Reference [9] presents a comprehensive approach for the distribution system expansion planning (DSEP) that considers investment, operation, carbon dioxide emission and reliability costs, as well as uncertainties over load demand and wind-based distributed generation. References [10,11] consider the discrete regulation characteristics of high-load load and the uncertainty of wind power output, establish a high-load load-wind power coordination scheduling model with risk constraints based on the goal of maximum wind power consumption, and propose a robust unit combination method based on the power fluctuation of high-load load to ensure the safety and economy of the power grid. A new DSM strategy [12] is proposed for the day-ahead scheduling problem in SGs with a high penetration of wind energy to optimize the tri-objective problem in SGs: operating cost and pollution emission minimization, the minimization of the cost associated with load curtailment, and the minimization of the deviation between wind turbine (WT) output power and demand. Reference [13] studies the short-term operation of a wind farm-pumped storage hydropower plant hybrid system which transmits power to multiple cross-regional power grids through ultra-high-voltage transmission lines to promote the consumption of wind power, and can also reduce the peak-valley difference of the REPGs. Reference [14] studies the absorption and wind abandon strategy of the electric and thermal combined system with the line transmission power limit or the “heat electric coupling” constraint as a single wind abandon cause. Therefore, it is only applicable to the problem of absorbing the wind abandonment caused by a single reason. At the same time, two kinds of wind abandonment reasons are considered to further improve the scheduling strategy of wind power absorption, an improved DC power flow algorithm considering the reconfiguration of power grid lines is proposed. In order to absorb large-scale wind power generation power locally and improve the peak regulating capacity of the power grid, reference [15] integrates wind power and energy storage models to a bulk power system model to sequentially evaluate the operational adequacy in the operational mission time in order to quantify the operational adequacy of a bulk power system integrated with wind power and ESS. The majority of the above literature primarily focuses on either enhancing the wind power integration capacity by coupling energy storage with thermal power plants on the supply side or establishing coordinated scheduling models solely between the demand side and the supply side to improve wind power integration. There has been limited consideration given to the involvement of the power supply side, demand side, and energy storage systems in maximizing the benefits of wind power integration, particularly in grid dispatch. This approach aims to enhance the peak load regulation capability of the grid, thereby improving the utilization of wind power.
Some scholars both domestically and internationally, comprehensively considered the three aspects of source, load and storage to increase the peak regulation space of the power grid, and established a source, load and storage scheduling model [16–18] to analyze its role in participating in the power grid. Reference [19] proposes an energy optimization strategy to minimize operation cost and carbon emission with and without demand response programs (DRPs) in the smart grid (SG) integrated with renewable energy sources (RESs). To achieve optimized results, probability density function (PDF) is proposed to predict the behavior of wind and solar energy sources. Reference [20] comprehensively considers the system economy and the wind abandonment rate of the power grid, and establishes an optimized scheduling model of the power system with energy storage, which takes into account the depth of thermal power peak regulation initiative and demand response, to improve the system's peak regulation capacity. Based on wind power abandonment and its variation trend. Reference [21] proposes a comprehensive optimal operational scheduling strategy-based algorithm for dynamically shaving or reducing peak power loads. For this purpose, a finite horizon scheduling optimization problem has been formulated to optimally control the real-time operation of the WF-PHES that incorporates both predictions of the power load and winds. Reference [22] proposes a novel probabilistic model for quantifying the impact of demand flexibility (DF) on the long-term generation system adequacy via Sequential Monte Carlo Simulation (SMCS) method, which can avoid load shedding and increasing the integration of variable renewable generation, such as wind power. Reference [23] proposes a three-state division method of power system states into normal state, alert state and emergency state, and established a phased optimal scheduling model of source, load and storage under different states. Reference [24] proposes a “source-net-load-storage” collaborative optimization operation method of comprehensive energy system considering wind power consumption and operation economic benefits, aiming at the wind abandoning problem caused by the traditional “heat and power” operation mode of co-generation. In reference [25], a multi-timescale coordinated optimum scheduling control method for a multi-source complementary power generation system taking the demand response into account is presented and the optimal operation of a wind–PV–thermal-pumped storage hybrid system is examined. This scheduling strategy may increase the amount of renewable energy consumed, minimize load fluctuations, increase system stability, and further reduce operating expenses, reference [26] proposes different optimal operational strategies for battery energy storage system (BESS) in coordination with wind based distributed generation for distribution network. The BESS charging and discharging schedules for all strategies are subjected to the network operational constraints, which can increase the economic benefits for the distribution system. Some of the above literatures either consider the economics of the power grid separately or the peak regulation of the power grid alone, and do not consider them together. Although the above studies comprehensively consider the economy and peak regulation. Analyze and establish the scheduling model of the source, load and storage participation system from multiple perspectives, they do not establish the dispatching model of load-side wind power absorption from the time scale.
This paper proposes a source-load-storage optimal scheduling strategy based on wind power consumption benefits. The main contributions of this paper are as follows:
(1) This paper considers the operation cost, consumption benefit and wind curtailment penalty cost of the three models of source-load-storage, establishes the source-load-storage scheduling model based on the constraints of thermal power unit climbing constraints, load-side demand response speed, energy storage system response capacity and other constraints, and takes the optimal comprehensive benefit of power grid wind power consumption as the goal.
(2) A two-layer optimal scheduling strategy of source-load-storage is proposed, which is based on wind power absorption efficiency.
In the example analysis section, a simulation calculation was carried out based on the actual operation data of a regional power grid to verify the absorption effect of the proposed optimal scheduling strategy and its impact on the power grid economy.
2 Analysis of Load-Side Demand Response Resources of the Power Grid
With the requirements of the sustainable development of our country, it is the future trend to develop new energy such as photovoltaic and wind power. Due to the increasing penetration level of wind power and the progress of electricity market reform, demand response can be used as a measure to absorb wind power to participate in power system scheduling.
At present, Demand Response resources are mainly divided into Price-based Demand Response (PDR) and Incentive-based Demand Response (IDR) [27]. PDR refers to the automatic adjustment of electricity consumption plans by power users according to the time-of-use price of the grid. For example, the load of electric vehicles can be freely adjusted according to the time-of-use price mechanism [28], and the charging period should be as far as possible during the off-peak load period of the grid, such as night and early morning. IDR mainly refers to some energy-intensive enterprises that sign contracts with the power grid, such as electrolytic aluminum enterprises. These energy-intensive enterprises are sensitive to the price of electricity and can be adjusted. They can dispatch wind power through the means of electricity prices and peak adjustment subsidies to absorb wind power.
High energy consumption loads can be divided into interruptible loads and adjustable loads [29]. Interruptible high-load energy mainly refers to SiC manufacturing enterprises, iron and steel smelting enterprises by signing electricity interruptible contracts with the power grid or according to the time-of-use pricing mechanism on the second day of load peak disconnected part of the load. This type of load has the characteristics of simple use, fast adjustment speed, large interruption ratio and no requirement of continuous production. Compared with the peak regulating the capacity of conventional thermal power units, the interruptible high-load load can obtain an excellent peak cutting effect during the peak hours of the power grid load.
The adjustable high-load energy mainly refers to the electricity consumption in peak or off-peak periods of the load by related enterprises such as electrolytic aluminum which cannot interrupt production through signing the electricity regulation contract with the power grid or according to the time-of-use price mechanism. Such external regulation high load can load a longer production cycle, and interrupt the operation complex and affect the product production, affect the service life of the production life, but you can adjust the power capacity in order to reduce the production cost, it can be power or with 110% PN at peak load of power grid in the off-peak load PN is running at 90% capacity production, And the adjustment process of changing the load running power does not affect the product quality and the service life of the production equipment. Compared with interruptible high-load load, adjustable high-load load has slower adjustment speed and larger climbing rate, and cannot run continuously at high or low power for a long time.
According to the response speed of DR Resources, they are divided into pre-scheduling resources and intraday scheduling resources, and intraday scheduling resources can be divided into hour-level DR Resources and minute-level DR Resources. This paper mainly participates in grid dispatching according to the cooperation between DR Resources and energy storage systems and conventional power sources during the day, and establishes an optimal source-load-storage dispatching model with the goal of maximizing the benefits of wind power.
According to the load situation of a region in Northeast China, the peak-valley load difference can be reduced by considering the load side's participation in power grid dispatching, as shown in Fig. 1.
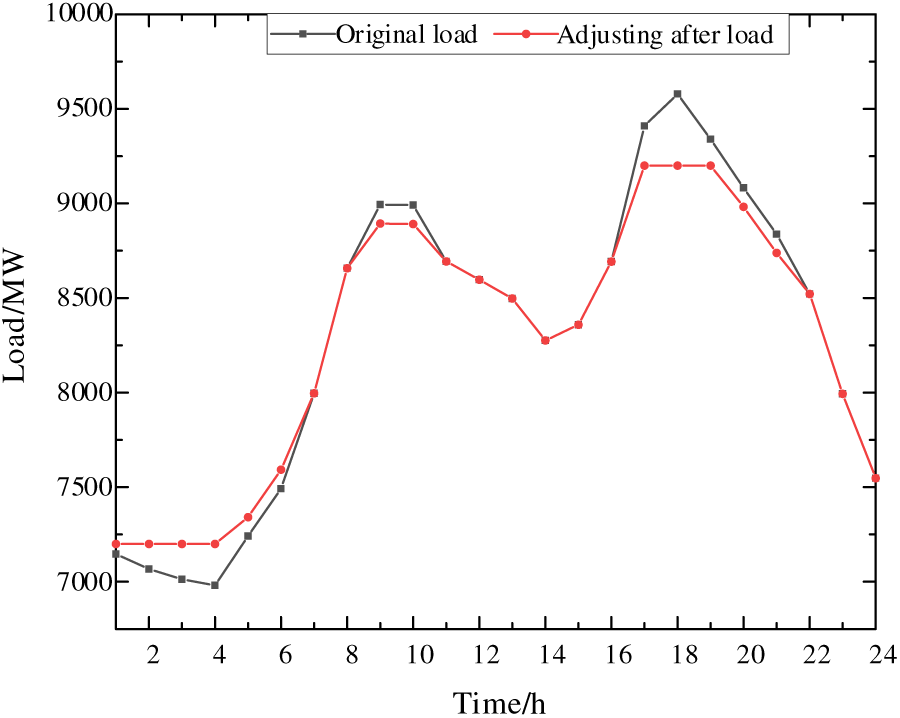
Figure 1: Load variation curve before and after adding DR Resources into the power grid
As can be seen from the figure above, when DR Resources were added to the power grid, the maximum peak-valley difference of load in one day was reduced by 598 MW, and the maximum peak-valley difference was reduced from 27.12% to 21.74%. During the low load period, the DR Resource ran for 6 h, and the maximum additional power was 219 MW. During peak load hours, the DR Resource ran for 7 h with a maximum reduced operating power of 379 MW.
3 Source-Load-Storage Optimization Scheduling Model
The scheduling model is mainly divided into upper and lower layers. The upper layer scheduling model is mainly to improve the peak regulating ability of the power-side scheduling model in the system, so the objective function is the minimum peak-valley difference of the system.
where, i is the number of sampling cycles in the peak load period; j is the number of sampling cycles in the load off-peak period; Ploadmax,i is the load power of the i th sampling period in the load peak period; Pload min,i is the load power of the j th sampling period in the load off-peak period.
The lower dispatching model mainly considers the benefits of three dispatching models and the penalty cost of wind abandoning. In order to obtain the maximum benefit of wind power consumed by wind farms, the objective function is established as follows:
where, Gth is the annual revenue of the thermal power station; Cth is the annual cost of the thermal power station; GDR,hour indicates the annual revenue of the hour-level DR Resource. CDR,hour indicates the annual cost of the hour-level DR Resource. GDR,Min indicates the annual revenue of minute DR Resources. CDR,Min is the annual cost of minute DR Resources; GHESS is the annual revenue of the energy storage system; CHESS is the annual cost of the energy storage system; Cqf is the penalty cost of wind abandonment in the power grid.
(1) Power side scheduling model
Generation side resources are mainly considered conventional thermal power units, and the scheduling model is established considering the output characteristics of thermal power units. Thermal power unit operation model.
where,
(2) Load side scheduling model
Based on the load-side demand response resources, it can be divided into two types: electricity price type and incentive type. The incentive type demand response resources are taken as the main body to guide them to participate in the power grid dispatching, and the incentive type load operation scheduling model is established [30,31].
Hourly DR Resources:
where,
Minute-level DR Resources:
(3) Scheduling model of energy storage system
Based on the type of energy storage system, the operation cost-benefit mathematical model of the energy storage system is established as follows:
Energy storage system benefits:
where,
Energy storage system cost:
where,
(1) Power balance constraint
where, Pthi,t is the generation power of thermal power unit i at time t; Pwindj,t is the output power of wind turbine j at time t; Pqt,t is the generating power of other power sources in the grid at time t; Pload,t is the load power of the grid at time t; PHESS,t is the charge-discharge power of the energy storage system at time t; PDR,t is the output power of DR Resource at time t; Pqf,t is the wind abandon power of wind farm group at time t.
(2) Constraints on thermal power units
where, Pth,i(t) is the output power of thermal power unit i in time period t; Pth,imin and Pth,imax are respectively the minimum and maximum output power of thermal power unit i;
(3) Demand response constraints
where, PDR,i(t) is the output power of DR Resource i in time period t; PDR,imin and PDR,imax are the minimum and maximum output power of DR Resource i, respectively.
(4) Energy storage system constraints
where,
4.1 Scheduling Model Architecture Diagram
Based on the above, the “source-load-storage” optimized dispatching strategy is proposed with the goal of minimizing the system peak and valley difference and the maximum benefit of power grid wind power consumption, and the two-layer dispatching model is established from the three aspects of power side, load side and energy storage system. The specific functions of the upper and lower dispatching model are shown in Fig. 2.
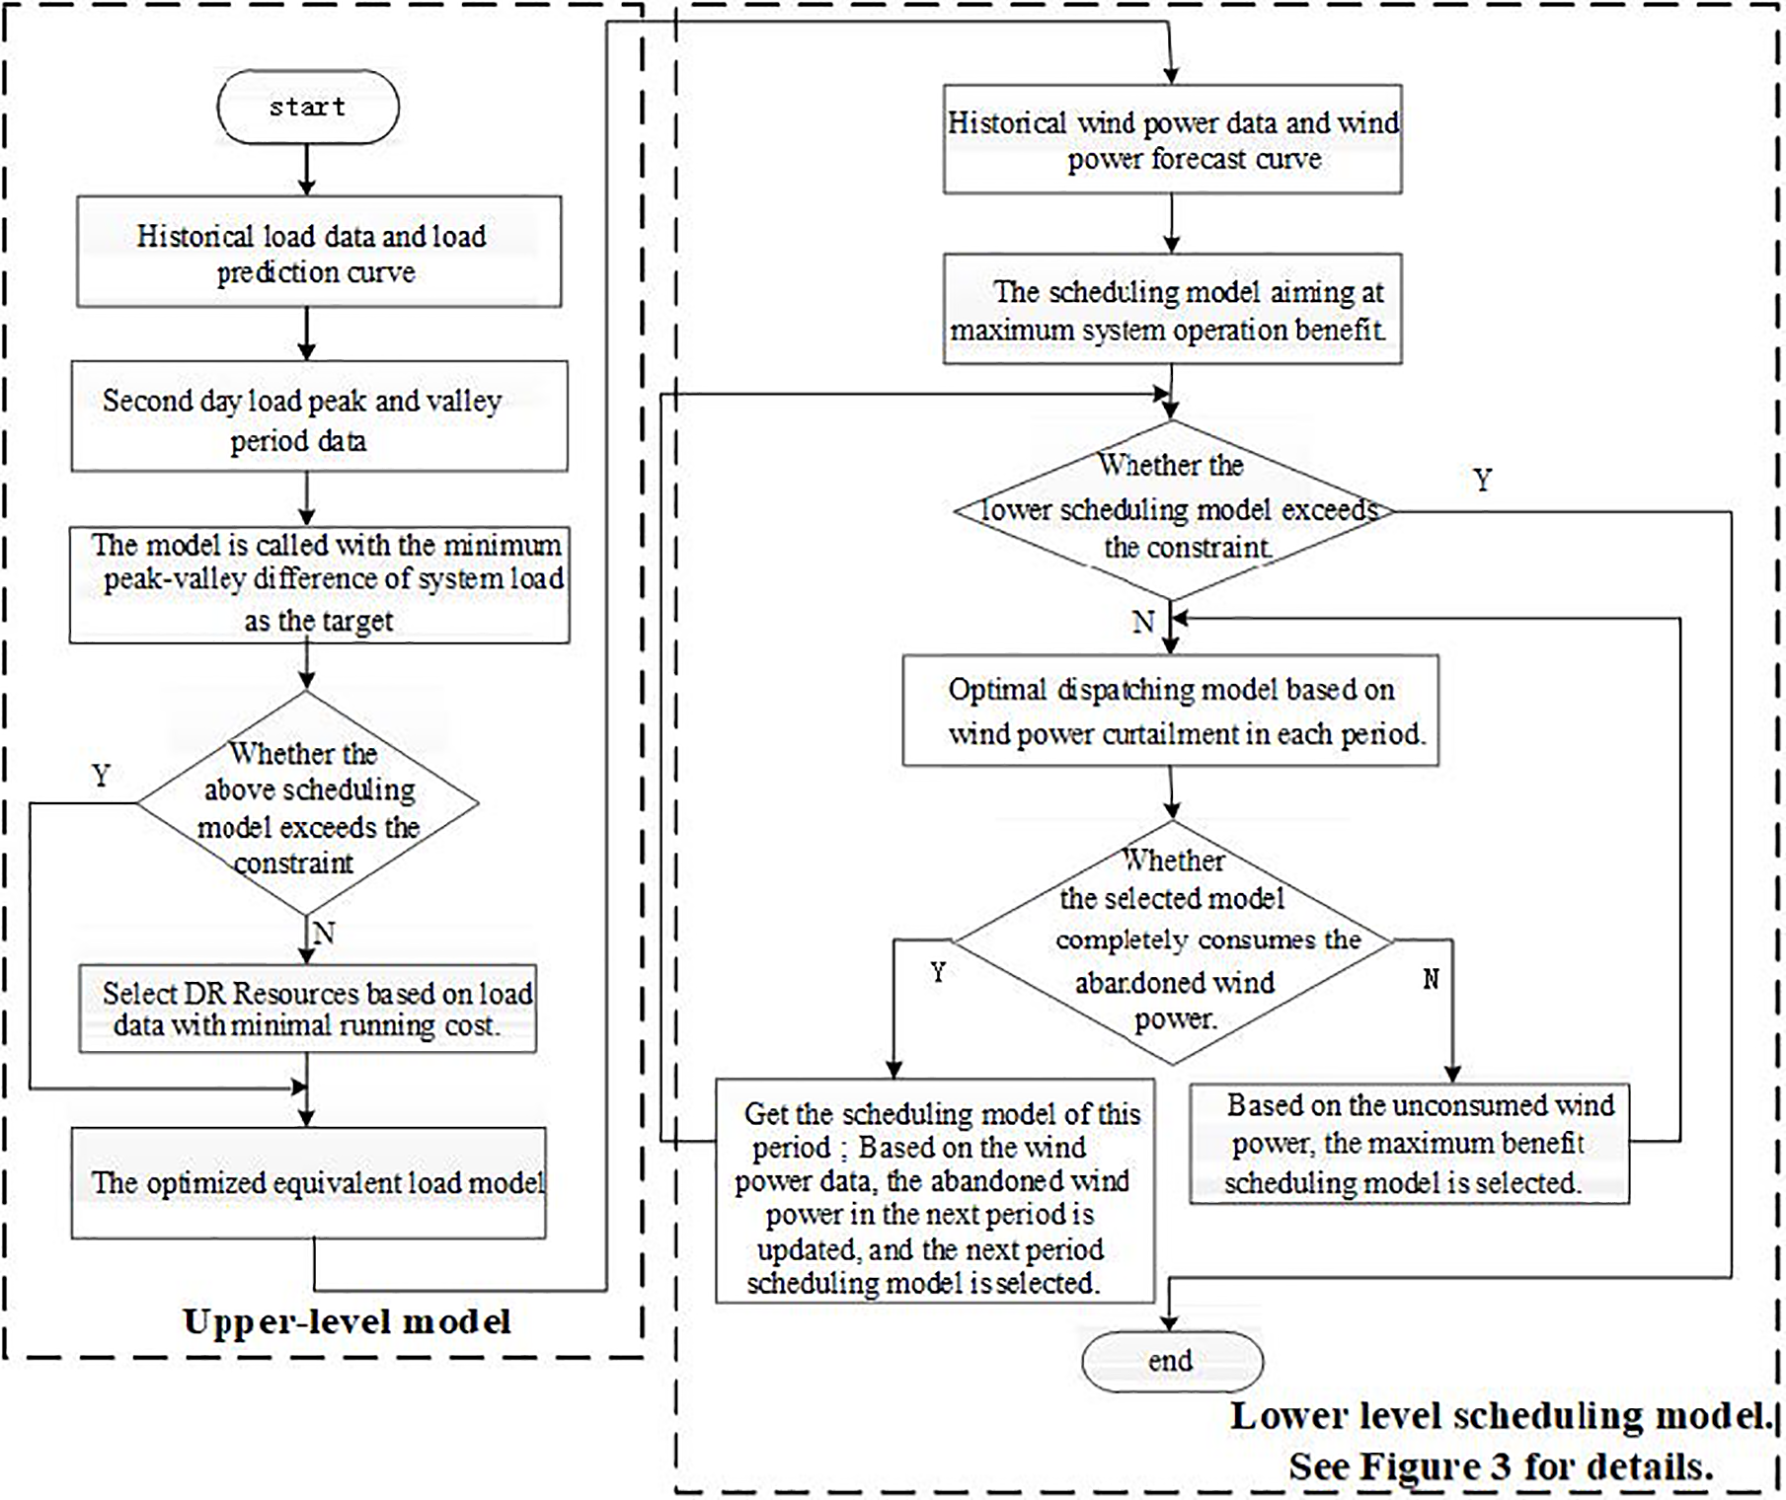
Figure 2: Overall architecture diagram of the scheduling model
The upper model aims to minimize the peak-valley difference of system load, mainly uses the electricity price demand response resources to optimize the system load, and reduces the power consumption at peak hours of the grid load, and increases the power consumption at the trough time of the load and the trough of the load, thereby reducing the peak-valley difference of the system load, and further improving the peak shaving capacity of thermal power units, and then obtaining the optimized load operation data.
The lower-level scheduling model aims to maximize the efficiency of system operation, selects the scheduling model based on the rolling scheduling method, first selects and calls three lower-level scheduling models based on the equivalent load operation data and predicted wind power data, and then compares whether the selected scheduling model can completely absorb the abandoned wind power of wind farms. If a single scheduling model cannot absorb the curtailed wind, consider the wind power revenue again to select the remaining scheduling model, until all the scheduling models reach the maximum operating state or the wind farm group abandonment yield is negative, the real-time load and wind power data of the current period can be obtained as the scheduling plan progresses, and the forecast data of the next cycle can be updated to correct the operation status of the next cycle scheduling model. The lower-level dispatching model not only improves the operation efficiency of the system, but also reduces the abandoned wind power of the wind farm group in the system, and improves the wind power absorption capacity of the power grid. The specific control block diagram of the lower-level optimal scheduling model is depicted in detail in Fig. 3, which includes the method of scheduling model control and the power allocation method of the DR scheduling model.
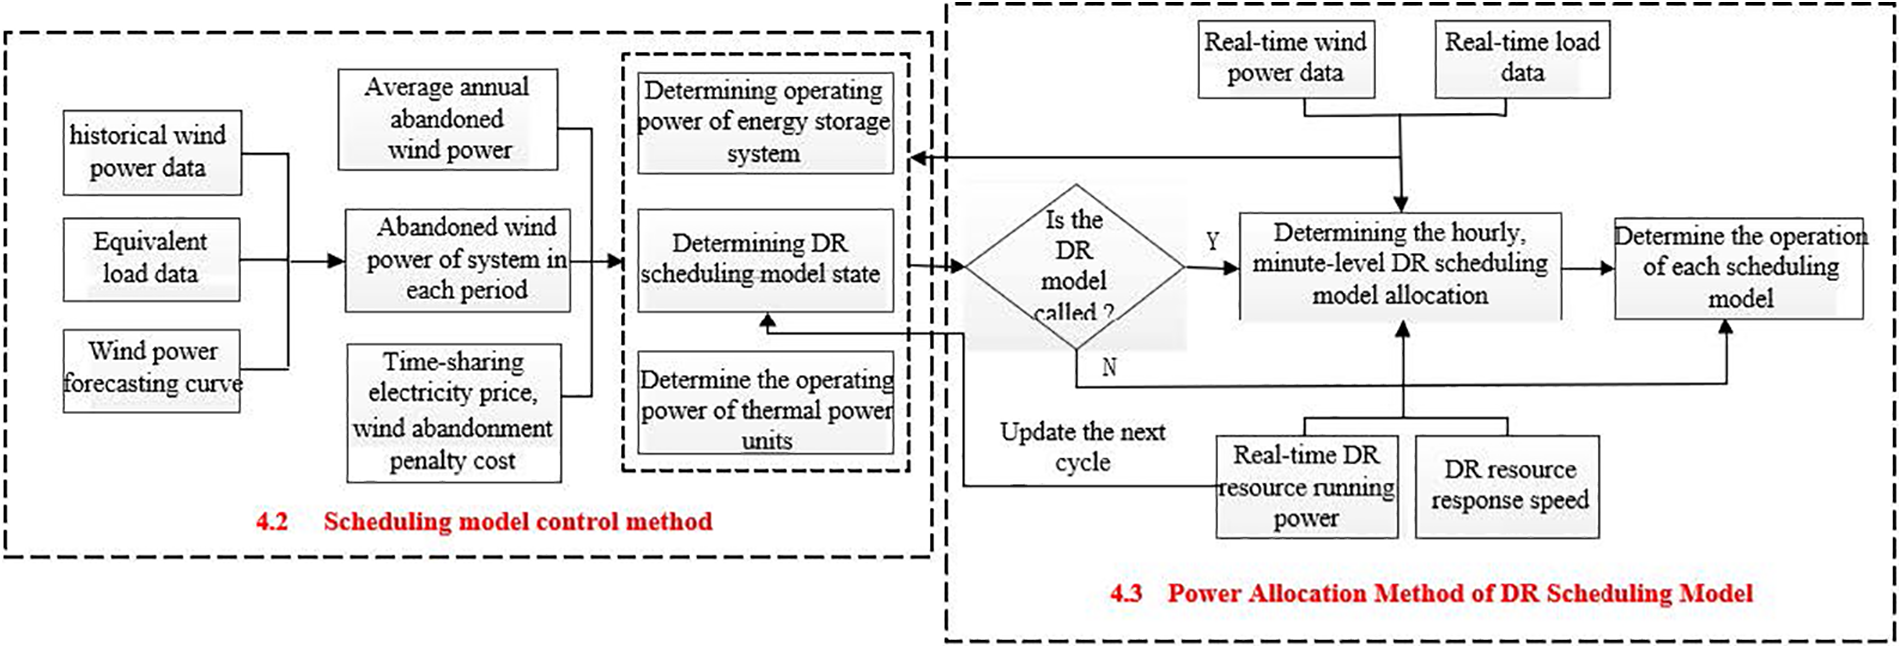
Figure 3: Control block diagram of lower-level scheduling model
4.2 Scheduling Model Control Method
Because the operation process of the upper model mainly adopts demand response resources, which do not involve the power side and energy storage system, so the control method is not complicated, this part mainly analyzes the lower dispatching model.
The lower dispatching model mainly considers the operation benefits of the three dispatching models, wind abandon penalty cost, climbing constraints of thermal power units, load side demand response speed, and response capacity of energy storage system. Aiming at the optimal comprehensive benefits of wind power consumption, the optimal dispatching model framework is established as follows.
Determine the average curtailed wind power of the wind farm cluster based on historical wind power data, namely:
Pwind, av is the annual average curtailment power of the wind farm cluster;
According to the influence of different annual average wind power abandonment on the economic benefits of each dispatching model and the duration of different wind abandonment power [32], The time periods of wind discard power [0,0.8Pwind, av], [0.8Pwind, av,1.2Pwind, av] and [1.2Pwind, av, ∞] are defined as L, M and H, respectively. The specific optimization control method of the lower layer scheduling model is as follows:
1) When the wind farm group has high curtailment power
where, Pwindz(t) is the power grid that can absorb wind power abandonment at time t of the wind farm group; P1z(t), P2z(t), and P3z(t) are the operating power of each dispatching model at time t; P1z,max(t),P2z,max(t) and P3z, max(t) are the maximum operating power at time t of each dispatching model;
When

Figure 4: Scheduling model state diagram at high wind abandoning power
Situation 1: When only one dispatching model is involved in the operation of the power grid, the wind abandon power can be satisfied, namely P1z,max (t) ≥ Pz (t). According to the economic benefit and operating cost of wind farm wind abandonment, the scheduling model with the largest net benefit of wind abandon is selected, and the operating power of scheduling model 1 Pz1 z (t) is not greater than the maximum operating power P1z,max (t) of the selected dispatching model. If the abandon revenue of the scheduling model is less than its own operating cost, that is, Gz1 (t) < Cz1 (t), and each scheduling model does not participate in the operation, the wind abandon power Pwindx (t) = 0, and the unused wind abandon power Pwindz (t) = Pz (t).
Situation 2: When the two dispatching models participate in the operation of the power grid, it is first necessary to exclude the dispatching model with the smallest net benefit from wind curtailment, select the remaining two models to absorb wind curtailment in the wind farm group, and the operating power P2z(t) of the dispatching model 2 is not greater than the maximum operating power P2z,max(t) of the dispatching model with the middle net income, if the dispatching model absorbs the curtailed wind benefit less than its own operating cost, that is, G2z(t) < C2z(t), which is converted to case 1.
Situation 3: If the maximum operating power of the three dispatching models is less than the curtailment power, that is, P1z,max (t) + P2z,max (t) + P3z,max (t) < Pz (t), then there is part of the inability to avoid the curtailment power P wind z (t), at this time the maximum operating power of the dispatching model is taken to the maximum, on the contrary, when the maximum operating power of the three dispatching models is greater than or equal to the curtailment power, in order to avoid the increase of the system curtailment penalty cost, under the premise of meeting the constraints of the three dispatching models, The model should be called as much as possible to absorb curtailed wind, and the operating power Pz3 (t) of the dispatching model 3 is not greater than the maximum operating power P3z,max (t) of the dispatching model with the smallest net benefit, if the dispatching model absorbs the curtailment benefit at this time is less than its own operating cost, that is, Gz3 (t) < Cz3 (t), which is converted to case 2.
2) When the curtailed wind power of the wind farm group is at an average level
The operation situation of this scheme is basically similar to the previous scheme, only in order to maximize the benefit of wind consumption and curtailment. Considering the characteristics of fast energy storage response speed and high single operation cost, the energy storage system capacity is selectively used selectively.
3) When the curtailed wind power of the wind farm group is low (
where,
When

Figure 5: Scheduling model state diagram at low wind curtailment power
Situation 1: Only one dispatching model participates in the operation of the power grid, due to the small curtailment power of the wind farm group, that is, P1z,max (t) ≥ Pz (t), in order to avoid the simultaneous operation of multiple dispatching models leading to an increase in the cost of absorption, select the dispatching model with the smallest operating cost of absorbing curtailed wind, when Gz2(t)-Cz2 (t) < Cqf (t) or Gz1(t) < Cz1(t), wind curtailment will inevitably occur at this time, on the contrary, model 1 will be called to participate in the absorption of wind farm group curtailment and the operating power of dispatch model 1 Pz1 (t) meets the constraints of the selected dispatching model.
Situation 2: When the two dispatching models participate in the operation of the power grid, it is first necessary to exclude the dispatching model with the largest operating cost of wind curtailment, select the remaining two models to absorb wind farm group curtailment, and the operating power Pz2(t) of the dispatching model 2 meets the constraints of the selected dispatching model, if the net benefit of the two models is less than the penalty cost of curtailment or the absorption benefit of the dispatching model 2 is less than the dispatching cost, it will be converted to case one.
Situation 3: The three scheduling models are involved in the operation of the power grid, if P1z,max (t) + P2z,max (t) + P3z,max (t) < P z(t), then there is part of the unavoidable wind curtailment power Pwind z (t), at this time the dispatching model operating power takes the maximum value, in order to absorb the wind farm group curtailment as much as possible, comprehensively considering the curtailment penalty cost and model scheduling cost, the model is called successively according to the size of the operating cost, When the system curtailment penalty cost is greater than the dispatching model to absorb the curtailment operating cost, this is the third case, and the dispatching model 3 operating power Pz3 (t) meets the scheduling model constraint with the largest selected operating cost, so it will convert to case 2.
4.3 DR Scheduling Model Power Allocation Method
On the basis of determining the operating change power of the load-side scheduling model, the response speed, absorption benefit, and curtailment penalty cost of the two DR dispatching resources are comprehensively considered, and the curtailment power is allocated again, and the specific DR scheduling model consumption curtailment distribution control block diagram is as Fig. 6.

Figure 6: Distribution control block diagram of the DR scheduling model
Firstly, based on the historical wind power data, historical load data and wind power forecast curve, the curtailment power P z (t) of each period of the day is determined, and the time-of-use electricity price of the power grid and the penalty cost of wind farm group curtailment are comprehensively considered, and on the basis of determining the call load-side scheduling model, the output power PDR, hour(t) of the hour-level DR dispatching model is determined within 24 periods. Secondly, we compare whether the value of P wind z(t) = P z(t) − PDR, hour(t) is greater than zero. If P wind z(t) > 0, it means that the hour-level DR scheduling model cannot fully absorb the wind farm group curtailment, and the minute-level DR dispatching model needs to be called, but it is necessary to consider whether the net benefit of calling the minute-level DR scheduling model to absorb curtailment is greater than the cost of curtailment penalty, such as GDR, Min(t) − CDR, Min(t) > Cqf(t). The output power PDR, Min(t) is determined on the basis of considering the operating power and real-time curtailment power in the previous dispatching cycle of the minute-level DR dispatching model. Then, based on the rolling scheduling method and real-time data, the output power of the hour-level DR scheduling model in the next period is continuously updated, and finally, the operation of the two DR scheduling models is obtained.
A wind farm group with an installed capacity of 1500 MW and a certain capacity of energy storage in a certain region has 5600 MW thermal power units and 3300 MW thermal power units, among which the minimum technical output is 50%, interruptible load is 100 MW and adjustable load is 500 MW, and the adjustment range is ±50 MW. In order to analyze the wind power consumption effect and operation economy of the proposed strategy in the power grid, this paper analyzes three Scenarios with examples, and the model in this paper is based on the MATLAB R2020a platform.
Scenario 1: Only the traditional power supply side is considered to participate in power grid scheduling, and load side scheduling and energy storage scheduling are not considered;
As can be seen from Fig. 7, under the premise of not considering the penalty cost of wind abandonment, only thermal power units participate in the Scenario of wind power abandonment of wind farm groups, and the wind abandonment absorption rate is 4.73 × 10³ MW·h within a week, and the wind abandonment absorption rate is 51.68%. In some cases, the thermal power units with large wind power abandonment cannot absorb wind power completely.

Figure 7: Variation of wind curtailment before and after dispatching on the power supply side
Scenario 2: The energy storage system is considered to cooperate with the power supply side to participate in the power grid dispatching, ignoring the load side dispatching;
As can be seen from Fig. 8, when the energy storage system cooperated with the power supply side to participate in the grid adjustment and absorption of wind power field group wind abandonment, the absorption of wind abandonment within a week was 6.73 × 10³ MW·h, and the absorption rate of wind abandonment was 73.61%, which was 2 × 10³ MW·h higher than that of the thermal power unit participating in the grid peak adjustment alone. The absorption rate increased by 21.93%.

Figure 8: Wind abandoning curve after energy storage and power supply side participate in dispatching
Scenario 3: The power supply side, load side, and energy storage system all participate in power grid dispatching;
As can be seen from Fig. 9, the proposed wind power plant group wind abandonment control strategy of source-load-storage participating in power grid dispatching includes 7.94 × 10³ MW·h of wind abandonment within a week, and the wind abandonment absorption rate is 86.8%, which is 35.12% and 13.19% higher than that of Scenario 1 and Scenario 2. In addition, the control strategy in this paper reduces the maximum peak-valley difference of the system by 31.24 MW by investing in DR Resources and an energy storage system.

Figure 9: Variation curve of wind curtailment after source-load-reservoir participation in scheduling
Compared with Scenario 1 and Scenario 2, the control strategy proposed in this paper can effectively reduce the low power operation state of thermal power units in order to absorb wind abandonment during load off-peak period, avoid increasing the emission of pollutants generated by thermal power unit operation, and greatly reduce the operation cost and carbon emission level of thermal power units. Compared with Scenario 2, the strategy proposed in this paper can effectively reduce the frequent charge-discharge process carried out by the energy storage system for the purpose of maximizing the wind abandoning economy of the wind farm cluster. In this way, the service life of the energy storage system can be extended and the operating cost of the energy storage system in the recycling cycle can be reduced.
5.1 The Influence of Load-Side Participation in Power Grid Dispatching on the Economy
By comparing Scenario 1, Scenario 2, and Scenario 3, the economic curve of wind absorption and abandonment is shown in the following figure.
As can be seen from Fig. 10 and Table A1 in Appendix, the wind farm group abandonment strategy proposed in this paper, namely Scenario 3, has higher economic benefits than only considering the traditional power side's participation in power grid dispatching (Scenario 1) and the energy storage system's participation in power grid dispatching with the power side (Scenario 2). The comprehensive income of Scenario 3 has increased by 54.11% compared with Scenario 1. The comprehensive income of Scenario 3 is reduced by 8.72% compared with that of Scenario 2. This is because the number of times invoking the energy storage system to absorb and discard wind in Scenario 2 is increased compared with that of Scenario 3. Therefore, the operating cost of Scenario 2 is increased by 37.25% compared with that of Scenario 3, as a result, the net income of Scenario 3 increased by 1.05 × 10⁶ yuan compared with that of Scenario 2, the net return rate of Scenario 3 increased by 55.57% compared with Scenario 2; Compared with Scenario 1, the comprehensive income of wind abandon absorbed by Scenario 2 increased by 2.01 × 10⁶ yuan, but the net income only increased by 1.63 × 10⁵ yuan. The main reason is that in Scenario 2, the energy storage system absorbed by wind abandon of the wind farm group was increased compared with Scenario 1. However, the operating cost of the energy storage system was higher, which made the final net income of Scenario 2 reduced by 12.54% compared with Scenario 1. However, the advantage of Scenario 2 compared with Scenario 1 is that the penalty cost of abandoning wind is reduced by 45.42%. The strategy proposed in this paper not only has strong advantages in terms of the net rate of return on wind abandonment, but also reduces the penalty cost of wind abandonment by 85.93% and 74.22% compared with Scenario 1 and Scenario 2. The main reason is that Scenario 3 has stronger economic advantages than Scenario 1 and Scenario 2 in terms of wind abandonment, which greatly reduces the wind power abandonment of wind farm groups under Scenario 3.

Figure 10: Economic curve of wind curtailment in different scenarios
As can be seen from Fig. 11, the net income of wind abandoning from the participation of source-load-storage in power grid dispatching can reach 1.98 × 10⁶ yuan, among which, the net income of wind abandoning absorbed by the power side dispatching model can reach 4.31 × 10⁵ yuan, accounting for 21.72% of the total income, and the net income of wind abandoning absorbed by the load side dispatching model can reach 1.38 × 10⁶ yuan. It accounts for 69.44% of the total revenue, and the energy storage system scheduling model consumes wind abandonment net income of 1.75 × 10⁵ yuan, accounting for 8.84% of the total revenue. There are two main reasons for the relatively low net income of the energy storage system: first, the primary investment cost of the energy storage system is high, which leads to the high operating cost of the energy storage system. The second is to reduce the energy storage system's participation in power grid scheduling in order to avoid the reduction of its service life caused by frequent charging and discharging.

Figure 11: Economic curve of wind abandoning in Scenario 3: source-load-storage consumption
5.2 Economic Analysis of Source-Charge-Storage Optimal Scheduling Strategy under Different Wind Power Permeability
Considering the increasing trend of wind power penetration in the future, this paper analyzes the economics of the proposed control strategy from two Scenarios.
Case 1: When the power-side dispatching model, load-side dispatching model, and energy storage system participate in the power grid dispatching and absorbing wind power, the number of thermal motor units, the scale of DR Resources, and the capacity of the energy storage system do not change under different wind power permeability.
Case 2: When the power side dispatching model, load side dispatching model, and energy storage system participate in the process of power grid dispatching and absorbing wind power, the number of fire motor units in operation does not change under different wind power permeability, but DR Resource scale and energy storage system capacity increase in a certain proportion according to the rising trend of wind power permeability.
It can be seen from Tables A2 and A3 in Appendix and Fig. 12 that, with the continuous increase of wind power permeability, Scenario 1 reaches its peak when the wind power permeability is around 40%, and the net income of Scenario 2 increases continuously. This is because the number of motor units in operation, the scale of DR Resources, and the capacity of the energy storage system do not change under this Scenario. However, with the increasing wind power permeability, the scale of the existing source-charge-storage scheduling model is not suitable for the current situation. In case 2, compared with case 1, the overall level of wind abandoning penalty cost is lower, mainly because the scale of DR Resources and the capacity of the energy storage system increase in a certain proportion, so that the DR scheduling model and energy storage scheduling model can absorb the increased wind power caused by the increase of wind-induced electrical permeability.
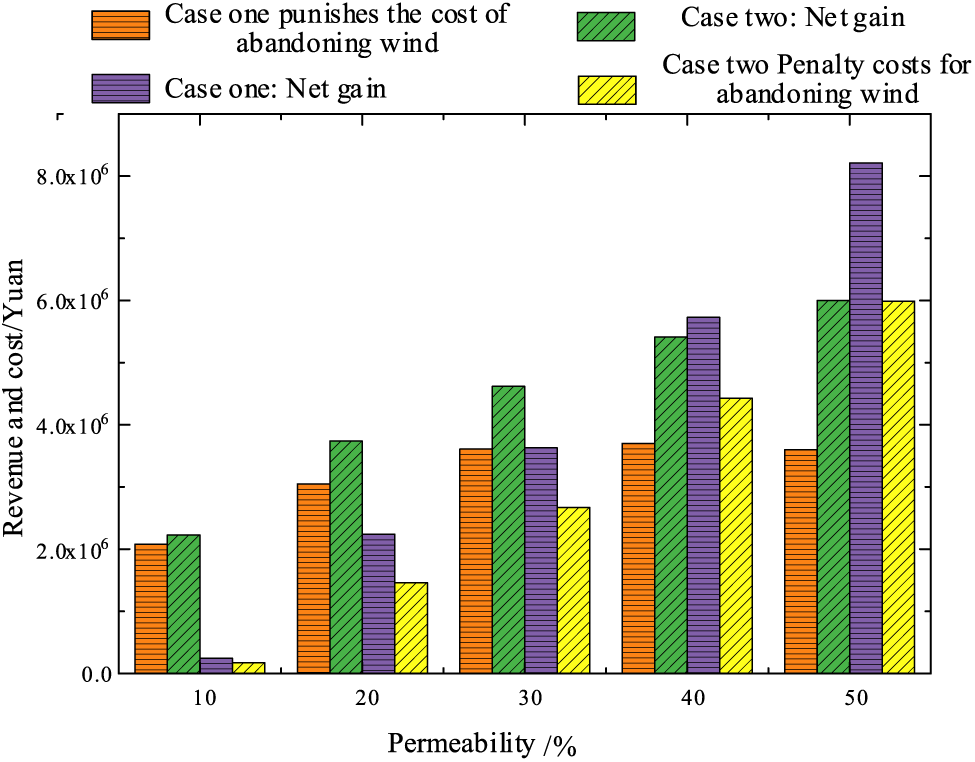
Figure 12: Economic curve of wind abandoning under different wind power permeability of source-load-storage and absorption
As can be seen from Tables A2 and A3 in Appendix and Fig. 13, the overall level of net return rate in case 2 is higher than that in case 1. In case 2, the overall level of net return rate reaches the peak when the wind power penetration rate is about 20%. However, with the continuous increase of wind power penetration rate, the overall level of net return rate in case 2 shows a downward trend, mainly because the energy storage system is more and more involved in the power grid to absorb wind power. However, the operation cost of an energy storage system to absorb wind abandonment is large, which leads to the continuous reduction of the net return rate. From the wind given rate term, this second overall still is better than one, but when the wind power penetration is higher than 40%, is 2 there will be more than 40% that wind power cannot be given, it will lead to abandon the wind punishment cost increased rapidly, so when the wind power penetration increases, the thermal power unit power supply side need to use some technical means to improve the load capacity, DR Resources on the load side should be expanded under the support of local policies, and the rated power and capacity of the energy storage system should be increased under the condition of policy support and technical means updating. Through these measures, wind power abandonment in large wind power clusters can be absorbed as much as possible under the trend of increasing wind power penetration in the future.

Figure 13: Variation curves of net return rate and absorption rate of source-charge-storage participation in power grid dispatching under different wind power permeability
This paper comprehensively considers the operating benefits, operating costs, curtailment penalty costs, hill climbing constraints of thermal power units, load-side demand response speed, and responsiveness of energy storage systems, and proposes a source-load-storage double-layer optimal scheduling strategy based on wind power consumption benefits. Based on the numerical example, the absorption effect of the strategy proposed in this paper and the impact on the economy of the power grid are analyzed, and the specific conclusions are as follows:
(1) Compared with Scenarios 1 and 2, the source-load-storage participation in grid dispatching and the consumption wind farm group curtailment control strategy increases the wind power absorption rate of the grid by 35.12% and 13.19%, respectively, which obtain better operating economy, and reduce the maximum peak-valley difference of the system by 31.24 MW.
(2) When the wind power penetration rate continues to increase, the scale of DR Resources and the capacity of the energy storage system need to increase in a certain proportion according to the rising trend of wind power penetration, so as to obtain a good economy and wind power consumption effect. Moreover, the overall level of curtailment penalty costs in case 2 is lower than in case 1.
(3) When the penetration rate of wind power continues to increase, the net yield of the strategy proposed in this paper tends to decline as a whole, mainly because the energy storage system is more and more participating in the grid to absorb wind power, but the operating cost of the energy storage system is high, resulting in a continuous decrease in the net return rate. With the support of relevant national policies and the rapid development of energy storage technology, large-scale energy storage systems will be more and more widely used in power grids.
In future research, there is potential for further development of intelligent scheduling algorithms by integrating advanced forecasting techniques to more accurately predict wind power generation and load demand. Additionally, exploring novel energy storage technologies to enhance the performance and cost-effectiveness of storage devices will better address the challenges posed by the fluctuation of wind power. Evaluating the impact of source-load-storage technologies on sustainable development, promoting carbon neutrality, and achieving carbon peak is also essential.
Acknowledgement: The authors would like to thank the editors and three anonymous reviewers for their constructive and insightful comments.
Funding Statement: The study was supported by the State Grid Henan Economic Research Institute Regional Autonomy Project.
Author Contributions: The authors confirm contribution to the paper as follows: study conception and design: Jie Ma, Pengcheng Yue; data collection: Haozheng Yu, Yuqing Zhang; analysis and interpretation of results: Youwen Zhang, Cuiping Li; draft manuscript preparation: Junhui Li, Wenwen Qin, Yong Guo. All authors reviewed the results and approved the final version of the manuscript.
Availability of Data and Materials: The data used to support the findings of this study are available from the corresponding author upon request.
Conflicts of Interest: The authors declare that they have no conflicts of interest to report regarding the present study.
References
1. Chinese National Energy Administration (2022). The national energy administration (In Chinese). http://www.nea.gov.cn/2022-01/28/c_1310445390.htm. (accessed on 06/03/2022). [Google Scholar]
2. Liu, B., Zhang, Y., Ma, L., Li, Z., Zhao, Q. et al. (2021). Design and optimization of technical schemes of supply-side base integrated energy systems in Northwest China. Proceedings of the CSEE, 41(2), 568–581 (In Chinese). [Google Scholar]
3. He, H., Zhang, Y., Sun, X., Guo, Q., Su, L. et al. (2021). Evaluation method of renewable energy development scale and dc transmission scale of China northwest power grid by considering frequency security constraints. Proceedings of the CSEE, 41(14), 4753–4762 (In Chinese). [Google Scholar]
4. Li, J., Zhang, J., Mu, G., Ge, Y., Yan, G. et al. (2019). Hierarchical optimization scheduling of deep peak shaving for energy-storage auxiliary thermal power generating units. Power System Technology, 43(11), 3961–3970. [Google Scholar]
5. Cui, D., Jin, Y., Wang, Y., Yuan, Z., Cai, G. et al. (2023). Combined thermal power and battery low carbon scheduling method based on variational mode decomposition. International Journal of Electrical Power and Energy Systems, 145, 108644. [Google Scholar]
6. de Oliveira, L. W., de Oliveira, J. G., Dias, B. H., de Sena, C. S. A., dos Santos, A. L. M. (2023). Optimal allocation of battery in electrical distribution systems with distributed resources. Journal of Control, Automation and Electrical Systems, 32(5), 1289–1304. [Google Scholar]
7. Li, X., Yang, Y. (2020). Optimization dispatching for joint operation of hydrogen storage-wind power and cascade hydropower station based on bidirectional electricity price compensation. Power System Technology, 44(9), 3297–3306. [Google Scholar]
8. Zhu, X., Liu, Y., Cao, Y., Jiao, Z. (2023). Demand response scheduling based on blockchain considering the priority of high load energy enterprises. Energy Reports, 9(S8), 992–1000. [Google Scholar]
9. Seta, F. S., de Oliveira, L. W., de Oliveira, E. J., (2019). Comprehensive approach for distribution system planning with uncertainties. IET Generation, Transmission and Distribution, 13(24), 5467–5477. https://doi.org/10.1049/gtd2.v13.24 [Google Scholar] [CrossRef]
10. Jin, H., Sun, H., Niu, T., Guo, Q., Wang, B. (2019). Coordinated dispatch method of energy-extensive load and wind power considering risk constraints. Automation of Electric Power Systems, 43(16), 9–16. [Google Scholar]
11. Jin, H., Sun, H., Niu, T., Guo, Q., Wang, B. (2019). Robust unit commitment considering uncertainties of wind and energy intensive load dispatching. Automation of Electric Power Systems, 43(22), 13–20. [Google Scholar]
12. Ullah, K., Khan, T. A., Hafeez, G., Khan, I., Murawwat, S. et al. (2022). Demand side management strategy for multi-objective day-ahead scheduling considering wind energy in smart grid. Energies, 15(19), 6900. https://doi.org/10.3390/en15196900 [Google Scholar] [CrossRef]
13. Yuan, W., Xin, W., Su, C., Cheng, C., Yan, D. et al. (2022). Cross-regional integrated transmission of wind power and pumped-storage hydropower considering the peak shaving demands of multiple power grids. Renewable Energy, 190, 1112–1126. https://doi.org/10.1016/j.renene.2021.10.046 [Google Scholar] [CrossRef]
14. Jiang, N., Dai, S., Xu, D., Song, B., Hu, L. (2022). A study of combined electric-thermal system to consume abandoned wind with the synergy of unit combination and line reconfiguration. Power System Protection and Control, 50(14), 105–113. [Google Scholar]
15. Shrestha, T. K., Karki, R. (2020). Utilizing energy storage for operational adequacy of wind-integrated bulk power systems. Applied Sciences, 10(17), 5964. https://doi.org/10.3390/app10175964 [Google Scholar] [CrossRef]
16. Zhang, G., Wen, J., Xie, T., Zhang, K., Jia, R. (2023). Bi-layer economic scheduling for integrated energy system based on source-load coordinated carbon reduction. Energy, 280, 128236. https://doi.org/10.1016/j.energy.2023.128236 [Google Scholar] [CrossRef]
17. Wang, X., Huang, W., Ne, T., Wen, L., Fan, F. (2020). A tie-line power smoothing strategy for microgrid with heat and power system using source-load-storage coordination control. Transactions of China Electrotechnical Society, 35(13), 2817–2829. [Google Scholar]
18. Nikoobakht, A., Aghaei, J., Shafie-Khah, M., Catalao, J. P. (2018). Assessing increased flexibility of energy storage and demand response to accommodate a high penetration of renewable energy sources. IEEETransactions on Sustainable Energy, 10(2), 659–669. [Google Scholar]
19. Ullah, K., Ali, S., Khan, T. A., Khan, I., Jan, S. et al. (2020). An optimal energy optimization strategy for smart grid integrated with renewable energy sources and demand response programs. Energies, 13(21), 5718. https://doi.org/10.3390/en13215718 [Google Scholar] [CrossRef]
20. Cui, Y., Zhou, H., Zhong, W., Zhao, Y., Cui, C. (2021). Optimal dispatch of power system with energy storage considering deep peak regulation initiative of thermal power and demand response. High Voltage Engineering, 47(5), 1674–1684. [Google Scholar]
21. Zahmoun, S., Ouammi, A., Sacile, R., Benchrifa, R., Zero, E. (2023). Optimal operation scheduling of a combined wind-hydro system for peak load shaving. IEEE Transactions on Automation Science and Engineering, 2023, 1–14. [Google Scholar]
22. Alves, I. M., Alves, I. M., Peças Lopes, J. A. (2023). Modeling demand flexibility impact on the long-term adequacy of generation systems. International Journal of Electrical Power and Energy Systems, 151, 109169. https://doi.org/10.1016/j.ijepes.2023.109169 [Google Scholar] [CrossRef]
23. Ge, W., Zhang, Y., Gao, C., Gao, K., Liu, X. et al. (2019). Phased optimal strategy of source-load-storage system based on state partition of accommodation capacity of wind power. Automation of Electric Power Systems, 43(15), 26–33+70 (In Chinese). [Google Scholar]
24. Shuai, B., Zhu, Z., Li, X., Luo, Z., Zhu, H. et al. (2021). Collaborative optimization of ``source-grid-load-storage" operation of integrated energy system considering wind power consumption. Power System Protection and Control, 49(19), 18–26. [Google Scholar]
25. He, H., Guo, J., Wang, Y. (2023). Multi-time-scale coordinated optimum scheduling technique for a multi-source complementary power-generating system with uncertainty in the source-load. Energies, 16(7), 3020. https://doi.org/10.3390/en16073020 [Google Scholar] [CrossRef]
26. Sharma, S., Niazi, K. R., Verma, K., Rawat, T. (2019). Impact of multiple battery energy storage system strategies on energy loss of active distribution network. International Journal of Renewable Energy Research, 9(4), 1705–1711. [Google Scholar]
27. Ge, X., Shi, L., Liu, Y., Fu, Y., Xia, S. (2020). Load forecasting of electric vehicles based on sigmoid cloud model considering the uncertainty of demand response. Proceedings of the CSEE, 40(21), 6913–6925 (In Chinese). [Google Scholar]
28. Yang, H., Zhang, X., Ma, Y., Zhang, D. (2021). Critical peak rebate strategy and application to demand response. Protection and Control of Modern Power Systems, 6(3), 357–370. [Google Scholar]
29. Guo, P., Wen, J., Zhu, D., Wang, W., Liu, W. (2017). The coordination control strategy for large-scale wind power consumption based on source-load interactive. Transactions of China Electrotechnical Society, 32(3), 1–9. [Google Scholar]
30. Pourramezan, A., Samadi, M. (2022). A novel approach for incorporating incentive-based and price-based demand response programs in long-term generation investment planning. International Journal of Electrical Power & Energy Systems, 142, 108315. https://doi.org/10.1016/j.ijepes.2022.108315 [Google Scholar] [CrossRef]
31. Yang, P., Jiang, H., Liu, C., Kang, L., Wang, C. (2023). Coordinated optimization scheduling operation ofintegrated energy system considering demand response and carbon trading mechanism. International Journal of Electrical Power & Energy Systems, 147, 108902. https://doi.org/10.1016/j.ijepes.2022.108902 [Google Scholar] [CrossRef]
32. Wang, L., Qi, Y., Huang, Y. (2019). Wind power curtailment index and sequence model for power systems. Electric Power, 52(4), 178–184. [Google Scholar]
33. Li, J., Yue, P., Liu, C., Ge, C., Zhang, J. (2021). Control strategy of energy storage system in wind farm group to improve wind energy utilization level. Electric Power Automation Equipment, 41(10), 162–169. [Google Scholar]
Appendix


Cite This Article
 Copyright © 2024 The Author(s). Published by Tech Science Press.
This work is licensed under a Creative Commons Attribution 4.0 International License , which permits unrestricted use, distribution, and reproduction in any medium, provided the original work is properly cited.
 Downloads
 Citation Tools