
 Submit a Paper
 Propose a Special lssue
 Open Access
ARTICLE

Power Quality Disturbance Identification Basing on Adaptive Kalman Filter and Multi-Scale Channel Attention Fusion Convolutional Network
School of Automation and Electrical Engineering, Lanzhou Jiaotong University, Lanzhou, 730070, China
* Corresponding Author: Guangdi Liu. Email:
Energy Engineering 2024, 121(7), 1865-1882. https://doi.org/10.32604/ee.2024.048209
Received 30 November 2023; Accepted 13 March 2024; Issue published 11 June 2024
 View Full Text
 Download PDF
Abstract
In light of the prevailing issue that the existing convolutional neural network (CNN) power quality disturbance identification method can only extract single-scale features, which leads to a lack of feature information and weak anti-noise performance, a new approach for identifying power quality disturbances based on an adaptive Kalman filter (KF) and multi-scale channel attention (MS-CAM) fused convolutional neural network is suggested. Single and composite-disruption signals are generated through simulation. The adaptive maximum likelihood Kalman filter is employed for noise reduction in the initial disturbance signal, and subsequent integration of multi-scale features into the conventional CNN architecture is conducted. The multi-scale features of the signal are captured by convolution kernels of different sizes so that the model can obtain diverse feature expressions. The attention mechanism (ATT) is introduced to adaptively allocate the extracted features, and the features are fused and selected to obtain the new main features. The Softmax classifier is employed for the classification of power quality disturbances. Finally, by comparing the recognition accuracy of the convolutional neural network (CNN), the model using the attention mechanism, the bidirectional long-term and short-term memory network (MS-Bi-LSTM), and the multi-scale convolutional neural network (MSCNN) with the attention mechanism with the proposed method. The simulation results demonstrate that the proposed method is higher than CNN, MS-Bi-LSTM, and MSCNN, and the overall recognition rate exceeds 99%, and the proposed method has significant classification accuracy and robust classification performance. This achievement provides a new perspective for further exploration in the field of power quality disturbance classification.Keywords
With China’s rapidly developing power transmission and distribution grid [1], the application of distributed generation and nonlinear load in the power grid is becoming more and more extensive. For example, access to a large number of solid-state switches, power electronic switches, nonlinear loads will cause serious distortion of grid voltage and current, and the deterioration of power quality will also increase, which will affect the stability of the power grid equipment [2]. Therefore, the power quality disturbances in line identification and governance are of great significance. Because of this, both local and international scholars have conducted extensive research [3].
In the power system, electronic devices can cause electromagnetic interference and sampling errors that affect the signal transmission, resulting in significant noise in the detected signal. To classify power quality disturbances, it is important to first remove any noise present in the disturbance signal. Then, process the important information in the signal to achieve the desired classification [4]. The Kalman filter (KF) is a widely used method for linear, discrete, and finite-dimensional systems due to its simplicity, accuracy, and good anti-noise performance. Kalman filtering is a fundamental method used in various fields, including control, signal processing, and communication, with extensive potential applications. It has been widely employed in harmonic detection and target tracking estimation. This paper proposes an adaptive maximum likelihood Kalman filter algorithm to eliminate noise interference signals [5].
Several detection and classification approaches for complex power quality disturbances have been proposed by researchers in recent years, but most of them include two steps: eigenvalue extraction and disturbance identification. Short-Time Fourier Transform (STFT), Continuous Wavelet Transform (CWT), S-Transform (ST), Empirical Mode Decomposition (EMD), Fully Adaptive Ensemble Empirical Mode Decomposition (CEEMDAN), and Variational Mode Decomposition(VMD) are the main techniques used for feature extraction. Disturbance recognition is used to determine the type of disturbance signal, and the primary techniques comprise support vector machines (SVM), artificial neural networks (ANN), decision trees (DT), the K nearest neighbor algorithm, and so on. The ST operation is too large to meet the real-time detection requirements of the field environment, and the selection of the window width adjustment factor lacks a theoretical basis [6,7]. Although the improved complete ensemble empirical mode decomposition with adaptive noise (ICEEMDAN) decomposes power quality disturbances (PQD) signals and can better deal with signals under nonlinear and non-stationary background noise, the reconstruction error is large, and there may be pseudo modes [8]. Although the optimized empirical wavelet transform of the adaptive spectral trend can accurately segment the spectrum and prevent the inappropriate segmentation of the original Empirical wavelet transform (EWT), the proposed method may fail when the frequency of each disturbance element is similar or the amplitude is close to the minimum value [9].
In recent years, new methods of PQD recognition based on deep learning have attracted more and more attention. These methods avoid the subjectivity of traditional manual feature selection and instead use the powerful automatic learning and feature mining capabilities of neural networks for feature extraction, which can better adapt to the PQD recognition problems of new power systems and thus achieve high recognition accuracy [10]. Reference [11] uses the Gram angle field method to convert a 1-D power signal into a rectangular image, which is used as the input of Convolutional Neural Network (CNN) for training and recognition, avoiding the difficulty of manual selection. However, the rectangular image has lost the important information of the original sequence, such as the amplitude, and the recognition ability of complex disturbances is limited [12]. Reference [13] proposes an adaptive feature-enhanced packet convolutional neural network, which demonstrates superior classification and recognition accuracy in low-noise environments, but the accuracy is still not high in a high-noise environment. Although the improved fast independent component analysis method and the improved random forest classifier can provide a basis for the detection of potential PQ problems and help to control and manage signal distortion, the proposed recognition model is not universal [14]. Although the trajectory circle image based on the improved Hilbert transform makes up for the shortcomings of unclear time series features [15], the starting time of a single disturbance signal is close to the end of the sequence, which accounts for a small proportion of the whole sequence, so that it is not detected in this sequence. Moreover, under the sampling error, the existence of some serious noises causes some trajectory circle distortion, which leads to recognition errors [16]. According to the characteristics of different dimensions, the corresponding adapter modules are designed based on fully convolutional networks (FCN) and bidirectional gated recurrent unit networks, and the channel attention mechanism of the squeeze-and-excitation network (SENet) is introduced. Although more comprehensive feature ranges are considered, including spatial features and temporal relationship features in the time-frequency domain, the computational cost of training and testing inevitably increases, and the influence of strong noise in actual signals is not considered [17]. Although the application of channel attention module based on SENet in the classification model makes full use of the convolution channel in Convolutional Neural Network, it is easy to cause local misclassification of sampling points when the notching is overwhelmed by strong noise [18].
Therefore, this paper presents a method to achieve accurate identification of power quality multiple disturbances using an adaptive Kalman filter and attention mechanism multi-scale fusion convolution network. The key elements of this paper are the following: The power quality interference signal is denoised using the adaptive maximum likelihood Kalman filter; then, the feature information of the power quality interference signal is extracted using the multi-scale convolutional neural network. The attention mechanism is introduced to construct a multi-feature fusion layer to eliminate feature redundancy information, and the local and global characteristics of the interference signal are amplified. Finally, the Softmax layer is used for classification, and simulation validates the method’s accuracy and effectiveness.
The rest of this paper is organized as follows: Section 2 describes the basic principle of the adaptive maximum likelihood Kalman filter. Section 3 describes the basic principle of a multi-scale channel attention convolutional network and combines the method of feature fusion to construct a power quality disturbance classification model combining an adaptive Kalman filter and multi-scale channel attention. In Section 4, the model is verified from different angles by simulation comparison. Finally, in Section 5, the conclusion of the work is given.
2 Adaptive Maximum Likelihood Kalman Filter
When the power quality disturbance signal is affected by noise, its mathematical model can be expressed as [4]
Among them:
As
Thus, a discrete observation signal can be expressed in terms of
where H and F are the observation matrix and the system matrix, respectively;
In the formula, the parameters
To obtain the observation matrix and the system matrix, the state variables
Likewise, the state variable
In this way, we can obtain the matrix
Therefore, the amplitude of each of the frequency components can be calculated from the following equation:
In the formula,
In this case, the probability of the observation of the largest set of variables will be the lowest. It is characterized by considering both in the change the innovation and the change in the innovation covariance matrix. When the system and measurement noise variance matrices Q and R are estimated and adjusted in real time using the maximum likelihood Kalman filter method [20], real-time estimation and adjustment of R and Q matrices are implemented, further improving the general efficiency of the Kalman filter algorithm [21].
1) State estimation
According to the Kalman filter theory, the prediction equation is
In the formula,
Filter correction stage:
In the formula,
2) Parameter estimation
The joint conditional probability density of
In the formula,
In the formula, N is the length of the sample.
On the basis of the estimate of innovation
3 Attention Mechanism Fuses Multi-Scale Convolutional Network
In the presence of an intermediate feature
Here,
Channel attention condenses each feature map with dimensions H × W into a single scalar value. This straightforward descriptor tends to prioritize the global distribution of larger objects, potentially filtering out much of the image information associated with smaller objects [22]. However, the detection of small targets has always been an important performance bottleneck in the current network. For instance, the challenge with the dataset COCO primarily arises from the fact that the image area occupied by most objects is less than 1%. Hence, it is imperative to acknowledge that the global channel attention mechanism may not always constitute the optimal solution. In the attention model, the influence of multi-scale background information is reduced by aggregating the multi-scale background.
3.2 Aggregate Local and Global Content
This section elaborates on the suggested Multi-Scale Channel Attention Module (MS-CAM). Its core idea is the achievement of multi-scale channel attention through changes in the space pool dimensions [23]. To maintain a natural style, simply incorporate local content into the global context within the attention module while minimizing unnecessary complexity. In our approach, we opt for pointwise convolution (PWConv) as the aggregator of the local channel context. This method exploits only pointwise channel interactions at any spatial position [24]. To minimize parameter usage, we compute the local channel content
PWConv1 kernel size is denoted as
Here,
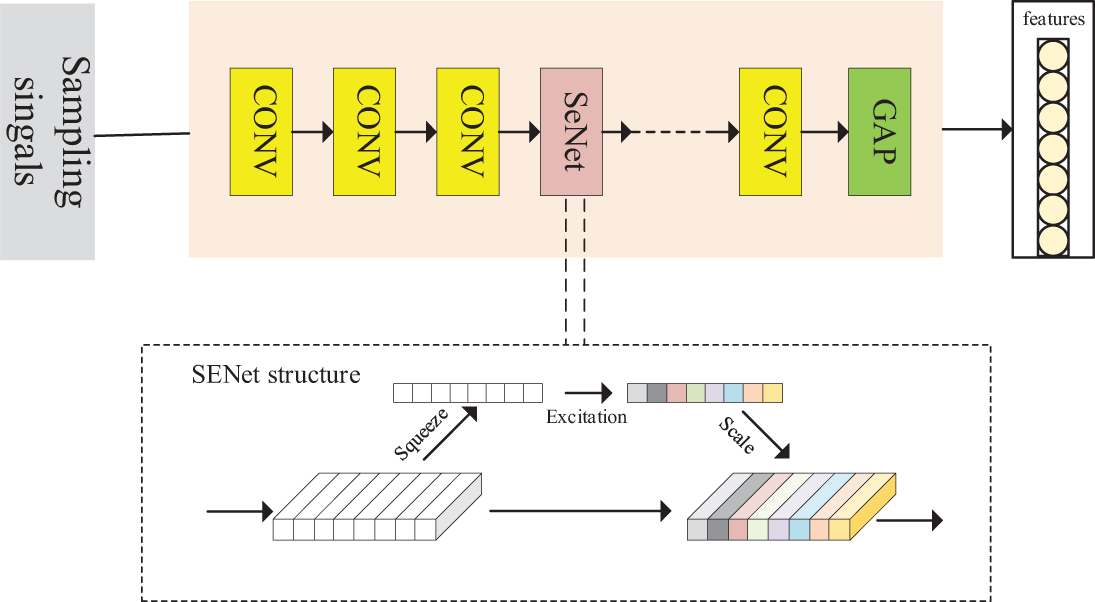
Figure 1: Figure of the MS-CAM proposal
Firstly, the input feature information is extracted by convolutional neural network (CNN) to extract channel features, and then multi-scale information is obtained. The acquisition of multi-scale information can be achieved by the following three methods: 1. Space pooling operation on each channel; 2. Change the size of the space pool at different scales; 3. The local context information is added to the global context, such as Fig. 1. In this paper, the multi-scale information is obtained by changing the spatial delay size at different scales, and then the point-by-point convolution operation is carried out. The point-by-point convolution is mainly to achieve lightweight design and reduce the computational complexity. Finally, the channel weighting is realized by multiplying the weight on the channel and the channel feature.
With the multi-scale channel module M attention as the basis, the fusion of attentional features can be described as follows:
Here,
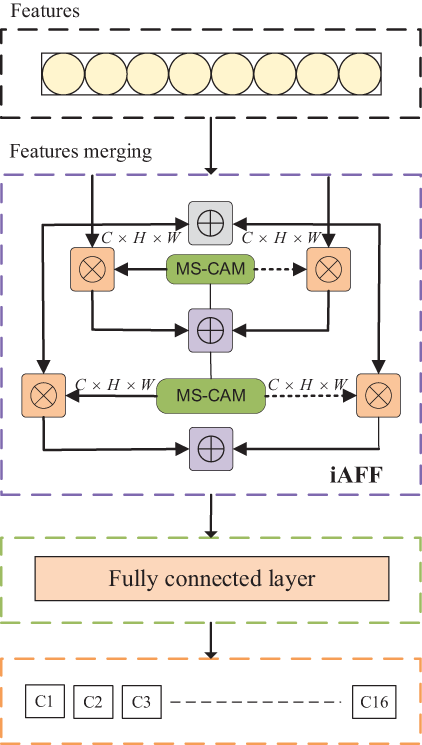
Figure 2: Schematic representation of iAFF
In order to have a complete perception of the input feature map, the initial feature fusion also adopts the attention fusion mechanism, that is, another attention module is used to fuse the input features, as shown in Fig. 2. By calculating the attention weight, updating the weight, fusing the feature information, and repeating the iteration, the final fusion feature information is obtained. Finally, the classification of power quality disturbances is completed through the full connected layer.
Unlike the partial context-aware approach [25], the fully contextual approach inevitably faces the challenge of effectively incorporating input features at the outset. The original quality of the fusion, when used as input to the attentiveness module, plays a crucial role in determining the ultimate weight of the fusion. Given that this remains a challenge for feature fusion, a straightforward approach involves employing an additional attention unit to merge the incoming characteristics. The two-step approach is called iterative attention feature fusion (iAFF) and is shown in Fig. 2. Represent the original integral
After analysis, this paper selects the iAFF (iterative attention feature fusion) method to better improve the accuracy of the classification of power quality disturbance signals.
3.4 Overall Framework of the Proposed Ensemble Model
In this paper, the accuracy rate is used as the quantitative index of disturbance classification, and the loss function value is used as the evaluation index. The evaluation model predicts the degree of proximity between the disturbance label and the real disturbance label. Fig. 3 is the process of classifying power quality disturbances by the model in this paper.
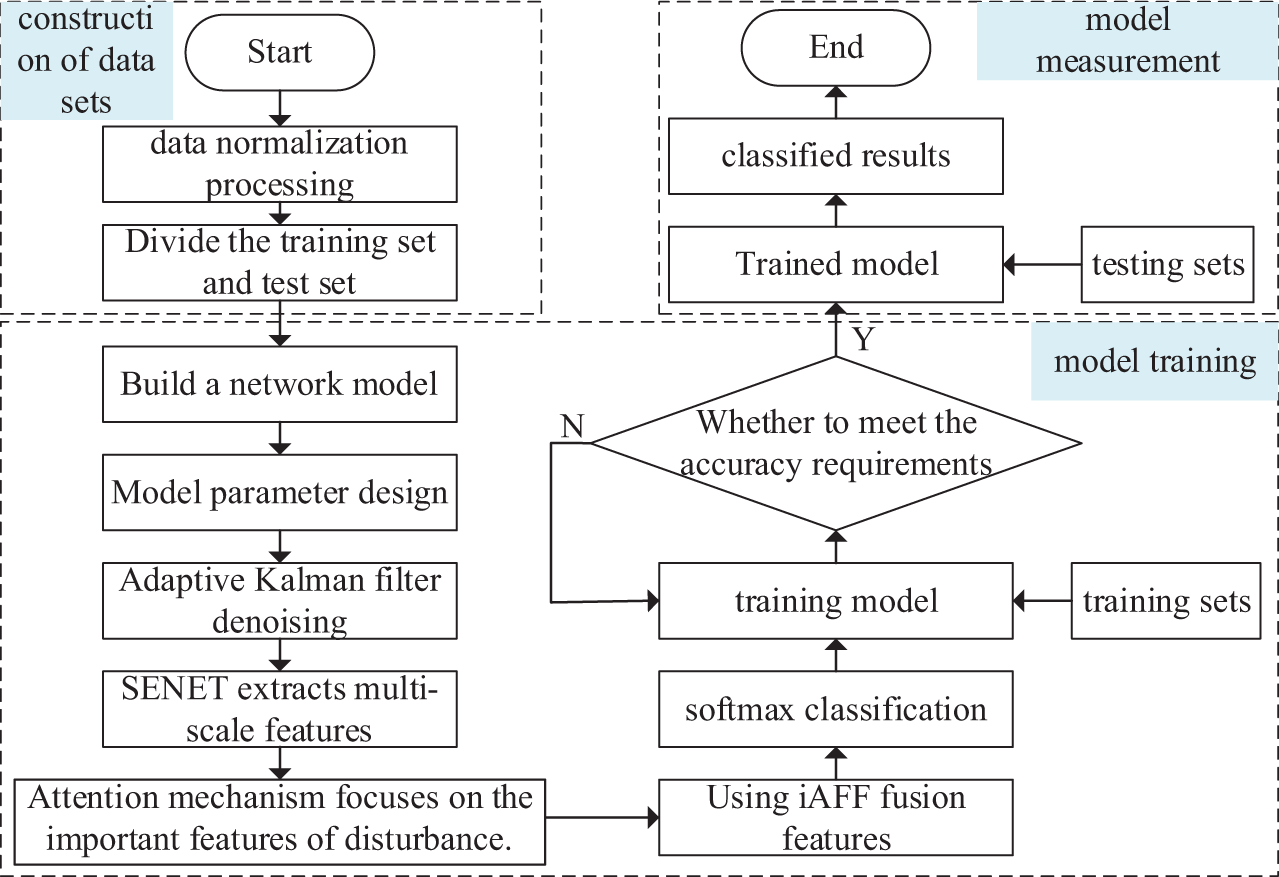
Figure 3: Flow chart of adaptive Kalman filter and channel attention multi-scale convolutional network for power quality disturbance classification
Fig. 4 is a schematic diagram of the adaptive Kalman filter and channel attention multi-scale convolutional network structure, which is composed of an adaptive Kalman filter noise reduction and classification module. The first part is to denoise the original disturbance signal containing 20, 30, and 40 dB using an adaptive Kalman filter to improve the extraction performance of local disturbance features. The second part is based on CNN embedding SENet. Each CAM sub-module is composed of a convolution module and a SENet module, which screens more effective channels for classification and improves training efficiency. After iterative attention feature fusion, more comprehensive disturbance feature information is obtained, and finally, disturbance classification recognition is completed.
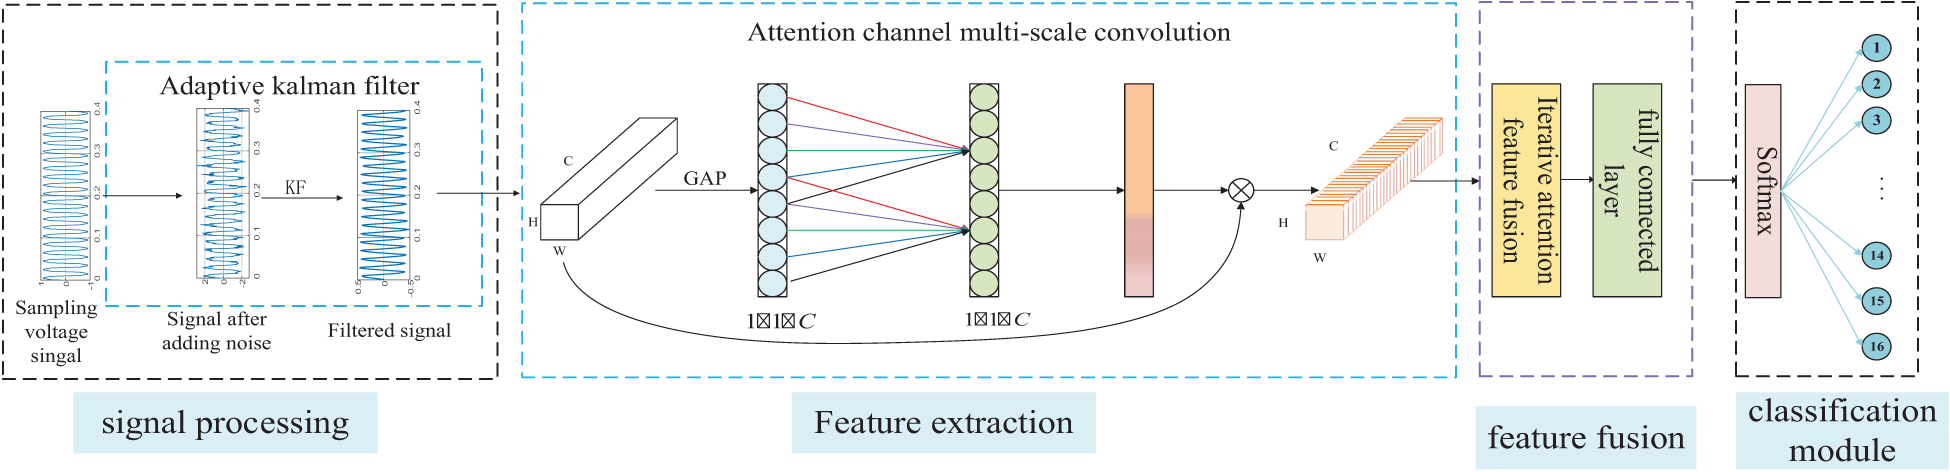
Figure 4: Adaptive Kalman filter and channel attention multi-scale convolutional network structure diagram
According to the relevant standards of IEEE Std1159-2019 [26] and the given mathematical model of power quality disturbance, 7 single disturbances and 9 double disturbances, for a total of 16 disturbances (V1–V16), are generated in MATLAB. The disturbance signal’s fundamental frequency is established at 50 Hz, with a sampling frequency of 3200 Hz. The values are arbitrarily produced within the specified range. In the generated interference signals, 20, 30, and 40 dB white Gaussian noise are added to simulate different real environments, and various signal-to-noise ratios generate 4800 samples, respectively, totaling 14400 samples. A random 7:3 split is used for the training and test sets.
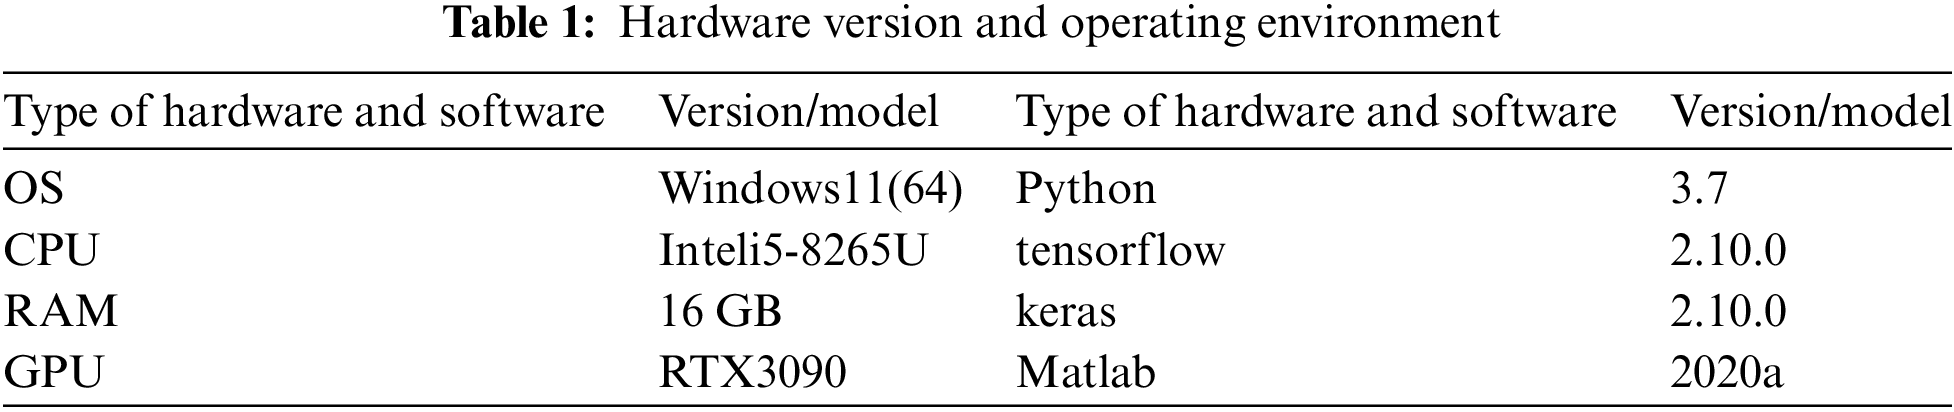
In this paper, the Kalman filtering process for disturbed signals is implemented based on MATLAB, and the multi-scale channel attention mechanism fusion convolution is built based on Tensorflow and Keras in Python. The specific versions and models are shown in Table 1.
4.1 Adaptive Maximum Likelihood Kalman Filter Denoising
The MATLAB simulation software is employed to generate the initial signal, which is subsequently subjected to denoising using the approach introduced in this paper. This denoising procedure is executed through the adaptive maximum likelihood Kalman filter method proposed in this research. The initial value of the state variable in this article is set to
Taking a single disturbance signal V1 (harmonic) and a composite disturbance signal V12 (voltage sag + transient oscillation) with fusion noise as an example, Fig. 5 shows the original waveform with 20 dB Gaussian white noise, the waveform after adding noise, and the waveform after denoising. The results prove the effectiveness of the algorithm.
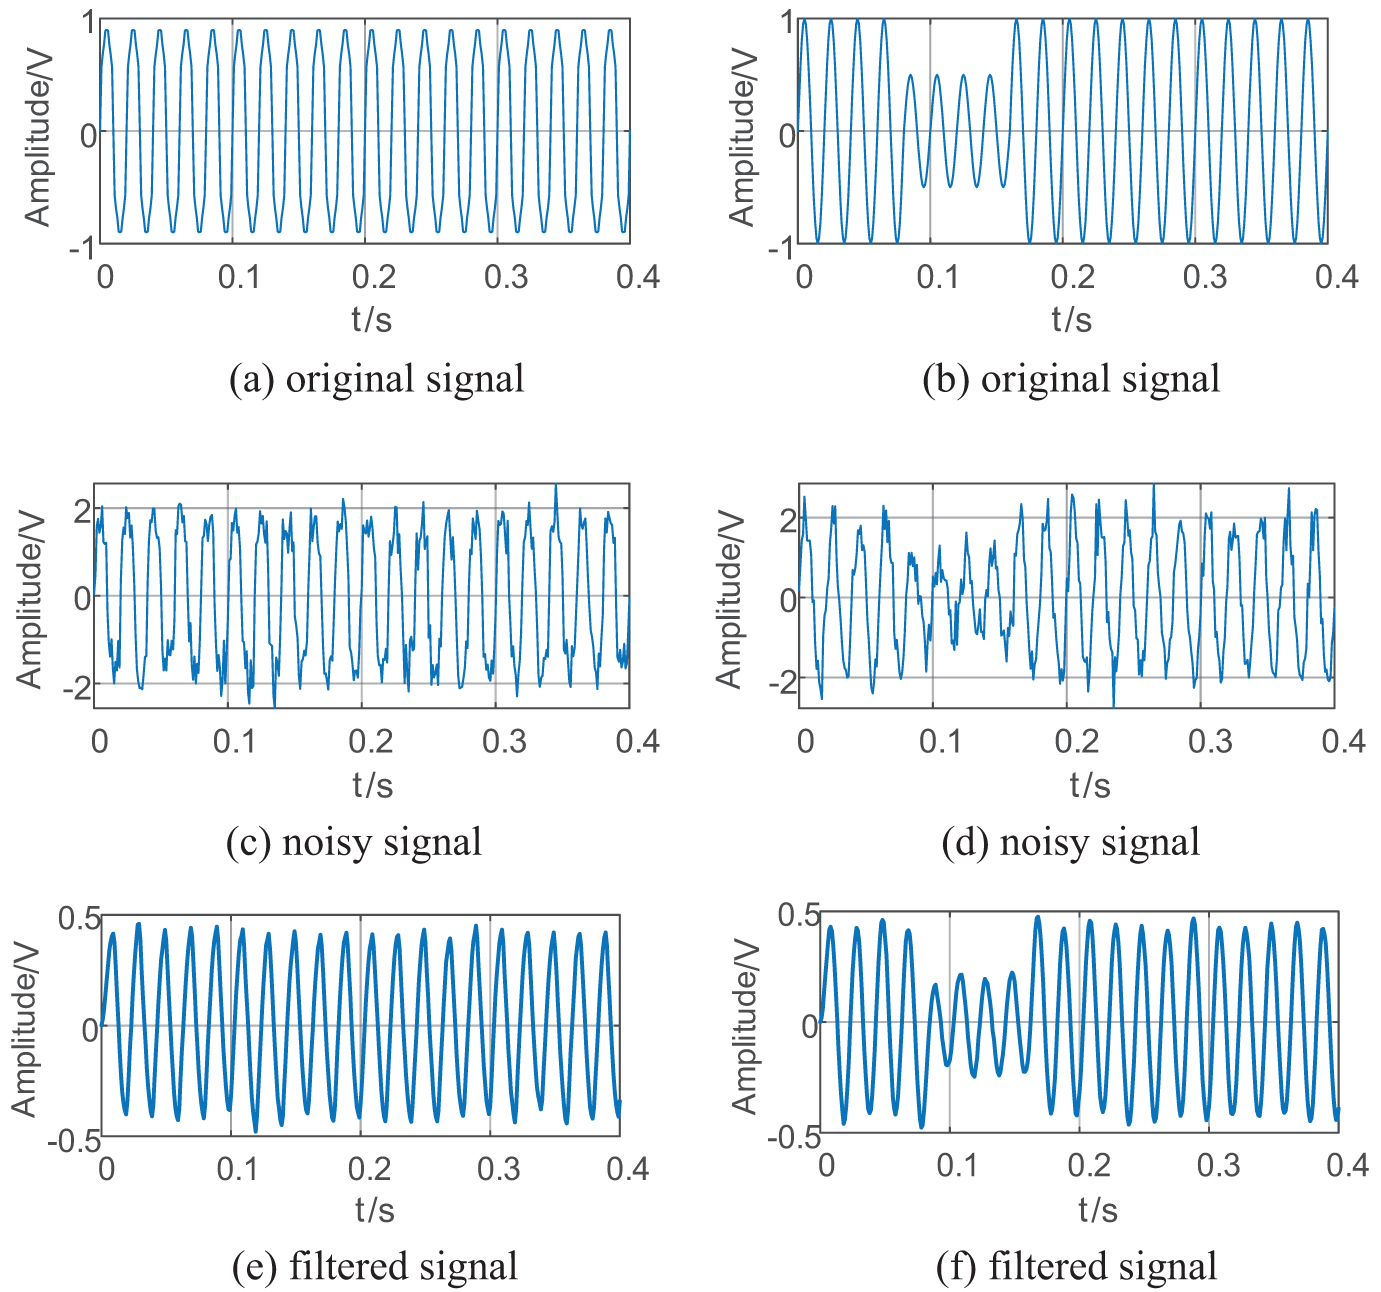
Figure 5: V1 (harmonic) and complex disturbance signal V12 (voltage dip + transient oscillation) before and after noise reduction
The constructed data set was used to verify the model, and 20, 30, and 40 dB white Gaussian noise were added to the data set, respectively. Throughout the learning period, the figures displayed below illustrate the accuracy curve and the loss curve. During the whole training stage, the accuracy curve did not fluctuate significantly and tended to stabilize as the number of iterations increased. The loss rate curve drops rapidly. After 16 iterations, the loss value is close to 0. The accuracy curve and loss curve clearly indicate a satisfactory training outcome, with no signs of overfitting.
It can be shown from Fig. 6 that when the SNR is 20 dB, the accuracy rate is always above 99.69%, while in the case of Hamming loss, when the epoch reaches 16 in 20 dB, certain mutations occur due to excessive noise, thus affecting the loss accuracy. As the count of iterations increases, the Hamming loss also almost tends to 0.
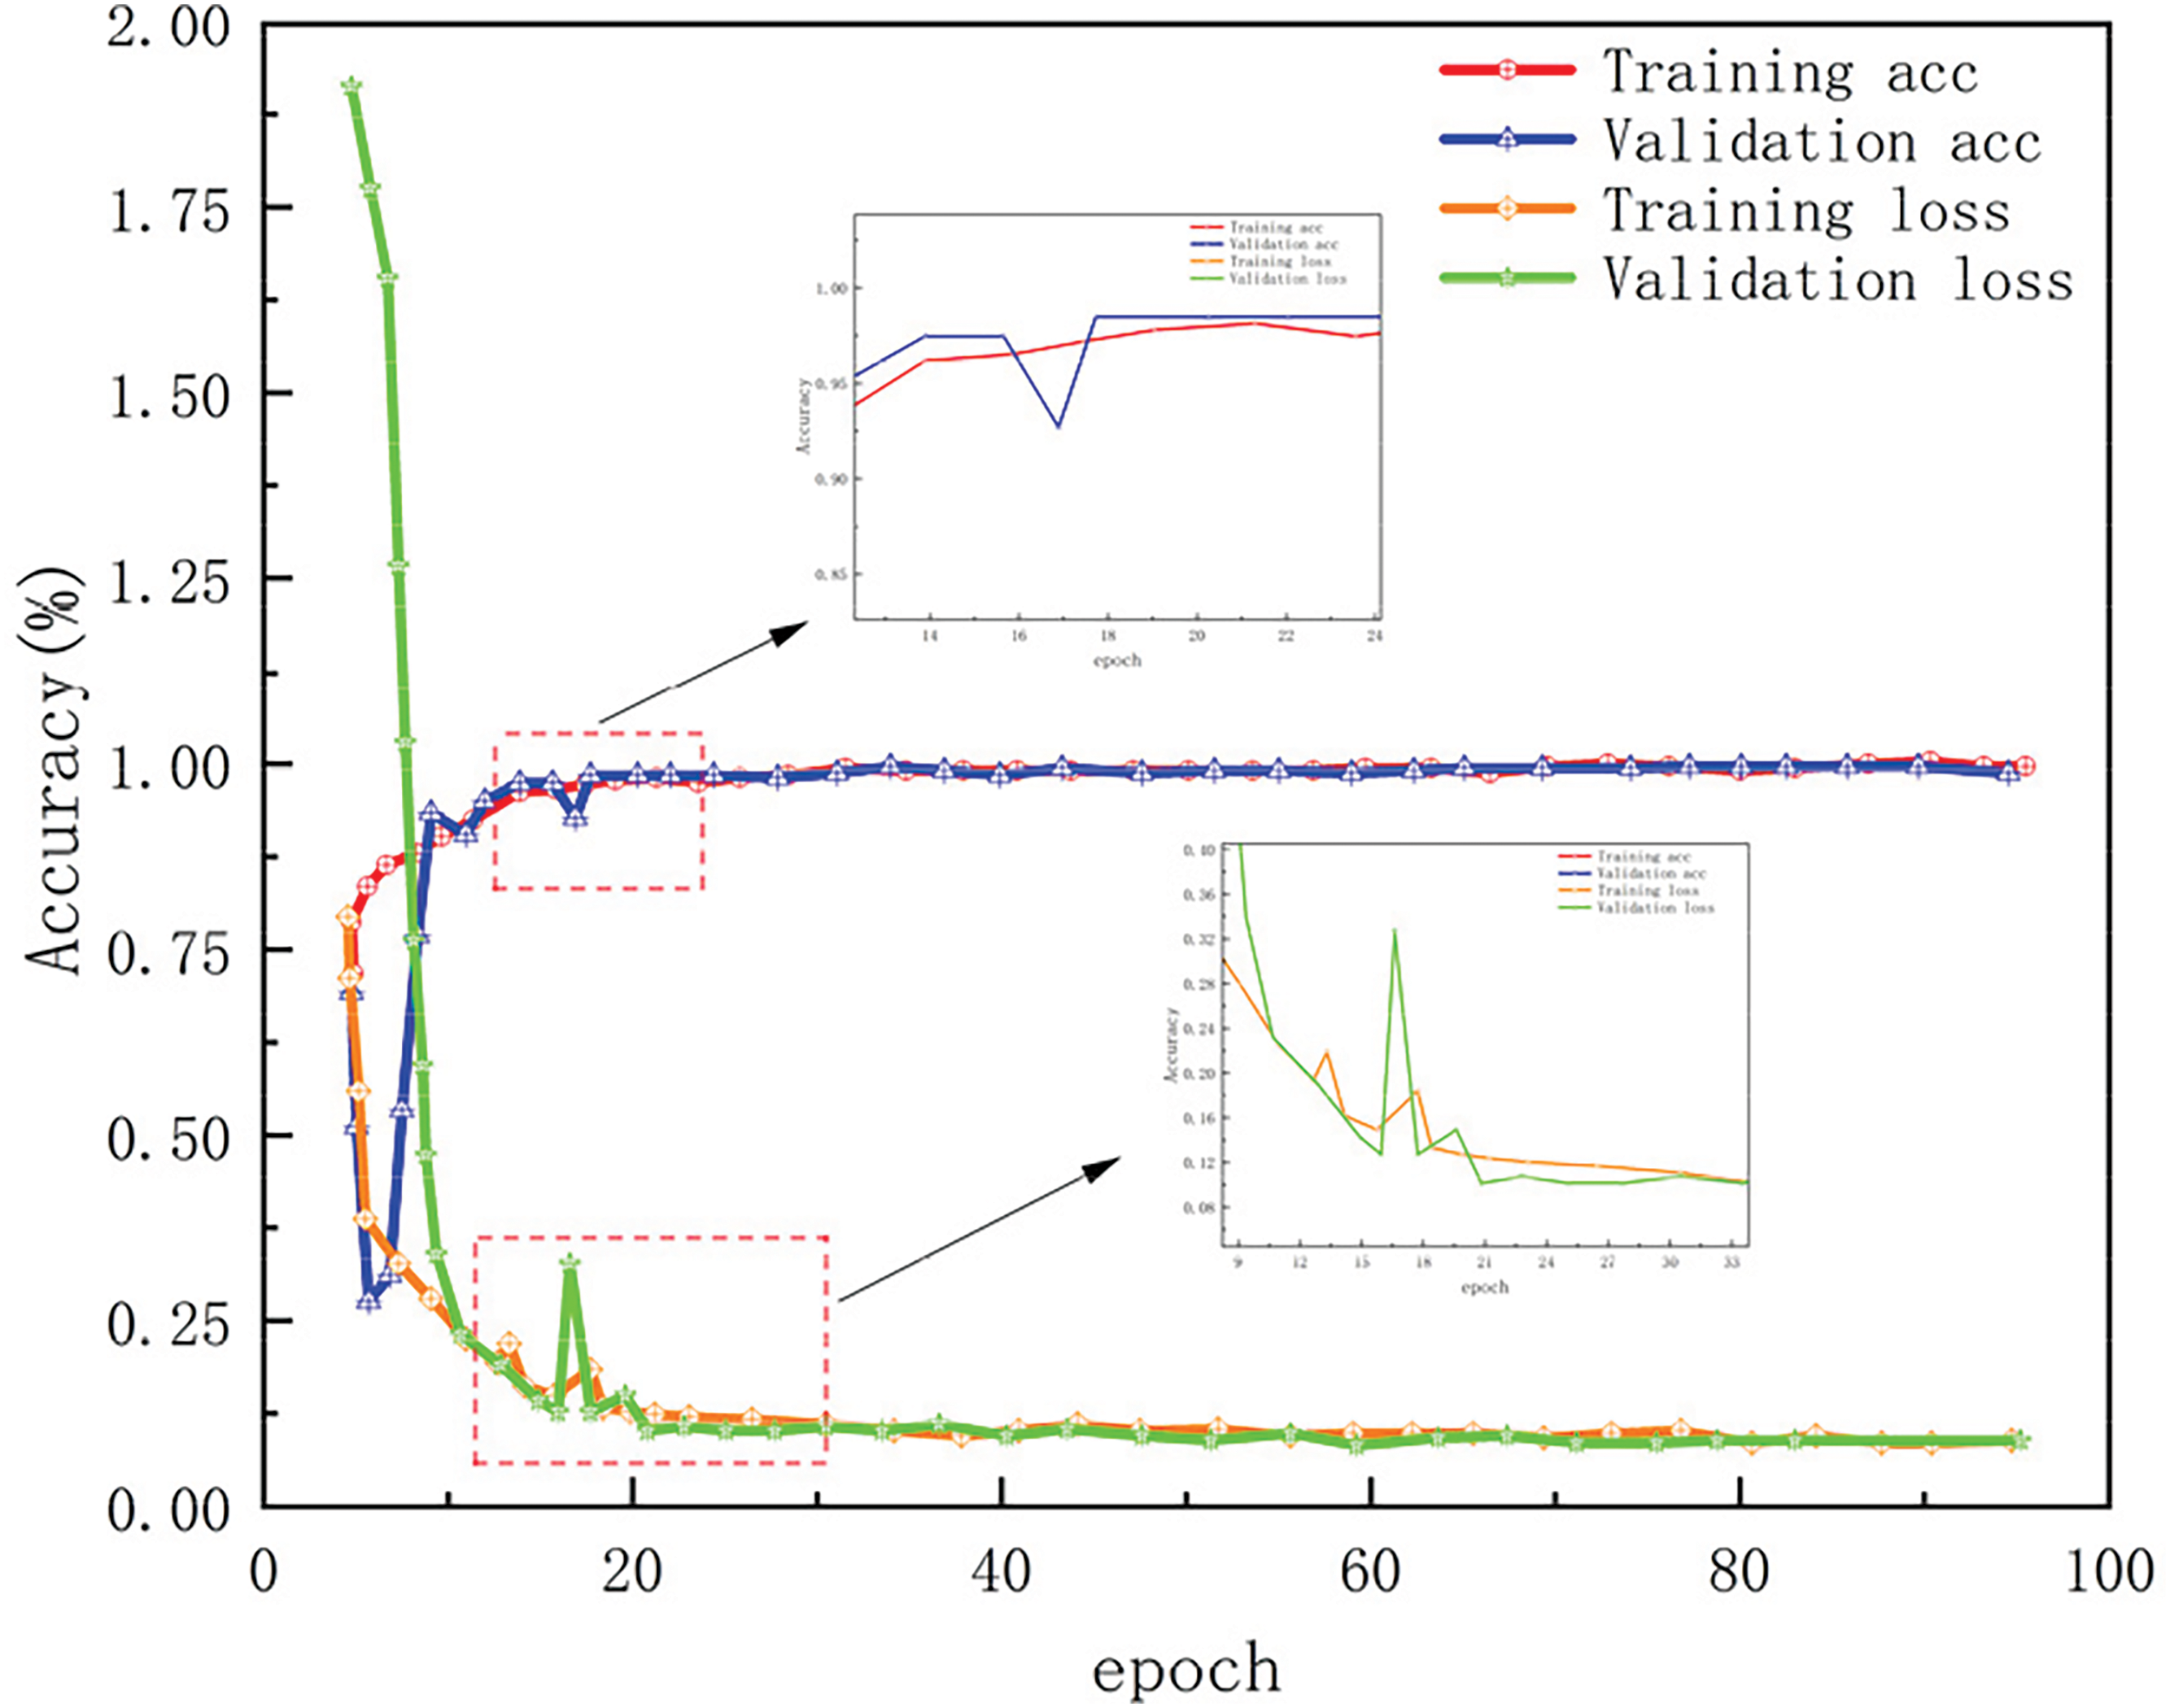
Figure 6: 20 dB noise accuracy curve and loss curve
To validate the efficacy of adaptive Kalman filter denoising and the multi-scale convolutional module with channel attention fusion, this study conducts comparative experiments across various noise conditions. These experiments encompass convolutional neural networks (CNN), models utilizing attention mechanisms, bidirectional long short-term memory networks (MS-Bi-LSTM) [27], and multi-scale convolutional neural networks (MSCNN) with attention mechanisms. The results obtained when comparing the three different cases are shown in Table 2.
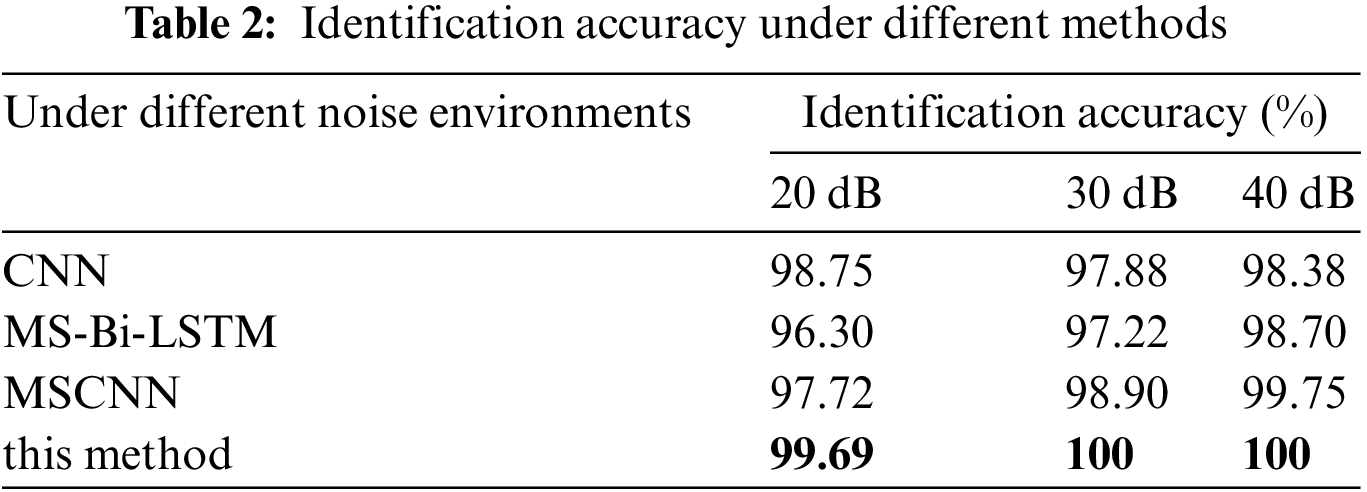
As indicated in Table 2, the overall classification recognition rate of the approach used in this paper can still be maintained above 99% in a strong noise environment with SNRs of 20, 30 and 40 dB [28].
To further investigate the model’s recognition of power quality disturbance signals, the confusion matrix is introduced to analyze the fault diagnosis results in detail. The examination of the confusion matrix reveals that only a few samples are misclassified, with the majority of samples being accurately identified. In summary, the model has superior recognition ability and high diagnostic accuracy for power quality disturbance signals.
Based on the information provided in Fig. 7 and Table 2, it is evident that the performance of the suggested approach is nearly on par with that of other approaches when subjected to low-intensity noise conditions (40 dB noise). However, at higher noise levels (such as 30 and 20 dB), the suggested approach exhibits superior performance compared to the other three approaches. Comparative tests indicate that the suggested procedure has strong robustness to noise in the background of strong noise. Even with the addition of more disturbances, the method is highly accurate, with V8~V15 achieving 100% classification accuracy in all cases, and V2 and V4 achieving 98% accuracy in the worst cases, which indicates that the proposed method incorporates more disturbances and has a small impact on accuracy. When more perturbations are incorporated, the error is greatly reduced. This observation may be attributed to the ability of KF-ML to effectively eliminate noise from the initially corrupted power quality (PQ) signals. while the multi-scale channel attention mechanism fusion convolution structure has a high ability to detect multifaceted nonlinear features for various interferences [4].
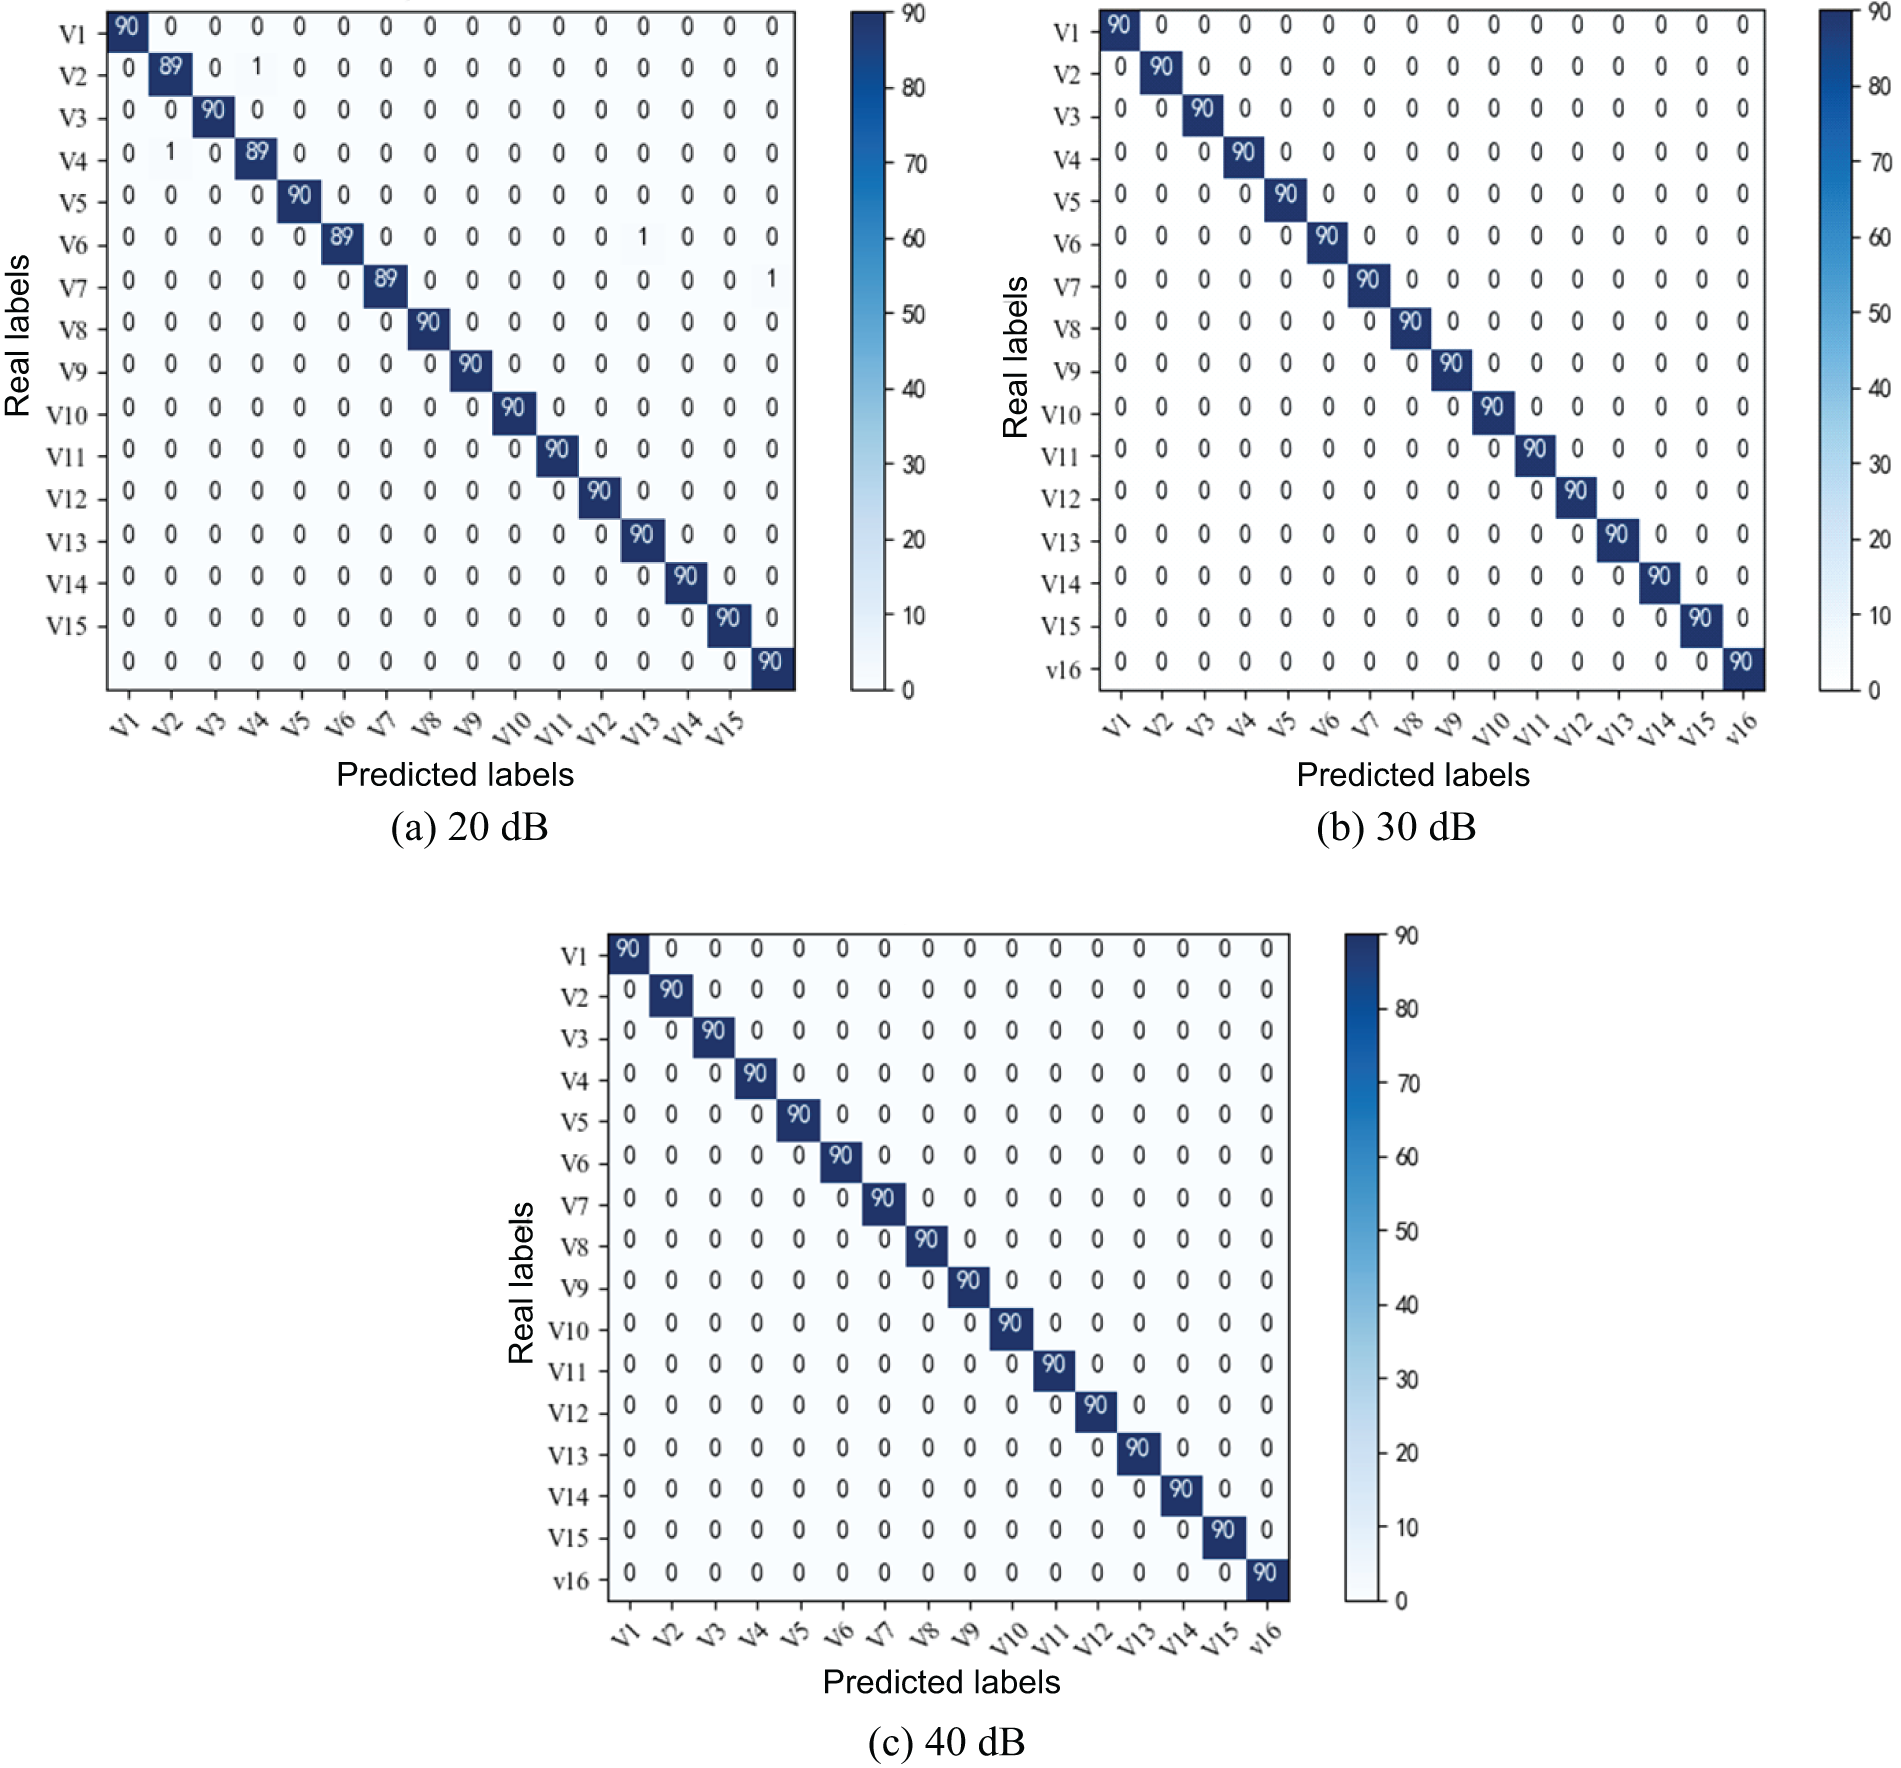
Figure 7: Confusion matrix diagram under different noises
4.3 Feature Visualization Analysis
To obtain a more intuitive understanding of the impact of the model proposed in this study on feature differentiation, t-SNE dimensionality reduction technology was adopted in this paper to reduce the features extracted by the sub-model and the feature visualization graphs that have been classified into two dimensions and visualized.
Fig. 8 is the feature visualization diagram of the sub-model, and Fig. 9 is the feature visualization diagram. Comparing the two graphs above, we can see that during the fusion of these features, the overlap decreases and the distance between different types increases. This shows that after the use of feature fusion, the expression of features is enhanced, and the separability of features is improved [29].
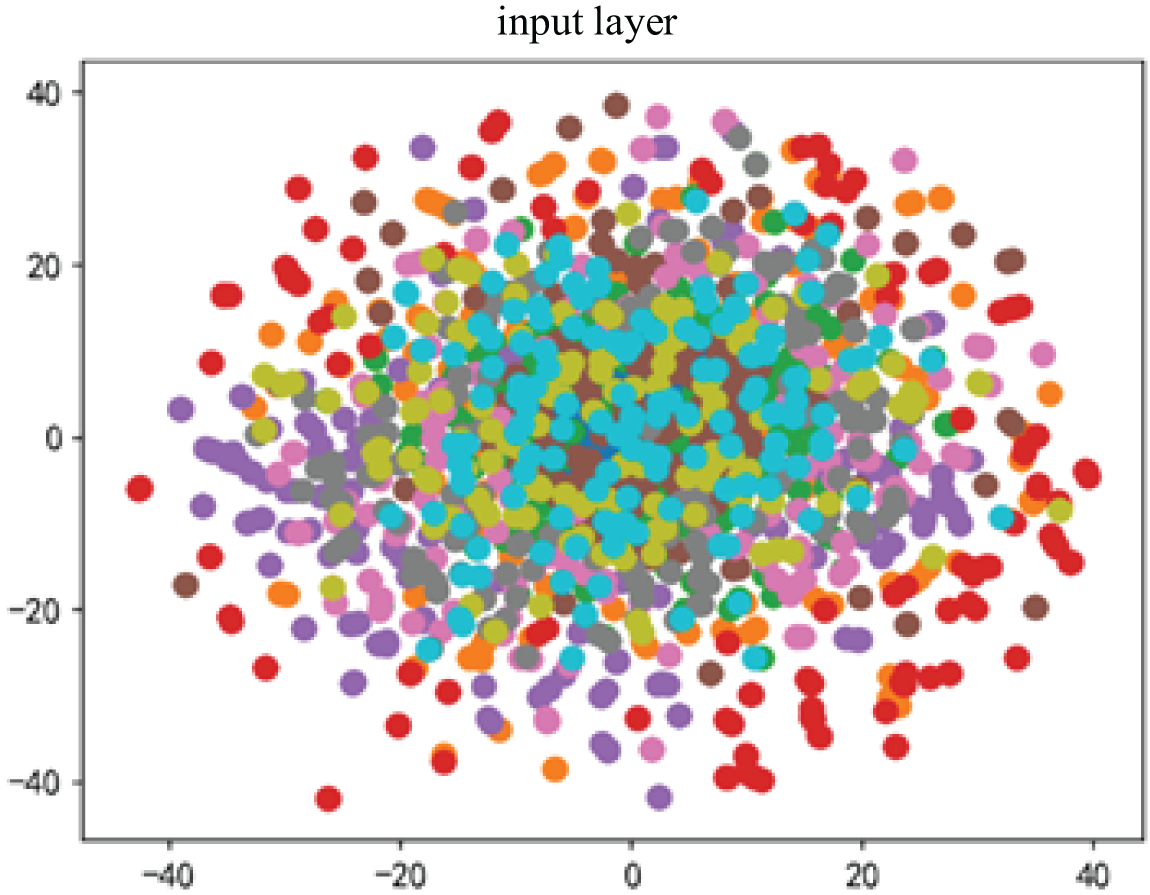
Figure 8: Sub-model feature visualization diagram
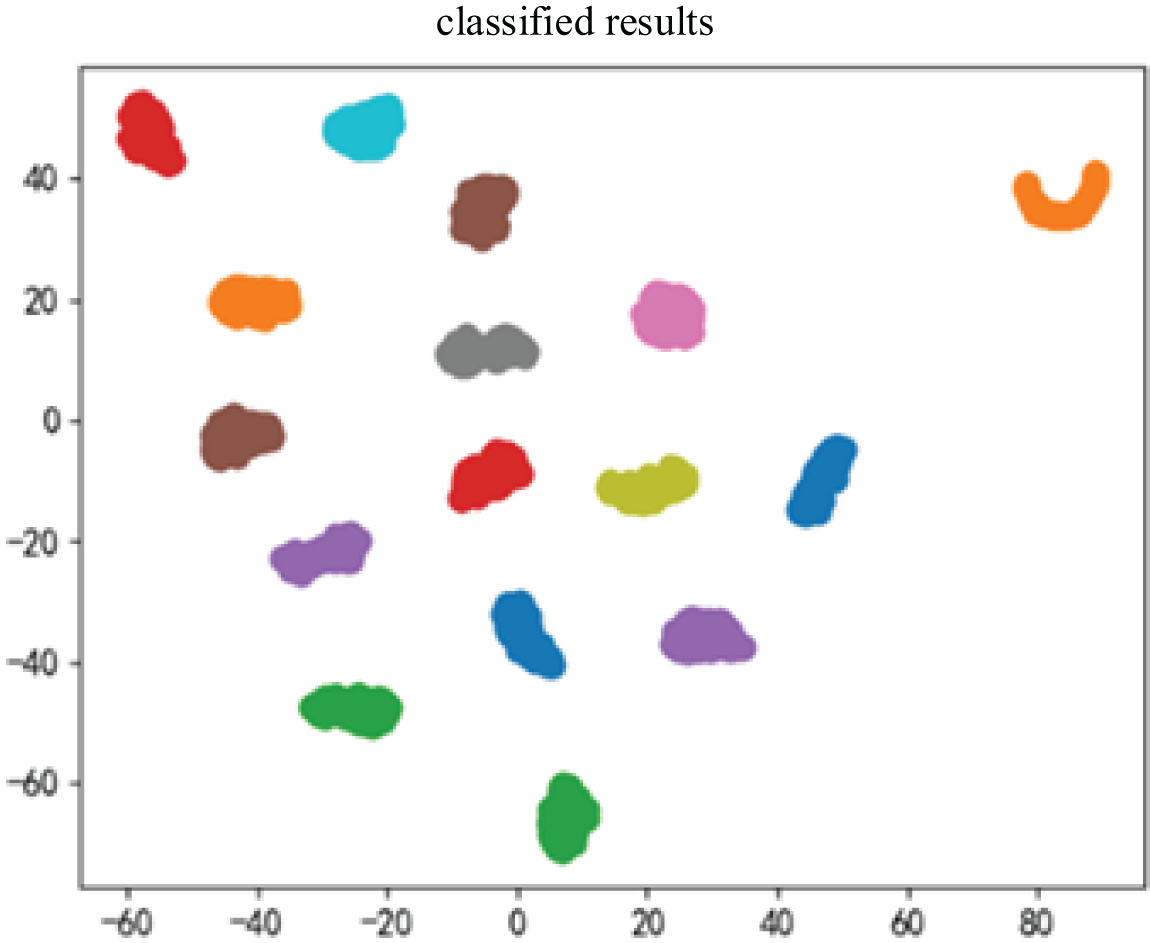
Figure 9: Feature visualization
4.4 Analysis with Real-World Dataset
In this part, IEEE PES databases for PQD are adopted to verify the effectiveness of AKF-MS-CAM [30]. The signal provided in this dataset exhibits a sampling rate of 256 points per cycle, with each signal possessing a length of 1536 points. The database encompasses a total of 13 distinct types of three-phase fault signals. For training purposes, simulation databases with a signal-to-noise ratio (SNR) of 20 dB are employed, while the verification set comprises 39 sets of measured data. Table 3 displays the comparative results of the proposed algorithm and a traditional algorithm on power quality disturbances (PQD) within the IEEE database, showcasing their classification effectiveness.
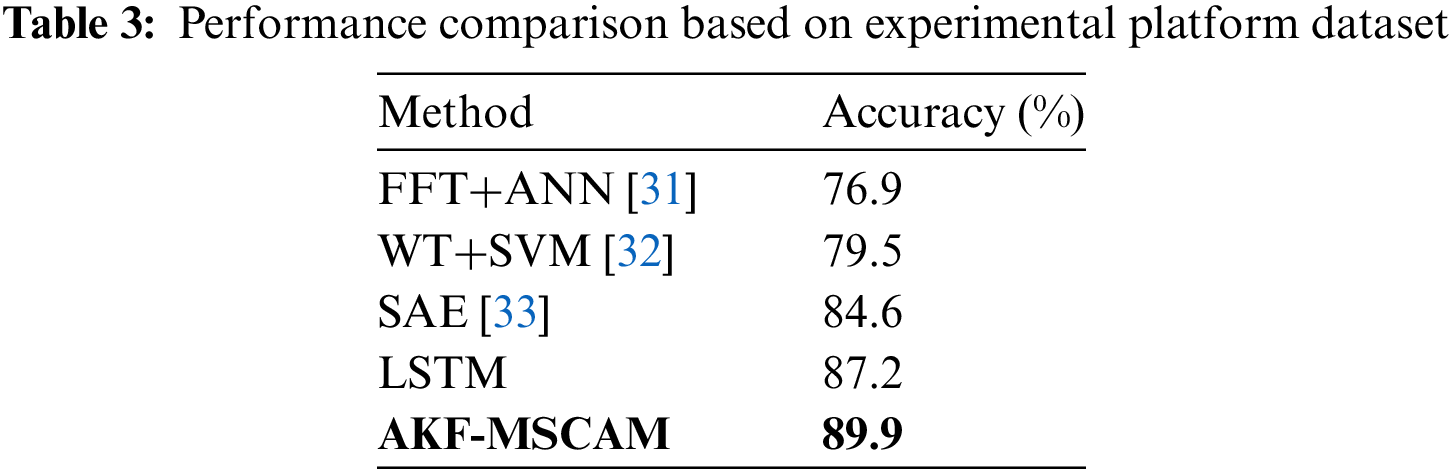
It can be seen from Table 3 that the classification accuracy of all algorithms is reduced for the IEEE database, but AKF-MSCAM still has good accuracy in the classification of complex PQD. So the proposed method still has good performance under actual grid disturbance signals.
To address the limitation of current deep neural networks, which can only withdraw single-scale characteristics, leading to the loss of feature information and weak anti-noise performance, this paper adopts an algorithm based on an adaptive Kalman filter and multi-scale channel attention fusion convolutional network to identify and classify, and uses an adaptive Kalman filter to filter the original disturbed signal to enhance the anti-noise performance. Then different convolution kernels are used to construct different scales to realize complex disturbance identification with strong anti-noise performance and high precision. Finally, this paper draws the following conclusions through Matlab and Python simulation experiments:
1) To solve the problem of poor noise resistance in complex disturbances, an adaptive Kalman filter is proposed. This method has been effectively applied in power quality disturbance signal filtering and can effectively distinguish power quality disturbance signals from noise signals so that multi-scale channel attention convolution can better extract features.
2) In response to the bottleneck in initial feature fusion, an iterative attention feature fusion module is introduced. This module effectively solves the challenges of feature fusion at various levels while expanding the resolution space for perturbations.
3) To address the limitation of current perturbation feature extraction methods, which can only extract single-scale features, we propose a multi-scale channel attention fusion convolutional network model. This model exhibits exceptionally high accuracy in disturbance recognition, even under conditions of strong noise. This approach ensures robust noise resistance in the network and achieves high classification accuracy.
However, the creation of an appropriate dataset is a common challenge for deep learning-based methods. The model proposed in this study has been trained using a synthetic dataset that conforms to the IEEE STD 1159-2019 standard, which may limit its ability to detect certain real-world PQDs that deviate from the standard. Future work will incorporate a hybrid dataset that includes a significant number of synthetic signals and a limited number of real signals to broaden the applicability of the proposed model.
Acknowledgement: None.
Funding Statement: The project is supported by the National Natural Science Foundation of China (52067013) and the Key Projects of the Natural Science Foundation of Gansu Provincial Science and Technology Department (22JR5RA318).
Author Contributions: The authors confirm contribution to the paper as follows: study conception and design: Feng Zhao, Guangdi Liu; data collection: Guangdi Liu, Xiaoqiang Chen; analysis and interpretation of results: Guangdi Liu, Ying Wang; draft manuscript preparation: Guangdi Liu. All authors reviewed the results and approved the final version of the manuscript.
Availability of Data and Materials: The data that support the findings of this study are available in IEEE Std1159-2019. These data were derived from the following resources available in the public domain.
Conflicts of Interest: The authors declare that they have no conflicts of interest to report regarding the present study.
References
1. Wang, F., Quan, X. Q., Ren, L. T. (2021). Review of power quality disturbance detection and identification methods. Proceedings of the CSEE, 12, 4104–4121 (In Chinese). [Google Scholar]
2. Xi, X. Z., Xing, C., Qin, R. S., Liu, H., Zhou, X. et al. (2022). Power quality disturbance recognition method based on multi-layer feature fusion attention network. Smart Power, 10, 37–44. [Google Scholar]
3. Cui, Y. L. (2020). Analysis of power system harmonic detection based on adaptive filtering (Master Thesis). Changsha University of Science and Technology, China. [Google Scholar]
4. Chen, Z. X., Xi, Y. H., Shen, Y. (2022). Recognition of multiple power quality disturbances based on a Kalman filter and deep belief network. Power System Protection and Control, 7, 81–90 (In Chinese). [Google Scholar]
5. Cui, Y. L., Xi, Y. H., Zhang, X. D. (2019). Detection of harmonic based on residual analysis using adaptive Kalman filter. Power System Protection and Control, 24, 92–100 (In Chinese). https://doi.org/10.19783/j.cnki.pspc.190132 [Google Scholar] [CrossRef]
6. Li, Z. M., Lu, G. Y., Chen, N., Pei, Z. Y., Ding, Y. H. et al. (2021). Recognition of hybrid PQ disturbances based on a chaos ensemble decision tree power system. Power System Protection and Control, 21, 18–27. https://doi.org/10.19783/j.cnki.pspc.211072 [Google Scholar] [CrossRef]
7. Yin, B. Q., Chen, Q. B., Li, B., Zuo, L. (2021). A new method for identification and classification of power quality disturbance based on modified Kaiser window fast S transform and LightGBM. Proceedings of the CSEE, 24, 8372–8384 (In Chinese). https://doi.org/10.13334/j.0258-8013.pcsee.210743 [Google Scholar] [CrossRef]
8. Liu, Y. L., Jin, T., Mohamed, M. A., Wang, Q. J. (2021). A novel three-step classification approach based on time-dependent spectral features for complex power quality disturbances. IEEE Transactions on Instrumentation and Measurement, 70, 1–14. https://doi.org/10.1109/TIM.2021.3050187 [Google Scholar] [CrossRef]
9. Liu, Y. L., Yuan, D., Gong, Z., Jin, T., Mohamed, M. A. (2023). Adaptive spectral trend based optimized EWT for monitoring the parameters of multiple power quality disturbances. International Journal of Electrical Power & Energy Systems, 146, 108797. https://doi.org/10.1016/j.ijepes.2022.108797 [Google Scholar] [CrossRef]
10. Zhang, Y., Ou, J. Y., Jin, T., Bi, G. H. (2022). Power quality disturbance recognition method based on feature image combination and modified ResNet-18. Proceedings of the CSEE, 1–15 (In Chinese). https://doi.org/10.13334/j.0258-8013.pcsee.222644 [Google Scholar] [CrossRef]
11. Zheng, W., Lin, R. Q., Wang, J., Li, Z. J. (2021). Power quality disturbance classification based on GAF and a convolutional neural network. Power System Protection and Control, 11, 97–104. https://doi.org/10.19783/j.cnki.pspc.200997 [Google Scholar] [CrossRef]
12. Qian, B. Q., Chen, Q., Li, Z. Y., Zhang, Z. W., Niu, Y. H. (2023). Power quality disturbance classification method based on Markov transition field and multi-head attention. Power System Technology, 1–12 (In Chinese). https://doi.org/10.13335/j.1000-3673.pst.2023.0007 [Google Scholar] [CrossRef]
13. Zhang, R., Zhang, C., Gao, H., Cheng, Z. D. (2023). Power quality disturbances classification based on grouping convolutional network with adaptive feature enhanced network. Proceedings of the CSEE, 15, 5808–5818 (In Chinese). https://doi.org/10.13334/j.0258-8013.pcsee.220972 [Google Scholar] [CrossRef]
14. Liu, J., Song, H., Sun, H. W., Zhao, H. Y. (2020). High-precision identification of power quality disturbances under strong noise environment based on FastICA and random forest. IEEE Transactions on Industrial Informatics, 17(1), 377–387. https://doi.org/10.1109/TII.2020.2966223 [Google Scholar] [CrossRef]
15. Yuan, D. L., Liu, Y., Lan, M., Jin, T., Mohamed, M. A. (2022). A novel recognition method for complex power quality disturbances based on visualization trajectory circle and machine vision. IEEE Transactions on Instrumentation and Measurement, 71, 1–13. https://doi.org/10.1109/TIM.2022.3204985 [Google Scholar] [CrossRef]
16. Lan, M. Y., Liu, Y. L., Jin, T., Gong, Z., Liu, Z. Q. (2022). An improved recognition method based on visual trajectory circle and ResnetN18 for complex power quality disturbances. Proceedings of the CSEE, 42(17), 6274–6286 (In Chinese). https://doi.org/10.13334/j.0258-8013.pcsee.211203 [Google Scholar] [CrossRef]
17. Liu, Y. L., Yuan, D., Fan, H. W., Jin, T., Mohamed, M. A. (2023). A multidimensional feature-driven ensemble model for accurate classification of complex power quality disturbance. IEEE Transactions on Instrumentation and Measurement, 72, 1–13. https://doi.org/10.1109/TIM.2023.3265756 [Google Scholar] [CrossRef]
18. Liu, Y. L., Jin, T., Mohamed, M. A. (2023). A novel dual-attention optimization model for points classification of power quality disturbances. Applied Energy, 339, 121011. https://doi.org/10.1016/j.apenergy.2023.121011 [Google Scholar] [CrossRef]
19. Xi, Y. H., Chen, Z. X., Tang, X., Li, Z. W., Zeng, X. J. (2021). Type identification and time location of multiple power quality disturbances based on KF-ML-aided DBN. IET Generation, Transmission & Distribution, 16(8), 1552–1556. https://doi.org/10.1049/GTD2.12364 [Google Scholar] [CrossRef]
20. Yue, X. K., Yuan, J. P. (2005). An adaptive kalman filter algorithm based on maximum likelihood criterion. Journal of Northwestern Polytechnical University, 4, 469–474. [Google Scholar]
21. Xiao, G. (2005). Research on information fusion technology of multi-sensor integrated navigation system (Ph.D. Thesis). Harbin Engineering University, China. [Google Scholar]
22. Singh, B., Najibi, M., Davis, L. S. (2018). SNIPER: Efficient multi-scale training. Proceedings of the 32nd International Conference on Neural Information Processing Systems, pp. 9333–9343. Canada. [Google Scholar]
23. Li, X. R., Pi, J. D., Lou, M., Qi, Y. L., Li, S. Z. et al. (2022). Multi-level feature fusion network for nuclei segmentation in digital histopathological images. The Visual Computer, 39, 1307–1322. https://doi.org/10.1007/S00371-022-02407-3 [Google Scholar] [CrossRef]
24. Dai, Y., Gieseke, F., Oehmcke, S., Wu, Y., Barnard, K. (2021). Attentional feature fusion. 2021 IEEE Winter Conference on Applications of Computer Vision (WACV), pp. 3559–3568. Waikoloa, HI, USA. https://doi.org/10.1109/WACV48630.2021.00360 [Google Scholar] [CrossRef]
25. Han, C. L., Peng, F. X., Jie, A., Wang, L. X. (2018). Pyramid attention network for semantic segmentation. British Machine Vision Conference (BMVC), pp. 1–13. Northumbria, UK. [Google Scholar]
26. IEEE (2019). IEEE recommended practice for monitoring electric power quality. In: IEEE Std 1159–2019, pp. 1–98. [Google Scholar]
27. Zheng, Z. C. (2020). Research on the cause identification of voltage sag disturbance based on deep learning (Master Thesis). North China Electric Power University, Beijing, China. [Google Scholar]
28. Wang, K., Sun, X. M., Ren, C. H., Hu, Y. Y., Wang, W. C. et al. (2022). Power quality disturbance recognition based on multi-scale fusion selection convolutional network. Modern Electronics Technique, 4, 107–112 (In Chinese). https://doi.org/10.16652/j.issn.1004-373x.2022.04.020 [Google Scholar] [CrossRef]
29. Wang, W. B., Zhang, B., Zeng, W. R., Dong, R. Y., Zheng, Y. K. (2020). Power quality disturbance classification of one-dimensional convolutional neural networks based on feature fusion. Power System Protection and Control, 6, 53–60. https://doi.org/10.19783/j.cnki.pspc.190550 [Google Scholar] [CrossRef]
30. IEEE Power Engineering Society (1986). In: IEEE power engineering review, vol. PER-6, no. 7. IEEE. https://doi.org/10.1109/MPER.1986.5527821 [Google Scholar] [CrossRef]
31. Borges, F. A. S., Fernandes, R. A. S., Silva, I. N., Silva, C. B. S. (2016). Feature extraction and power quality disturbances classification using smart meters signals. IEEE Transactions on Industrial Informatics, 12(2), 824–833. https://doi.org/10.1109/TII.2015.2486379 [Google Scholar] [CrossRef]
32. Borrs, M. D., Bravo, J. C., Montao, J. C. (2016). Disturbance ratio for optimal multi-event classification in power distribution networks. IEEE Transactions on Industrial Electronics, 63(5), 3117–3124. https://doi.org/10.1109/TII.2015.2486379 [Google Scholar] [CrossRef]
33. Wang, S., Chen, H. (2019). A novel deep learning method for the classification of power quality disturbances using deep convolutional neural network. Applied Energy, 235, 1126–1140. https://doi.org/10.1016/j.apenergy.2018.09.160 [Google Scholar] [CrossRef]
Cite This Article
 Copyright © 2024 The Author(s). Published by Tech Science Press.
This work is licensed under a Creative Commons Attribution 4.0 International License , which permits unrestricted use, distribution, and reproduction in any medium, provided the original work is properly cited.
 Downloads
 Citation Tools