
 Submit a Paper
 Propose a Special lssue
 Open Access
ARTICLE

Analysis of Maximum Liquid Carrying Capacity Based on Conventional Tubing Plunger Gas Lift
1 College of Mechanical and Electronic Engineering, China University of Petroleum (East China), Qingdao, 266580, China
2 Energy Technology & Services Oil Production Services Company, CNOOC, Tianjin, 300450, China
* Corresponding Author: Yanqun Yu. Email:
(This article belongs to the Special Issue: Hydraulic Fracturing Theory and Application for Geo-energy Development)
Energy Engineering 2024, 121(6), 1521-1533. https://doi.org/10.32604/ee.2024.047986
Received 24 November 2023; Accepted 06 March 2024; Issue published 21 May 2024
 View Full Text
 Download PDF
Abstract
China’s unconventional gas fields have a large number of low-productivity and low-efficiency wells, many of which are located in remote and environmentally harsh mountainous areas. To address the long-term stable production of these gas wells, plunger-lift technology plays an important role. In order to fully understand and accurately grasp the drainage and gas production mechanisms of plunger-lift, a mechanical model of plunger-liquid column uplift in the plunger-lift process was established, focusing on conventional plunger-lift systems and representative wellbore configurations in the Linxing region. The operating casing pressure of the plunger-lift process and the calculation method for the maximum daily fluid production rate based on the work regime with the highest fluid recovery rate were determined. For the first time, the critical flow rate method was proposed as a constraint for the maximum liquid-carrying capacity of the plunger-lift, and liquid-carrying capacity charts for conventional plunger-lift with different casing sizes were developed. The results showed that for 2 casing plunger-lift, with a well depth of shallower than 808 m, the maximum drainage rate was 33 m/d; for 2 casing plunger-lift, with a well depth of shallower than 742 m, the maximum drainage rate was 50.15 m/d; for 3 casing plunger-lift, with a well depth of shallower than 560 m, the maximum drainage rate was 75.14 m/d. This research provides a foundation for the scientific selection of plunger-lift technology and serves as a decision-making reference for developing reasonable plunger-lift work regimes.Keywords
Nomenclature
| Critical liquid carry velocity coefficient |
In plunger-lift, the plunger acts as a solid interface, separating the liquid above from the gas below in the wellbore, thus providing a seal to reduce liquid slippage above the plunger and prevent gas channeling below the plunger. This improves operational efficiency and gas production from the wells.
Researchers such as Foss et al. [1] proposed the first plunger-lift model based on field application experiences from the Ventura Avenue gas field. This model predicted critical plunger-lift parameters using data from high gas-liquid ratio plunger-lift wells and calculated the minimum pressure required to ensure contact between the plunger and the liquid column. Lea [2] developed the first dynamic model for the plunger-rising phase, considering the force balance between the plunger and the liquid column and the changing velocity of the plunger ascent. He et al. [3] divided the plunger-lift process into three stages based on the study of plunger motion characteristics and casing pressure variations. They established dynamic models for each stage and analyzed the influencing factors of plunger-lift, categorized as power, resistance, and volume. The impact of gas-liquid ratio, formation pressure, pipeline pressure, and well depth on production rates was also analyzed, and it was suggested to adjust casing pressure and flowback time to achieve higher production. Tang et al. [4] developed a dynamic model considering changes in oil and casing pressure, liquid accumulation, liquid fallback, and plunger resistance to describe plunger motion. Based on field test data, the characteristics of oil and casing pressure in plunger-lift wells were quantitatively described. Gasbarri et al. [5] developed a plunger-lift model for low-producing gas wells that do not achieve the desired production rate due to liquid accumulation. This model combines the dynamic characteristics of mechanical plunger-lift systems with reservoir dynamics, considering the frictional effects of liquid segments above and below the plunger and the influence of separator and pipeline pressure on plunger operation, including modeling the transient production behavior after the liquid segment reaches the surface.
Hashmi et al. [6,7] proposed a simplified model of wellbore and formation plunger operation, still based on the Forsgel model, which presupposes that the tubing and jacket annulus can be filled with fluid by closing the production valve. Gupta et al. [8,9] developed a novel plunger gas-lift dynamic model based on the pressure and flow dynamics of fluids in the annulus and the central tubing section of the well, as well as the dynamics of plunger descent and rise in tubing. It is the first example to model a complex plunger lifting system using the standard Hybrid System Model framework.
Zhu et al. [10,11] provided a computationally efficient flow model to account for interactions between loading liquid, producing gas and the lifting plunger in gas wells. Tan et al. [12] built a full-size visible plunger lift equipment to study the process of single flowing plunger lift (SFPL) and normal plunger lift (NPL). Moreover, a transient model was built to simulate SFPL and NPL in different situation. Results show that the SFPL can prevent the liquid from dropping, decrease the bottom-hole pressure, and enhance gas production. The SFPL performs well in a certain range, and the SFPL would be out of operation first. A plate has been built to help engineers optimize the SFPL. The paper helps clear the situation of SFPL and provides the theoretical basis for researchers.
Based on different research emphases, scholars have proposed various calculation or optimization models [13–15]. In summary, researchers have conducted extensive studies on the mechanisms, processes, and operating regimes of plunger-lift technology. However, there has been limited research on the drainage capacity of plunger-lift processes. This study aims to address this gap by providing a theoretical basis for the adaptability analysis and selection of plunger-lift processes.
Currently, the oil tubing sizes commonly selected for plunger-lift operations are 23/8′′, 27/8′′, and 31/2′′. These corresponding plunger-lift processes are referred to as “conventional plunger-lift with different casing sizes” in this paper.
2 Plunger Gas Lift Process Lifting Model
The cyclic operation of the plunger lift can be divided into four stages: the plunger ascending stage during the well opening, the continuous flow stage during the well opening, the plunger descending stage during well closing, and the pressure build-up stage during well closing. Among them, the “plunger ascending stage during the well opening” is the most crucial stage, as it determines the success of the plunger lift process and the effectiveness of fluid removal.
2.1 Ascending Mechanical Model
The plunger ascending stage refers to the process where the plunger, under the influence of the gas in the formation and the gas in the annulus, leaves the imported locking device and moves upward from the bottom of the well to discharge the liquid from the wellbore. The plunger ascending during well opening consists of two stages: the ascent of the plunger-liquid column in the wellbore and the fluid discharge at the wellhead. The mechanical model of the plunger-liquid column ascent is shown in Fig. 1.
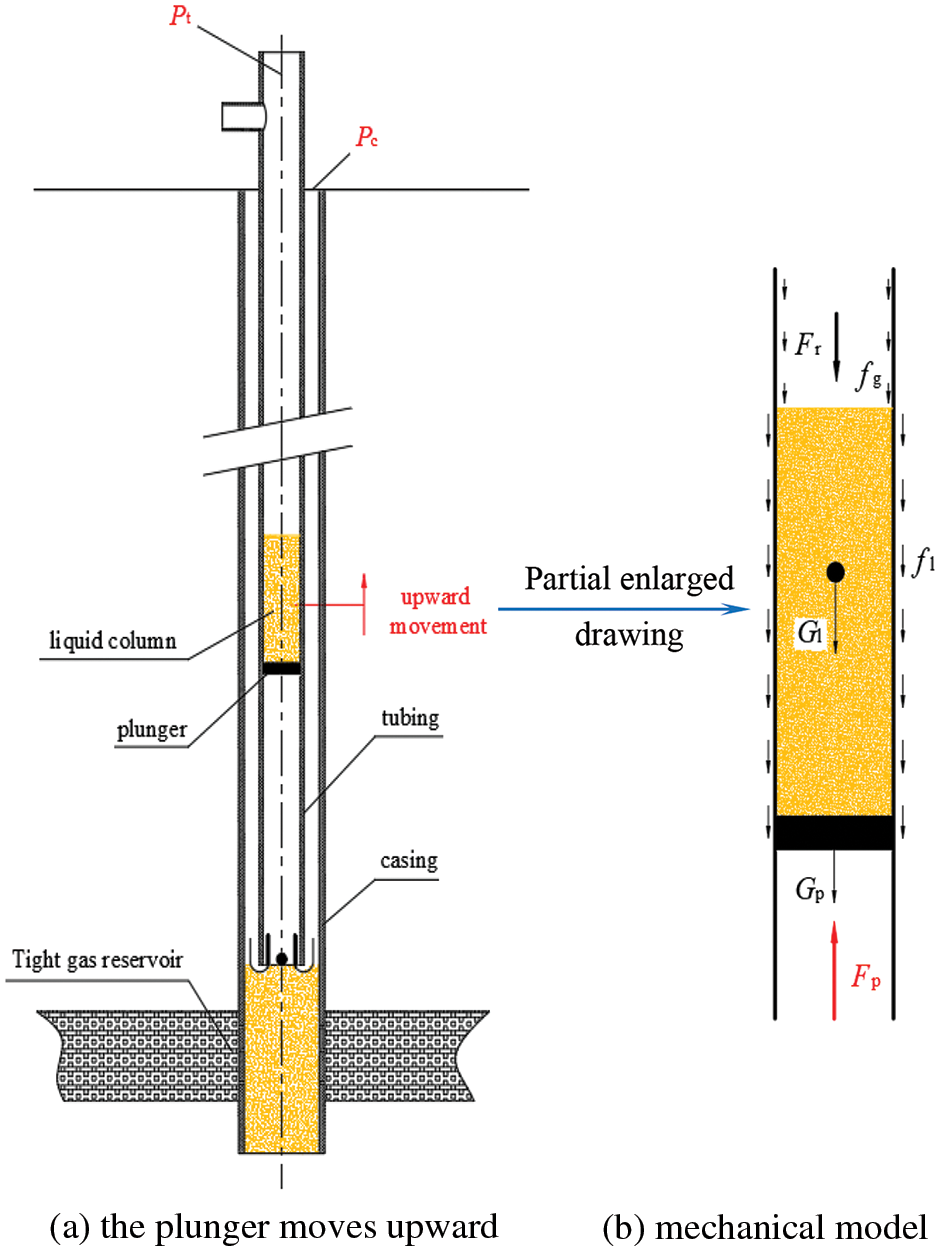
Figure 1: Plunger-liquid column upward movement and force diagram
The mechanical model of the plunger-liquid column in the upward direction can be observed in Fig. 1.
Among them:
Where:
2.2 Running Casing Pressure Model
During operation, the gas energy accumulated in the annular space of the oil sleeve is capable of exerting pressure on the plunger-liquid column, lifting it to the wellhead. This casing pressure at the wellhead is the minimum operating pressure required for the plunger lift process. At this pressure, the “automatic fluid discharge” requirement can be met, as shown in Fig. 2.
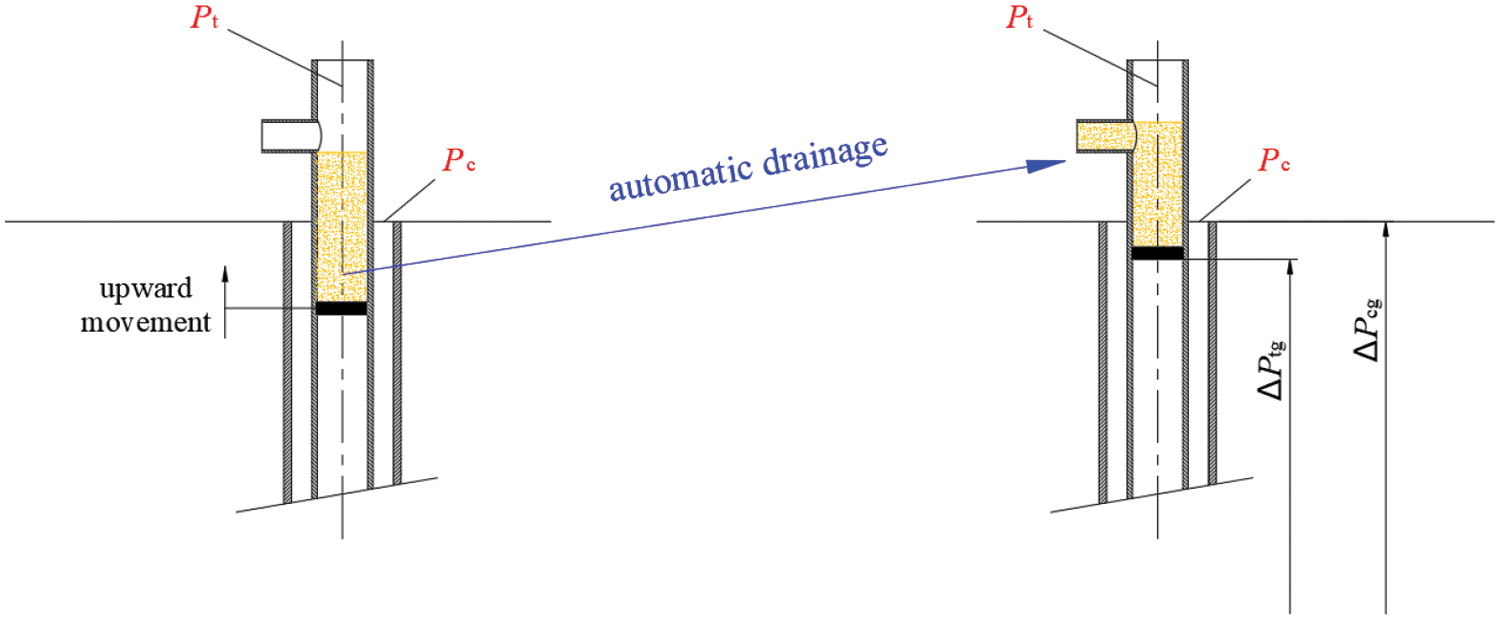
Figure 2: The minimum operating pressure of the plunger lift process
From Fig. 2, it can be observed that if the liquid column reaches the wellhead and remains stationary, the pressure in the oil sleeve is in equilibrium. Therefore, the following relationship holds:
where:
The length of the liquid column relative to the length of the tubing can be neglected, therefore,
According to Fig. 2, once fluid discharge starts at the wellhead, the mass of the liquid column continuously decreases, causing the plunger-liquid column to accelerate its ascent. From this observation, it is evident that the energy from the gas well is sufficient to lift the plunger-liquid column to the wellhead and complete the fluid discharge. Therefore, we can determine the minimum casing pressure required for the operation of the plunger lift, denoted as
Combining Eqs. (1) and (2), we have the following relationship:
where:
Therefore, the minimum casing pressure required for plunger lift operation:
Calculating the pressure
where:
Therefore, the frictional force
Since the minimum casing pressure is the result of gas expansion in the annulus at maximum casing pressure, the maximum casing pressure can be calculated using the gas state equation. Neglecting the differences in the deviation coefficients during gas expansion, the maximum casing pressure is:
where:
3 Plunger Lift Process Parameters
Operating cycle
where:
In which:
where:
The upward velocity of the plunger and the downward velocity of the plunger in gas and liquid are related to pipe dimensions, plunger type, etc. During design, they are generally determined based on field measurement data.
3.2 Maximum Liquid Carrying Capacity
Minimum gas volume required per cycle
where:
When the plunger’s residence time at the wellhead
Daily gas demand
Daily maximum liquid discharge
where:
4 Compute Constraint Conditions
The gas-liquid carrying process is considered the most economical production method for gas wells. For gas wells that meet the requirements of gas-liquid production, the gas-liquid-carrying production method is chosen as the preferred option. This is also the theoretical basis for the development of the optimal tubing drainage gas production process.
The gas-liquid carrying process is based on the critical flow rate method to determine the critical flow rate, and then it is determined based on the relationship between the actual gas production rate and the critical flow rate.
The critical flow rate method suggests that the gas flow velocity determines the carrying capacity of the gas flow, and when the gas flow velocity reaches the critical carrying velocity, liquid droplets can be carried out by the gas.
There are various forms of critical flow rate models, and currently, the classical models are [17–20]:
where:
When gas carries liquid continuously, liquid droplets are the primary form of the liquid phase. Scholars from different countries have obtained different model coefficients c-values based on different shapes of liquid droplets, theoretical derivations, and experimental regressions. The representative c-values for some models [21,22] are shown in Table 1.
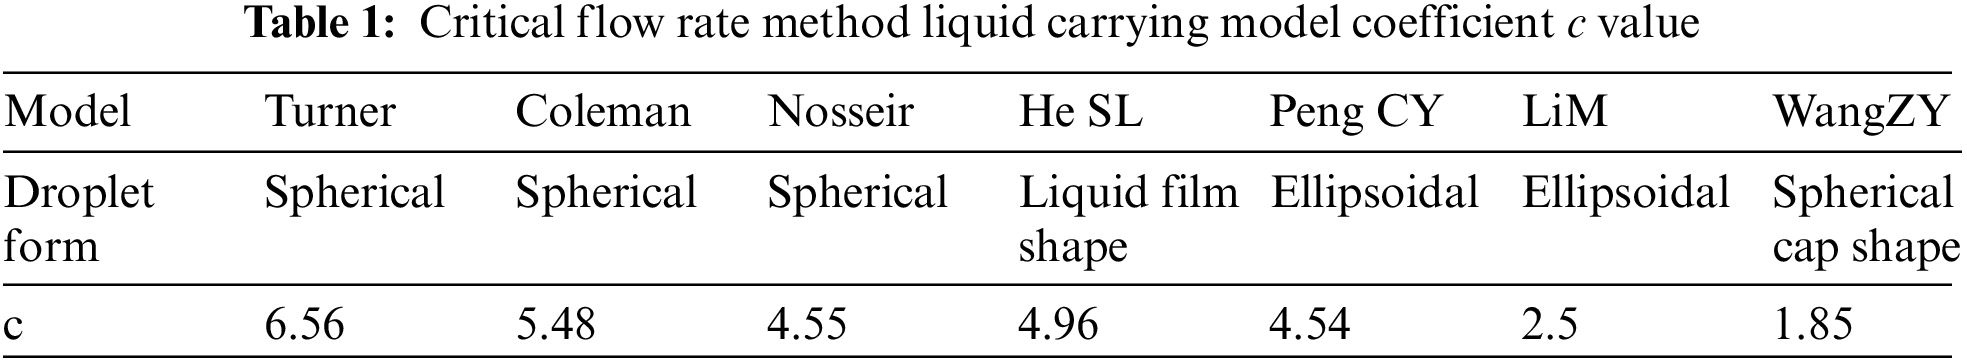
At present, almost all the major gas fields in China have fitted the suitable liquid-carrying empirical model according to the production data, which shows the complexity of liquid liquid-carrying law. In gas-carrying liquid production, the shape of the droplet is relatively complicated. Through a large number of indoor gas-carrying liquid experiments, the actual shape of the droplet during gas-carrying liquid can be better reflected, and then the coefficient of the model can be obtained by the statistical method, which is closer to the actual situation of gas-carrying liquid production than the theoretical model assuming the shape of the droplet.
From the experimental model coefficients, it can be seen that it is between the Limin model and Coleman model, which indicates that the droplet shape of gas-carried liquid is between spherical and ellipsoidal. In this experiment, droplets are carried by gas through the liquid column, and the shape of droplets is related to the degree of fragmentation of the liquid surface under the action of airflow. Through a lot of experiments, the c value suitable for the target block is 2.90. The coincidence rate of fluid accumulation reached 87%, which is shown in Fig. 3.
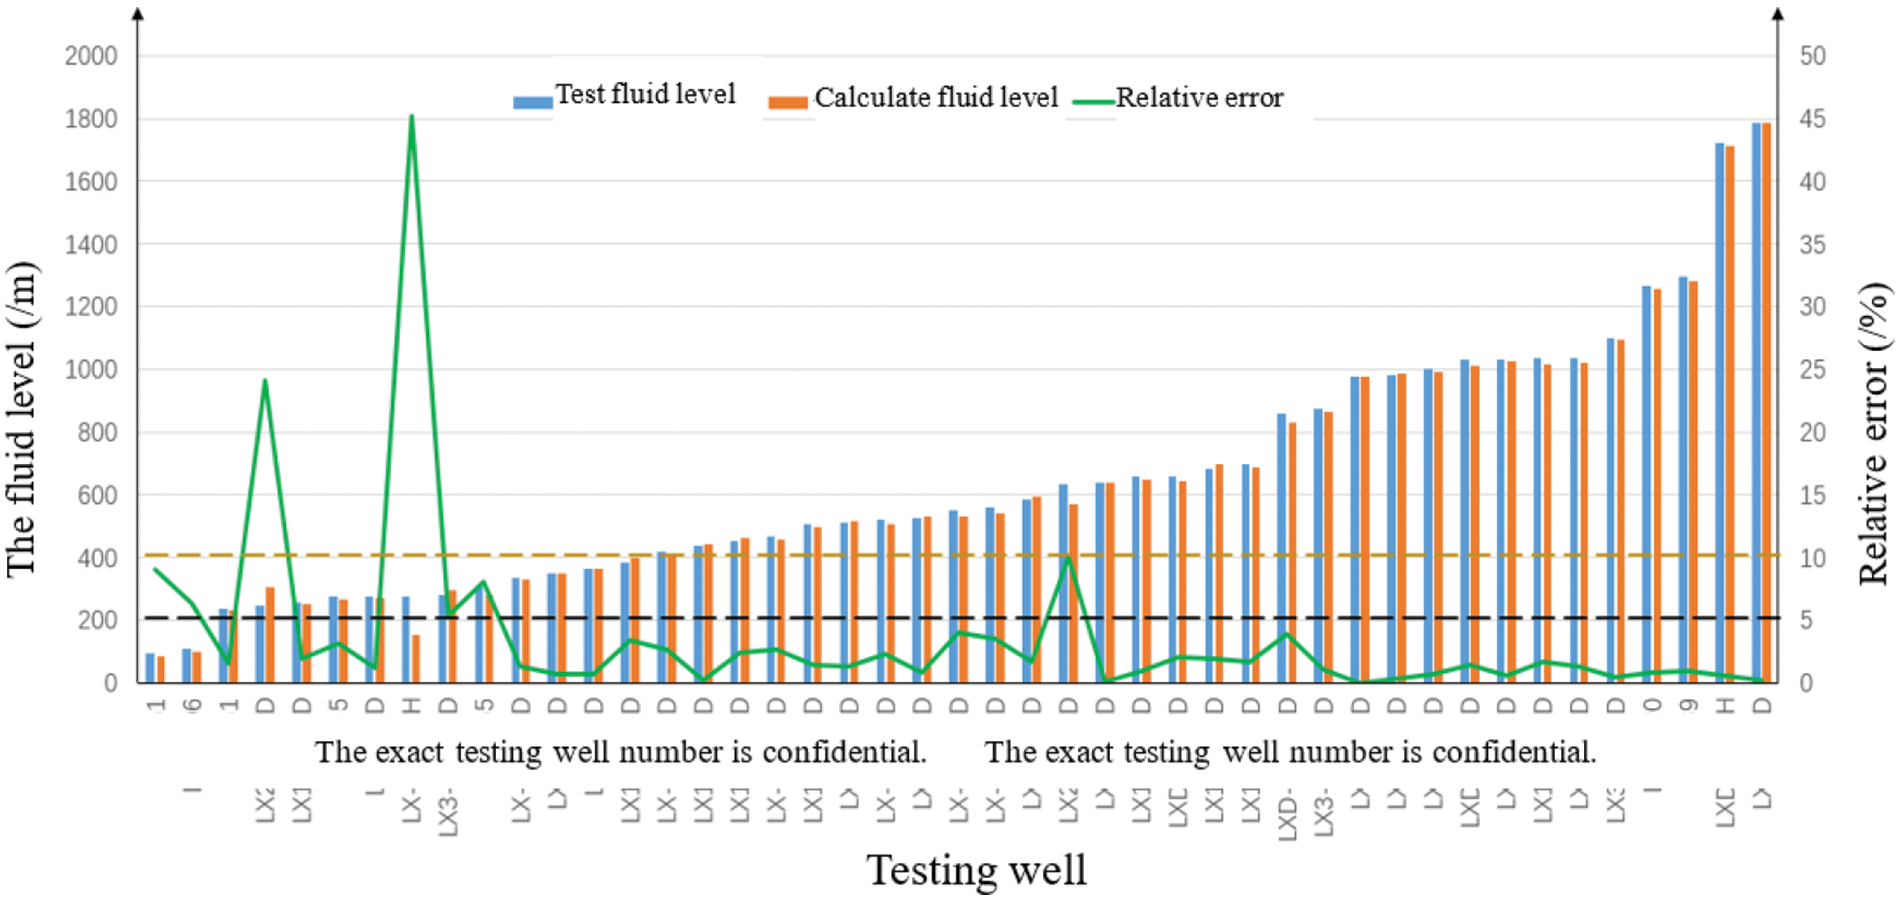
Figure 3: The results of the field application test of the model
For the current conventional column of plunger lift, the critical liquid-carrying flow rate determined based on the maximum flow velocity method is shown in Fig. 4.
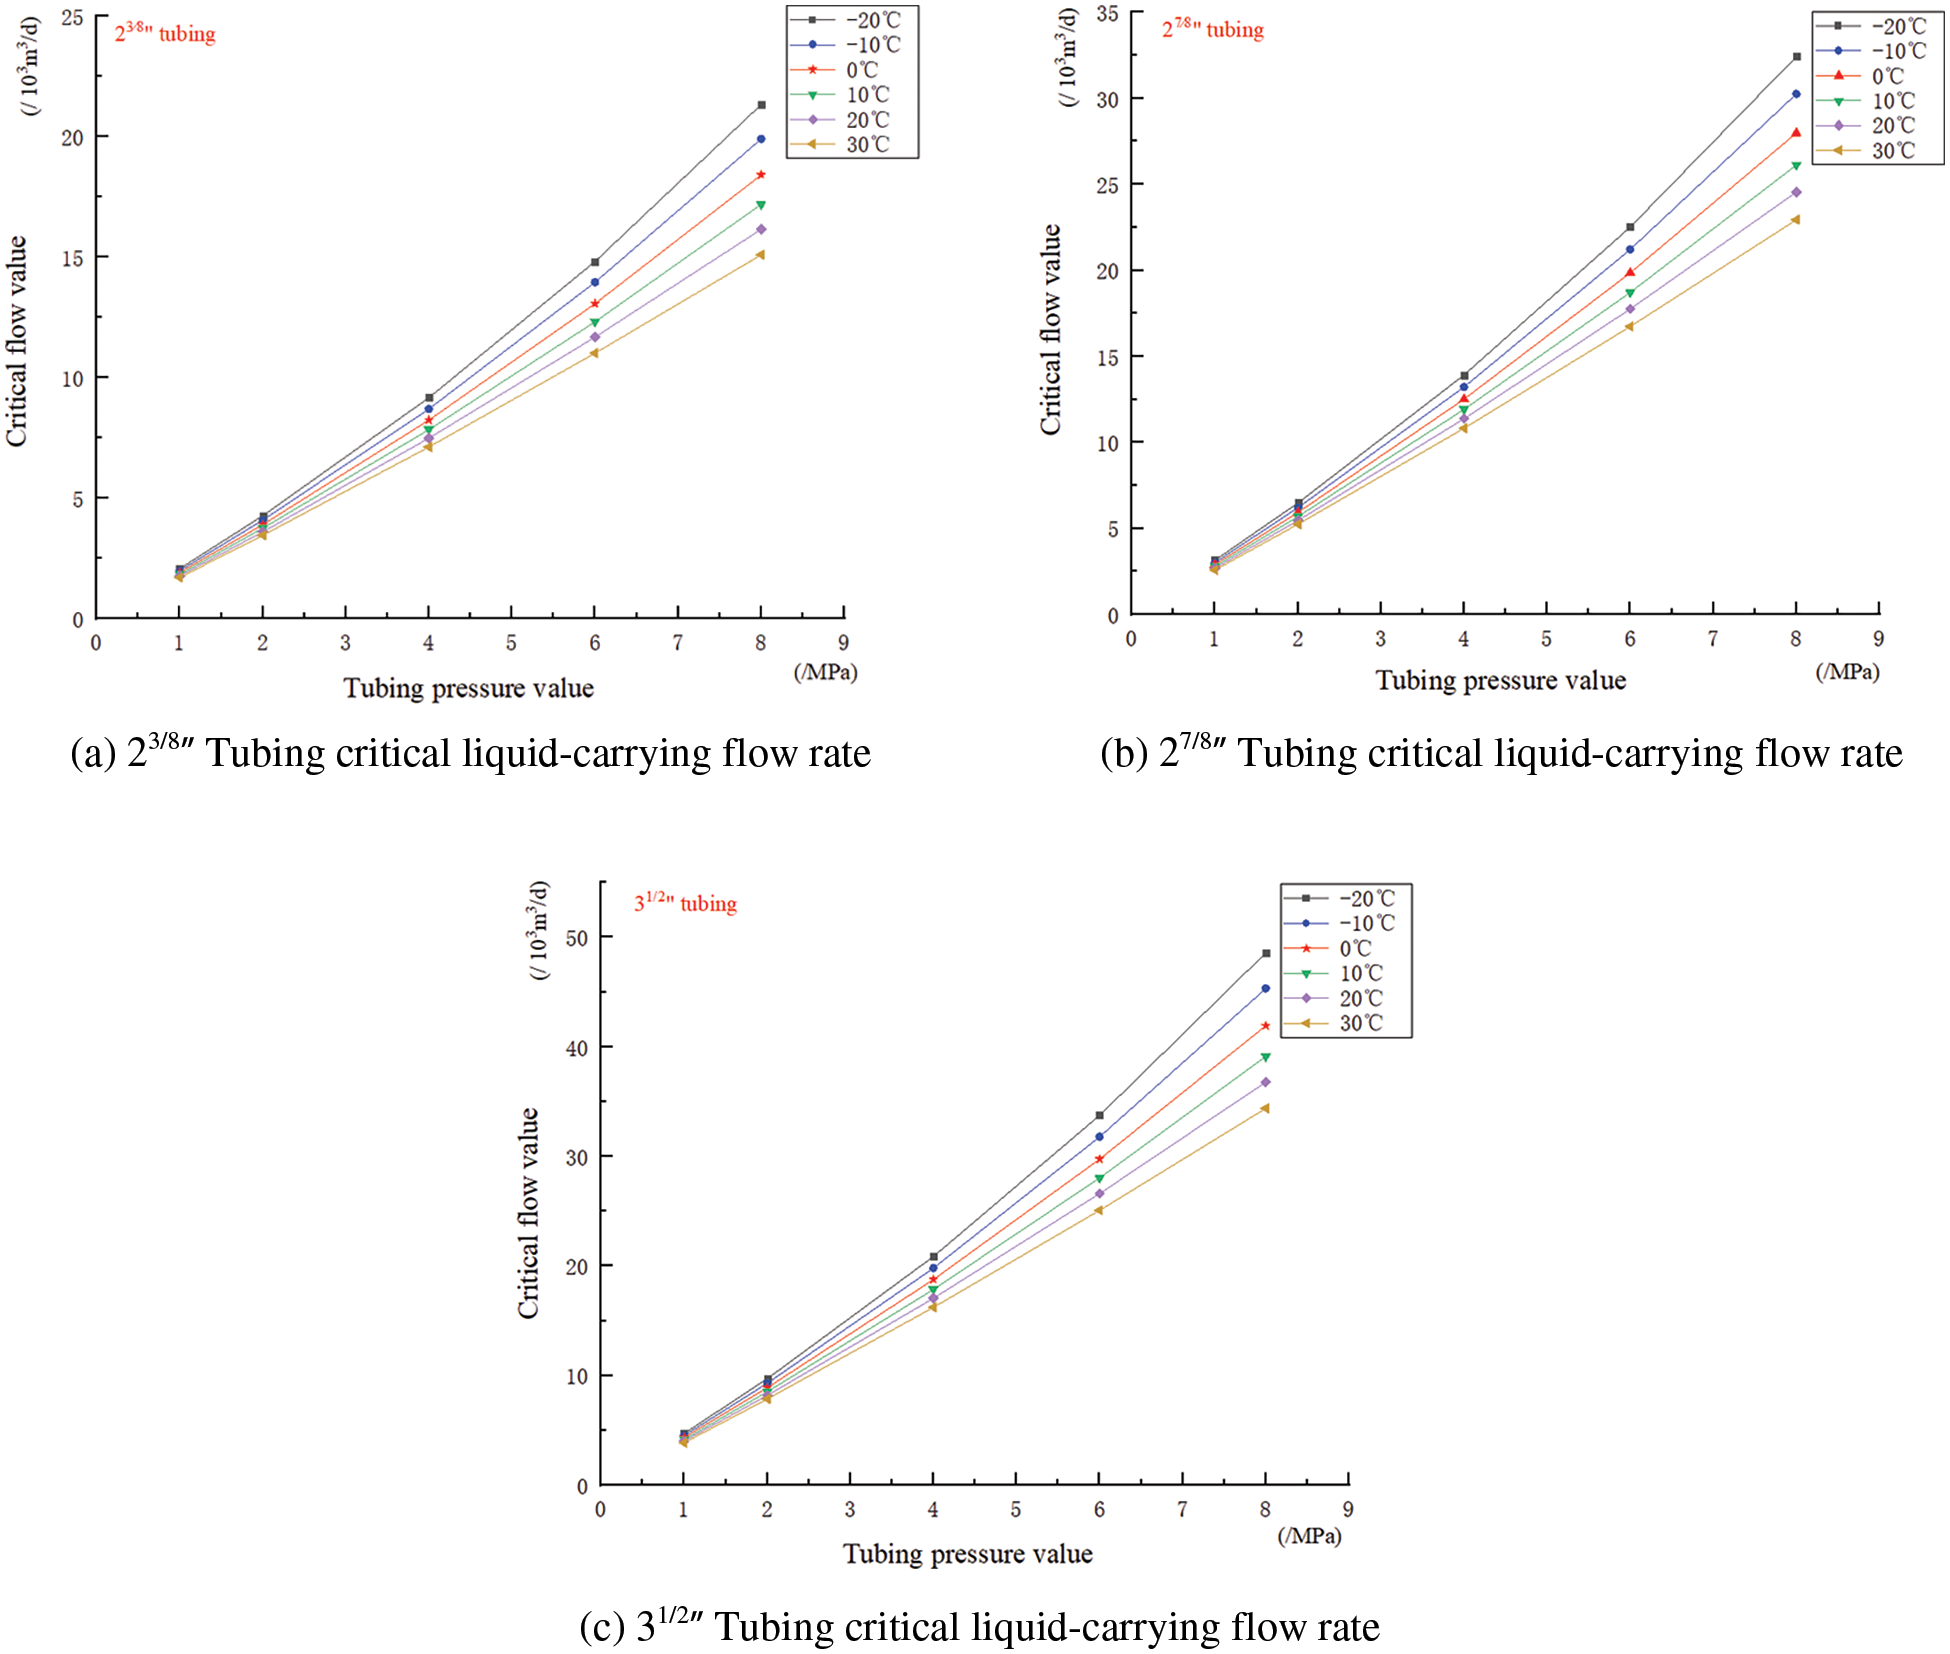
Figure 4: The critical liquid-carrying flow rates under various operating conditions
In Eq. (13), if the density of natural gas is converted to the standard state, the calculation is relatively convenient.
where:
The lower the wellbore temperature and the higher the wellbore pressure, the greater the critical liquid-carrying flow rate. At 0°C, the critical liquid-carrying flow rates for different models of plunger lift columns corresponding to different wellhead pressures are illustrated in Fig. 5.
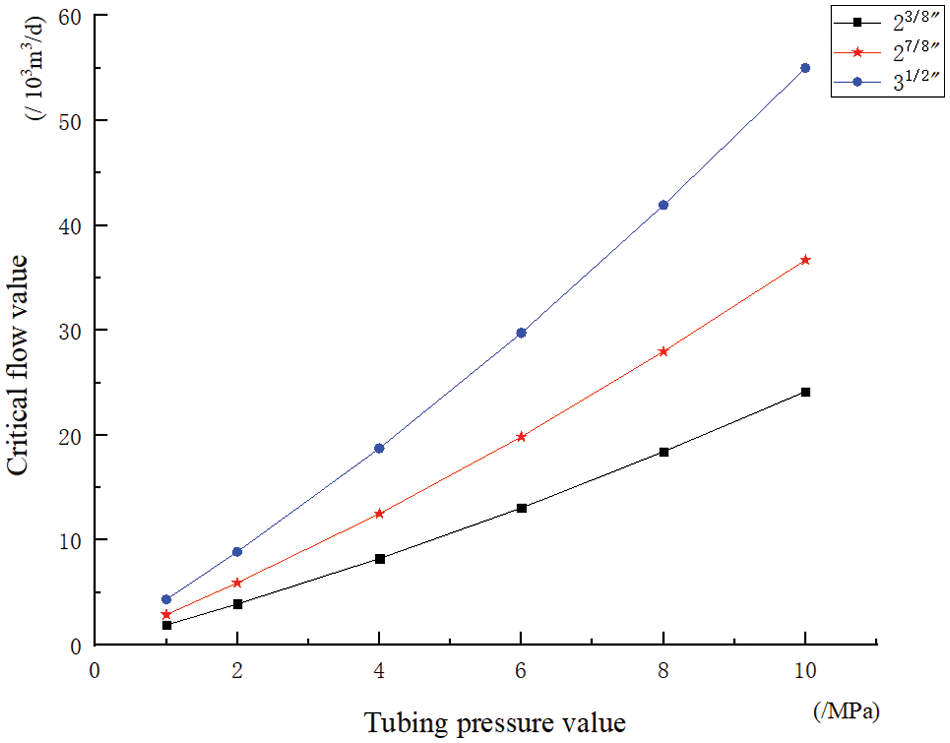
Figure 5: The critical liquid-carrying flow rates of various specifications at 0°C
Based on the field research data, it is possible for wellhead pipelines to experience freezing and blockage below 0°C. The wellhead network manifold pressure is generally less than 3 MPa. Therefore, for subsequent calculations, we will select the parameters from Fig. 4 for the scenario of “Wellhead Temperature: 0°C, Wellhead Pressure: 3 MPa” to perform the calculations.
5 Plunger Lift Liquid Carrying Selection Chart
As evident from the preceding analysis, various operational parameters of the plunger lift process, such as pack-off pressure (the operating casing pressure) and number of operating cycles, are correlated with the speed of plunger movement. QSY01014-2017 provides recommended values for plunger velocities in conventional plunger lift setups: an average plunger ascent speed of 150 to 300 m/min, a plunger descent speed in gas of 60 to 150 m/min, and a plunger descent speed in liquid of 15 to 40 m/min.
Based on the plunger lift daily liquid discharge model equation (Eq. (12)), assuming abundant energy supply in the gas well (due to high gas production or supplemental gas injection), with both opening time for continuous flow and closing time for pressure restoration set to zero, and considering maximum values for plunger ascent and descent speeds, the maximum daily liquid discharge for different specifications of plunger lift columns at varying well depths can be obtained.
Calculation model: Well depth increments (/m) 0:200:5000, periodic liquid discharge increments (/m3) 0:0.05: Ql (where Ql represents the liquid volume of the full wellbore). This approach provides insight into the relationship between periodic liquid discharge and daily liquid discharge for different specifications of plunger lift columns at different well depths. Adhering to the constraints of the plunger lift process, a plunger lift liquid-carrying calculation program is developed to determine the maximum liquid-carrying capacity for columns of different diameters. Subsequently, a plunger lift liquid carrying selection chart for various column specifications at different well depths is plotted, as illustrated in Fig. 6.
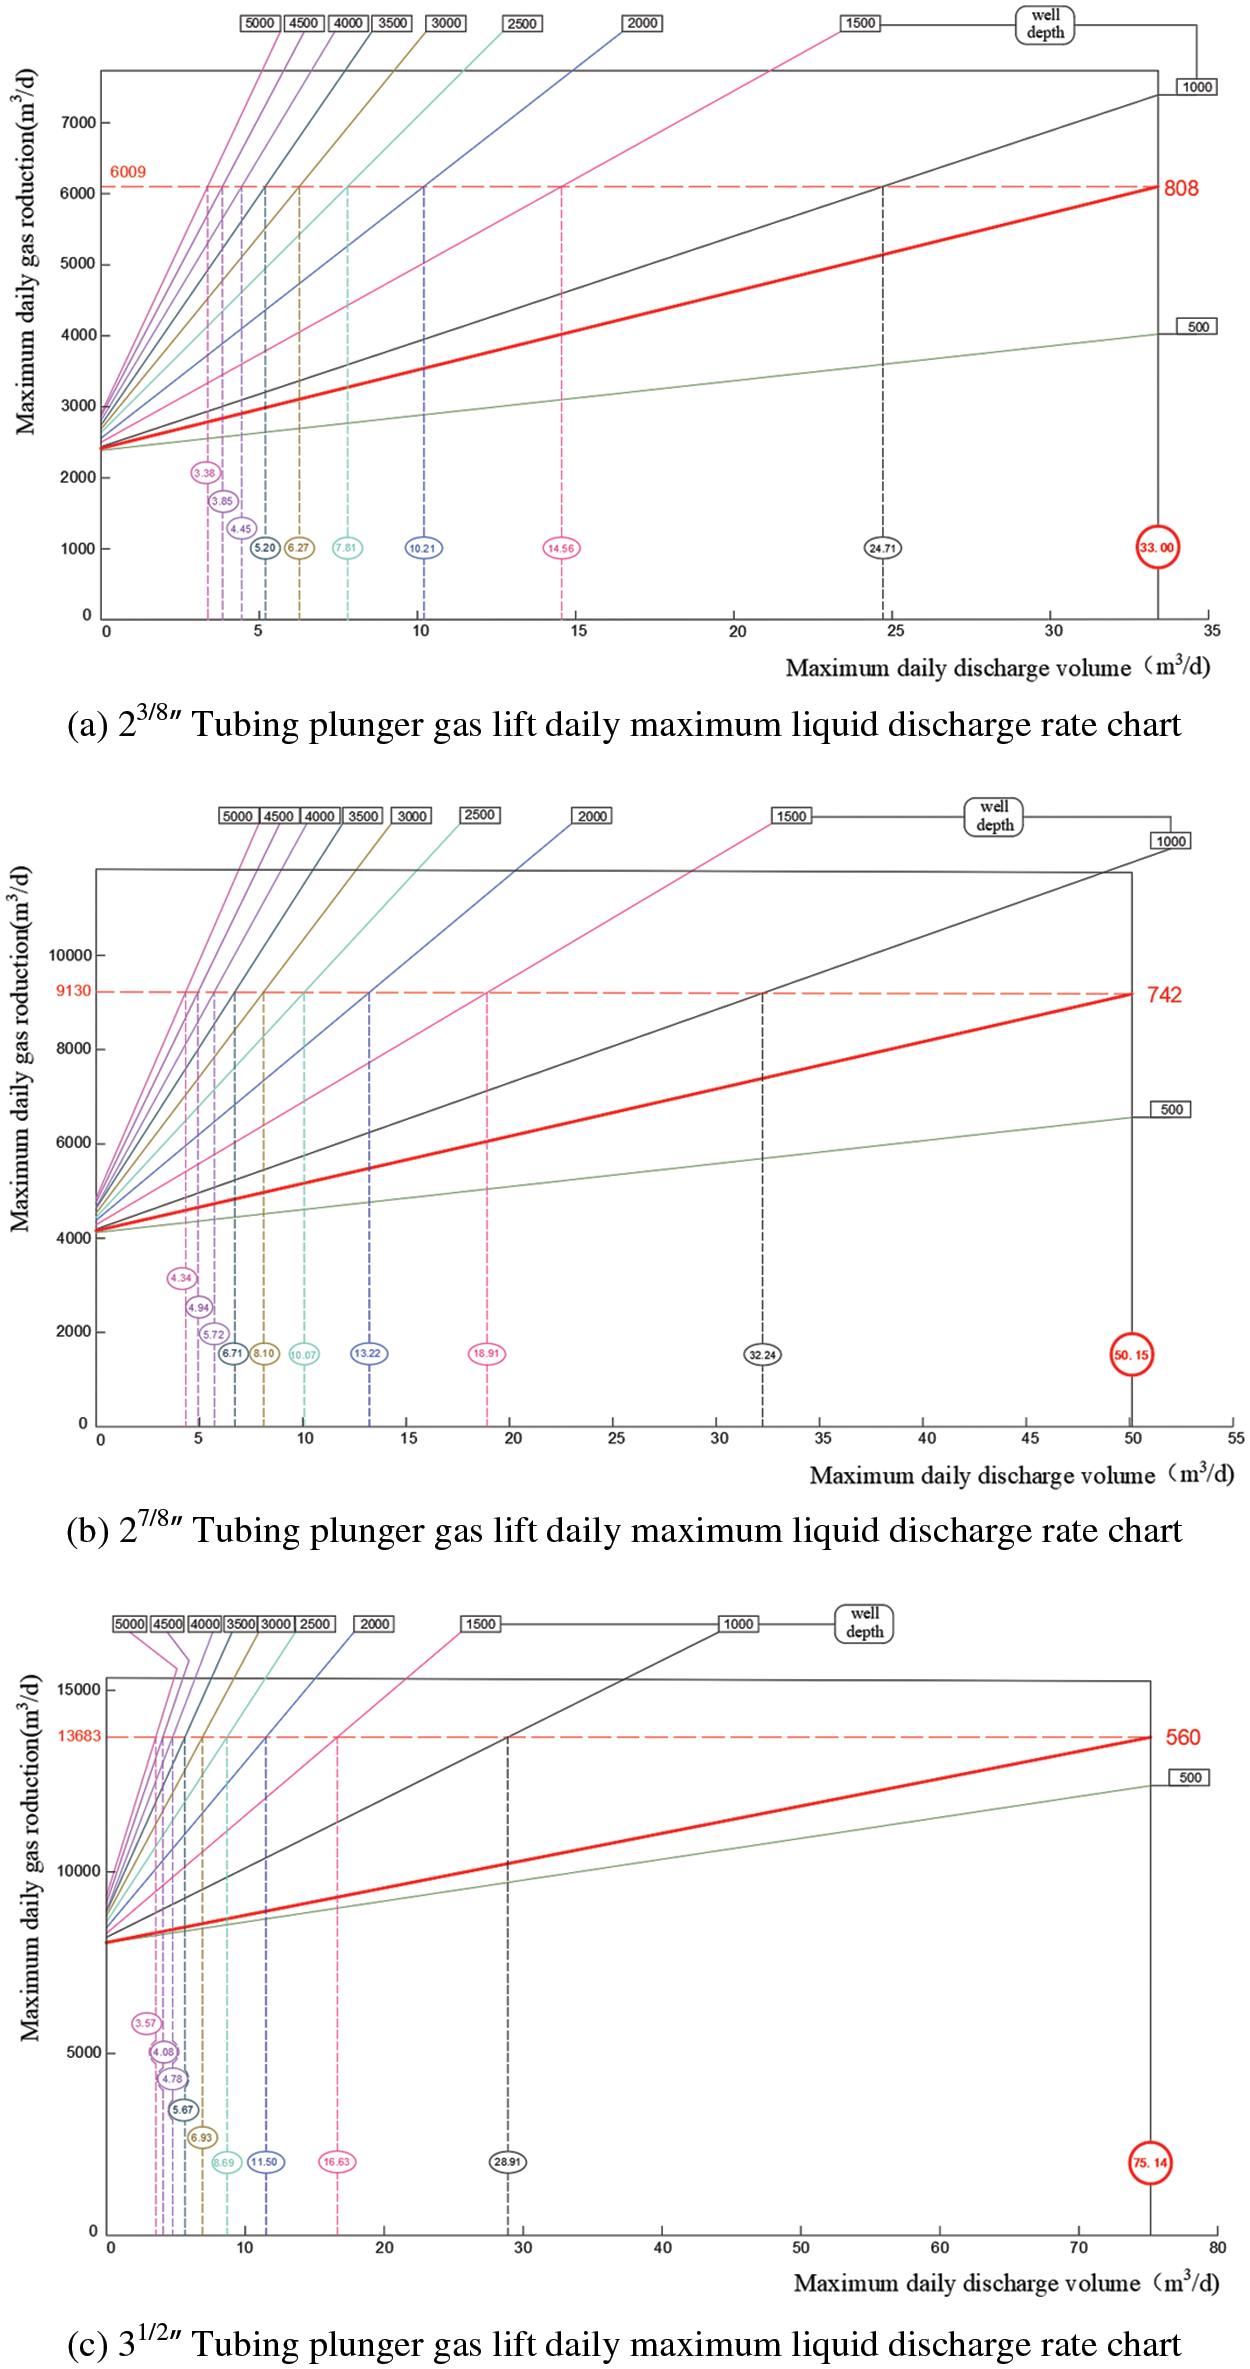
Figure 6: Conventional tubing plunger gas lift liquid discharge rate chart
As shown in Fig. 5: ①. For plunger lift systems with different column diameters, under conditions of sufficient gas volume and appropriate well depth, the larger the column diameter, the greater the maximum daily liquid carrying capacity. ②. For plunger lift systems with the same specifications, there is a corresponding limit depth for the “maximum daily liquid unloading rate”. Below this depth, the “maximum daily liquid unloading rate” can be achieved, and beyond this depth, the “maximum daily liquid unloading rate” gradually decreases. ③. For a 23/8′′ column plunger lift system, when lifting wells with a depth shallower than 808 m, the maximum liquid unloading rate is 33 m3/d. ④. For a 27/8′′ column plunger lift system, when lifting wells with a depth shallower than 742 m, the maximum liquid unloading rate is 50.15 m3/d. ⑤. For a 31/2′′ column plunger lift system, when lifting wells with a depth shallower than 560 m, the maximum liquid unloading rate is 75.14 m3/d.
In the case of short periods of high production and long periods of low production, extending the lifespan of gas wells is a crucial task to optimize the cost-efficiency of tight gas wells. Plunger lift technology serves as a pivotal method for managing low-production periods in tight gas wells. Through this study, the following findings have been established:
A mechanical model for the plunger-liquid column ascent in the plunger lift process was developed, allowing for the determination of the operating casing pressure for plunger lift operations. By focusing on the maximum liquid unloading regime, a methodology for calculating the daily maximum liquid unloading rate was derived. The utilization of the critical flow rate method was introduced for the first time as a constraint for determining the maximum liquid carrying capacity in plunger lift operations, laying the groundwork for adaptive analysis of the plunger lift process.
In this paper, for the first time, the conventional plunger lifting liquid carrying chart under different casing sizes is established. This research provides a foundation for the scientific selection of plunger-lift technology and serves as a decision-making reference for developing reasonable plunger-lift work regimes.
Acknowledgement: I would like to thank the unconventional Operations Center of Oil Production Service Branch of CNOOC Energy Development Co., Ltd. for its strong support.
Funding Statement: The research work was supported by the Fundamental Research Funds for the Central Universities of China (No. 20CX02308A), CNOOC Project (No. ZX2022ZCCYF3835).
Author Contributions: Yu Yanqun: Writing, Original draft, Conceptualization, Methodology, Conceptualization. Xu Wenhao and Huangfu Yahui: Investigation, Formal analysis, Data curation, Visualization, Methodology. Liu Jinhai and Wang Bensheng: Writing–review & editing, Supervision, Data curation, Validation. Liu Kai: Writing–review & editing, Validation. All authors reviewed the results and approved the final version of the manuscript.
Availability of Data and Materials: Data will be made available on request. The data used to support the findings of this study are available from the corresponding author upon request.
Conflicts of Interest: The authors declare that they have no conflicts of interest to report regarding the present study.
References
1. Foss, D. L., Gaul, R. B. (1965). Plunger-lift performance criteria with operating experience-venture avenue field. API Drilling and Production Practice, 125–140. [Google Scholar]
2. Lea, J. F. (1982). Dynamic analysis of plunger lift operations. Journal of Petroleum Techonology, 34(11), 2617–2629. https://doi.org/10.2118/10253-PA [Google Scholar] [CrossRef]
3. He, S. L., Wu, W. J. (2005). Establishment of dynamic model for plunger gas lift. Acta Petrolei Sinica, 26(4), 88–92 (In Chinese). [Google Scholar]
4. Tang, Y., Zheng, L. (2008). A new method of plunger lift dynamic analysis and optimal design for gas well deliquification. SPE Annual Technical Conference and Exhibition, vol. 7, pp. 4841–4854. [Google Scholar]
5. Gasbarri, S., Wiggins, M. L. (2001). A dynamic plunger lift model for gas wells. SPE Production Operations Symposium, 16(2), 89–96. [Google Scholar]
6. Hashmi, G. M., Hasan, A. R., Kabir, C. S. (2018). Simplified modeling of plunger-lift assisted production in gas wells. Journal of Natural Gas Science and Engineering, 52, 454–460. https://doi.org/10.1016/j.jngse.2018.02.009 [Google Scholar] [CrossRef]
7. Luo, S., Kelkar, M. (2014). Effective method to predict installation of plunger in a gas well. Journal of Energy Resources Technology, 136, 11–14. [Google Scholar]
8. Gupta, A., Kaisare, N. S., Nandola, N. N. (2017). Dynamic plunger lift model for deliquification of shale gas wells. Computers & Chemical Engineering, 103, 81–90. https://doi.org/10.1016/j.compchemeng.2017.03.005 [Google Scholar] [CrossRef]
9. Nandola, N. N., Kaisare, N. S., Gupta, A. (2018). Online optimization for a plunger lift process in shale gas wells. Computers & Chemical Engineering, 108, 89–97. https://doi.org/10.1016/j.compchemeng.2017.09.001 [Google Scholar] [CrossRef]
10. Zhu, J. J., Zhu, H. W., Zhao, Q. Q. (2020). Transient plunger-lift model improves prediction of liquid unloading from gas wells. Journal of Petroleum Technology, 72(3), 50–51. https://doi.org/10.2118/0320-0050-JPT [Google Scholar] [CrossRef]
11. Zhao, Q. Q., Zhu, J. J., Cao, G. Q., Zhu, H. W., Zhang, H. Q. (2021). Transient modeling of plunger lift for gas well deliquification. SPE Journal, 26(5), 2928–2947. https://doi.org/10.2118/205386-PA [Google Scholar] [CrossRef]
12. Tan, B., Liu, X. L., Liu, Y., Chang, Y. F., Tian, W. (2023). Mechanism of liquid unloading by single flowing plunger lift in gas wells. International Journal of Hydrogen Energy, 48(7), 2571–2582. https://doi.org/10.1016/j.ijhydene.2022.10.118 [Google Scholar] [CrossRef]
13. Xiang, Z., Kabir, C. S. (2019). Simplified transient-IPR modeling in intermittent gas-lift and plunger-lift systems. Journal of Petroleum Science and Engineering, 179, 31–43. https://doi.org/10.1016/j.petrol.2019.04.040 [Google Scholar] [CrossRef]
14. Liu, P., Chen M.He, Z. G., Luo, W., Miao, S. Y. (2022). Study on a gas plunger lift model for shale gas wells and its effective application. Fluid Dynamics and Materials Processing, 18(4), 933–955. https://doi.org/10.32604/fdmp.2022.019736 [Google Scholar] [CrossRef]
15. Wang, P., Huang, W. S., Kong, X. W., Jia, Y. P., Liu, L. (2023). Numerical simulations of liquid leakage and gas channeling for plunger lift. Chemistry and Technology of Fuels and Oils, 59(1), 123–130. https://doi.org/10.1007/s10553-023-01510-y [Google Scholar] [CrossRef]
16. Guo, G. F. (2017). Gas Production engineering (In Chinese). Beijing, China: Petroleum Industry Press. [Google Scholar]
17. Turner, R. G., Hubbard, M. G., Dukler, A. E. (1969). Analysis and prediction of minimum flow rate for the continuous removal of liquids from gas wells. Journal of Petroleum Technology, 21(11), 1475–1482. https://doi.org/10.2118/2198-PA [Google Scholar] [CrossRef]
18. Coleman, S. B., Clay, H. B., McCurdy, D. G., Norris, L. H. (1991). A new look at predicting gas-well load-up. Journal of Petroleum Technology, 43(3), 329–333. https://doi.org/10.2118/20280-PA [Google Scholar] [CrossRef]
19. Guner, M., Pereyra, E., Sarica, C., Torres, C. (2015). An experimental study of low liquid loading in inclined pipes from 90° to 45°. The SPE Production and Operations Symposium, Oklahoma City, USA. [Google Scholar]
20. Zheng, J., Li, J. H., Dou, Y. H., Zhang, Y. C., Yang, X. et al. (2023). Research progress on the calculation model of critical liquid carrying flow of gas well. Energy Science and Engineering, 11(12), 4774–4786. https://doi.org/10.1002/ese3.v11.12 [Google Scholar] [CrossRef]
21. Liu, J. H., Yu, Y. Q., Wang, B. S., Shu, X. Y. (2022). Research and optimization of the method of identifying wellbore fluid accumulation based on critical liquid carrying velocity. Natural Gas Technology and Economy, 16(3), 34–38 (In Chinese). [Google Scholar]
22. Soni, S. K., Kirar, P. K., Kolhe, P., Sahu, K. C. (2020). Deformation and breakup of droplets in an oblique continuous air stream. International Journal Multiphase Flow, 122(3), 103–141. [Google Scholar]
Cite This Article
 Copyright © 2024 The Author(s). Published by Tech Science Press.
This work is licensed under a Creative Commons Attribution 4.0 International License , which permits unrestricted use, distribution, and reproduction in any medium, provided the original work is properly cited.
 Downloads
 Citation Tools