
 Submit a Paper
 Propose a Special lssue
 Open Access
ARTICLE

Research on the Control Strategy of Micro Wind-Hydrogen Coupled System Based on Wind Power Prediction and Hydrogen Storage System Charging/Discharging Regulation
College of Machine, Shanghai DianJi University, Shanghai, 201306, China
* Corresponding Author: Baohua Li. Email:
(This article belongs to the Special Issue: Wind Energy Development and Utilization)
Energy Engineering 2024, 121(6), 1607-1636. https://doi.org/10.32604/ee.2024.047255
Received 31 October 2023; Accepted 28 December 2023; Issue published 21 May 2024
 View Full Text
 Download PDF
Abstract
This paper addresses the micro wind-hydrogen coupled system, aiming to improve the power tracking capability of micro wind farms, the regulation capability of hydrogen storage systems, and to mitigate the volatility of wind power generation. A predictive control strategy for the micro wind-hydrogen coupled system is proposed based on the ultra-short-term wind power prediction, the hydrogen storage state division interval, and the daily scheduled output of wind power generation. The control strategy maximizes the power tracking capability, the regulation capability of the hydrogen storage system, and the fluctuation of the joint output of the wind-hydrogen coupled system as the objective functions, and adaptively optimizes the control coefficients of the hydrogen storage interval and the output parameters of the system by the combined sigmoid function and particle swarm algorithm (sigmoid-PSO). Compared with the real-time control strategy, the proposed predictive control strategy can significantly improve the output tracking capability of the wind-hydrogen coupling system, minimize the gap between the actual output and the predicted output, significantly enhance the regulation capability of the hydrogen storage system, and mitigate the power output fluctuation of the wind-hydrogen integrated system, which has a broad practical application prospect.Keywords
At present, with the global large-scale promotion of distributed energy construction, wind power installed capacity is gradually expanding, but the wind power has volatility and intermittency, which not only increases the difficulty of integrated energy system scheduling and operation but also triggers voltage fluctuations, in power harmonics, and other related problems will affect the quality of online power [1–4]. To address the above problems, researchers usually use wind power prediction and numerical weather prediction (NWP) to adjust the wind power output, but there is still a deviation between the predicted value of wind power and the actual value of wind power, which can be introduced into the energy storage system to suppress the fluctuation of wind power. Hydrogen energy has the characteristics of high energy density and long service life. It is easy to store and develop, so the hydrogen energy storage system can be used as a large-scale wind power consumption program, which is mainly composed of an electrolyzer, fuel cell, and hydrogen storage tank [5].
References [6,7] proposed an energy system management strategy for the integrated energy system based on the difference of wind-hydrogen coupled system operation under different working conditions, which improved the utilization rate of wind energy and realized the scheduling control of the energy system. Reference [8] proposed the control strategy of the wind turbine, fuel cell, and electrolyzer system to realize the output regulation of the hydrogen storage system, and references [9,10] constructed the cogeneration energy system based on the wind-hydrogen coupled system with the minimum hydrogen production cost to get the heat and electricity as well as the amount of hydrogen production in the relevant period. Reference [11] simulated wind turbines, photovoltaics, electrolyzers, fuel cells, and batteries with load demand and meteorological data (wind speed, solar radiation intensity, and temperature) to validate the system’s performance in different scenarios. Reference [12] proposed that offshore wind farms utilize hydrogen production and supercapacitors to smooth the impact of wind power fluctuations, and modeled a hybrid energy storage system with hydrogen production and supercapacitors, which can better smooth the wind power fluctuations by developing a coordinated control strategy between the two. Reference [13] proposed a model predictive control method based on a wind-hydrogen coupled generation system by constructing a state space model based on the model predictive control (MPC) strategy and using a genetic optimization algorithm for the rolling solution. To deal with disturbances and prediction errors in system operation, a feedback mechanism is introduced to be embedded in the MPC framework, and a rolling time-domain approach is used to compensate for system disturbances. Finally, through a case study of a region in the Netherlands, it is verified that the method can effectively reduce interactive power consumption and maximize local wind power consumption. Reference [14] presented a Model Predictive Controller (MPC) for the optimal operation of a grid-connected wind farm with a hydrogen energy storage system and a local load, which is designed taking into account the operational and economic costs of the ESS, the local load demand and the participation in the electricity market, and the satisfaction of physical and system dynamic constraints. For better performance, the dynamics are modeled using the Mixed Logic Dynamics (MLD) framework, and the effectiveness of the proposed strategy, which maintains the constraints and avoids unnecessary switching cycles to prolong the lifetime of the hydrogen storage system, is verified by numerical analysis of data from the plant in northern Norway. Reference [15] presented an adaptive noise-based improved integrated empirical modal decomposition (ICEEMDAN) co-optimization control strategy for energy storage optimization in a coupled wind-hydrogen-electrochemical energy storage system. The smoothing effect and wind abandonment capacity of different energy storage schemes are also compared, and the results show that the method can enhance the ability to complete wind abandonment and dissipation. Reference [16] presents a new hybrid deep learning model for multi-step wind speed prediction that uses variational modal decomposition (VMD) to extract the intrinsic mode functions (IMFs) of non-smooth atmospheric variables. The decomposed atmospheric variables are then grouped based on the similarity of the modes and pairwise dependencies are captured using a graph neural network (GNN). Finally, the temporal convolutional network (TCN) is applied to wind speed prediction. The experimental results show that the mean absolute error (MAE) of the proposed model is less than 0.1 m/s in the 1-h prediction, which is significantly better than the existing models. The established hybrid energy system should meet the following requirements in the control strategy: (1) it can satisfy the demand of the load side, (2) the subsystems operate normally. The following research gaps currently exist in this area: (1). The current research mainly focuses on the field of large-scale integrated wind farms, and the research on small-scale wind-hydrogen coupled systems has not been fully developed. Since small-scale wind-hydrogen coupled systems have smaller scales in terms of power supply and energy storage, their characteristics are different from those of large-scale wind farms. Therefore, it is necessary to conduct targeted research on small-scale wind-hydrogen coupled systems. (2) In the past, since the application scenarios of wind-hydrogen coupling systems mainly focused on larger-scale wind farms, this led to the problem of relatively high system construction and operation costs. At the same time, due to the increase in system scale, the requirements for system accuracy and system power scheduling have become more complex and difficult. (3) In past research, the control strategy for wind-hydrogen coupled systems has the problems of slow convergence speed and low accuracy, and the research focuses on the development and optimization of the control strategy for small-scale wind-hydrogen coupled system, to improve the power output adjustability and energy conversion efficiency of the small-scale wind-hydrogen coupled system.
According to the relevant quotations in the introduction, the current wind-hydrogen coupling system predictive control strategy mainly uses the model predictive control (MPC) model to optimize the operation of the hydrogen storage system and the grid-connected power plant, and mainly optimizes the operation and economic cost and power market, and the application scenarios are large-scale integrated wind farms, and there are fewer studies on small-scale distributed wind-hydrogen coupling system. The proposed predictive control strategy can greatly improve the output tracking ability of the wind-hydrogen coupled system, minimize the difference between the actual output and the predicted output, significantly enhance the regulation ability of the hydrogen storage system, and alleviate the power output fluctuation of the wind-hydrogen integrated system, which has a broad practical prospect.
Aiming at the optimization problem of the control strategy of the wind-hydrogen coupled system, this paper firstly constructs the Kalman-VMD-SVR prediction algorithm to obtain the ultra-short-term wind power prediction power and combines it with the hydrogen energy storage optimization strategy. After that, it is necessary to determine the weight coefficients of the weighted objective function used for smoothing wind power in the optimal scheduling strategy of hydrogen energy storage, and the control coefficients in the current division of the hydrogen energy storage system into operating intervals, and the results obtained by this method can easily fall into the local optimization, and it is difficult to find the optimal solution. Due to the instability of wind power output, the sigmoid function has the characteristics of s-type smoothing and minimization [17,18], which can better achieve the effect of smoothing the wind power compared with activation functions such as the step function, so in this paper, we use the adaptive parameter search method to update the control coefficients of the hydrogen storage system in the division of the working interval, compared with the customized method, which greatly improves the weighting coefficient in the objective function. In this paper, we use the adaptive parameter search method to update the control coefficients in the divided operating interval of the hydrogen storage system, which greatly improves the tracking ability of the control coefficients compared with the customized method, and at the same time, the rolling optimization of the parameters of the hydrogen storage system greatly improves the ability of the wind power to track the power, reduces the fluctuation of the output power of the wind power, and further enhances the ability of the wind power to eliminate the wind power, and carries out the overpowering regulation of the wind power output in response to different working conditions.
This paper is aimed at the control strategy of miniature wind-hydrogen coupled system, the article is generally divided into six parts, the first part introduces the overall overview of the wind-hydrogen coupled system as well as the current progress of related research, the second part establishes the wind-hydrogen coupled system model and constructs the model of each sub-module within the system, the third part combines the VMD variational mode decomposition algorithm on the basis of the traditional Kalman multi-part correction-SVR algorithm to construct the Kalman-VMD-SVR prediction algorithm to obtain the ultra-short-term wind power prediction power, the fourth part is to regulate the wind power prediction results on the hydrogen storage system output, adding the control coefficient x in the traditional hydrogen storage regulation interval to improve the regulation response speed ability, and at the same time using the sigmoid-PSO adaptive parameter search method to the control coefficients of the hydrogen storage system in the division of the working interval is updated to improve the power tracking ability of wind power, and the fifth part establishes a small wind-hydrogen coupling system, selects the actual operating power and short-term predicted power data of a 5.5 MW micro wind farm on a certain day, and carries out a numerical simulation based on MATLAB to validate the energy storage control method proposed in this paper, and the sixth part draws the following conclusions after the argumentation of the above parts: the over-advanced prediction control strategy is more effective in reducing the power of the wind-hydrogen coupling system than the real-time control strategy. The real-time control strategy can reduce the error between the joint output and the planned output of the wind-hydrogen coupled system and improve the ability of large-scale wind power consumption and the regulation ability of the hydrogen energy storage system.
2 Modelling of Wind-Hydrogen Coupled Systems
As shown in Fig. 1, the wind-hydrogen coupling system consists of wind turbines, electrolysis tanks, hydrogen storage tanks, fuel cells, and related control units. The control center adjusts the online wind power output and the hydrogen production output of the electrolysis tank according to the change in wind speed so that the wind power can be quickly absorbed. The part that exceeds the load-side power demand is fed into the electrolysis tank to produce and compress hydrogen, and stored in the hydrogen storage tank. When the wind power output is lower than the load-side power demand, the hydrogen in the hydrogen storage tank is converted into electricity by the hydrogen fuel cell to compensate for the wind power online power shortage and power fluctuation, and at the same time to improve the quality of the wind power online power. Hydrogen can also be used as a secondary energy carrier transported by pipeline to the industrial and commercial sectors, covering the chemical and mechanical industries, and at the same time to promote the growth of new energy vehicles hydrogen fuel cell vehicle industry, injecting a strong impetus into the implementation of the national dual-carbon strategy. At the same time, it can promote the development of new energy vehicle hydrogen fuel cell vehicle industry, injecting a strong force for the implementation of a national dual-carbon strategy.
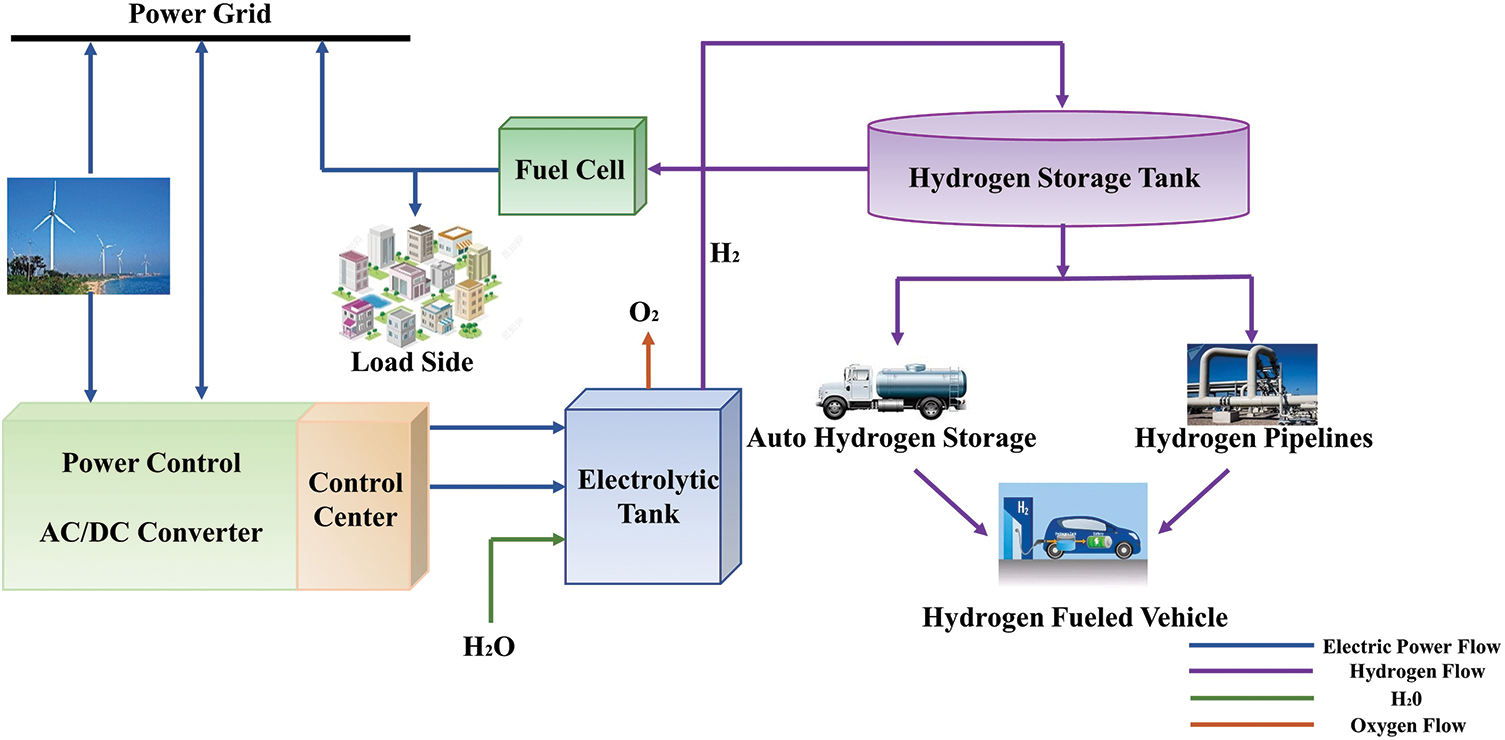
Figure 1: Structure of wind-hydrogen coupling system
The airflow drives the wind turbine blades and hubs to rotate the energy into mechanical energy, through the generator will be converted into electrical energy, and then through the AC/DC rectifier will be converted into direct current, the power online through the inverter to convert with the same frequency as the grid power, while the DC power can be input to the electrolyzer subsystem for hydrogen production.
The relevant mathematical model for wind turbines is as follows [19,20], and the mathematical Eq. (1) for wind energy capture is:
Wind turbine output power Eq. (2):
In the above equation, the
The thermal model of the electrolyzer is as follows [21]:
The mathematical model of the electrolyzer electric-gas conversion is as follows [22]:
In the above equation, the
2.2.3 Modeling of Hydrogen Storage Systems
The use of high-pressure compression in existing hydrogen storage units is more common, and hydrogen storage units are modeled as follows [23]:
where
The equation of state for uncompressed hydrogen is:
The equation of state of compressed hydrogen is given by [24]:
Hydrogen fuel cells work in reverse to an electrolyzer, where oxygen is fed to the fuel cell anode, hydrogen is converted to hydrogen ions, and the two react in the catalytic layer to produce water from the reaction, as well as waste heat.
Quantitative expression for the gas-electric conversion relationship of a fuel cell [25]:
In the above equation, the
3 Ultra-Short-Term Wind Power Prediction
The Kalman-VMD-SVR prediction algorithm combines the advantages of Kalman filtering, variational mode decomposition, and support vector regression. Kalman filtering can effectively deal with the noise in the wind power signal, the VMD algorithm can decompose the nonlinear signal into multiple independent signals while extracting the signal features, and the SVR algorithm is suitable for nonlinear cases to establish effective regression models, and the combination of the three algorithms can be optimized in the extraction, denoising, and regression training of wind power prediction, respectively. Regression model, the combination of the three algorithms can be optimized in the extraction and denoising of wind power signals and regression training of wind power prediction power, respectively. SVR has some advantages in dealing with nonlinear data prediction but lacks stability in dealing with noisy or uncertain data. LSTM is a predictive recurrent neural network for dealing with time-series data, and compared with Kalman-VMD-SVR compared to Kalman-VMD, LSTM can capture long-term dependencies and has better performance for nonlinear and non-smooth data, but the computational complexity is higher. Random Forest: Random Forest is an integrated learning algorithm for dealing with the prediction of multidimensional data, compared with Kalman-VMD-SVR, Random Forest can deal with high-dimensional data and has better generalization ability and robustness, but it may not take enough consideration of the temporal relationship of time series data.
In this section, the Kalman filter multi-step correction method and the VMD waveform decomposition method based on SVR (Support Regression Vector Machine) are introduced, which form the Kalman-VMD-SVR algorithm to perform the overshoot power prediction for the selected sample points, and the time resolution is set to 15 min.
The main element that affects the accuracy of wind power prediction is the degree of deviation of numerical weather forecast values from the actual value, using the Kalman filtering multi-stage correction method, the predicted wind speed parameters are compared with the actual value, and the error value of the two is fed back to the actual value of the future wind speed for correction [26].
The real-time wind speed data are converted into wind power observations, and the features of the wind power data values are extracted using VMD to decompose the original unstable time-series wind power values into smooth time-series sub-sequences to minimize the influence of the original unstable wind power fluctuations.
VMD is a variational modal adaptive decomposition technique that decomposes the original signal into multiple modal functions and minimizes the resulting estimated bandwidth according to the following equation [27]:
Since the presence of variable constraints in the problem makes it prone to local optimization, the introduction of Lagrange multipliers as well as penalty factors transforms the problem into an unconstrained one.
Solve the above problem using the two-way cross multiplier method
In the formula provided above
The obtained corrected NWP wind speed values and the smooth subsequence decomposed by VMD are trained by SVR (Support Vector Machine) and the predicted values of wind power subsequence are obtained, assuming the data samples, the mathematical expression of the regression prediction problem are as follows:
In the above equation,
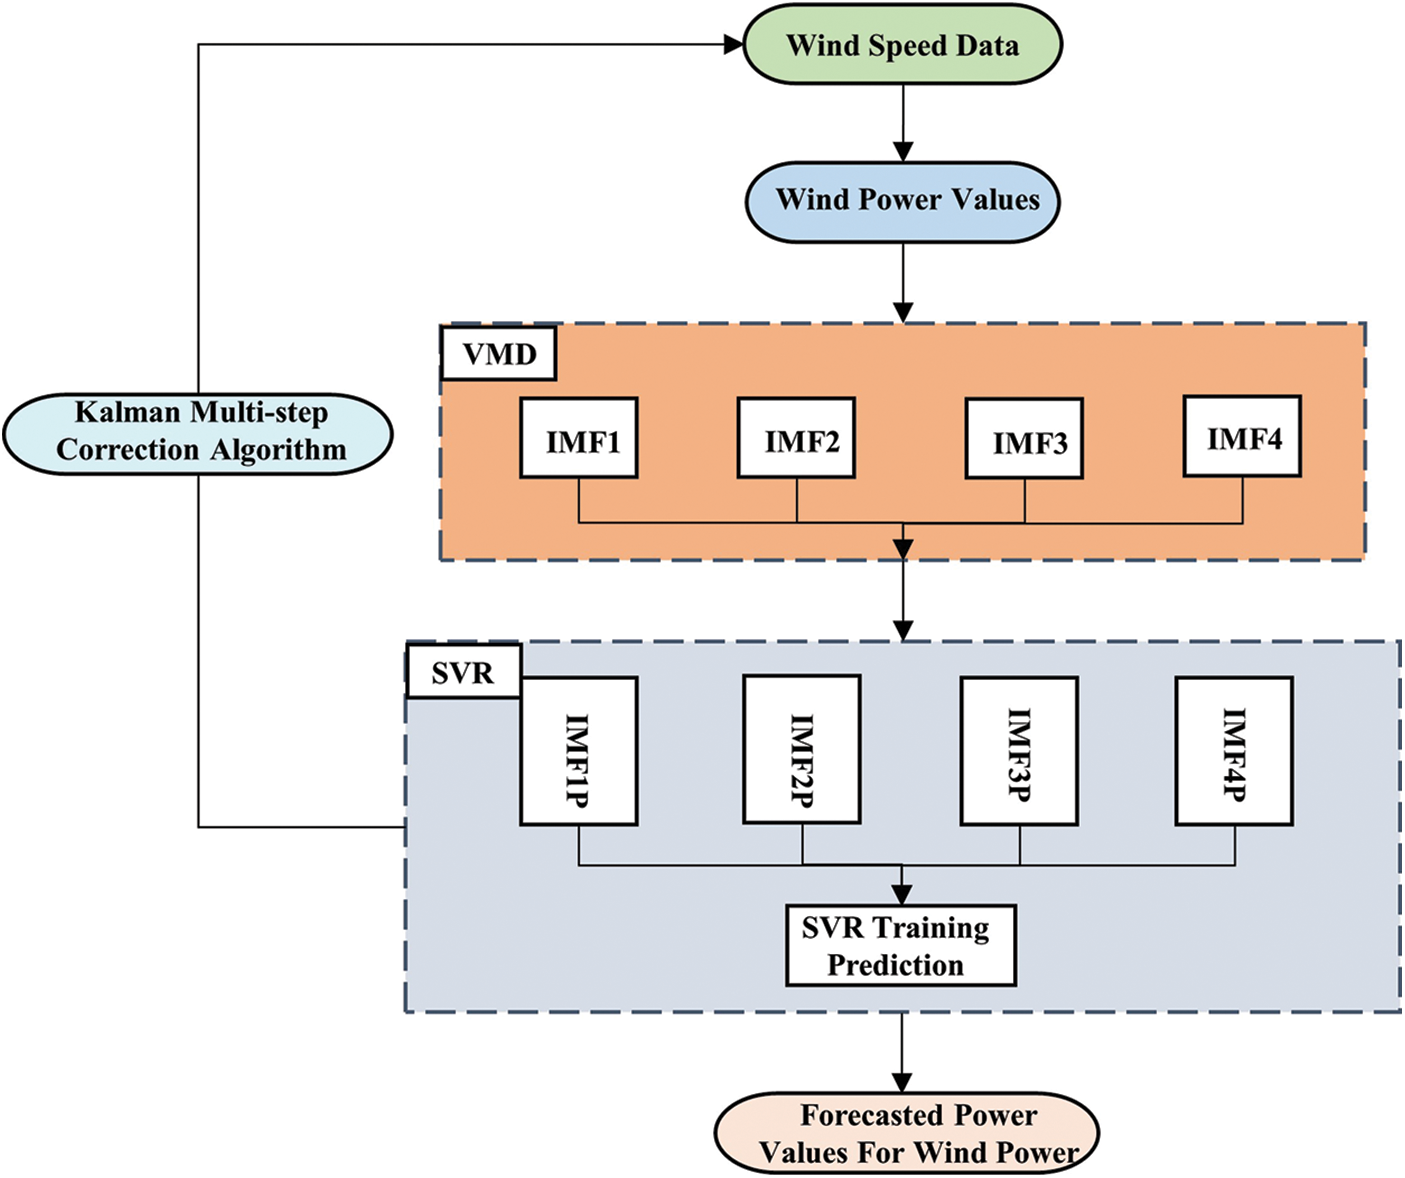
Figure 2: Kalman-VMD-SVR prediction algorithm
4 Optimization of Hydrogen Storage Prediction Strategies
The hydrogen storage system forecast control strategy utilizes the forecasting of wind power in the very short term results in the previous section to regulate the hydrogen storage system output and combines the planned wind power generation and the actual wind power output to regulate the hydrogen storage system charging and discharging status in the next 4 h, with a 10-min updating cycle, and the hydrogen storage system forecast rolling prediction schematic is Fig. 3.
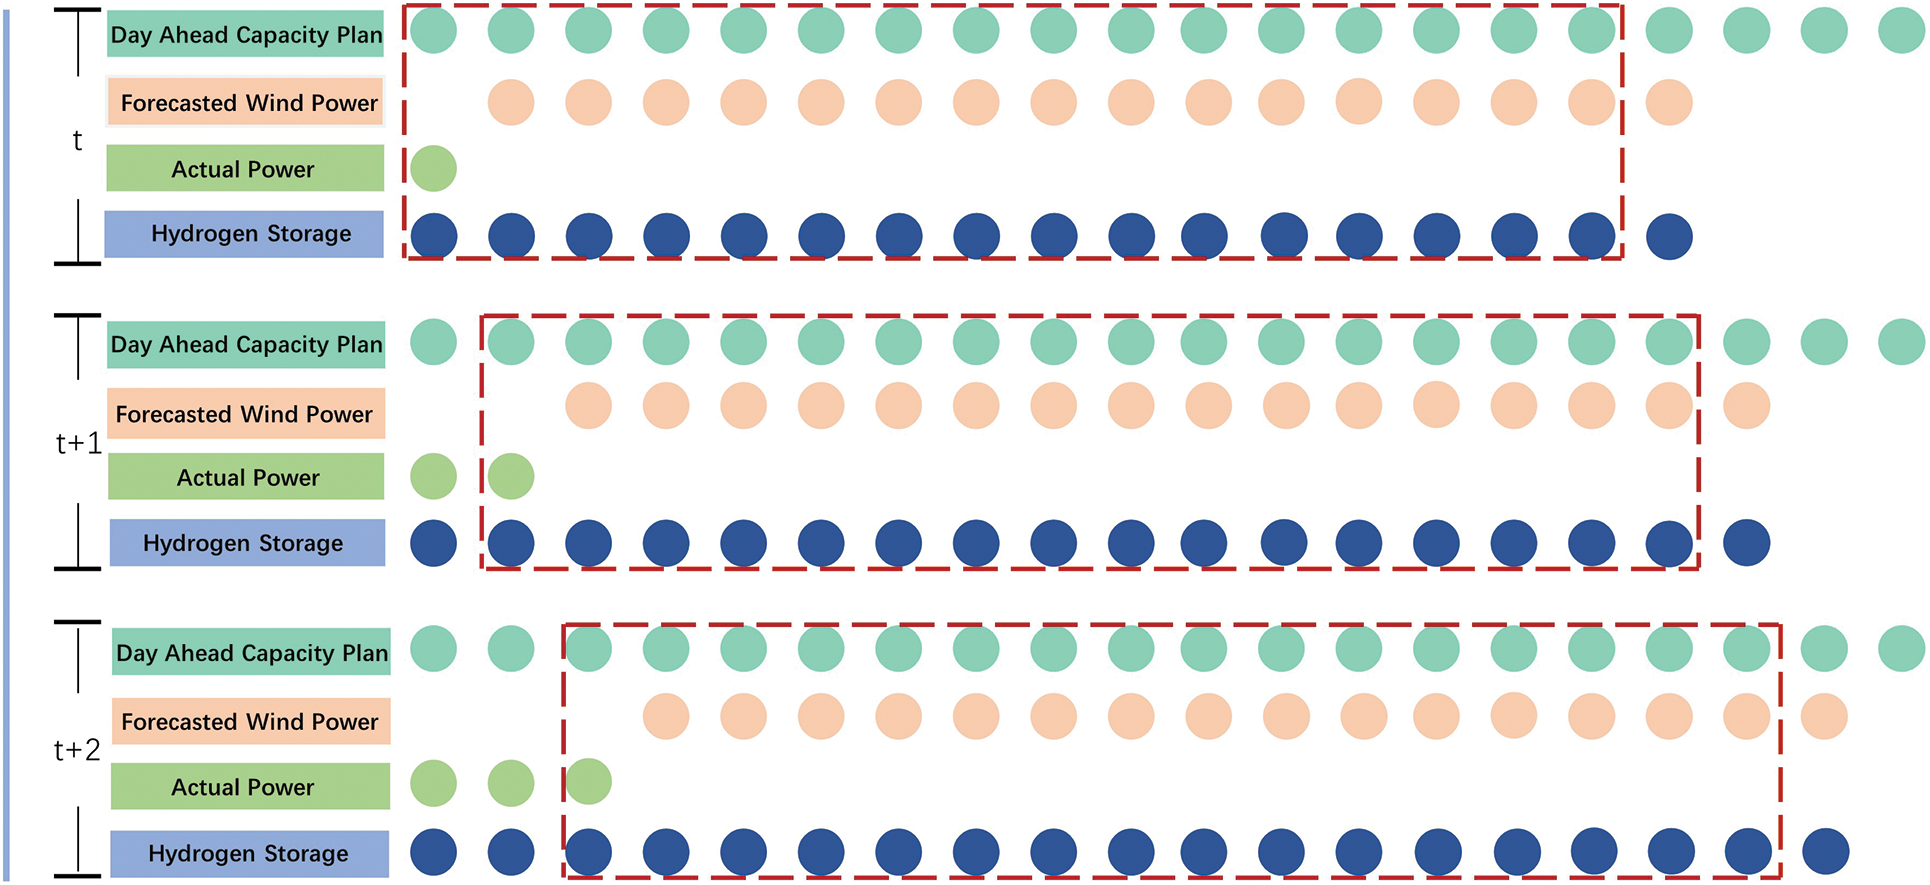
Figure 3: Rolling iterative diagram of predictive control strategy
4.1 Compound Weighted Objective Function
The predictive control strategy objective function consists of wind power prediction and tracking ability, hydrogen energy storage to regulate the output power, and smoothing wind power fluctuations. When the output power exceeds the maximum limit value, a penalty function is added to correct the original function to smooth the wind power output, and the adaptive parameter optimization algorithm is used to solve the system parameters of the above objective function.
4.1.1 Tracking Function for Wind Power Prediction
The actual output power of wind power, the ultra-short-term predicted power after regulation by the hydrogen storage system, and the planned output power of wind power to do the difference, when the difference crosses the limit, in the original function based on the addition of a penalty function to mitigate fluctuations in wind power generation power fluctuations.
In the above equation, u refers to the step function,
4.1.2 Smoothing Power Fluctuation Function
When the wind power output power exceeds the limit, a penalty function needs to be added to the limit to smooth the output power, and the objective function is mainly based on the wind-hydrogen coupled system output at the previous moment and the results to determine whether to add a penalty function.
Determination of the limit point should be combined with the corresponding wind power fluctuation indicator, and the current moment of the wind power fluctuation indicator is used to decide whether to add a penalty function at this moment. Wind power generation is permitted to fluctuate in a small range as follows:
(1) The power overrun sum means the sum of the differences between the wind power amplitude and the limit point at two adjacent moments.
The formula is as follows:
(2) The power fluctuation overrun probability refers to the ratio of the wind power overrun time to the total sampling time with the following formula:
In the above equation, S takes the value 1 when a is greater than 0 and 0 when a is less than or equal to 0.
4.1.3 SOH Predictive Control Function for Hydrogen Energy Storage Systems
The hydrogen storage system is analyzed based on the current moment of output and the SOH inside the hydrogen storage system in the short-term time, and when the SOH is over the limit, then a penalty function is added to limit over the limit.
The above equation
Considering the above family of objective functions with an added penalty function, the weighted objective function based on adaptive parameters is established as follows:
The power constraints for the hydrogen production electrolyzer are as follows:
Filling limit constraints for hydrogen storage units
Hydrogen storage unit venting limit constraints
Internal pressure limit constraints for hydrogen storage units
Fuel cell operating limit constraints
The above formula,
4.2 Optimization Strategy for Hydrogen Storage Interval Segmentation
According to the relevant wind power prediction and grid coordination operation implementation rules, the error constraints of wind power forecasting are stipulated, according to which the SOH of the hydrogen storage state and the ultra-short-term momentary power prediction are divided into intervals, and the optimization and control strategy of hydrogen storage is formulated.
(1) Ultra-short-term forecast power interval division
Ultra-short-term power needs to be divided by considering the ultra-short-term forecast power error constraining the wind power day-ahead planned output.
The above formula,
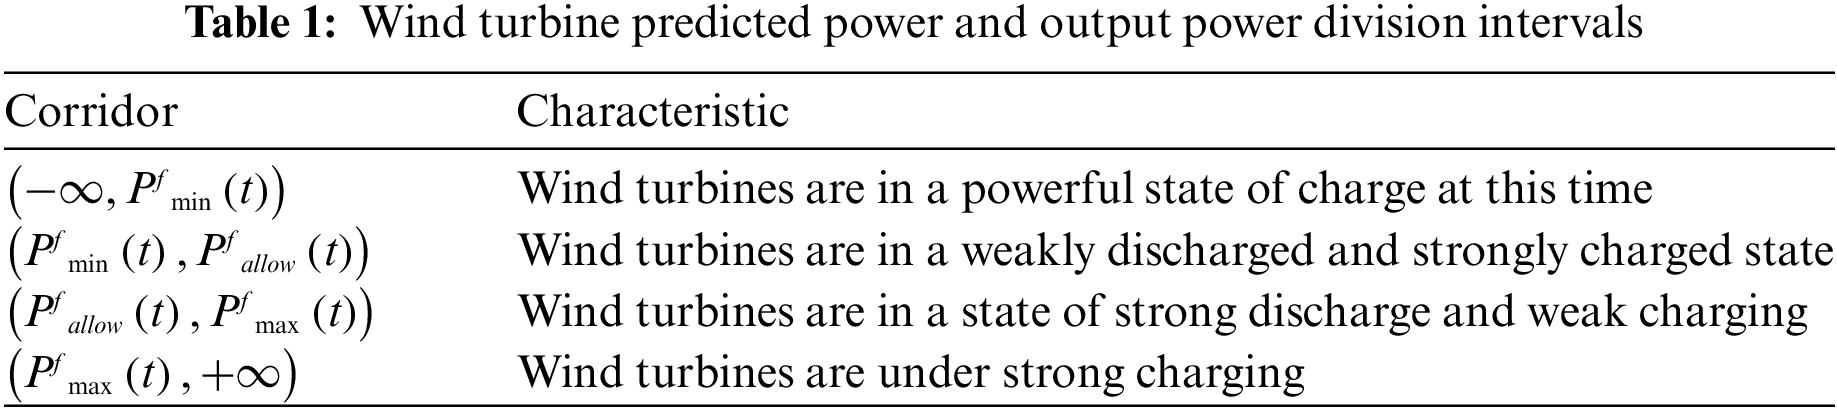
According to the above division interval can be divided into four intervals of wind power prediction power, the nature of the interval is Table 1.
(2) Segmentation of SOH zones for hydrogen energy storage
The hydrogen energy storage SOH consists of five intervals, namely
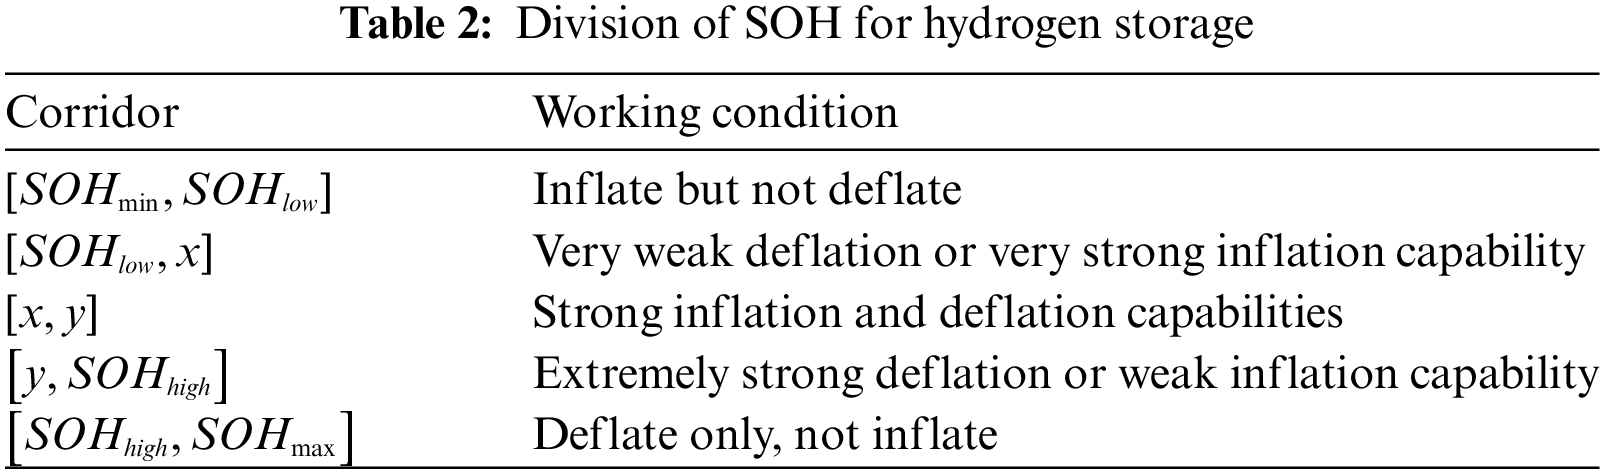
x,y is the control coefficient of the energy storage state interval, which satisfies 0.2 < x < y < 0.9, when the control coefficient is larger, it will improve the charging ability of the energy storage system, but will reduce the discharging ability, initially x = 0.5,y = 0.6.
The m,n in the next section are the control coefficients after adaptive rolling optimization.
(3) Hydrogen storage regulation strategy
According to the above wind power prediction power interval division of the hydrogen storage system and fuel cell system of the respective power to regulate, the development of predictive hydrogen storage control strategy, hydrogen storage system to the outside of the power discharge that is negative, to the inside of the absorption of electricity that is positive, according to the results of the ultra-short-term wind power prediction to regulate hydrogen storage regulating system operating state.
When the ultra-short-term wind power forecast power is at
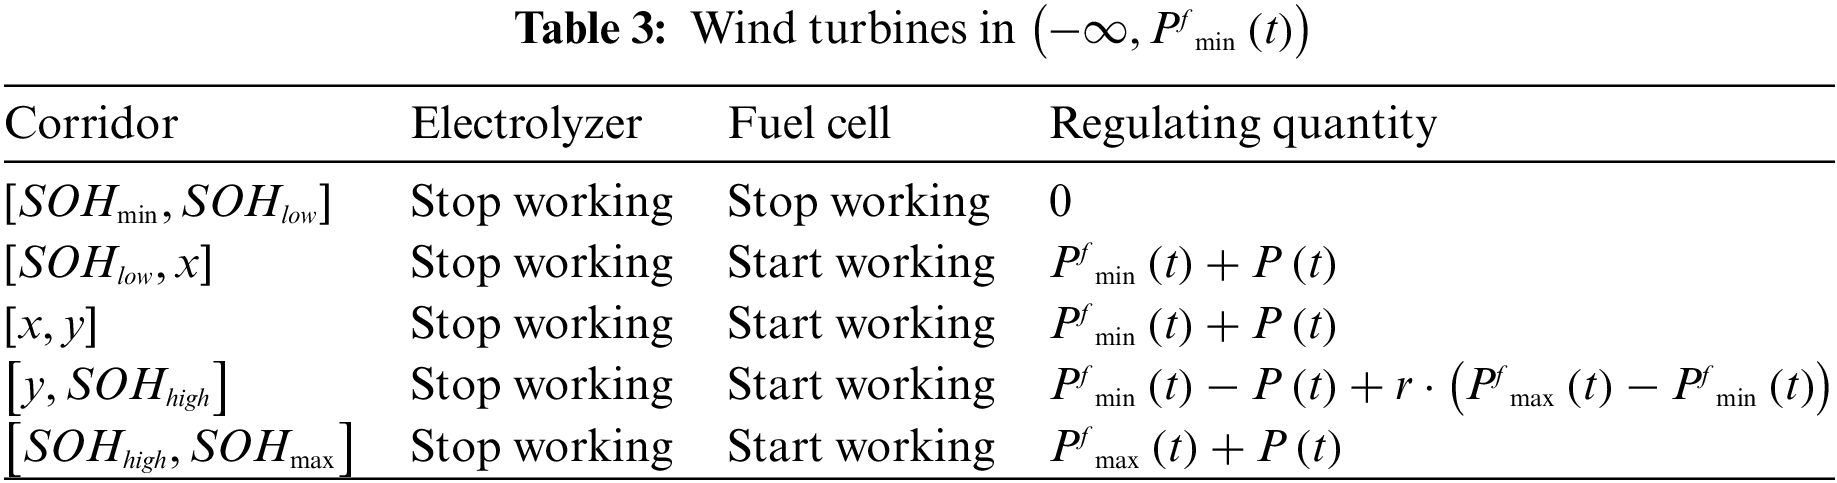
When the ultra-short-term wind power forecast power is at
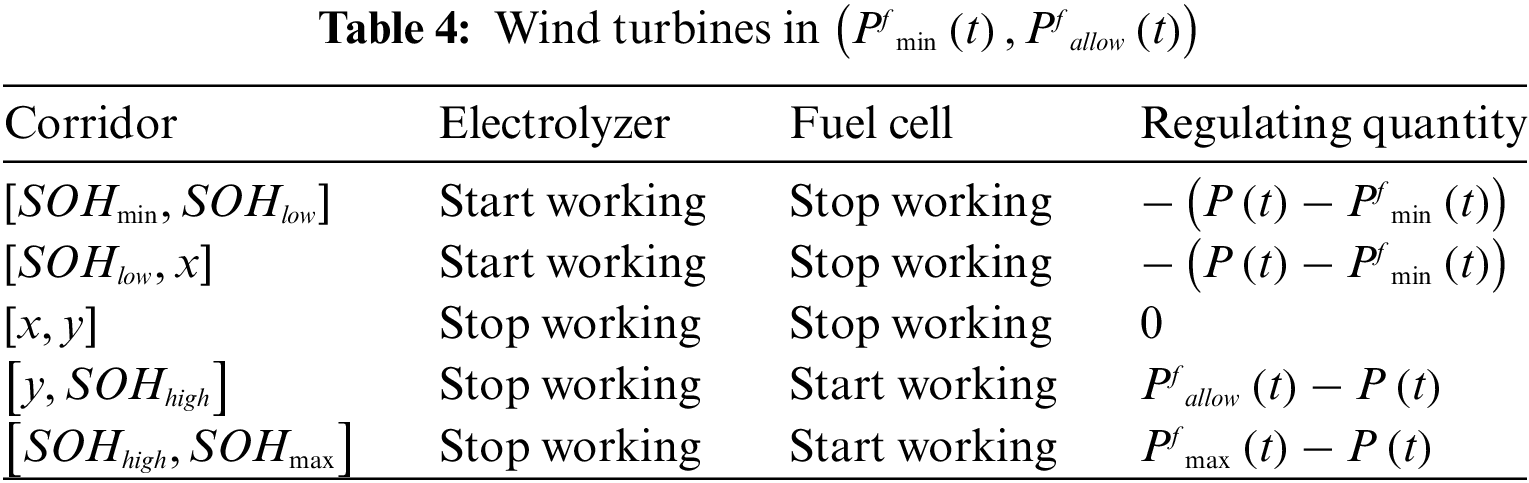
When the wind power output power is located at
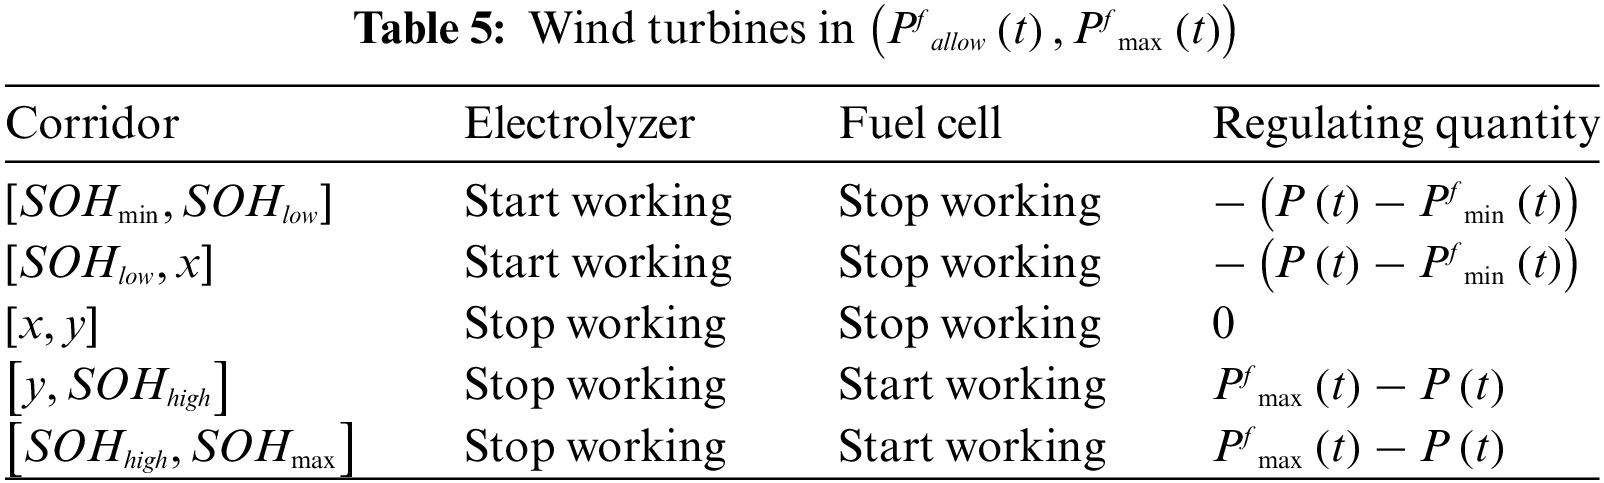
When the wind power output power is at
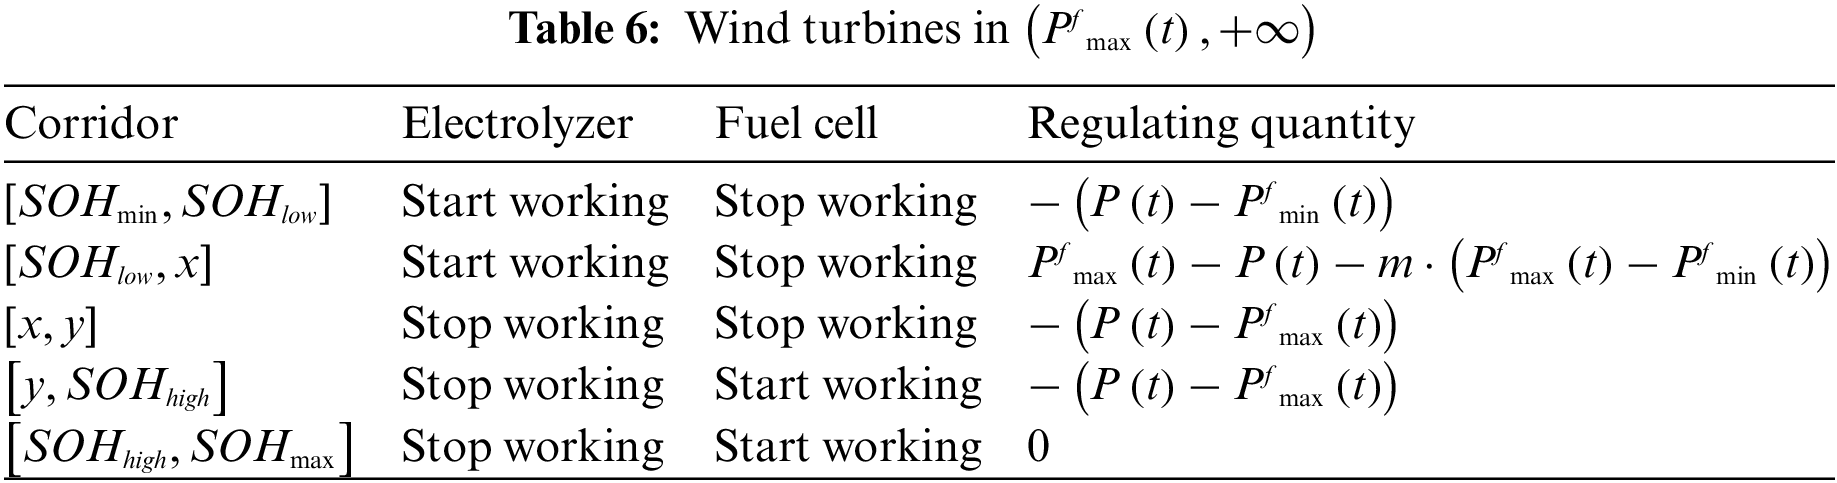
The above hydrogen storage regulation control strategy is shown in Fig. 4.
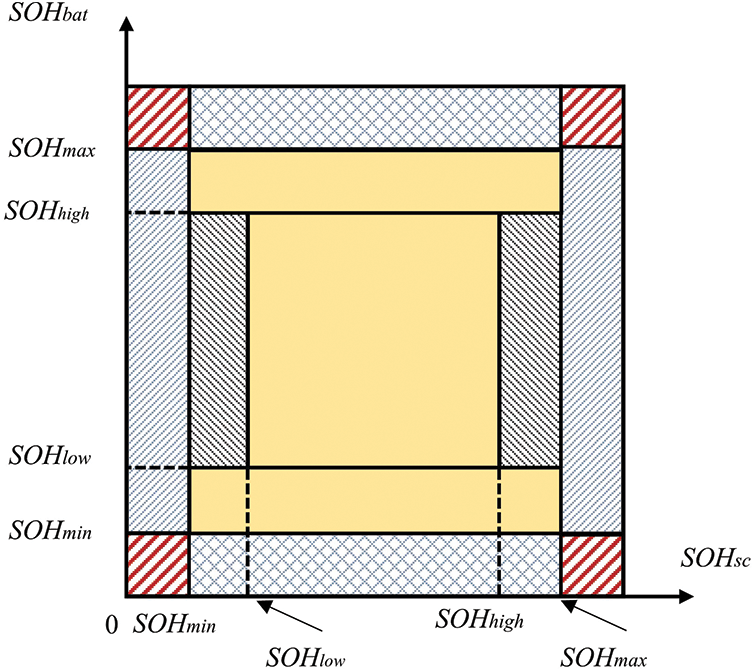
Figure 4: Hydrogen energy state partitioning map
4.3 Adaptive Parameter Optimization Algorithm
4.3.1 Determination of Adaptive Target Coefficient Weights
Currently, the objective function weight coefficients are determined by custom methods, but when the wind-hydrogen coupling system power plan changes, the weight coefficients can not be updated in time thus affecting the optimization accuracy. In the particle swarm optimization (PSO) algorithm, the acceleration coefficient propels the particles toward the individual best (best) and global best (best) positions, and the distance of the particles to the Individual optimal position and global optimal solution has a great influence on the particle search rate, the previous weighting coefficients search algorithms only take into account the influence of time change factors, this algorithm will take the spatial factors into account and proposes a kind of adaptive weighting mechanism, which makes the acceleration coefficients continuously adjusted with the iteration.
The adaptive weight determination strategy is mainly to accelerate the speed of the particle to reach the optimal solution, and then greatly improve the search speed, this algorithm changes the weight coefficients according to the distance of the swimming particles to the global optimal solution and Individual optimal position, if the particles are far away from the Individual optimal position and the global optimal solution, the weight coefficients are taken to a larger value, to ensure the stability of the search to maintain the value of the weight coefficients in the range of a reasonable place.
Because of the unpredictable nature of wind power generation, the combined output of the wind-hydrogen system exhibits nonlinear variability, The trend of change coincides with the sigmoid function, so it is chosen to optimise the PSO algorithm using the sigmoid function. The adaptive update weighting function is used to illustrate the correlation between the nonlinearly varying acceleration coefficients and the distances of the particles to the Individual optimal position and the global optimal solution, and the change of acceleration in the previous moment should be adapted to the distance of the particles searched in the back, to ensure that the particles are close to the optimal point with a faster speed.
The adaptive weighted update function should firstly be guaranteed to be incremental and secondly, the update function is bounded and is incremental because the particles have to move quickly towards the optimal point. Secondly, due to the limitation of equipment working conditions, when the limit is about to be reached, the working rate will be slowed down, similar to the particles approaching the Individual optimal position and global optimal solution, when approaching the optimal point, the movement rate will be slowed down to avoid missing the optimal point, so to make the rate reach the optimal point, the finite velocity coefficient should be set.
The update function that satisfies the above two points is generally a step function and a sigmoid function. In this paper, the sigmoid function is used as the adaptive weight update function, the reason is firstly because the sigmoid function is monotonous and the s-curve can prevent the update function from undesired sudden changes of the weights, and lastly, the sigmoid function is smoother and differentiable, which can reflect to a great extent the change of the combined outputs, which can greatly reflect the variation of the combined output of the wind-hydrogen integrated system. The fitness deflation function is as follows:
The above equation is generally used to adjust and transform the fitness values of the particles,
The adaptive acceleration coefficient variation strategy is as follows:
The function
4.3.2 Adaptive Parameter Optimization Algorithm Framework
Aiming at the wind-hydrogen coupled system joint output is irregular and characterized by volatility. The adaptive weighting coefficient updating strategy is proposed to be combined with the particle swarm algorithm to improve the accuracy and speed of the group local search, and the particle position updating equations are as follows:
The above equation w is the inertia variable,
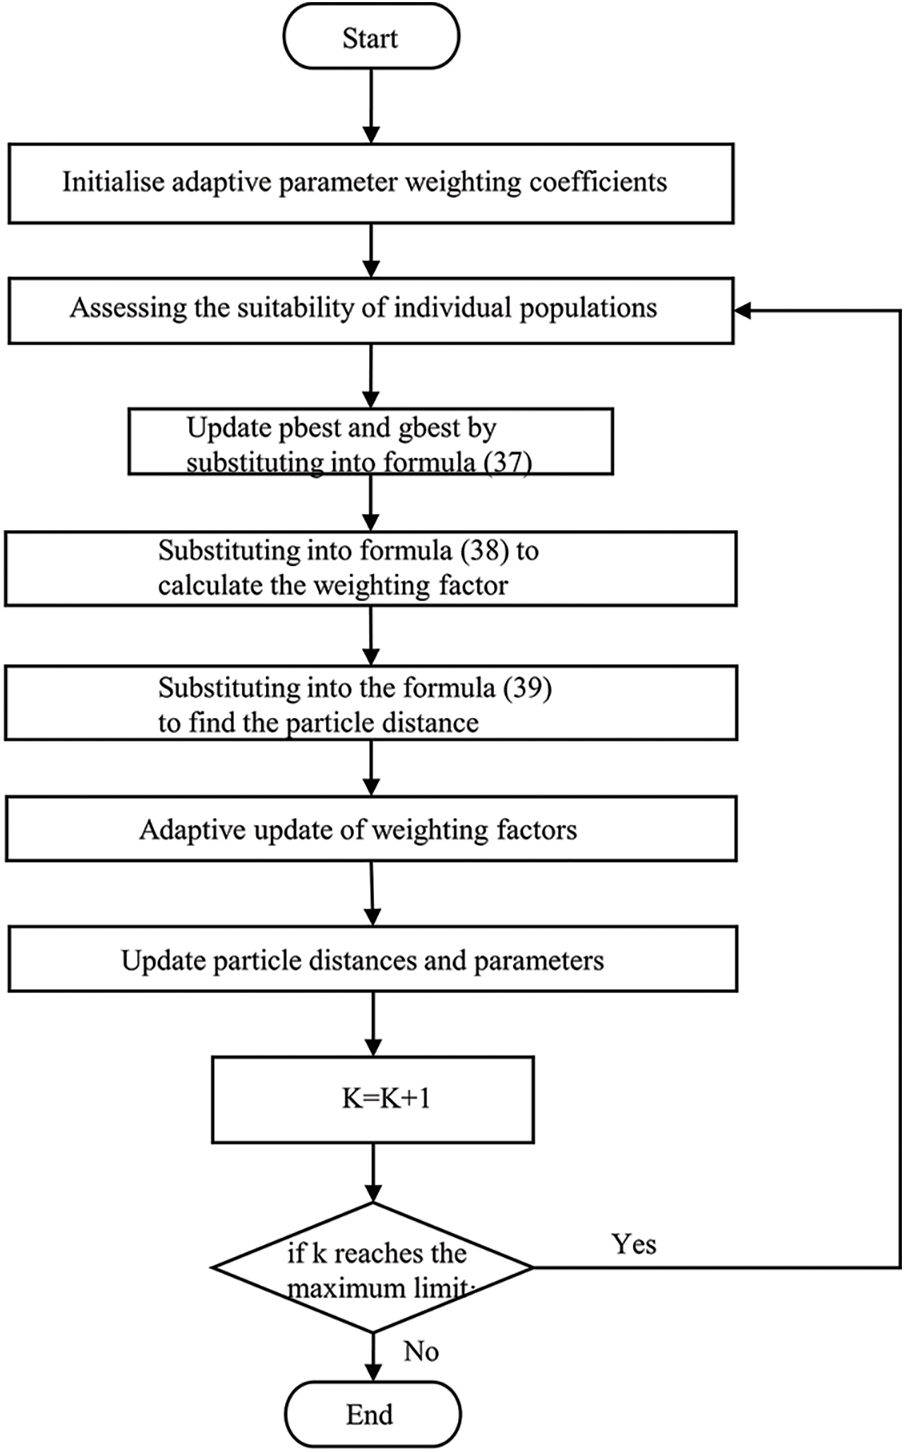
Figure 5: Flow chart of sigmoid-PSO algorithm
The parameters related to the hydrogen storage control strategy are also substituted into the adaptive parameter optimization algorithm for optimization, and the specific over-prediction control strategy can be described as Fig. 6.
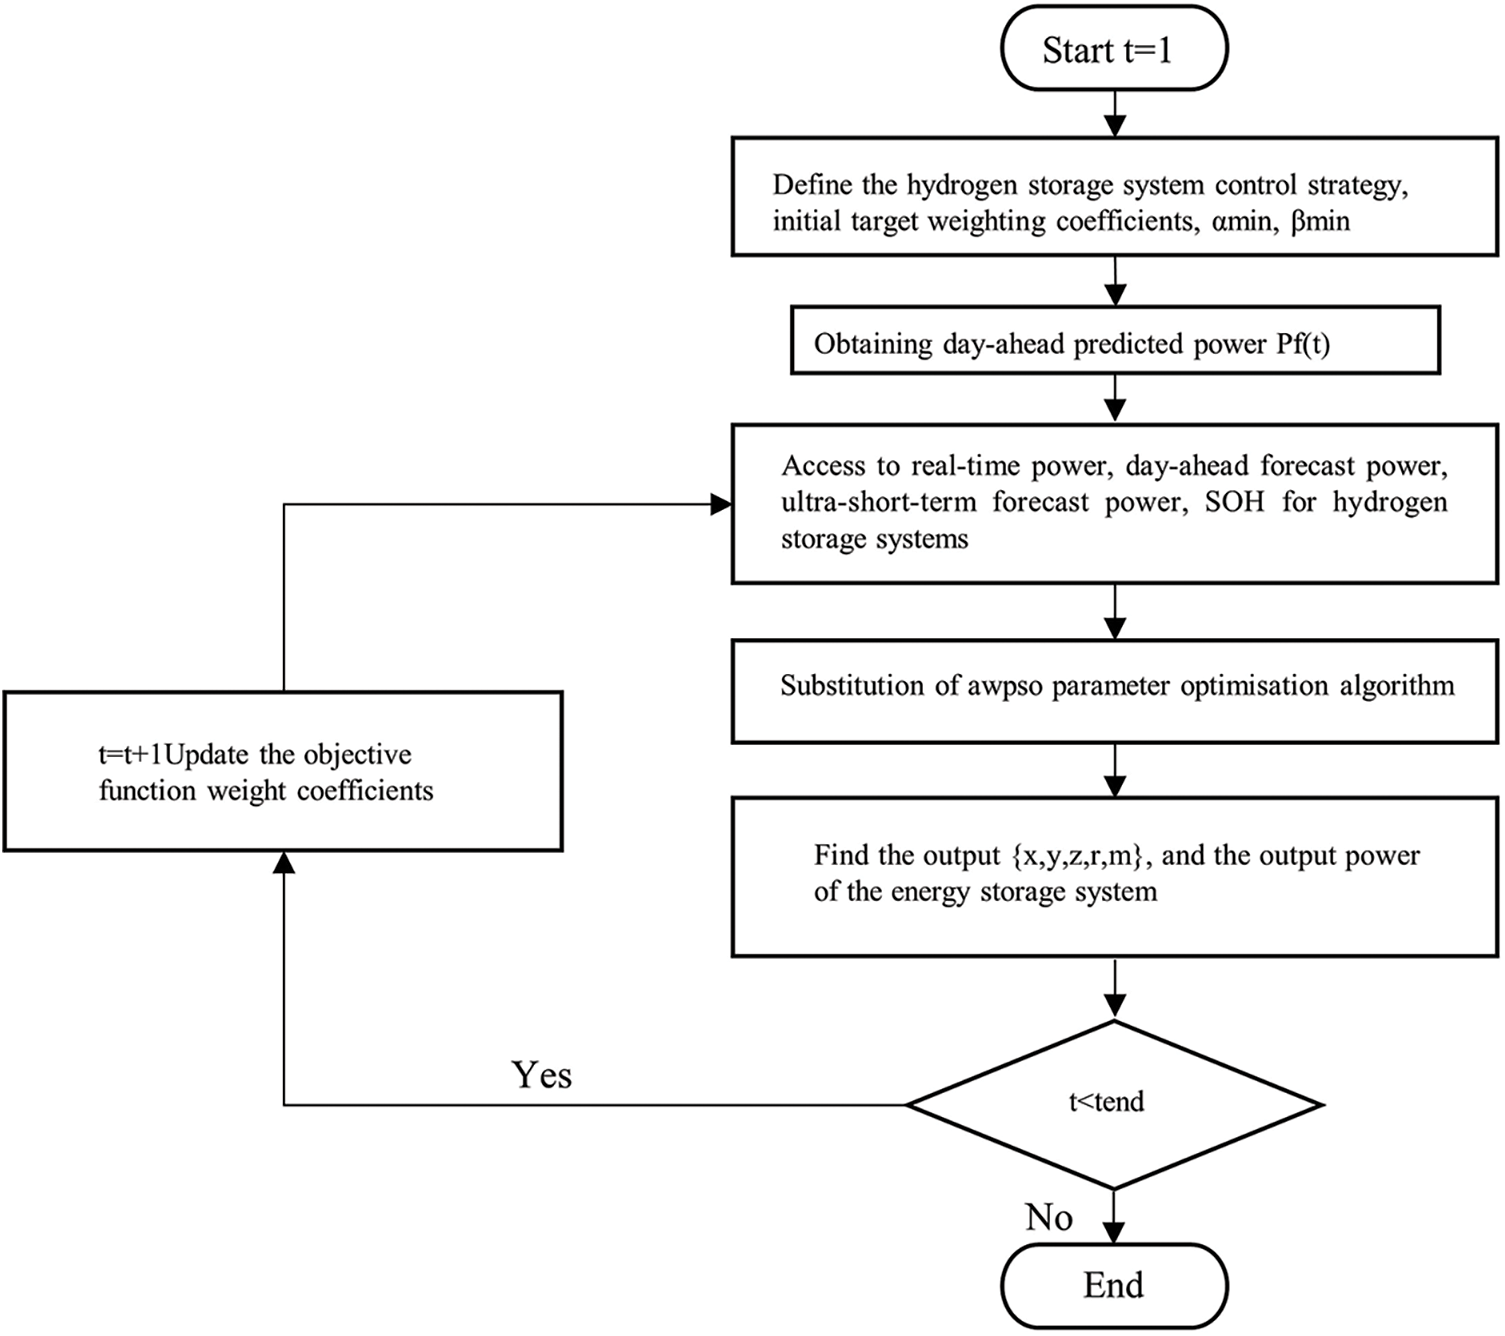
Figure 6: Flow chart of predictive control strategy
4.4 Evaluation Criteria for Predictive Control Strategies
Wind-hydrogen coupled power fluctuations can be expressed [28]:
In the above equation, the
The performance evaluation system for wind-hydrogen coupled system output is as follows [29,30]:
In the above equation, the
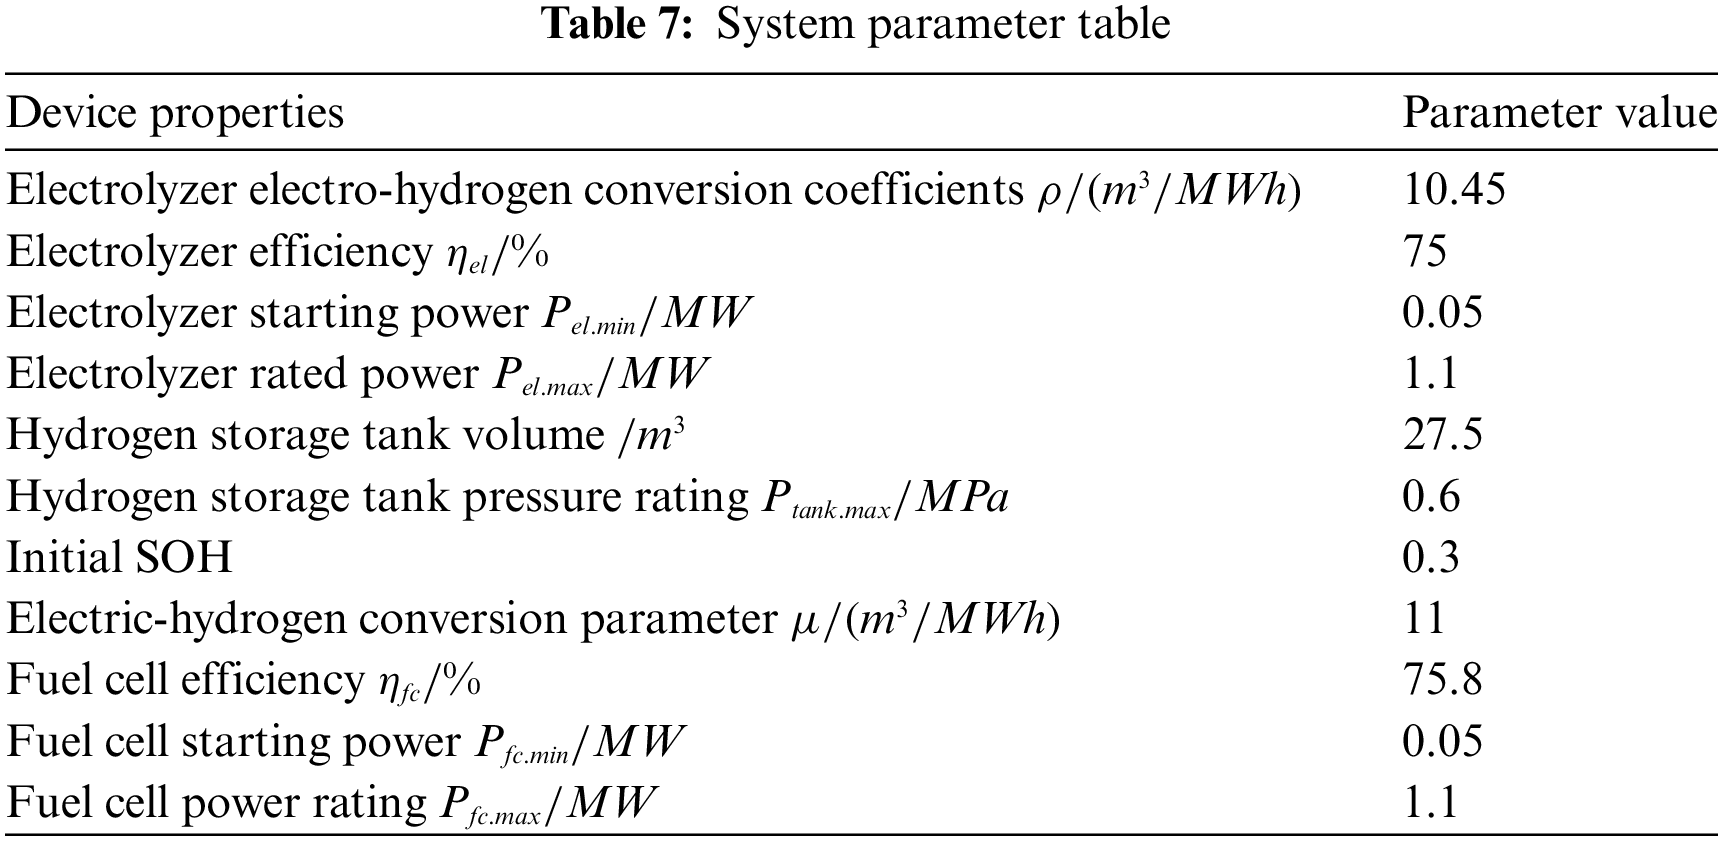
The calculation example selects the actual operating power of a 5.5 MW micro wind farm on a certain day, the short-term predicted power data, and performs numerical simulation based on Matlab to verify the energy storage control method proposed in this paper. For simplicity, the weight coefficients of the objective function were chosen in compromise as a1 = 0.5, a2 = 0.5, and a3 = 0.5, setting the power of electrolyzers and fuel cells by the ratio of energy storage power to wind power at 5:1. The sampling interval is set at 15 min, a total of 120 sampling points, the ultra-short-term prediction of the power as the power plan, to regulate the charging and discharging regulation of the hydrogen storage system, and the parameters of the relevant equipment are as follows in Table 7.
According to the proposed Kalman-VMD-SVR algorithm to get the ultra-short-term wind power prediction results corresponding to the sampling points based on the Actual wind power output power, the generated values of the generator are obtained by overlaying the output values of the SVR predictions in a weighted manner, the decomposed IMFS subsequence and the reconstructed power prediction results are shown in Figs. 7 and 8.
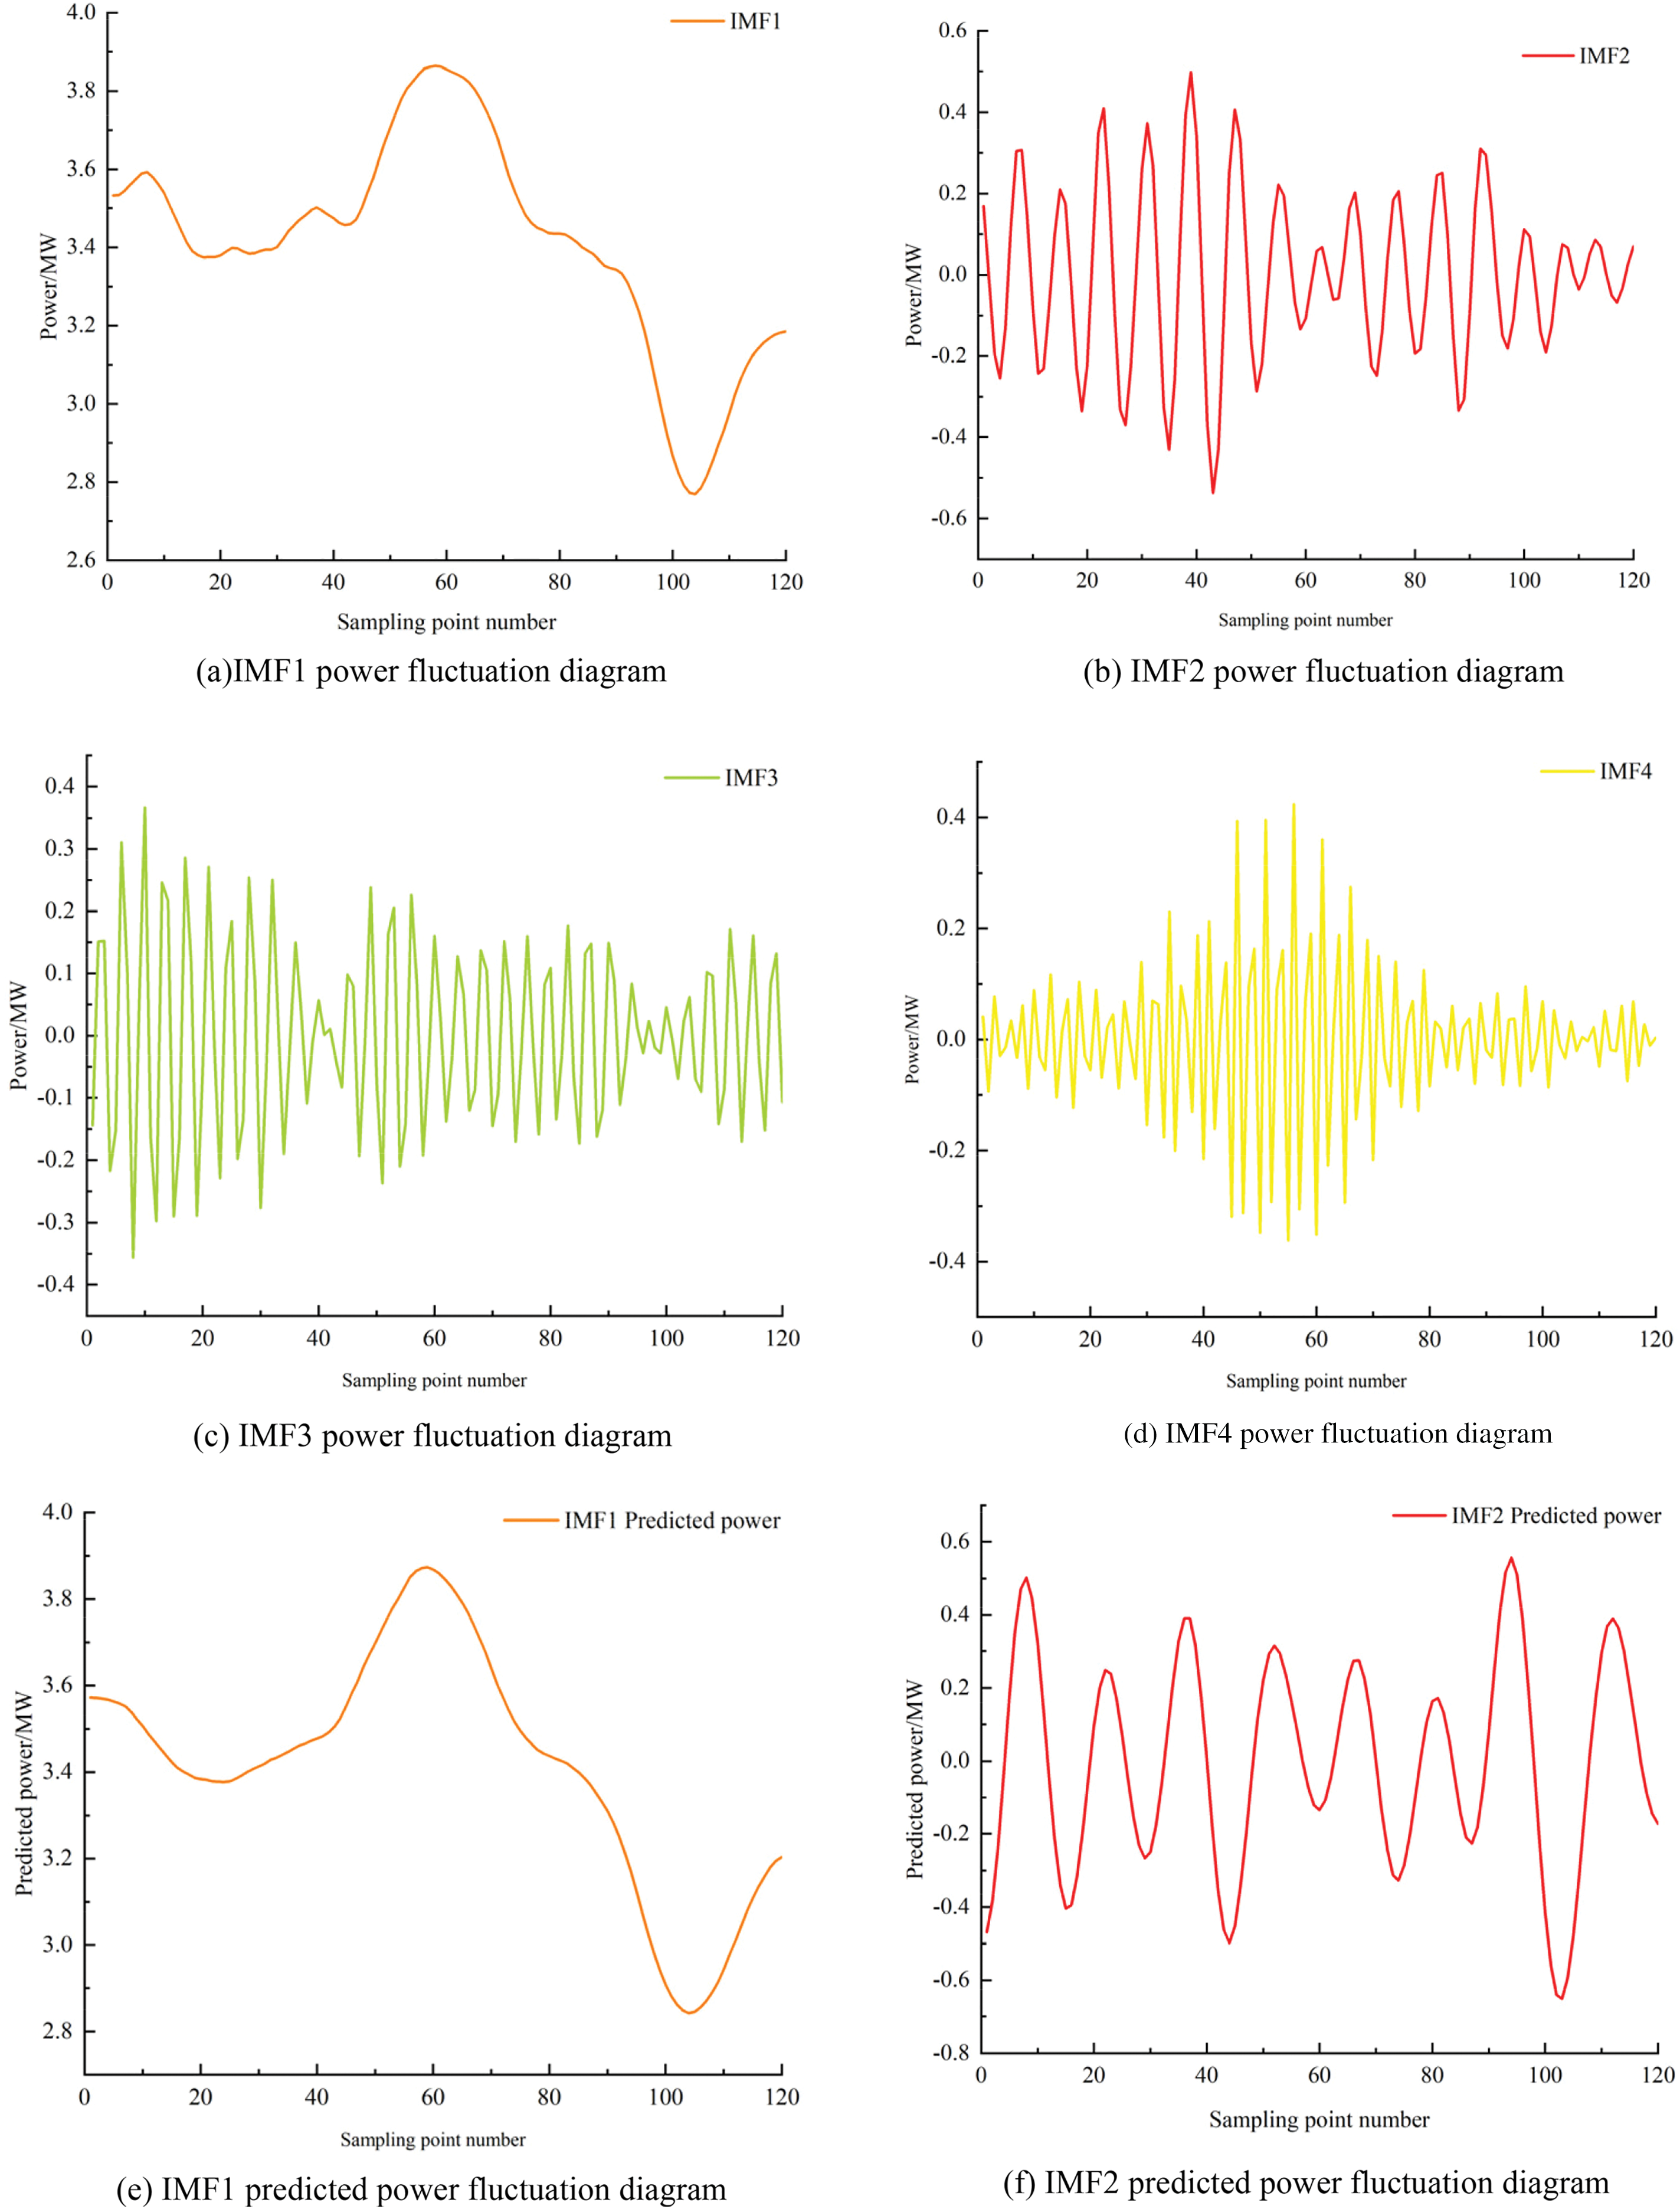
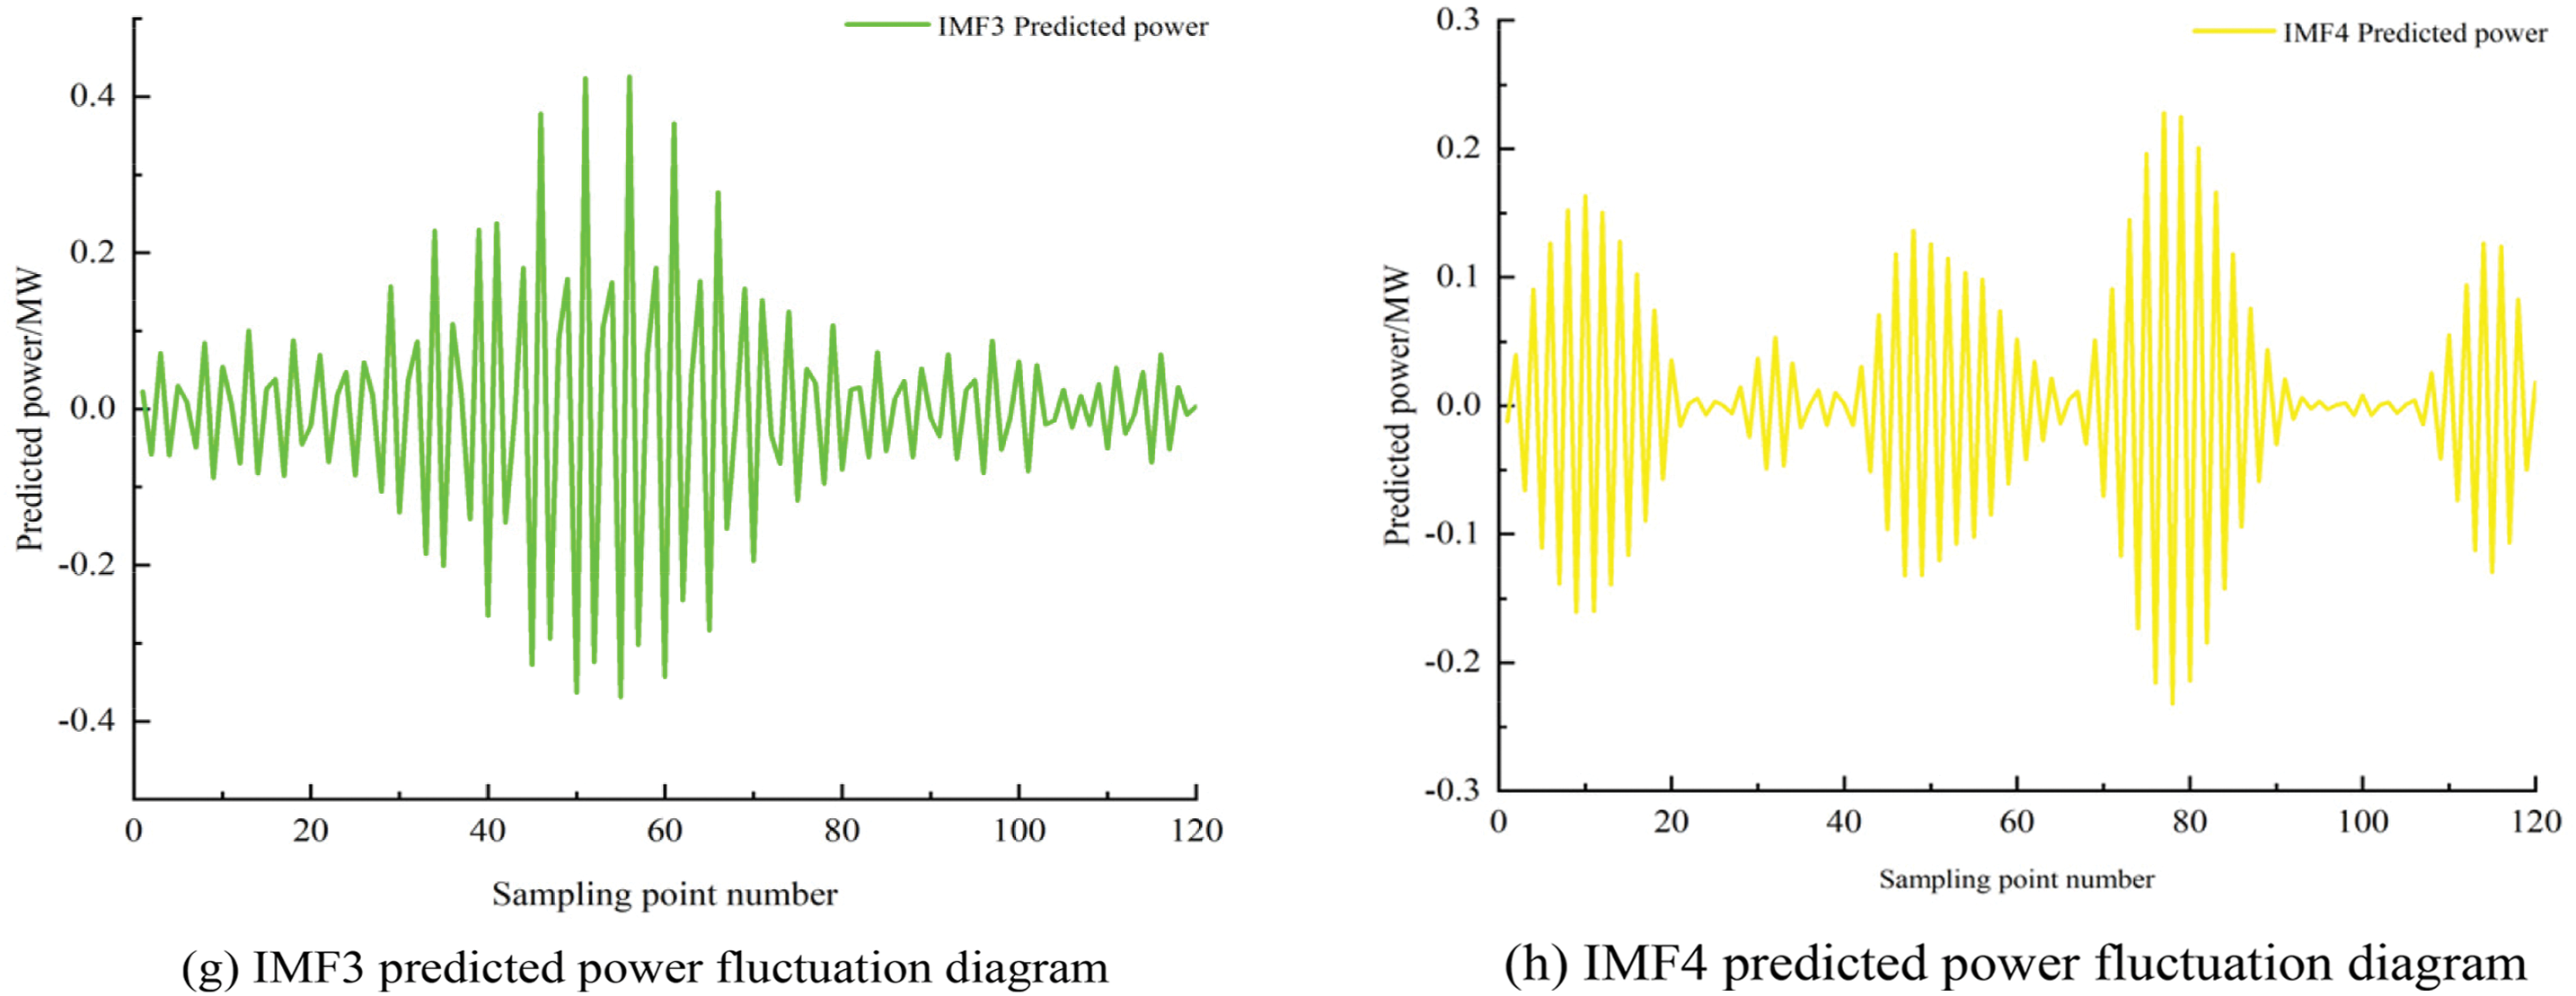
Figure 7: VMD decomposition reconstruction prediction map
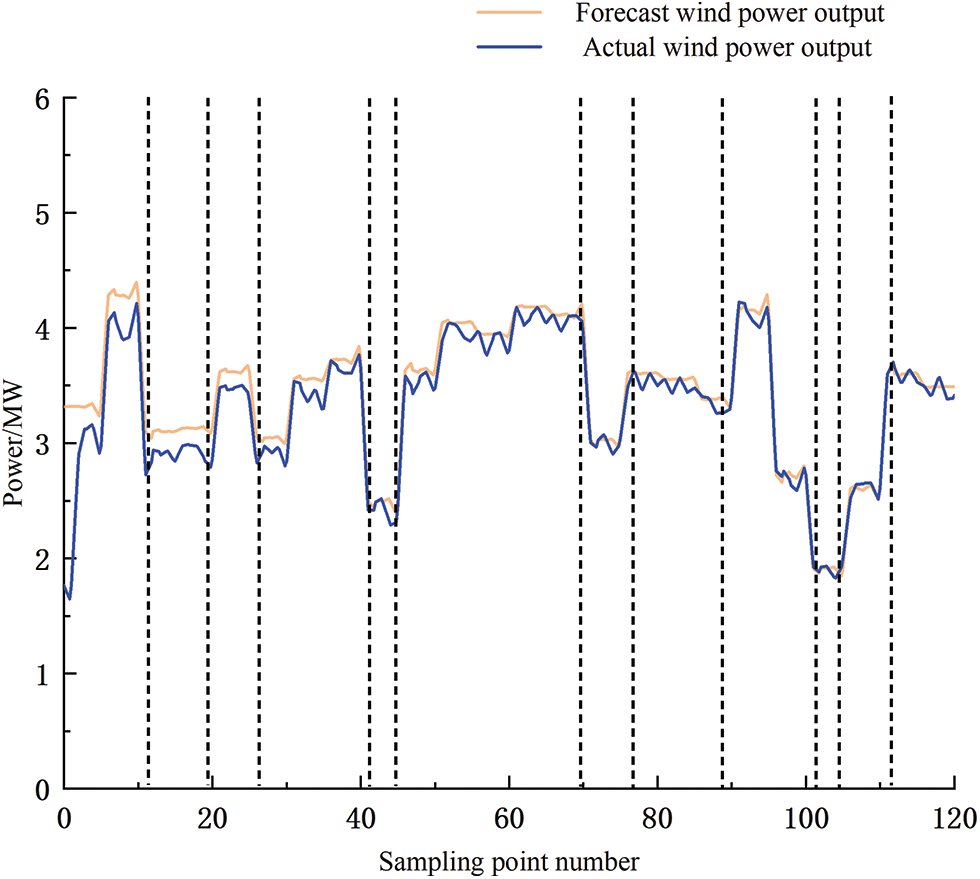
Figure 8: Kalman-VMD-SVR ultra-short-term wind power forecasting
As can be seen from Fig. 9, some sampling points do not meet the conditions of the selected wind turbine’s output power period prediction error, a large prediction error will affect the regulation ability of the energy storage system, and is easy to cause the phenomenon of wind abandonment, the energy storage system can limit the prediction error, smoothing the output power of wind power, and enhance the ability of the wind power to track the output power.
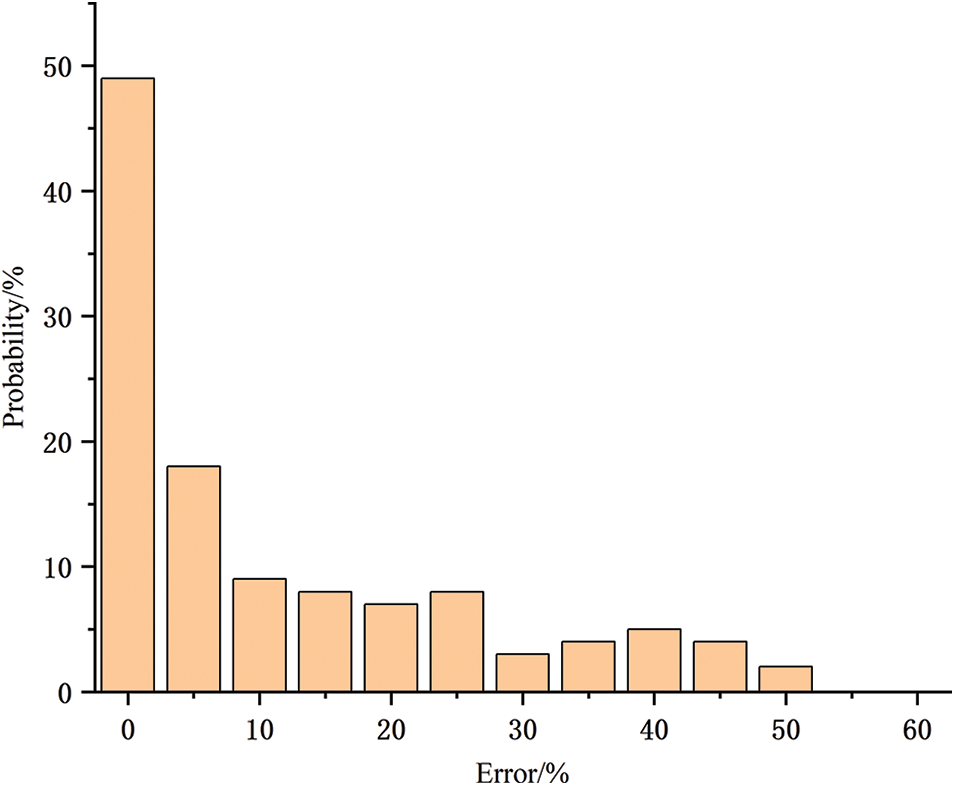
Figure 9: Histogram of the probability distribution of daily prediction errors for wind turbines
The ultra-short-term predicted wind power values are introduced into the over-the-top hydrogen storage control strategy, and the working conditions of the electrolyzer SOH, fuel cell, and electrolyzer are shown in Figs. 10–12.
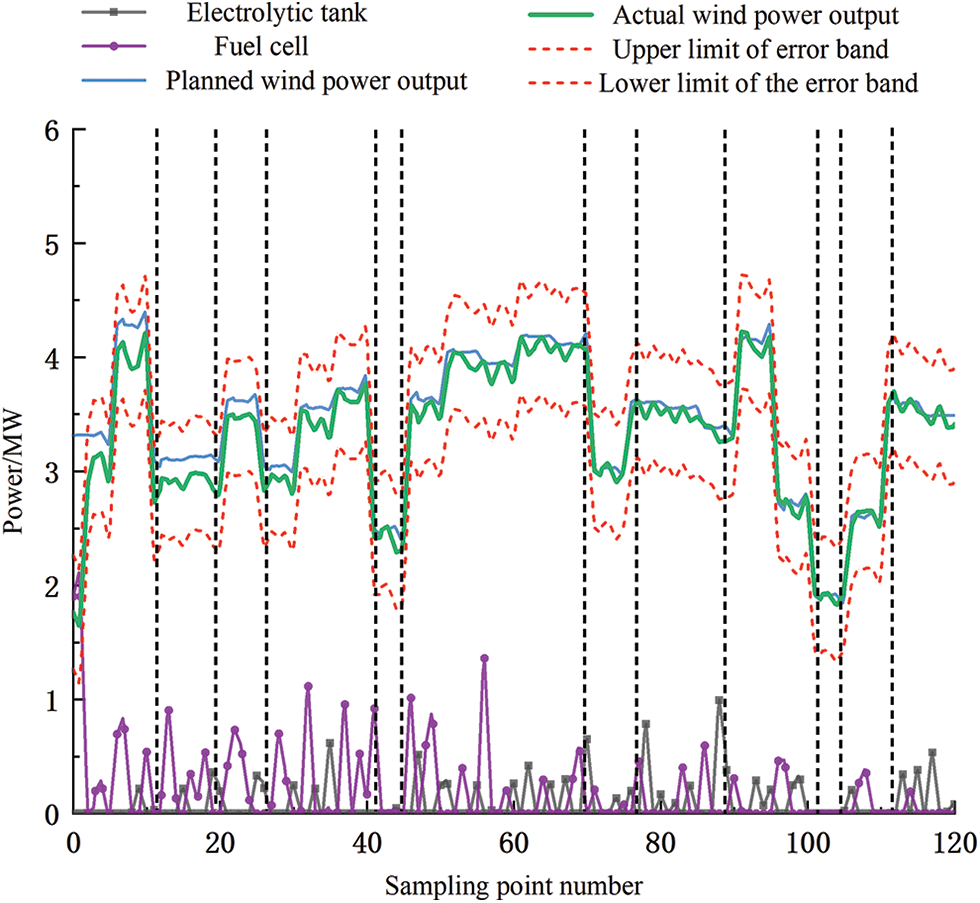
Figure 10: Electrolyzer and fuel cell output diagram under overrun control strategy
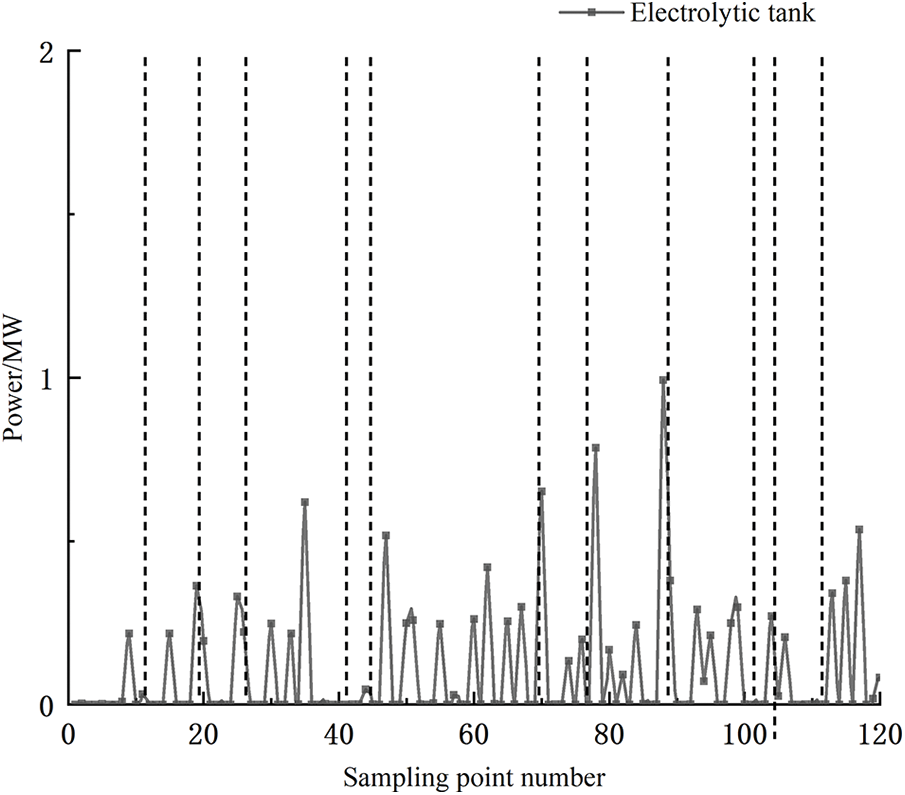
Figure 11: Electrolytic tank power state diagram
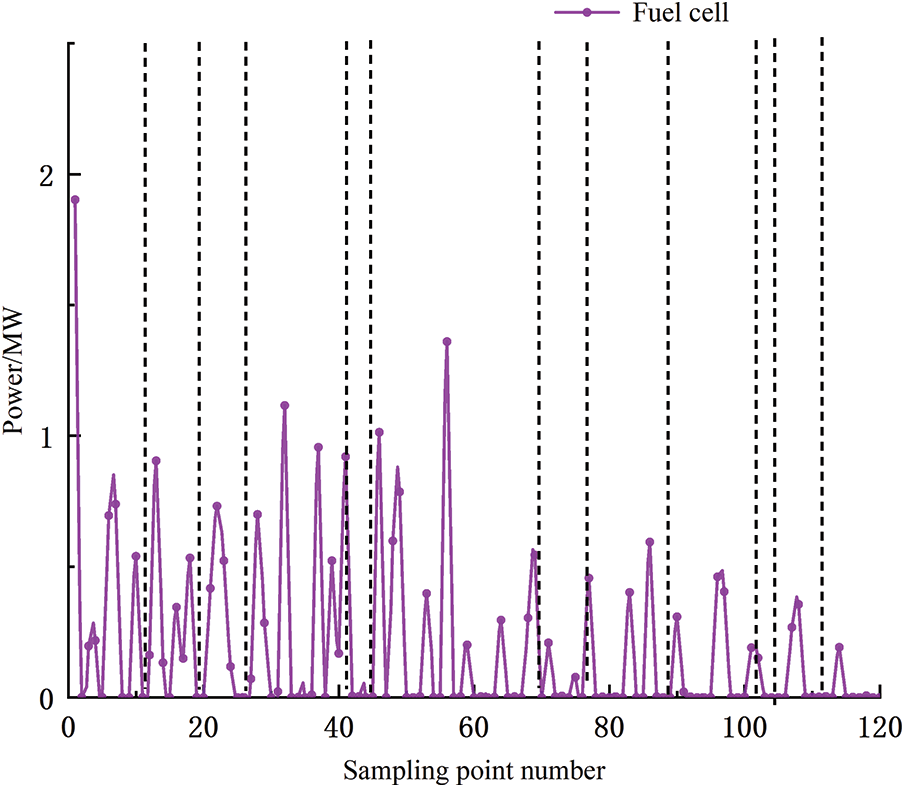
Figure 12: Fuel cell power state diagram
The sampling intervals [41,43], [72,77], [100,103] in Fig. 8 correspond to the SOH intervals of the hydrogen storage tanks in Fig. 9, when the hydrogen storage system is almost not involved in the regulation, and the electrolyzer, as well as the fuel cell, almost stops its working condition.
(1) In the [0,12] interval, the wind power output climbs, the hydrogen storage system has a strong charging capacity, the electrolyzer starts to work, and the SOH of the hydrogen storage tank rises.
(2) In the interval [13,26], the wind power output first decreases, then increases slightly, and then decreases to the original level, and the charging capacity of the electrolyzer and hydrogen storage tank SOH first remains stable and then follows the wind power output.
(3) In the interval [27,40], the wind power output gradient rises, the hydrogen storage charging capacity rises, the hydrogen production capacity of the electrolyzer increases, and the SOH of the hydrogen storage tank rises.
(4) In the interval [44,71], the wind power continues to rise, but at sampling point 58, the hydrogen production capacity of the electrolyzer decreases in comparison with the limit value due to the working condition of the hydrogen storage tank, and the fuel cell discharge capacity is increased to consume hydrogen from the tank, and after a duration, the hydrogen production capacity of the electrolyzer is gradually restored, and the SOH value gradually rises.
(5) In the interval [78,90], the wind power output decreases slowly, the hydrogen storage charging capacity decreases, the hydrogen production capacity of the electrolyzer decreases, and the SOH also decreases gradually.
(6) In the [91,99] interval, wind power output rises rapidly and then falls sharply, the hydrogen storage system has an extremely strong discharge capacity, the fuel cell starts, and SOH falls.
(7) In the interval [104,112], the wind power output rises, the charging capacity of the hydrogen storage system increases, the hydrogen production capacity of the electrolyzer increases, and the SOH of the hydrogen storage tube rises.
(8) In the interval [112,120], the wind power output slowly decreases, the hydrogen storage discharge capacity slowly increases, and SOH gradually decreases.
After solving the real-time control strategy as well as the over-advance control strategy, the integrated wind-hydrogen system output, the actual wind power output, and the planned wind power output are shown in the following diagrams, Figs. 13 and 14 show that the over-advance control strategy responds faster than the real-time control strategy, and for the sudden change of the wind power, it can make the adjustment of the power quickly, and the SOH of the real-time control strategy, under the premise of meeting the power requirements, the SOH will reach the regulated output limit and does not have hydrogen storage charge/discharge capability, whereas the overrun control strategy does not blindly make adjustments based on the maximum absorbed power, but rather adjusts from a global perspective based on the developed weighted target function number.
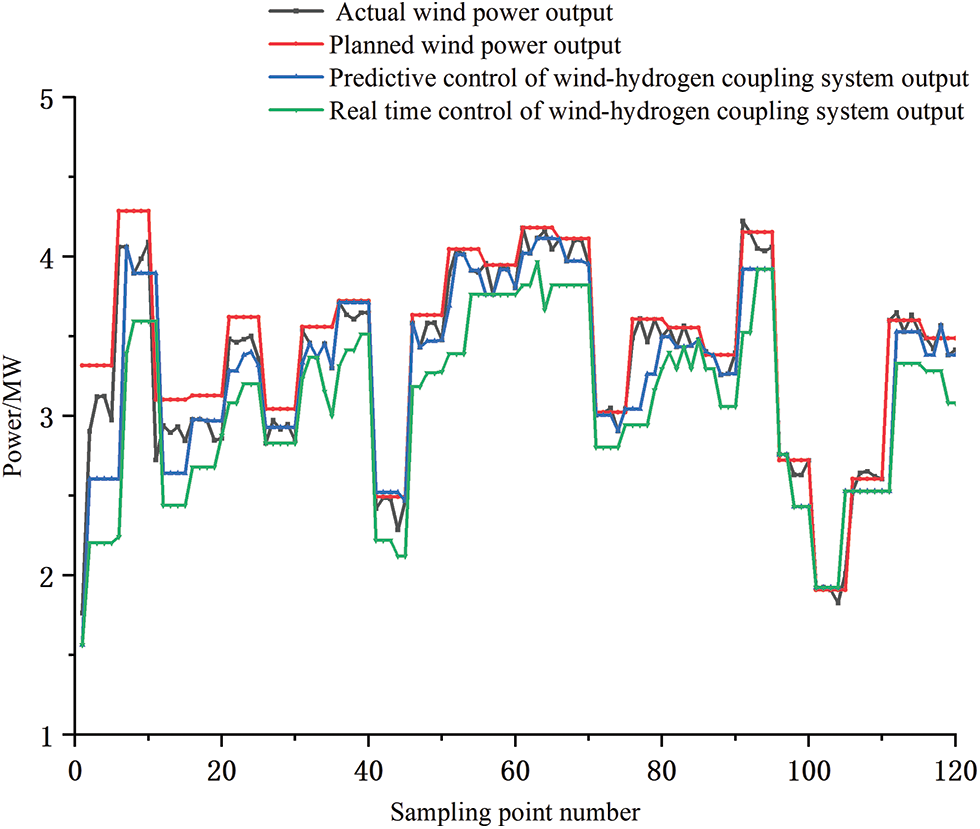
Figure 13: Comparison of the output of the two control strategies
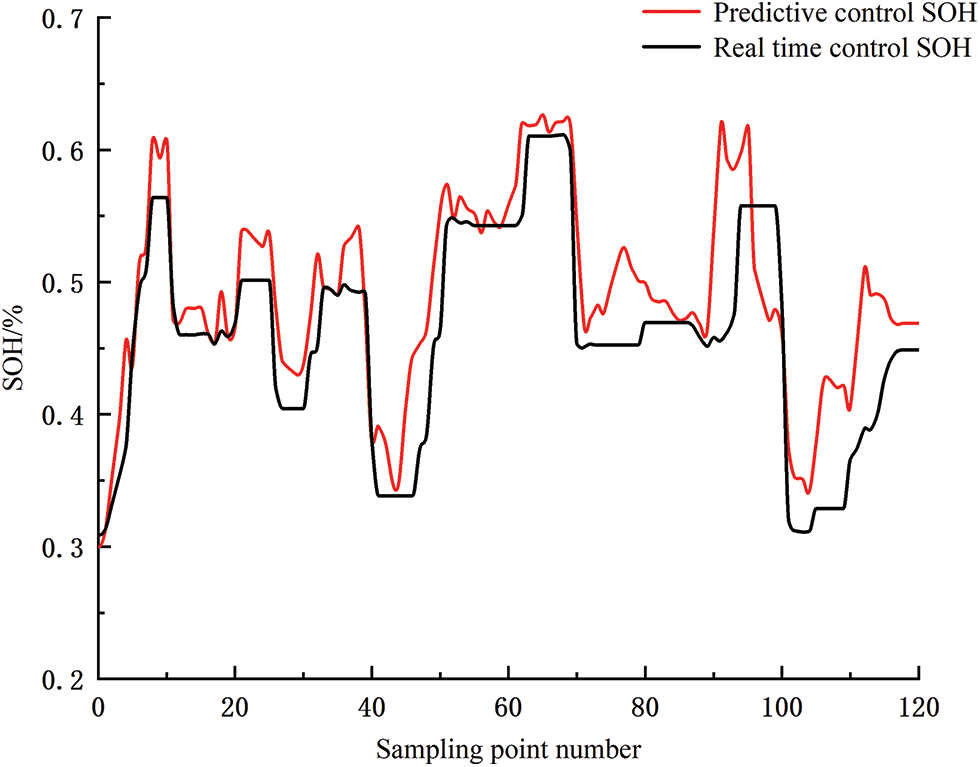
Figure 14: SOH trend chart
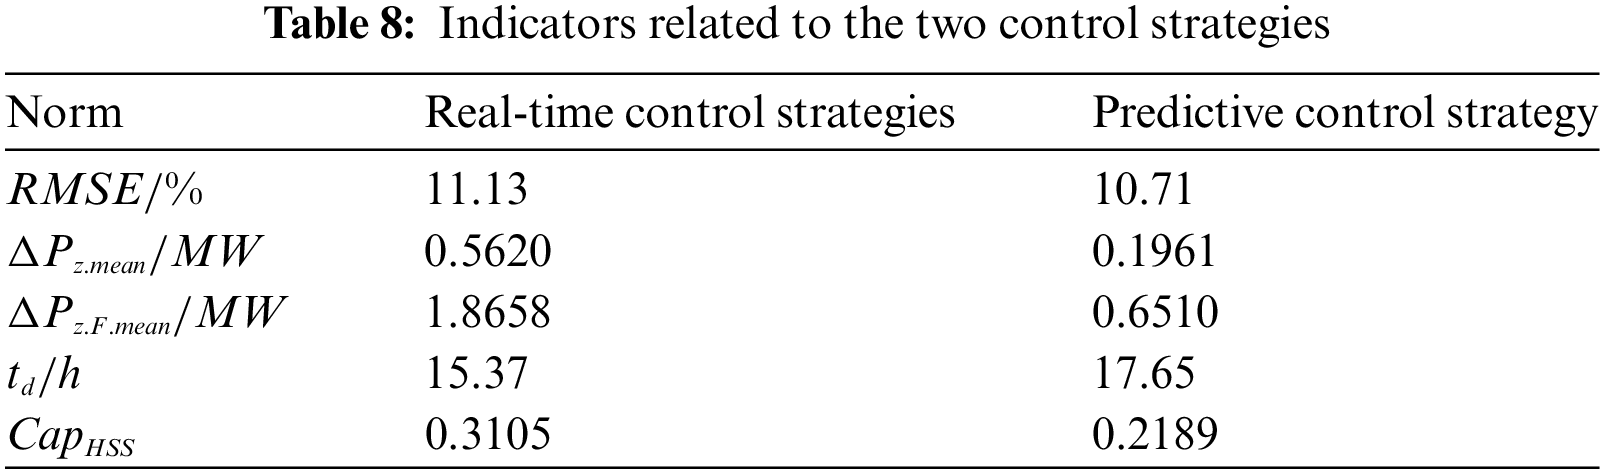
As can be seen in Fig. 14, it compares the real-time control strategy and the override control strategy, it can be seen that the end of the hydrogen storage system for the real-time control strategy is 15.37 h, while the override control strategy is 17.65 h. Similarly, the real-time control strategy cap is 0.3105, while the override control strategy cap is 0.2189, and the relevant indexes are compared in Fig. 14, thus it can be seen that the override control strategy has more regulating ability and the operation state is more stable.
Figs. 15 and 16 show the hydrogen storage system diagrams for the real-time control strategy and predictive control strategy, respectively, and the 0–20 sampling point segment is analyzed as an example, from the comparison of the above two diagrams, it can be seen that the sampling points 2, 5, 8, and 11 in Figs. 15 and 16 do not have a significant response to the wind power output, and under the real-time control strategy, the sampling point 1 to the sampling point 2 is changed from 1.9 to 0 MW, and then the sampling point 2–3 is The sudden change to 0.3 MW at sampling points 5–6 from 0. A comparison of the two strategies reveals that the scheduling effect of the hydrogen storage system under the predictive control strategy responds to the sampling points that are not responsive under the real-time control strategy and the degree of change in the charging and discharging state is small, which not only smoothes the output of the hydrogen storage system but also reduces the number of charging and discharging times and prolongs the life of the system.
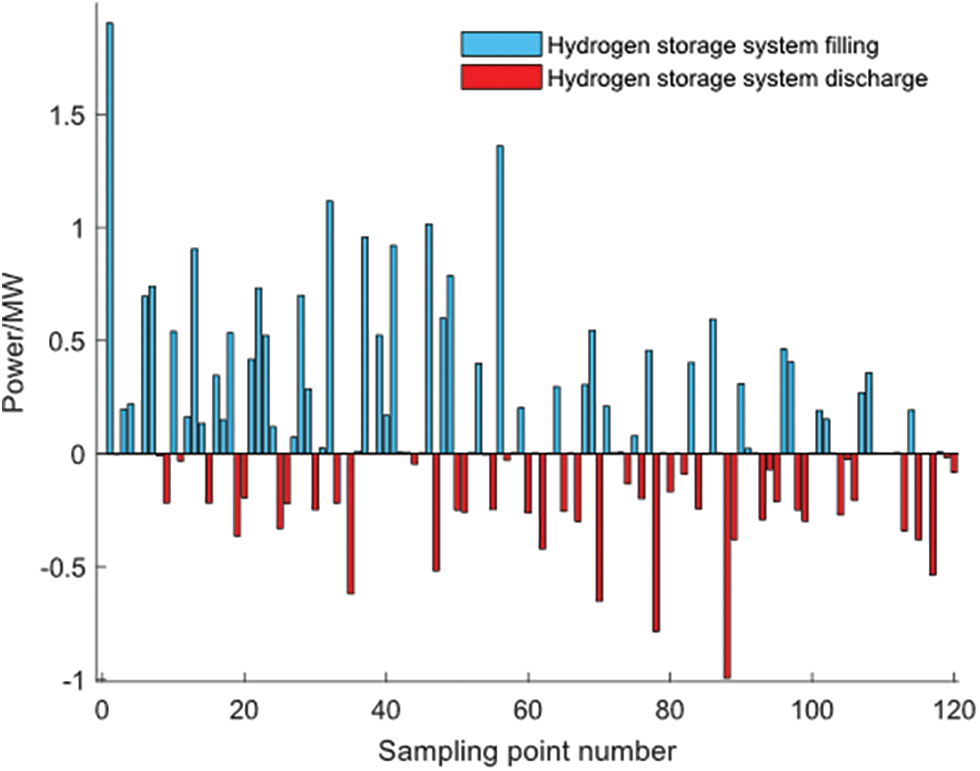
Figure 15: Output diagram of the system under real-time control strategy
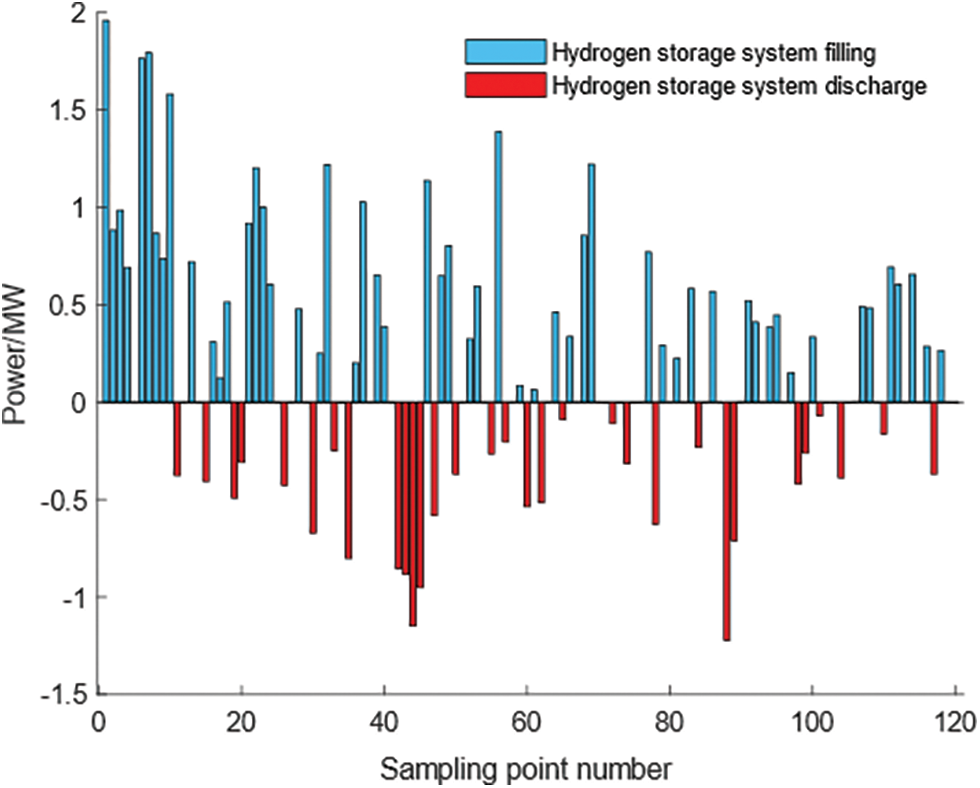
Figure 16: Output diagram of the system under predictive control strategy
To highlight the regulation ability of the predictive control strategy, this paper selects the predictive control strategy using the ultra-short-term wind power prediction power and the real-time control strategy using the actual power of the wind power as well as the planned output of the wind power for comparison, and numerically simulates the two algorithms by using Matlab, as shown in the following Table 8.
From Fig. 17, it can be seen that the overshooting control strategy contains the objective function of power fluctuation constraints, which can effectively smooth out the wind power fluctuations, with the overshooting control strategy
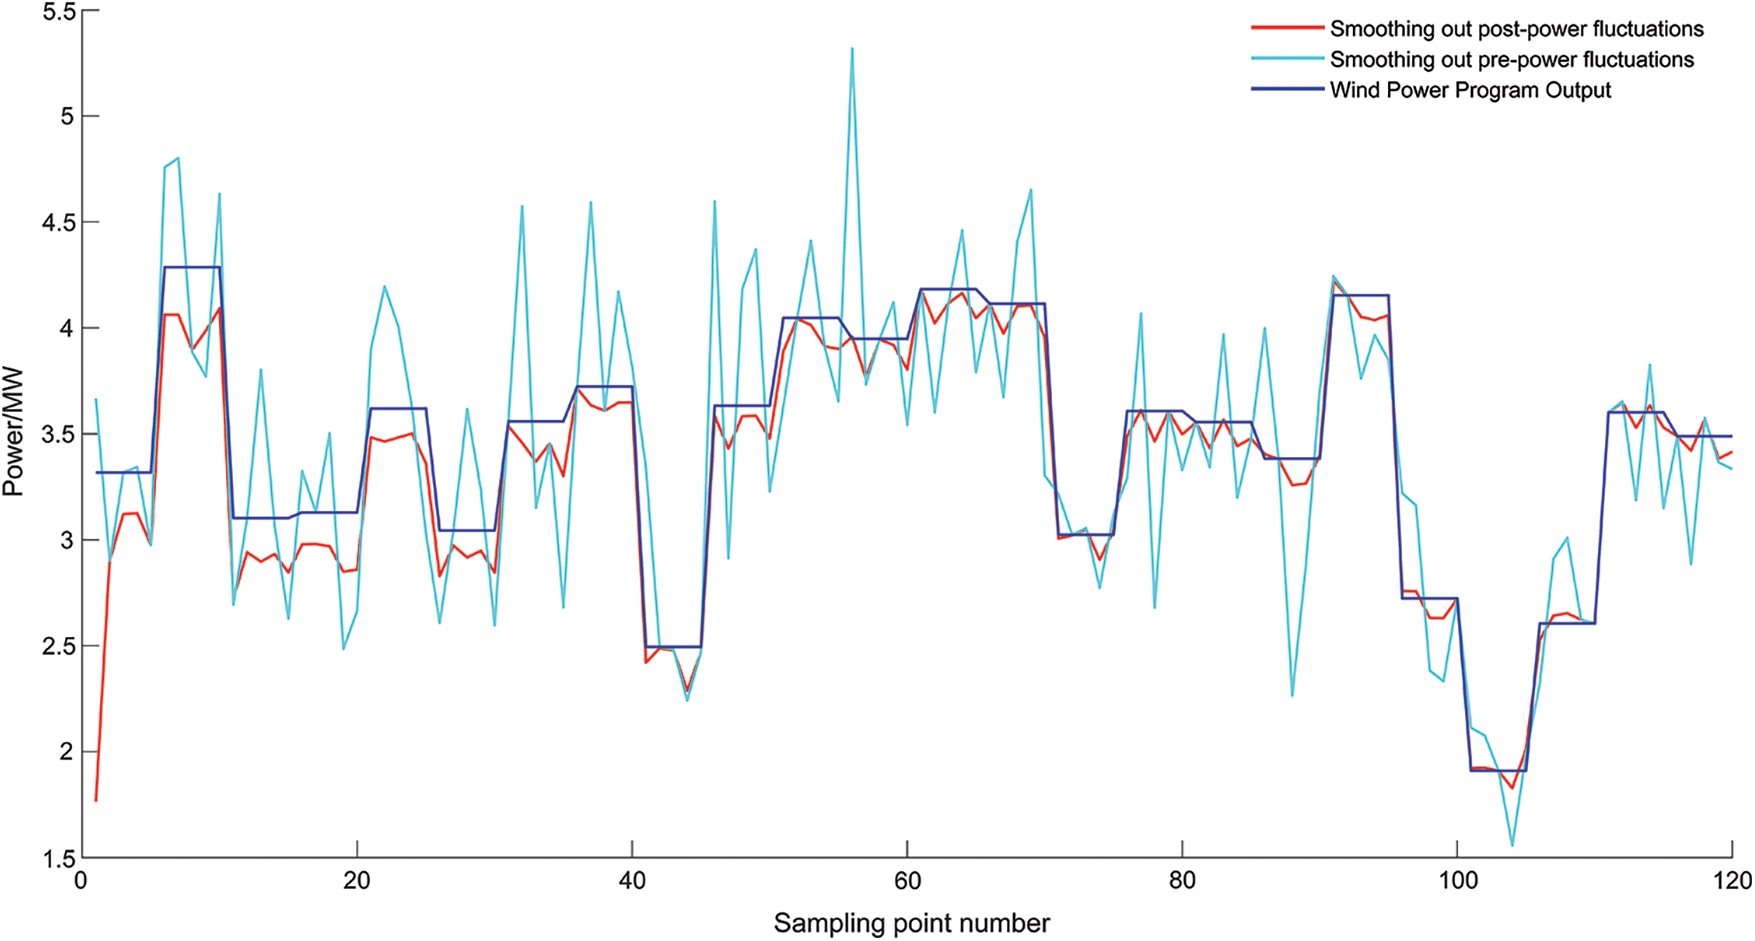
Figure 17: Flat wind electric power wave effect
This article puts forward a predictive control strategy for the wind-hydrogen coupled system, using the day-ahead prediction strategy as the basis for the power output and combining it with the ultra-short-term power prediction for wind power as the basis for the power output in the next 4 h, combining it with the hydrogen storage SOH interval segmentation, formulating the weighted objective function based on the wind power tracking function, the hydrogen storage SOH objective function, and the power smoothing objective function and solving for the power output by using the Adaptive parameter optimization algorithm for rolling optimization solution.
Comparing the relevant indexes of the over-advance prediction control strategy and the real-time control strategy, the over-advance prediction control strategy can reduce the error between the joint output of the wind-hydrogen coupling system and the planned output, improve the regulating ability of the hydrogen storage system, and greatly suppress the fluctuation of the power of the joint output of the wind-hydrogen coupling system, which is better than that of the real-time control strategy in terms of control and scheduling, and has the advantages of over-advancement and global nature, as well as improves the capacity of large-scale wind power consumption and the regulating ability of the hydrogen storage system and the regulation ability of hydrogen storage system.
The predictive control strategy for micro wind-hydrogen coupling systems can be applied to many scenarios such as small distributed new energy power plants and small customer loads. For example, the control strategy can be used to fill the peaks and valleys of the miniature new energy power system to make up for the volatility of wind energy through hydrogen storage technology, so that the wind energy can be better utilized. In addition, the strategy can also be applied to small hydrogen power stations and home energy storage systems to provide a more reliable source of new energy for the home power supply.
However, there are some challenges and limitations to the practical application of this strategy. First, the volatility of wind and hydrogen energy makes the accuracy of the predictive control strategy particularly important and thus requires the use of efficient prediction algorithms. Second, hydrogen and energy storage technologies themselves have technical and economic limitations, such as higher costs and limited storage capacity. In addition, different application scenarios and system sizes will also have an impact on the implementation of predictive control strategies.
Areas for future research include but are not limited to, the following: (1) further improvement and optimization of prediction algorithms to improve the prediction accuracy of wind-hydrogen coupled systems; (2) improvement of the performance and cost reduction of hydrogen and energy storage technologies through technological advances; (3) exploring prediction and control strategies for specific scenarios in conjunction with practical application scenarios and concerning different system scales and characteristics; (4) strengthening the coupling research between wind-hydrogen coupled systems and other renewable energy systems to improve the energy utilization efficiency of the whole energy system.
In summary, the research results of the predictive control strategy for micro wind-hydrogen coupled systems are of great practical significance and have broad prospects for practical applications. Although facing some challenges and limitations, this new type of energy system can gradually achieve more efficient, intelligent, and sustainable energy utilization through technological progress, optimization strategies, and practical application exploration.
Acknowledgement: Thanks for the support of key research and development projects in Xinjiang, and thank you to the reviewers and editors for their insightful suggestions.
Funding Statement: This study is supported by the Key Research & Development Program of Xinjiang (Grant Number 2022B01003).
Author Contributions: The authors confirm their contribution to the paper as follows: study conception and design: Y. Dai, H. Li, and B. Li; data collection: H. Li; analysis and interpretation of results: Y. Dai, H. Li and B. Li; draft manuscript preparation: H. Li and B. Li. All authors reviewed the results and approved the final version of the manuscript.
Availability of Data and Materials: The source data of this project comes from the Xinjiang Key Science and Technology R&D Program which is not open to the public.
Conflicts of Interest: The authors declare that they have no conflicts of interest to report regarding the present study.
References
1. Pathak, A. K., Sharma, M. P., Bundele, M. (2015). A critical review of voltage and reactive power management of wind farms. Renewable and Sustainable Energy Reviews, 51, 460–471. https://doi.org/10.1016/j.rser.2015.06.015 [Google Scholar] [CrossRef]
2. Liu, X., Yue, Y., Huang, X. (2022). A review of wind energy output simulation for new power system planning. Frontiers in Energy Research, 10, 942450. https://doi.org/10.3389/fenrg.2022.942450 [Google Scholar] [CrossRef]
3. Gupta, N. (2016). A review on the inclusion of wind generation in power system studies. Renewable and Sustainable Energy Reviews, 59, 530–543. https://doi.org/10.1016/j.rser.2016.01.009 [Google Scholar] [CrossRef]
4. Li, J., Xu, D., Wang, J. (2022). P2P multigrade energy trading for heterogeneous distributed energy resources and flexible demand. IEEE Transactions on Smart Grid, 14(2), 1577–1589. [Google Scholar]
5. Cai, G. W., Kong, L. G., Xue, Y. (2014). Overview of research on wind power coupled with hydrogen production technology. Automation of Electric Power Systems, 38(21), 127–135 (In Chinese). [Google Scholar]
6. Rezk, H., Nassef, A. M., Abdelkareem, M. A. (2021). Comparison among various energy management strategies for reducing hydrogen consumption in a hybrid fuel cell/supercapacitor/battery system. International Journal of Hydrogen Energy, 8, 6110–6126. [Google Scholar]
7. Duan, Q. X., Yuan, T. J., Mei, S. W. (2018). Energy coordination control of wind power-hydrogen energy storage and coal chemical multi-functional coupling system. High Voltage Engineering, 44(1), 176–186 (In Chinese). [Google Scholar]
8. Zhou, T., François, B. (2010). Energy management and power control of a hybrid active wind generator for distributed power generation and grid integration. IEEE Transactions on Industrial Electronics, 58(1), 95–104. [Google Scholar]
9. Wang, C., Nehrir, M. H. (2008). Power management of a stand-alone wind/photovoltaic/fuel cell energy system. IEEE Transactions on Energy Conversion, 23(3), 957–967. https://doi.org/10.1109/TEC.2007.914200 [Google Scholar] [CrossRef]
10. Melo, D. F. R., Chang-Chien, L. R. (2013). Synergistic control between the hydrogen storage system and offshore wind farm for grid operation. IEEE Transactions on Sustainable Energy, 5(1), 18–27. [Google Scholar]
11. Loisel, R., Baranger, L., Chemouri, N. (2015). Economic evaluation of hybrid off-shore wind power and hydrogen storage system. International Journal of Hydrogen Energy, 40(21), 6727–6739. https://doi.org/10.1016/j.ijhydene.2015.03.117 [Google Scholar] [CrossRef]
12. Tebibel, H. (2018). Wind turbine power system for hydrogen production and storage: Techno-economic analysis. International Conference on Wind Energy and Applications in Algeria (ICWEAA 2018), Algiers, Algeria, Centre de Développement des Energies Renouvelables. [Google Scholar]
13. Zhang, Q., Chen, X., Li, G., Feng, J., Yang, A. (2023). Model predictive control method of multi-energy flow system thinking wind power consumption. IEEE Access, 11, 86697–86710. https://doi.org/10.1109/ACCESS.2023.3304697 [Google Scholar] [CrossRef]
14. Abdelghany, M. B., Shehzad, M. F., Liuzza, D. (2021). Optimal operations for hydrogen-based energy storage systems in wind farms via model predictive control. International Journal of Hydrogen Energy, 46, 29297–29313. https://doi.org/10.1016/j.ijhydene.2021.01.064 [Google Scholar] [CrossRef]
15. Han, X., Guo, S., Zhang, Z. (2023). An ICEEMDAN-based collaborative optimization control for wind-hydrogen-electrochemical energy storage under multiple application scenarios. J. Renew. Sustain. Energy, 15(5), 054101. https://doi.org/10.1063/5.0164624 [Google Scholar] [CrossRef]
16. Xu, H., Chang, Y., Zhao, Y. (2021). A hybrid model for multi-step wind speed forecasting based on secondary decomposition, deep learning, and error correction algorithms. Journal of Intelligent & Fuzzy Systems, 41(2), 3443–3462. https://doi.org/10.3233/JIFS-210779 [Google Scholar] [CrossRef]
17. Iliev, A., Kyurkchiev, N., Markov, S. (2017). On the approximation of the step function by some sigmoid functions. Mathematics and Computers in Simulation, 133, 223–234. https://doi.org/10.1016/j.matcom.2015.11.005 [Google Scholar] [CrossRef]
18. Liu, W., Wang, Z., Yuan, Y. (2019). A novel sigmoid-function-based adaptive weighted particle swarm optimizer. IEEE Transactions on Cybernetics, 51(2), 1085–1093. [Google Scholar]
19. Haruni, A. M. O., Negnevitsky, M., Haque, M. E. (2012). A novel operation and control strategy for a standalone hybrid renewable power system. IEEE Transactions on Sustainable Energy, 4(2), 402–413. [Google Scholar]
20. Cai, G. W., Chen, C., Kong, L. G. (2016). Modeling and control of grid-connected system of wind/PV/electrolyzer and SC. Power System Technology, 40(10), 2982–2990 (In Chinese). [Google Scholar]
21. Carapellucci, R., Giordano, L. (2012). Modeling and optimization of an energy generation island based on renewable technologies and hydrogen storage systems. International Journal of Hydrogen Energy, 37(3), 2081–2093. https://doi.org/10.1016/j.ijhydene.2011.10.073 [Google Scholar] [CrossRef]
22. Ipsakis, D., Voutetakis, S., Seferlis, P. (2009). Power management strategies for a stand-alone power system using renewable energy sources and hydrogen storage. International Journal of Hydrogen Energy, 34(16), 7081–7095. https://doi.org/10.1016/j.ijhydene.2008.06.051 [Google Scholar] [CrossRef]
23. Abdelkafi, A., Krichen, L. (2014). Energy management optimization of a hybrid power production unit based on renewable energies. International Journal of Electrical Power & Energy Systems, 62, 1–9. https://doi.org/10.1016/j.ijepes.2014.04.012 [Google Scholar] [CrossRef]
24. Zhu, L., Wang, J., Tang, L. (2019). Robust stochastic optimal dispatching of integrated energy systems considering refined power-to-gas model. Power System Technology, 43(1), 116–125 (In Chinese). [Google Scholar]
25. Al-Baghdadi, M. A. R. S., Al-Janabi, H. A. K. S. (2007). Effect of design parameters on the hygro-thermal stresses in proton exchange membranes of the fuel cells. Engineering Applications of Computational Fluid Mechanics, 1(2), 71–87. https://doi.org/10.1080/19942060.2007.11015183 [Google Scholar] [CrossRef]
26. Patsios, C., Antonakopoulos, M., Chaniotis, A. (2010). Control and analysis of a hybrid renewable energy-based power system. The XIX International Conference on Electrical Machines-ICEM 2010, pp. 1–6, Rome, Italy, IEEE. [Google Scholar]
27. Wu, Z., Wang, B. (2021). An ensemble neural network based on variational mode decomposition and an improved sparrow search algorithm for wind and solar power forecasting. IEEE Access, 9, 166709–166719. https://doi.org/10.1109/ACCESS.2021.3136387 [Google Scholar] [CrossRef]
28. Yunlong, Y. (2018). Improvement of wind abandoned consumption capacity in a region of North-east region China by wind power hydrogen storage energy system. Power Capacity. React. Power Compens, 39(4), 0190–0197. [Google Scholar]
29. Louka, P., Galanis, G., Siebert, N. (2008). Improvements in wind speed forecasts for wind power prediction purposes using Kalman filtering. Journal of Wind Engineering and Industrial Aerodynamics, 96(12), 2348–2362. https://doi.org/10.1016/j.jweia.2008.03.013 [Google Scholar] [CrossRef]
30. Ikegami, T., Urabe, C. T., Saitou, T. (2018). Numerical definitions of wind power output fluctuations for power system operations. Renewable Energy, 115, 6–15. https://doi.org/10.1016/j.renene.2017.08.009 [Google Scholar] [CrossRef]
Cite This Article
 Copyright © 2024 The Author(s). Published by Tech Science Press.
This work is licensed under a Creative Commons Attribution 4.0 International License , which permits unrestricted use, distribution, and reproduction in any medium, provided the original work is properly cited.
 Downloads
 Citation Tools