
 Submit a Paper
 Propose a Special lssue
 Open Access
ARTICLE

A Data-Oriented Method to Optimize Hydraulic Fracturing Parameters of Tight Sandstone Reservoirs
CNOOC Research Institute Co., Ltd., Beijing, 100028, China
* Corresponding Author: Zhengrong Chen. Email:
Energy Engineering 2024, 121(6), 1657-1669. https://doi.org/10.32604/ee.2024.030222
Received 27 March 2023; Accepted 26 June 2023; Issue published 21 May 2024
 View Full Text
 Download PDF
Abstract
Based on the actual data collected from the tight sandstone development zone, correlation analysis using the Spearman method was conducted to determine the main factors influencing the gas production rate of tight sandstone fracturing. An integrated model combining geological engineering and numerical simulation of fracture propagation and production was completed. Based on data analysis, the hydraulic fracture parameters were optimized to develop a differentiated fracturing treatment adjustment plan. The results indicate that the influence of geological and engineering factors in the X1 and X2 development zones in the study area differs significantly. Therefore, it is challenging to adopt a uniform development strategy to achieve rapid production increase. The data analysis reveals that the variation in gas production rate is primarily affected by the reservoir thickness and permeability parameters as geological factors. On the other hand, the amount of treatment fluid and proppant addition significantly impact the gas production rate as engineering factors. Among these factors, the influence of geological factors is more pronounced in block X1. Therefore, the main focus should be on further optimizing the fracturing interval and adjusting the geological development well location. Given the existing well location, there is limited potential for further optimizing fracture parameters to increase production. For block X2, the fracturing parameters should be optimized. Data screening was conducted to identify outliers in the entire dataset, and a data-driven fracturing parameter optimization method was employed to determine the basic adjustment direction for reservoir stimulation in the target block. This approach provides insights into the influence of geological, stimulation, and completion parameters on gas production rate. Consequently, the subsequent fracturing parameter optimization design can significantly reduce the modeling and simulation workload and guide field operations to improve and optimize hydraulic fracturing efficiency.Keywords
The rapid advancement in data science has recently led to the adoption of data-driven analysis methods for oil and gas exploration and development. These methods have shown promising results and opened new avenues for reducing costs and enhancing the recovery of oil and gas reservoirs [1–4]. One such example is in tight sandstone gas reservoir development, where studies have shown that efficient and accurate fracturing design is crucial for production increase. Although hydraulic fracturing parameter optimization technology has made significant progress, constructing complex geological and reservoir models and conducting numerical simulations of the entire process are necessary to achieve it. However, due to the factors affecting fracturing, such as geological parameters, fracturing treatment parameters, production dynamic parameters, and complex relationships among fracturing parameters, numerical simulation methods sometimes fail to find the main control factors. Additionally, simulations mostly use static data, which cannot be integrated with dynamic production data. This can lead to directional deviations during post hydraulic fracturing evaluation and the development of strategies to improve fractured well production. Therefore, it is of great significance to conduct data-driven fracturing parameter optimization research.
Many scholars have focused on integrating fractured well data to analyze the main controlling factors of production [5–7]. Most scholars optimize reservoir production prediction and fracturing design through machine learning methods. For instance, Pankai et al. [8] used numerical simulation to build 2000 data points, a machine learning-based shale oil production prediction agent model, and predicted oil production. Liang et al. [9] established the relationship between estimated ultimate recovery and fracturing/reservoir parameters and identified the ten most important parameters. Luo et al. [10] used big data to assess the main factors affecting annual oil production. Xu et al. [11–13] theoretically studied the main controlling factors affecting the productivity of horizontal wells in tight gas reservoirs using numerical simulation, big data analysis, statistics, and the grey correlation method. However, while simple data-driven methods can provide macroscopic and directional guidance, quantitative analysis of specific fracturing parameters still requires numerical simulation. Therefore, combining the advantages of the two methods, i.e., data-driven and numerical simulation, to optimize fracture parameters in a data-oriented mode is of great significance. Alghamdi et al. [14] utilized Artificial Neural Networks (ANN) to estimate the flow rate of 30 tight gas wells, achieving AI-enabled accurate production surveillance of big-bore wells. Rollins et al. [15] utilized big data to create an easy-to-use tool for the rapid allocation and assessment of production for any area in the continental United States, and allocate it to the perforated formations associated with each well’s complex production history. Trang et al. [16] presented the gas and condensate production prediction method based on the ANFIS (adaptive neuro-fuzzy inference system) and the Takagi-Sugeno FIS (fuzzy inference system) with multiple real-time surface inputs based on big data. According to former research, the majority of studies focus on the gas production simulation while rare studies concentrate on the data mining in the fracturing parameters optimization.
This study focused on a tight gas reservoir in the Ordos Basin and collected data from 125 fracturing wells. The main controlling factors of gas flow in the development zone were determined using data correlation analysis. X1 and X2 production areas were used to analyze the differences between geological and fracturing factors. Finally, multilevel superimposed geological modeling was conducted using the fracture propagation-production theoretical model to optimize hydraulic fracturing parameters. This technical approach can provide a valuable guide for subsequent hydraulic fracturing design in tight gas reservoirs.
2 Integrated Fracturing Simulation of Geological Engineering
2.1 Geological Survey of Tight Gas Reservoir in the Study Area
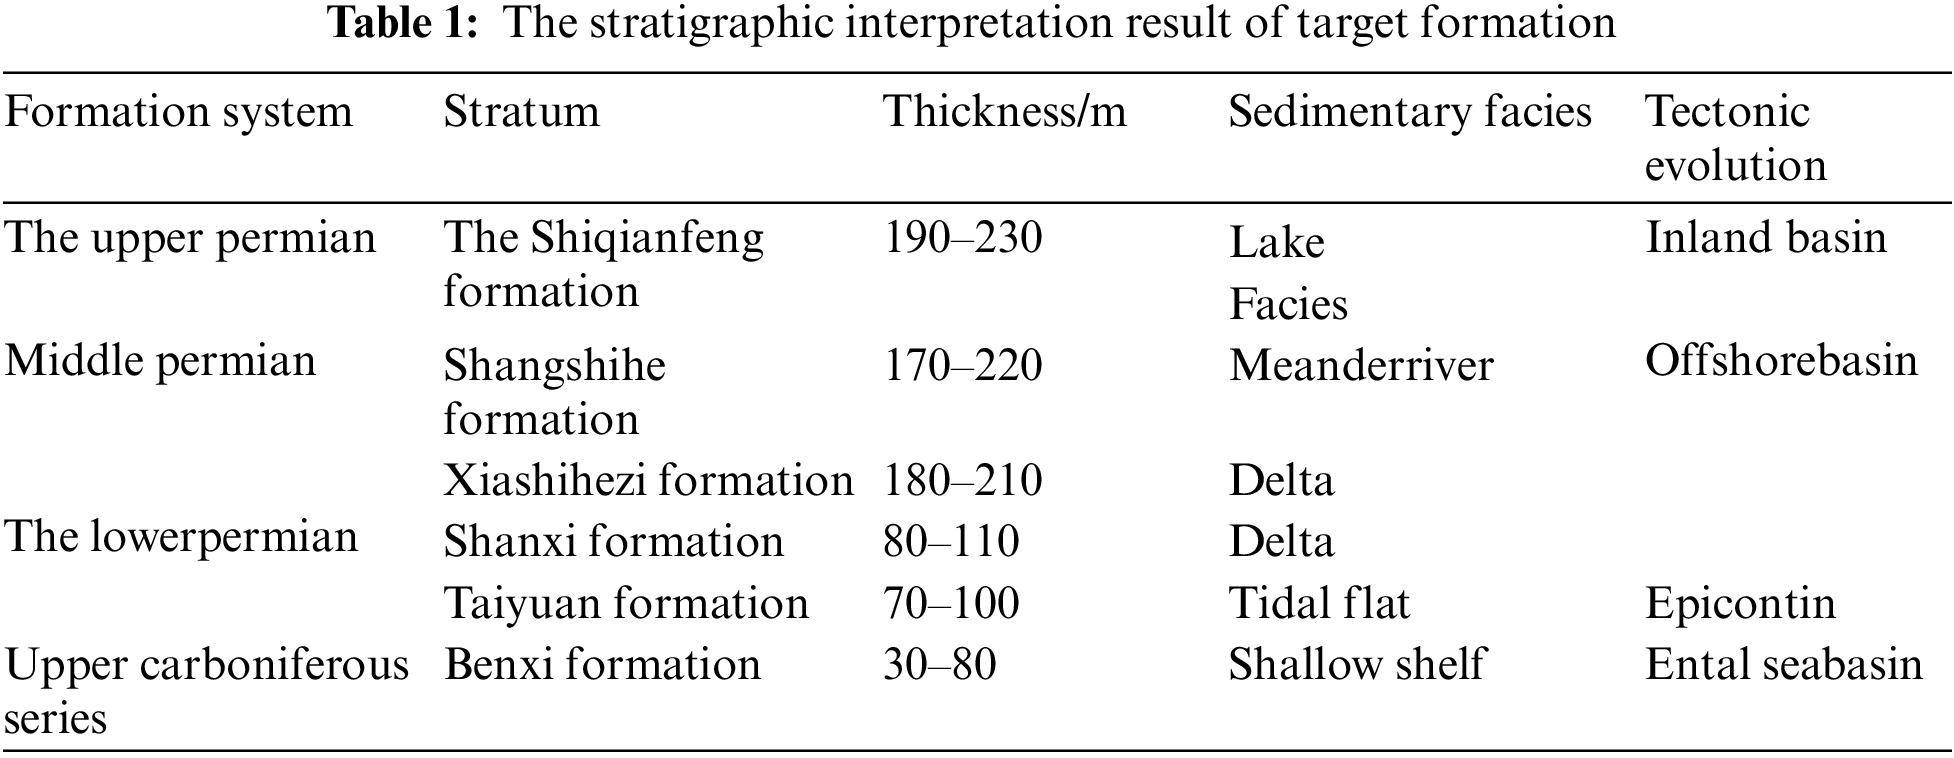
This study was conducted in a tight gas reservoir in Ordos Basin, which is located in the transition position of the Yishan slope and Jinxi flexural fold belt. The study block is located west of the Lishi fault zone and has similar structural conditions to the Yishan slope. The internal deposits of the strata are continuous, all of which are integrated contact, and consist mainly of marine-continental transitional facies and continental clastic rock deposits. The strata consist of various formations, including Carboniferous Benxi, Permian Taiyuan, Shanxi, Lower Shihezi, Upper Shihezi, and Shiqianfeng (see Table 1). The comprehensive evaluation study area is a medium-shallow, low-porosity, ultra-low permeability, atmospheric pressure, low abundance, low production, and constant volume elastic driven small lithologic gas reservoir. During the pre-exploration stage of the gas field, several relatively rich areas were selected based on three-dimensional (3D) seismic data and the exploration results of neighboring areas. However, the productivity of each development zone differs significantly, and the main controlling factors of productivity were unclear. Currently, the tight gas field has entered the development stage, and the pilot experiment of fracturing retreatment has been successful. However, the production capacity of each development zone varies greatly, and the main controlling factors of production capacity are unclear. Therefore, conducting studies on hydraulic fracturing parameter optimization is necessary to provide a reference for the subsequent exploration and development of the study block.
2.2 Integrated Modeling Method of Geological Engineering
In view of the geological structure characteristics of the study block, the integrated model of geology and mechanics was perfected based on reservoir logging prediction and evaluation technology. Meanwhile, the parameter characteristics of the physical property and stress of a single well need to be modified based on laboratory test data. In constructing the integrated model, the final model was mainly constructed using stepwise superposition technology. However, for the attribute model, the sequential Gaussian simulation was used to obtain the continuous distribution of each reservoir attribute. The distribution characteristics of porosity and permeability were established under the control of the microphase model through the normal distribution transformation and variation function analysis of the porosity and permeability values in each well. A multiattribute and multisource information modeling scheme was adopted for natural fracture modeling. Large-scale natural fractures were constrained using seismic interpretation results (coherence, curvature, and ant body), while medium and small-scale natural fractures were constructed using random modeling methods and constrained using core observation and imaging data. The elastic parameters of the target layer were determined using 3D seismic velocity data to realize 3D rock mechanics parameter modeling. The 3D ground stress distribution was based on the boundary load method, and the finite element inversion modeling method of the fusion optimization algorithm was used to obtain 3D stress modeling. Figs. 1 and 2 show the relevant single well and 3D modeling results, respectively. The main lithologies of the target layers in the study area are sandstone, mudstone, coal rock and tuff, among which the two key layers of Shihezi 7 and Shihezi 8 are mainly sandstone and mudstone, and it can be found that the mechanical parameters of sandstone and mudstone are widely different. The Young’s modulus ranges from 22.15 to 35.27 GPa, the Poisson’s ratio ranges from 0.18 to 0.22. The sandstone reservoir of the L Formation in the central area of Linxing is a normal stress formation with a minimum horizontal principal stress gradient of 0.017–0.021 MPa/m and a maximum horizontal principal stress gradient of 0.020–0.025 MPa/m.
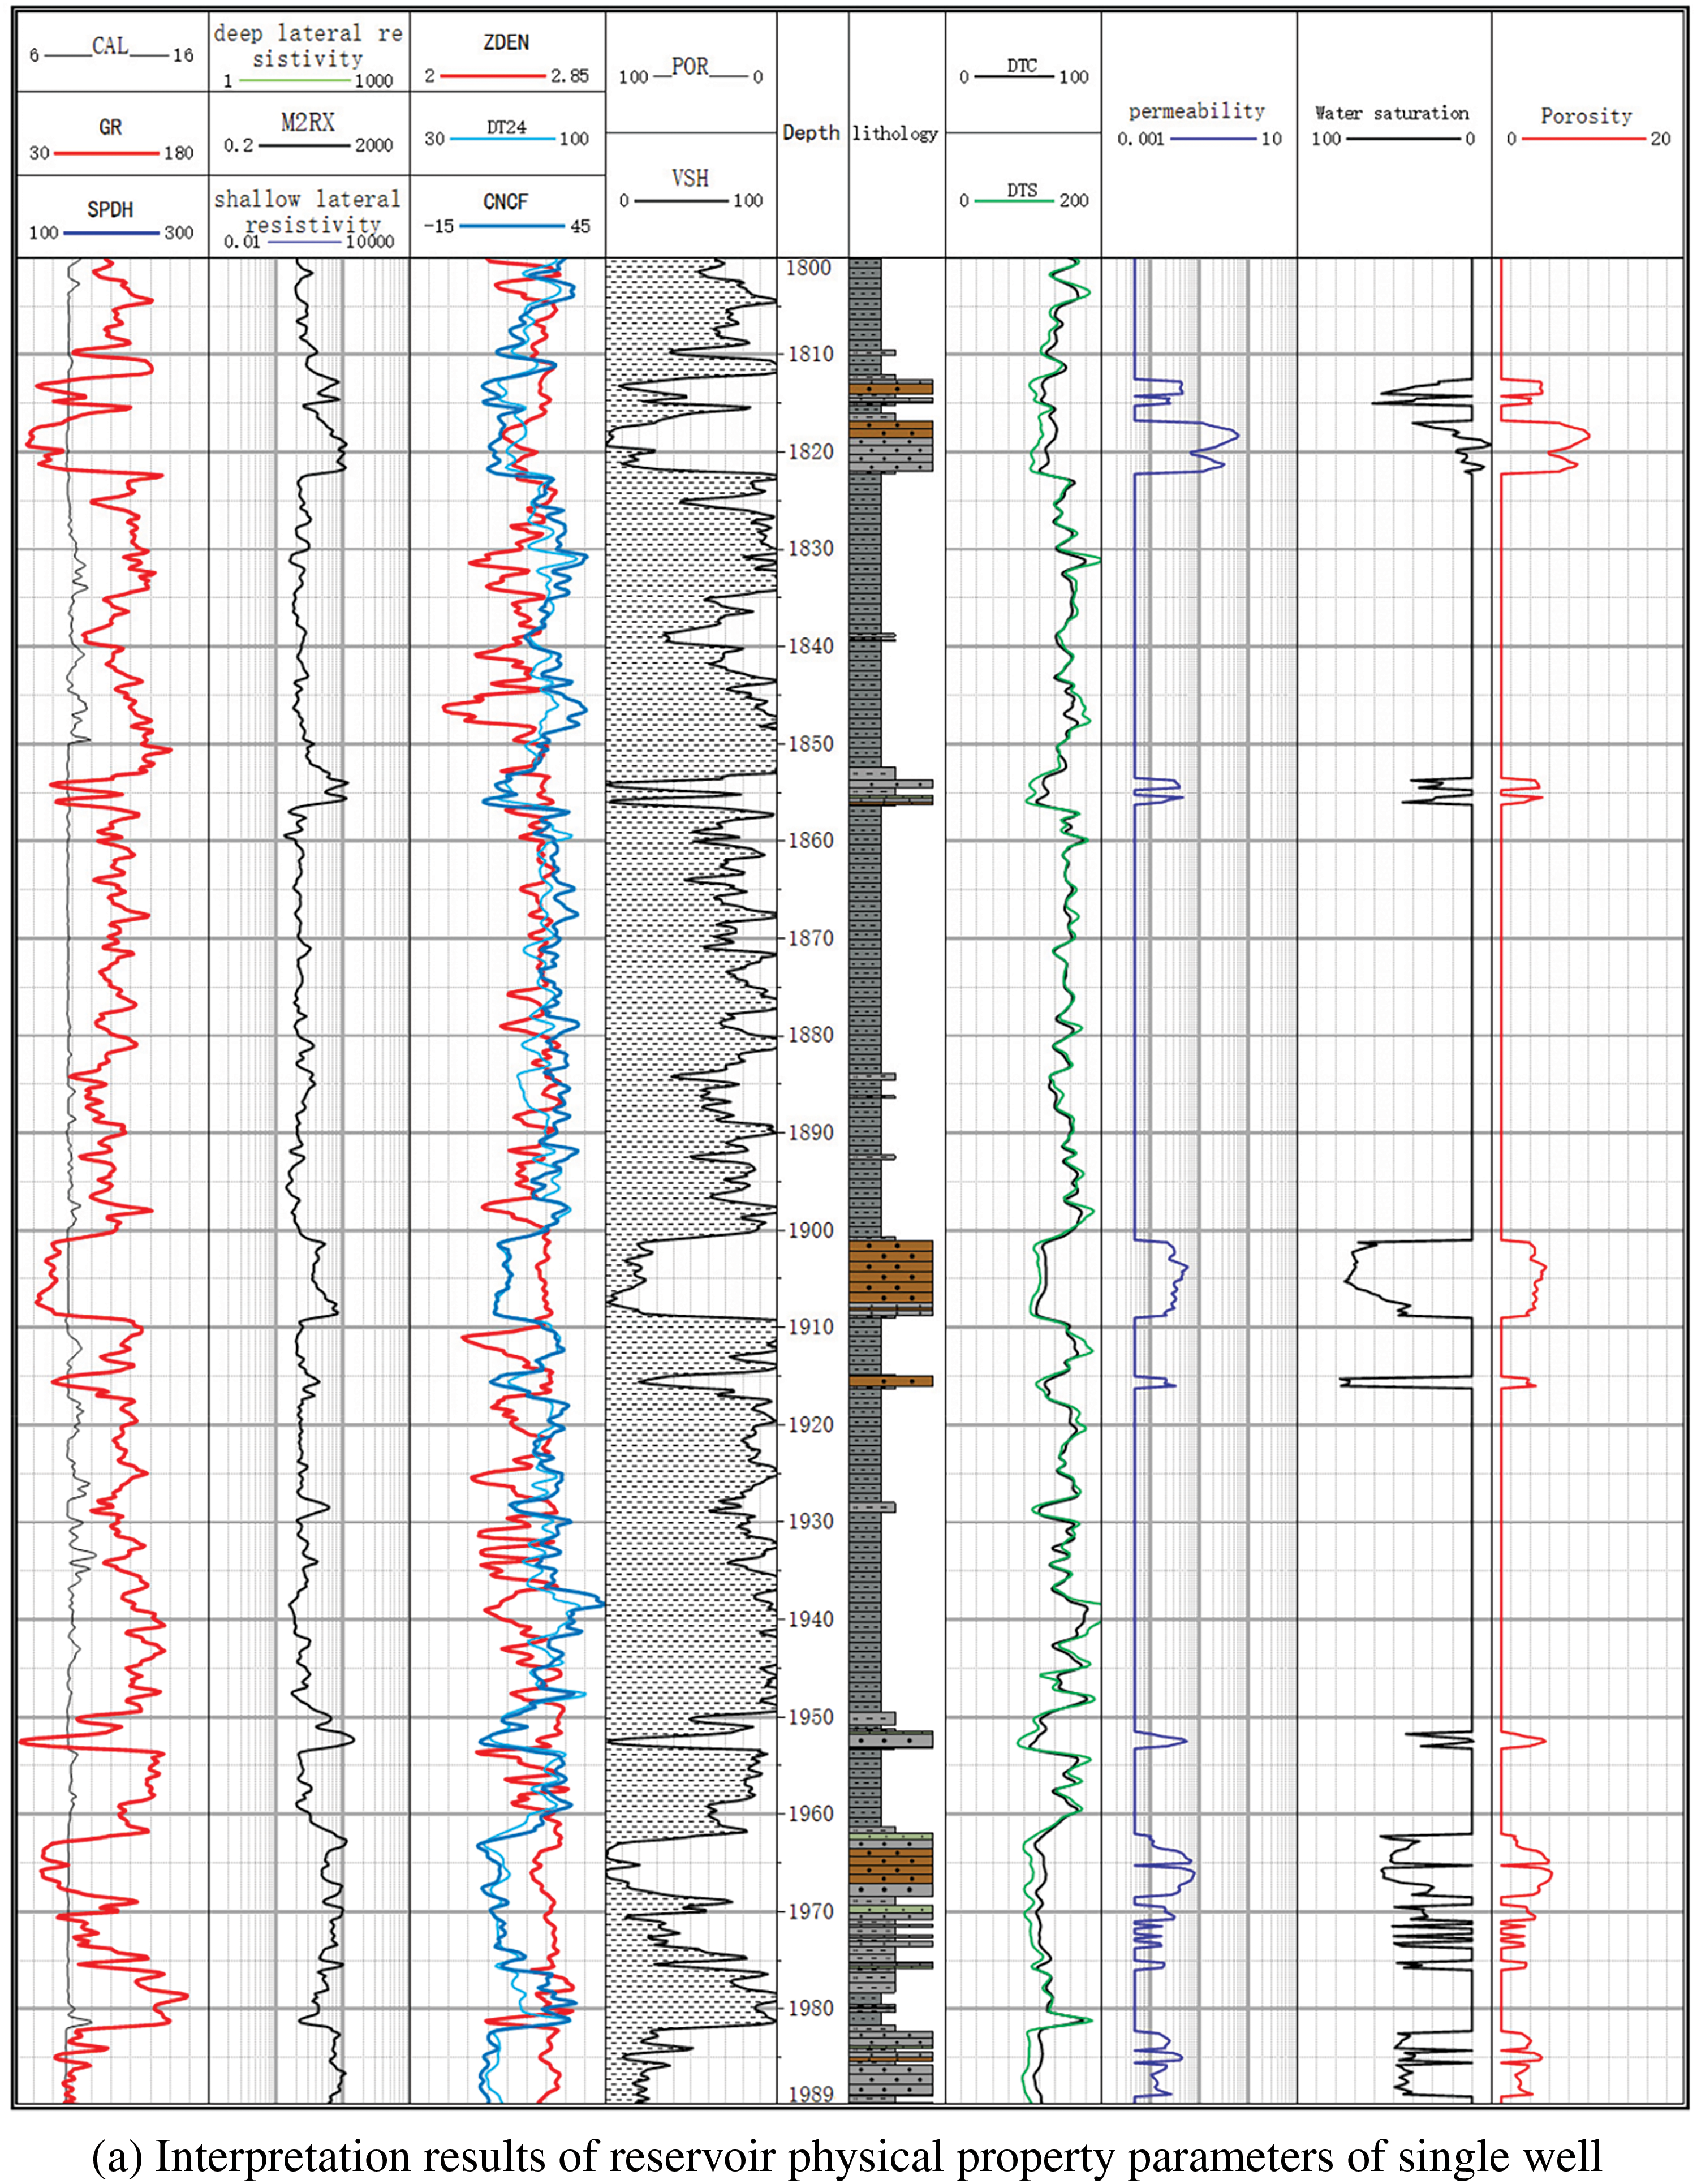
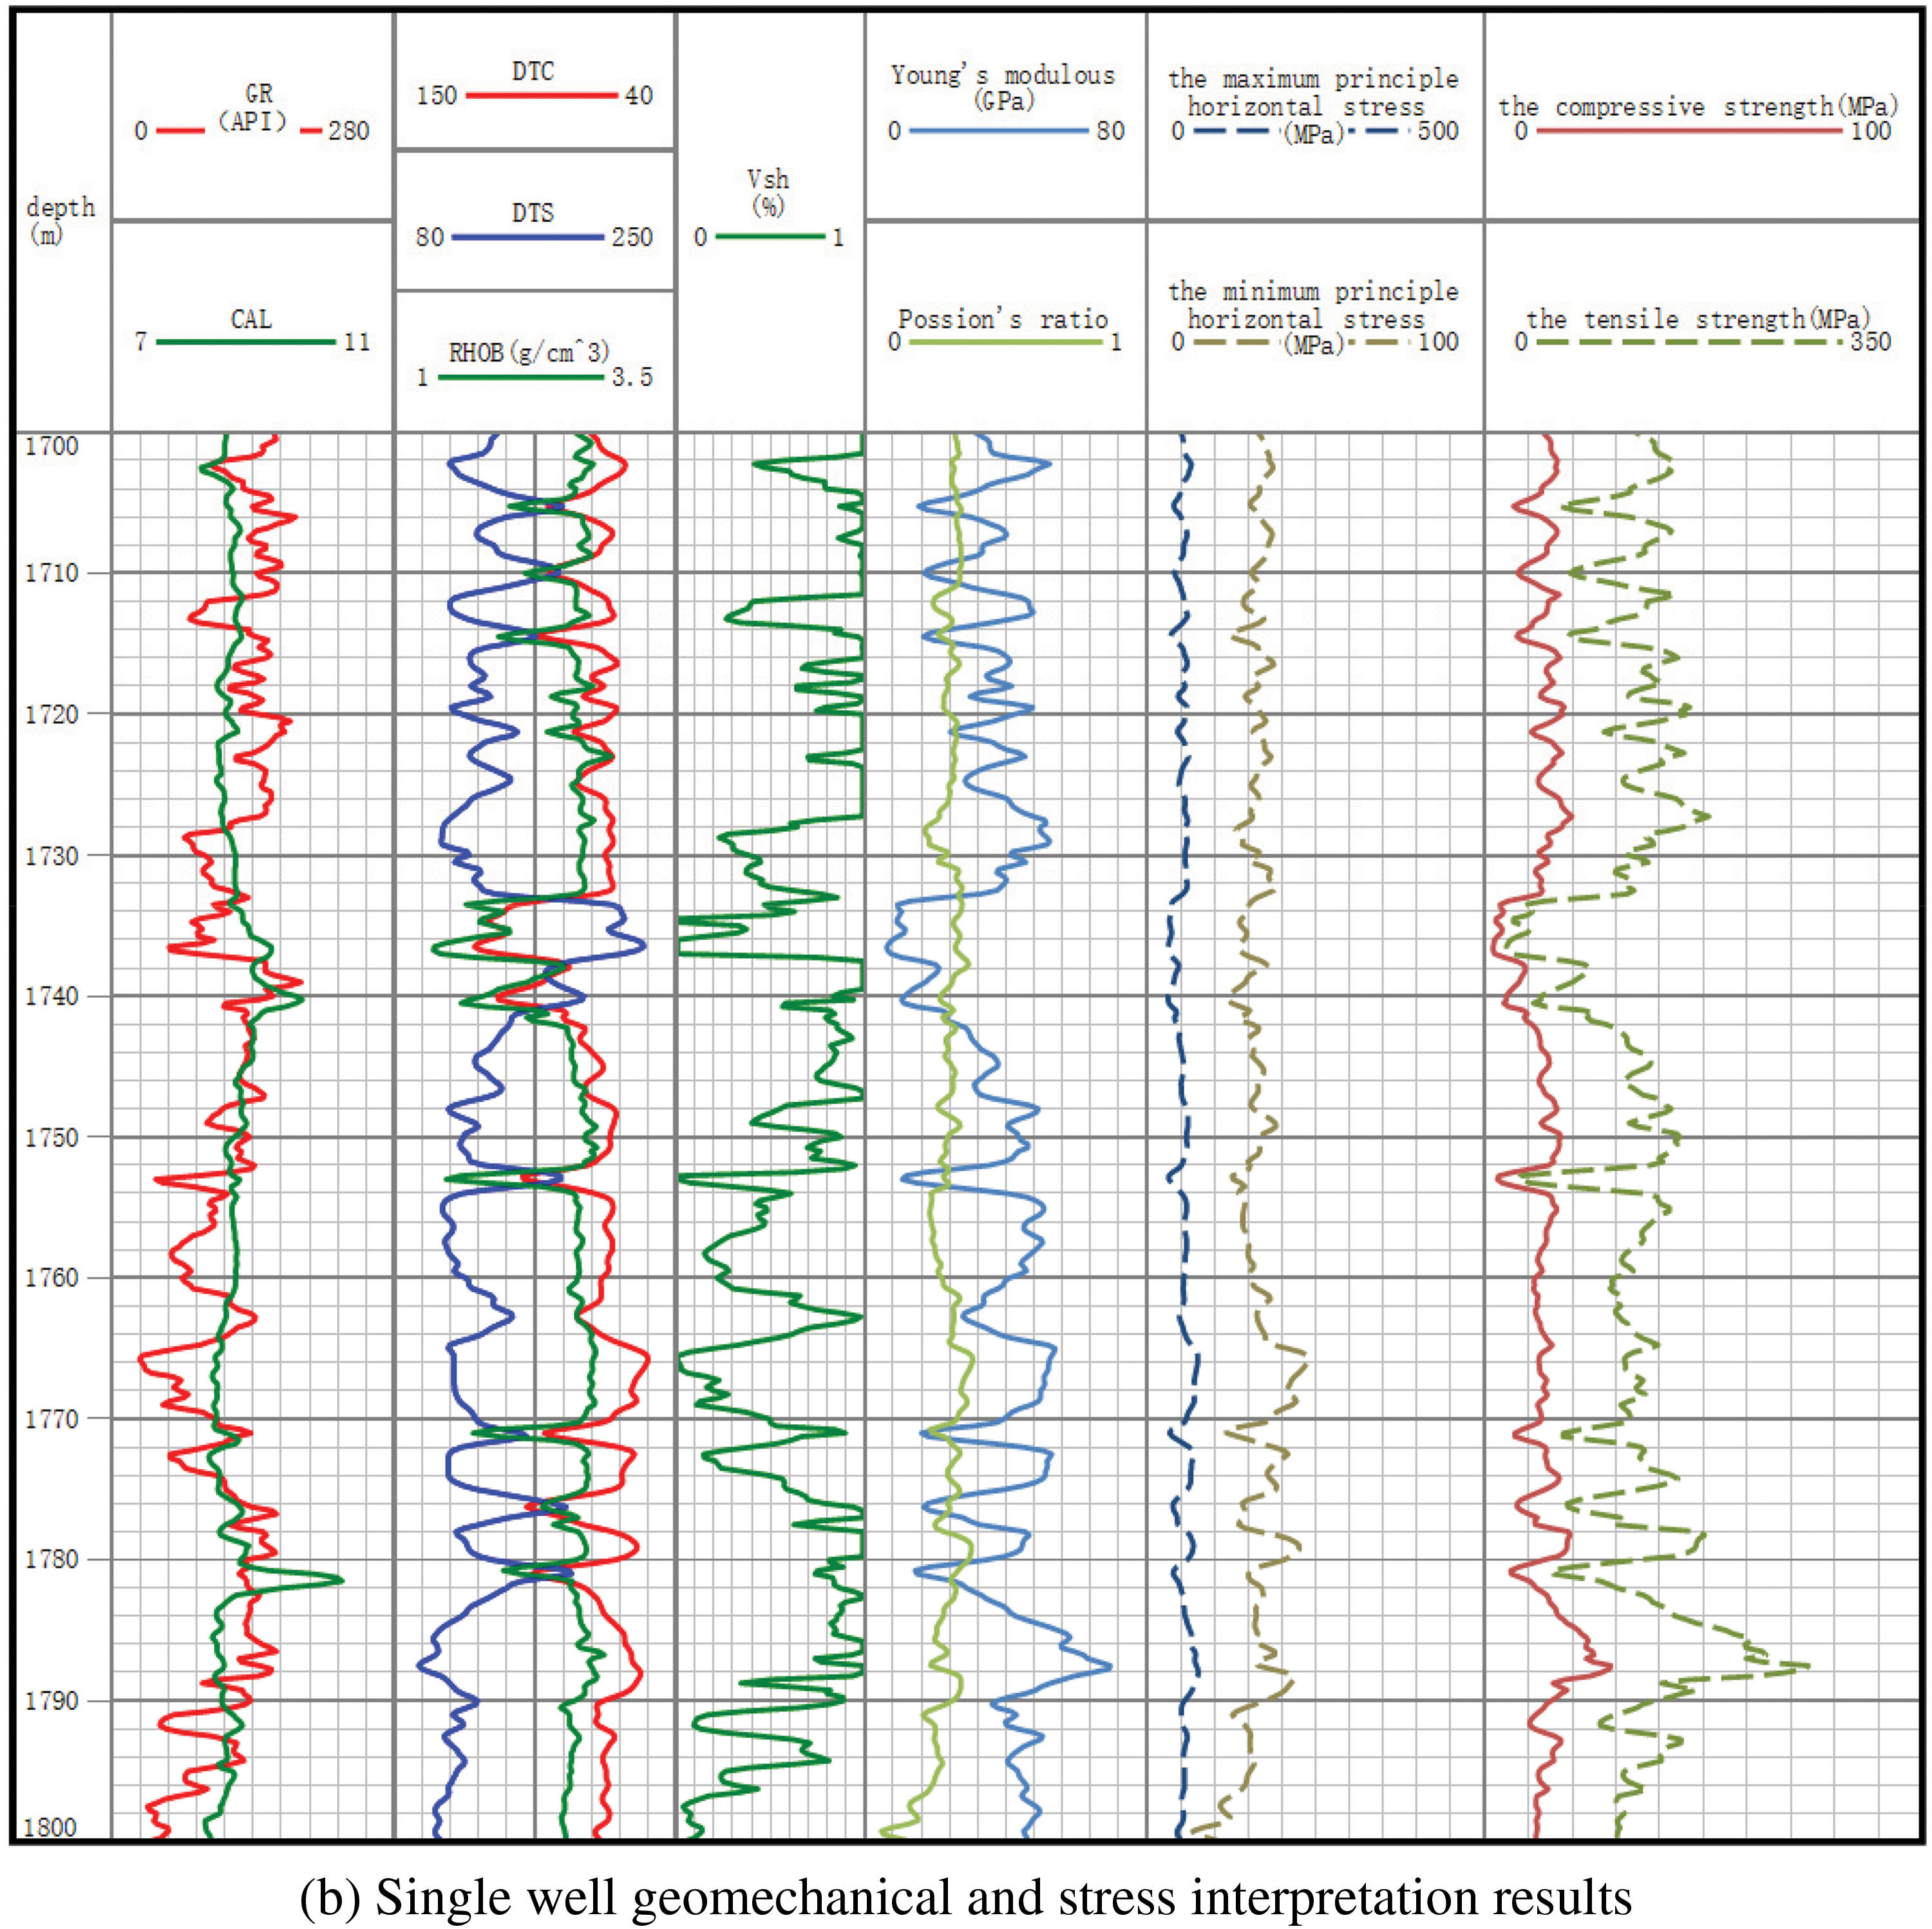
Figure 1: The modeling results of single well geological and stress characteristics were studied
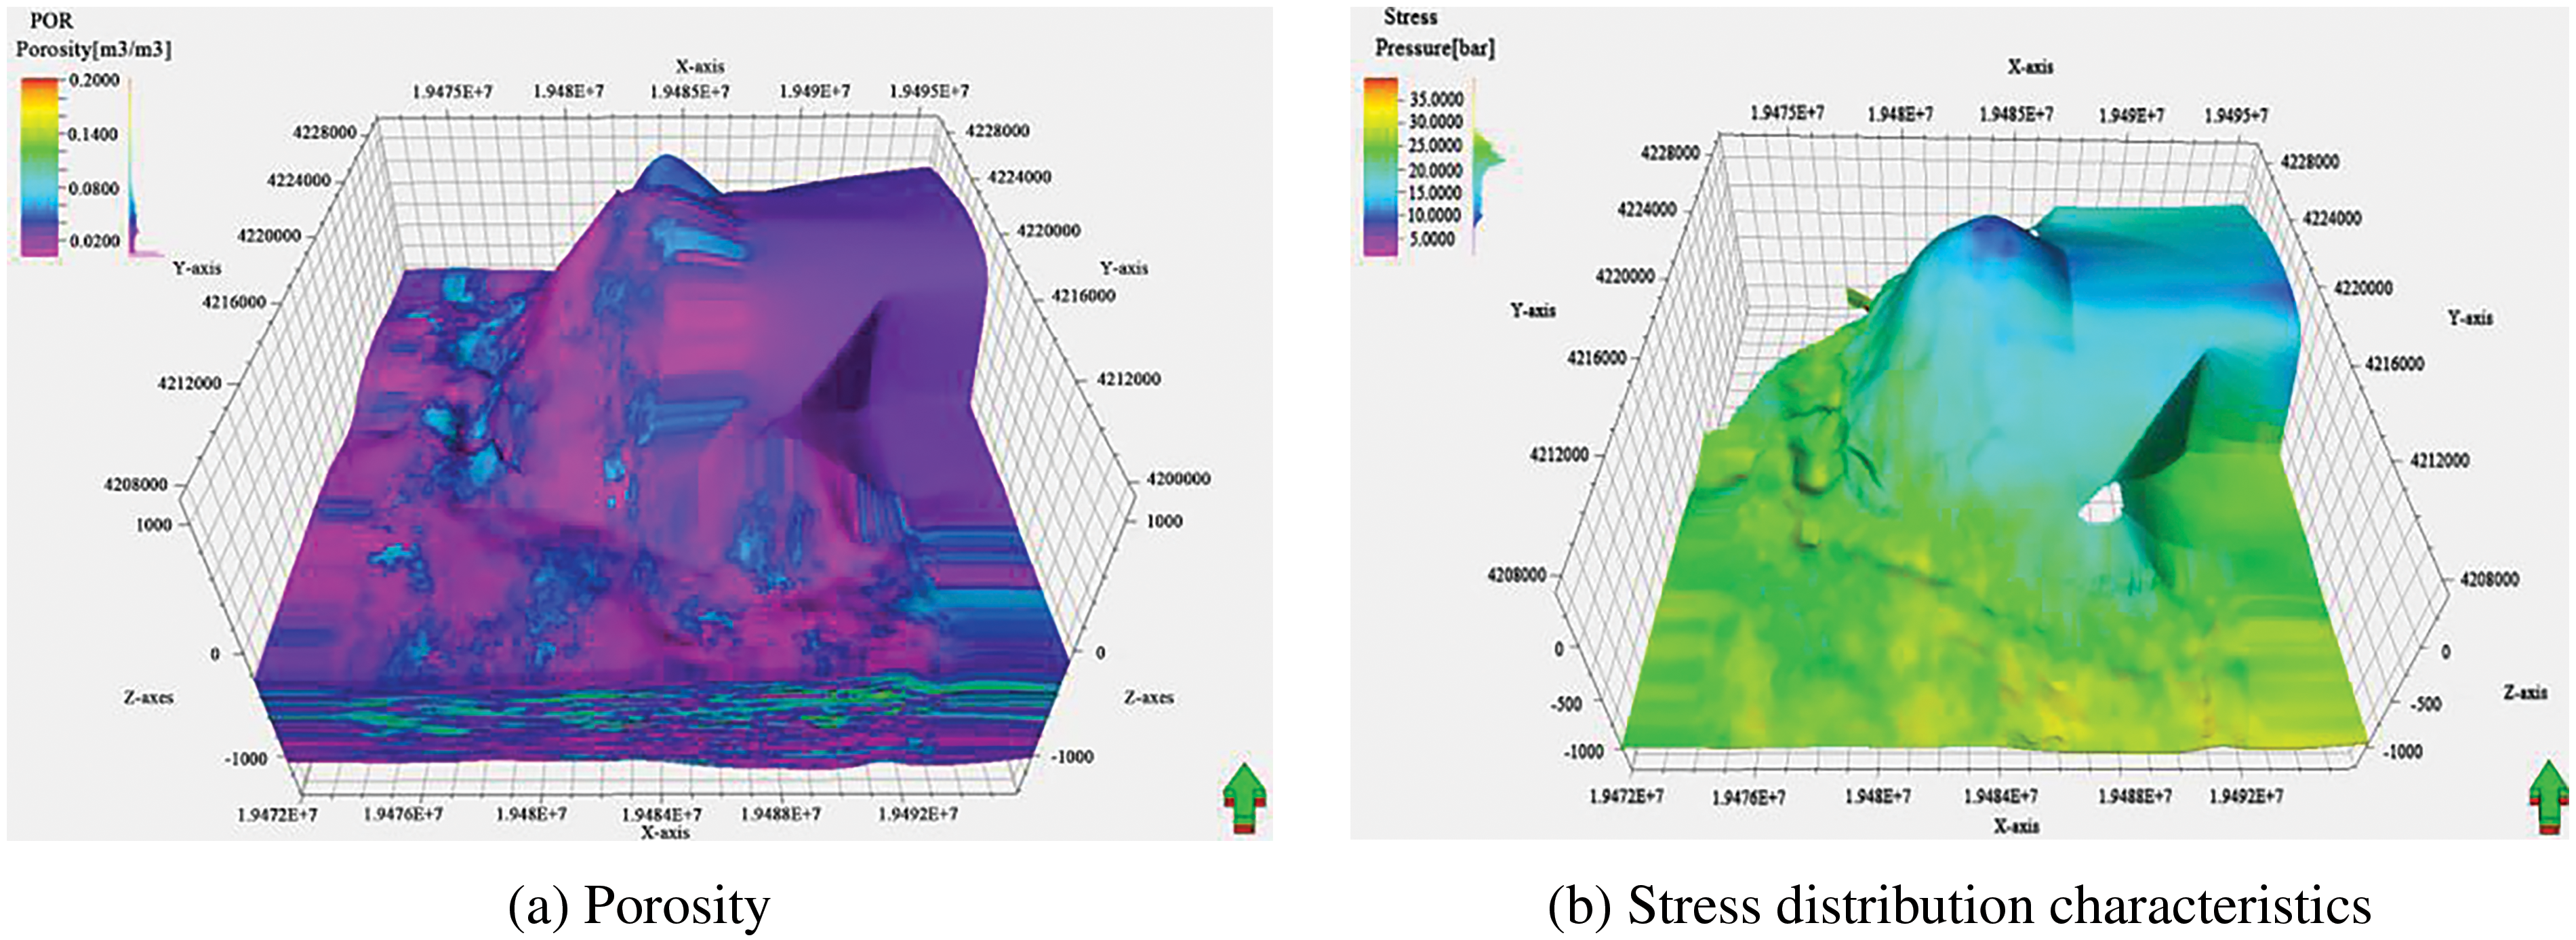
Figure 2: The results of 3D geological and stress modeling of the block are studied
3 Analysis of Main Controlling Factors of Gas Production
3.1 Collected Data Characteristics
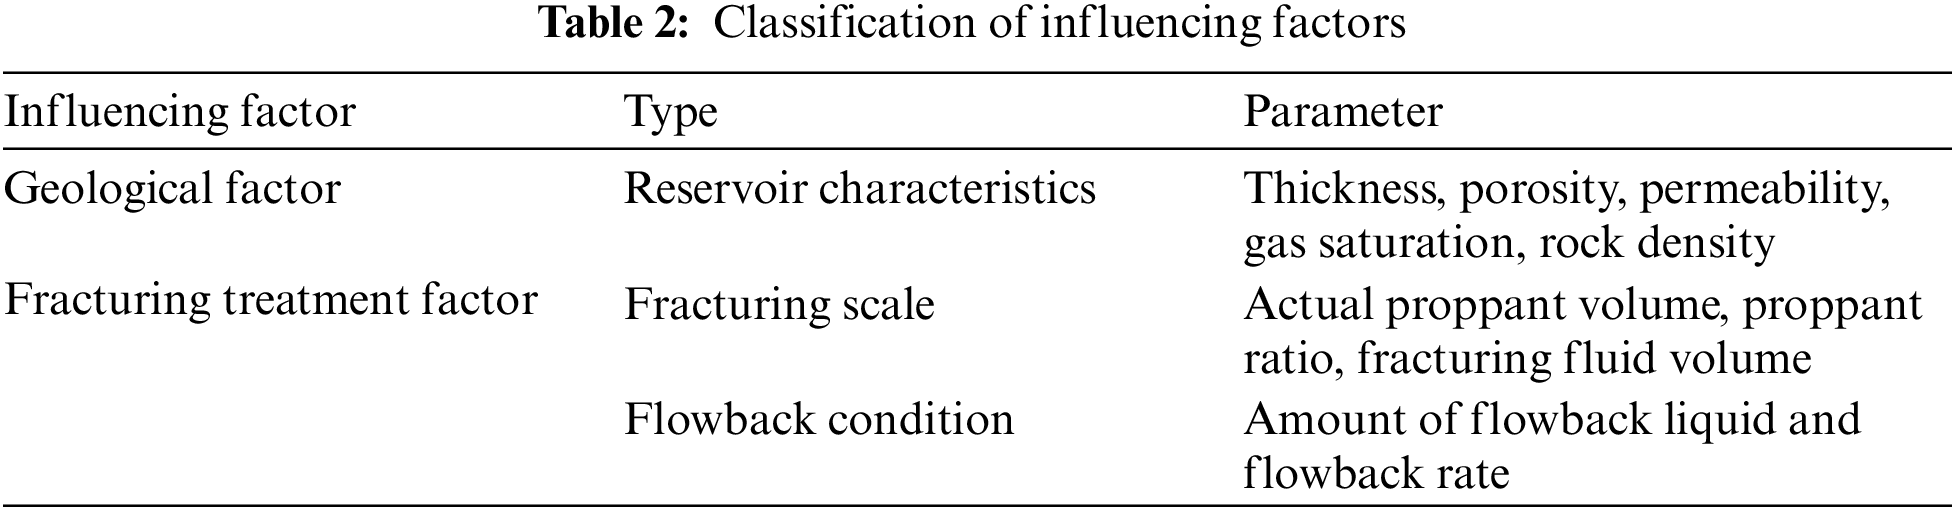
The original data was analyzed and processed to obtain data from 125 Wells in two development zones, including the pilot. The preliminary screening analysis of these data shows that the influencing factors of fracturing productivity in this block can be divided into geological factors and fracturing engineering factors, etc. Gas production rate is used to measure fractured well productivity, and a total of 12 influencing factors are screened, as shown in Table 2.
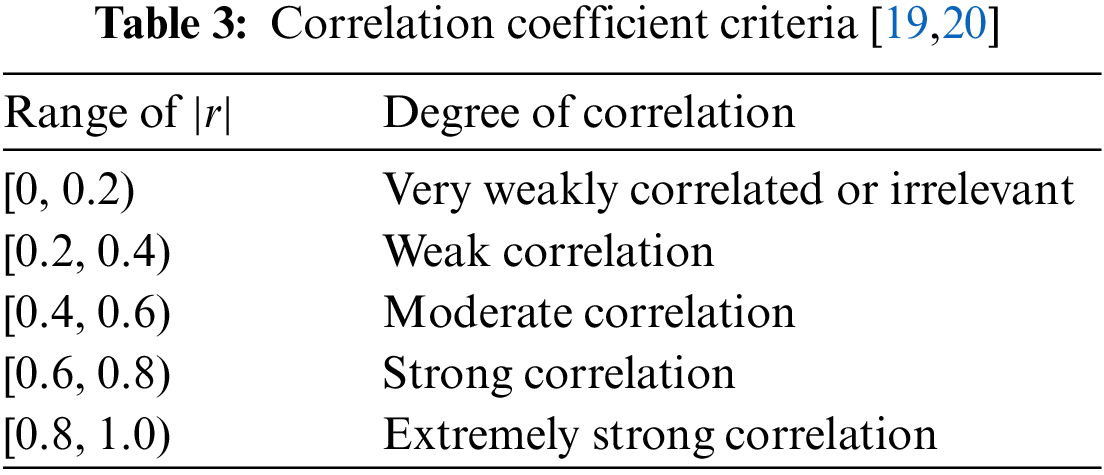
Correlation coefficient indexes in statistics mainly include Spearman, Pearson and Kendall correlation coefficients. The coefficient index was originally based on bivariate data (X1, Y1), (X2, Y2),... Since the sample statistics of (Xn, Yn), data (X, Y) are Independent and idendistributed, with continuous joint distribution function H of marginal F and G, respectively [17]. In 1959, Sklar introduced the copula theory and expressed C: [0, 1] × [0, 1] → [0, 1] as a copula function, making H(x, y) = C(F(x), G(y)). For the continuous distribution function, copula function is unique [18]. The Copula function describes the dependence between X and Y, and the dependence does not change, only the marginal distribution function changes with the transformation. The correlation coefficient r reflects the correlation degree of the linear relationship between the two variables. The range [−1, 1], the closer the absolute value is to 1, the closer the relationship between the two variables is. The correlation coefficient standard is shown in Table 3. Considering the requirement of normal distribution and linear relationship of data when using Spearman and other methods, the Spearman correlation coefficient method is adopted to analyze fracturing parameters.
Spearman correlation coefficient is a kind of rank correlation coefficient. Compared with the Spearman correlation coefficient, it does not have many restrictions (such as conforming to a normal distribution and large capacity), and it is not affected by outliers and is suitable for nonlinear data analysis. For Spearman’s correlation coefficient, you do not need to care about how the data changes and what kind of distribution it fits, you just need to care about the position of the corresponding value of each variable. The total parameter ρs can also be expressed in terms of consistent and inconsistent pairs, similar to Kendall correlation coefficients, but requires three pairs of binary random variables (X1, Y1), (X2, Y2) and (X3, Y3). The parameters are defined as follows:
Spearman’s correlation coefficient rs is defined as:
3.3 Main Control Factor Determination
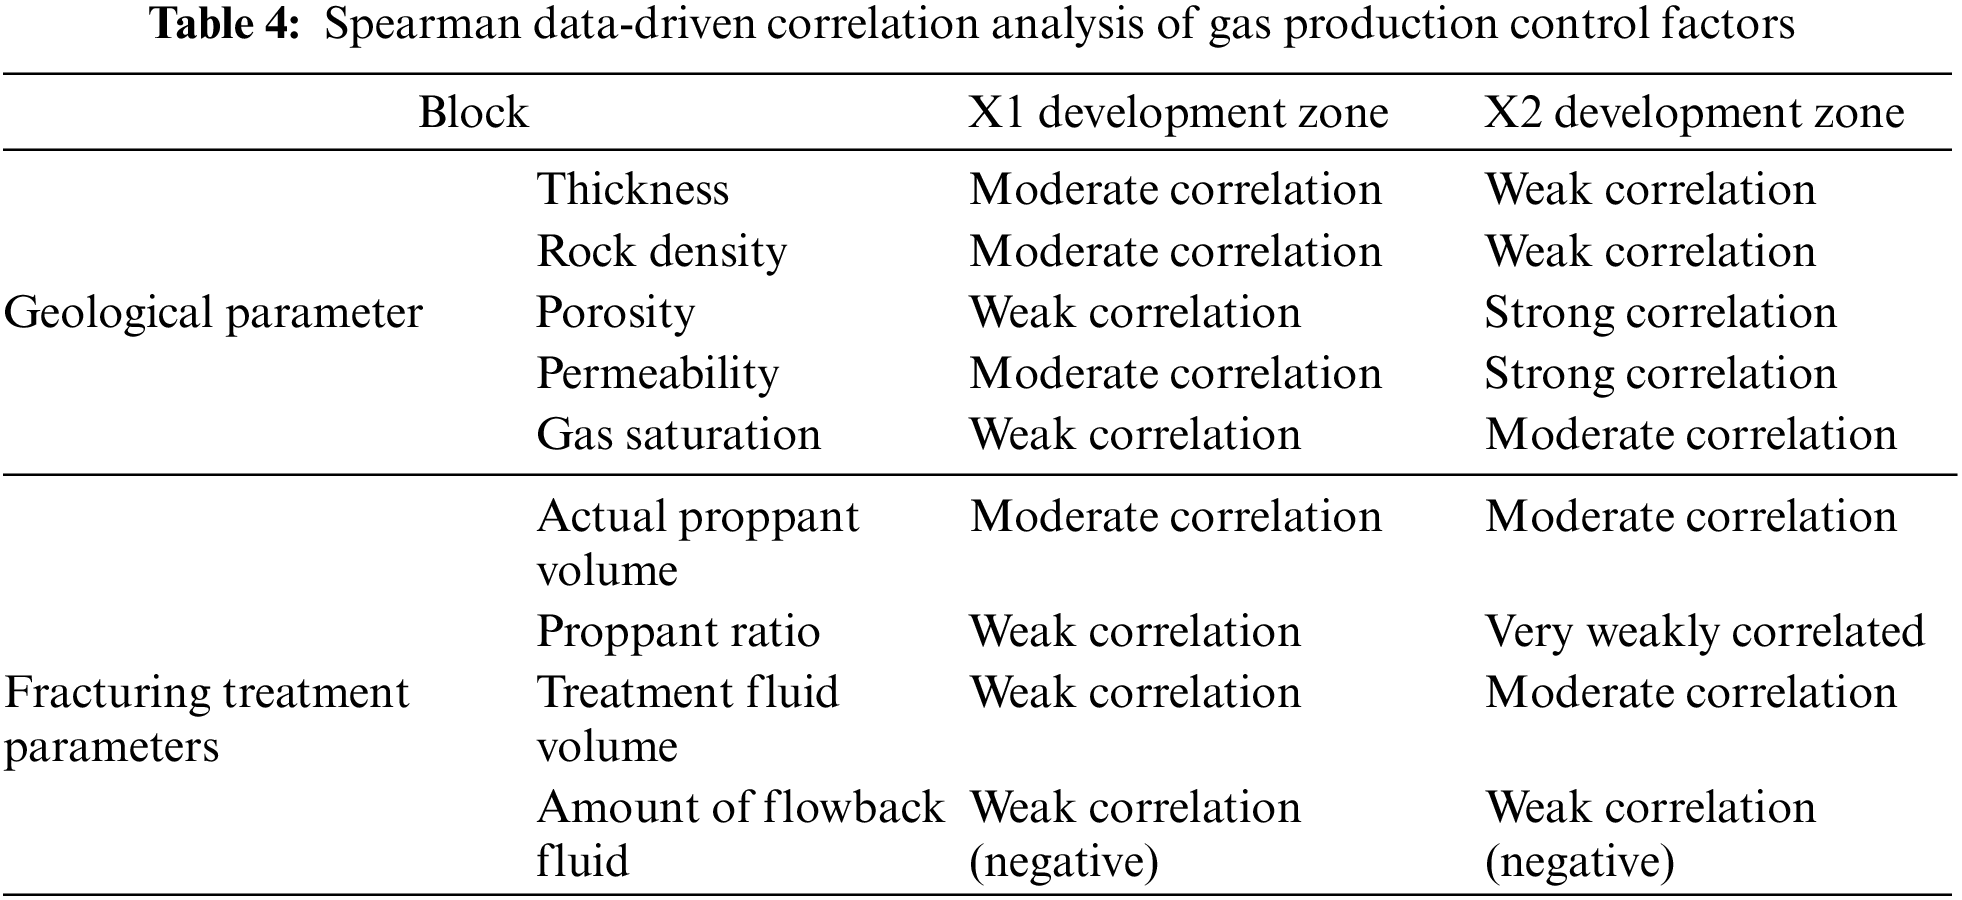
Based on the above three analysis methods, data-driven analysis of geological and fracturing treatment-related parameters of two blocks in the study block was completed. Table 4 presents the analysis results. Among them, the thickness, permeability, porosity, and gas saturation of geological parameters in the X2 production area were highly correlated with the amount of treatment fluid in fracturing treatment parameters. However, the gas flow rate in the X1 production zone had a relatively modest correlation with geological and engineering parameters. Only the thickness and the actual amount of proppant added affected the production of the final fractured well, indicating that these parameters have a strong influence. The results of Kendall Spearman correlation analyses are similar to those of Spearman correlation analysis.
Taking the X1 and X2 development zones of the study block as examples, both development zones are tight sandstone gas reservoir blocks, with development horizons dominated by Shihezi 7 and Shihezi 8. The lithology of the blocks is similar, and the fracturing and reconstruction techniques used are similar. However, the gas production rates of the two development zones are quite different. The statistical results of gas production rates of typical wells are shown in Fig. 3.
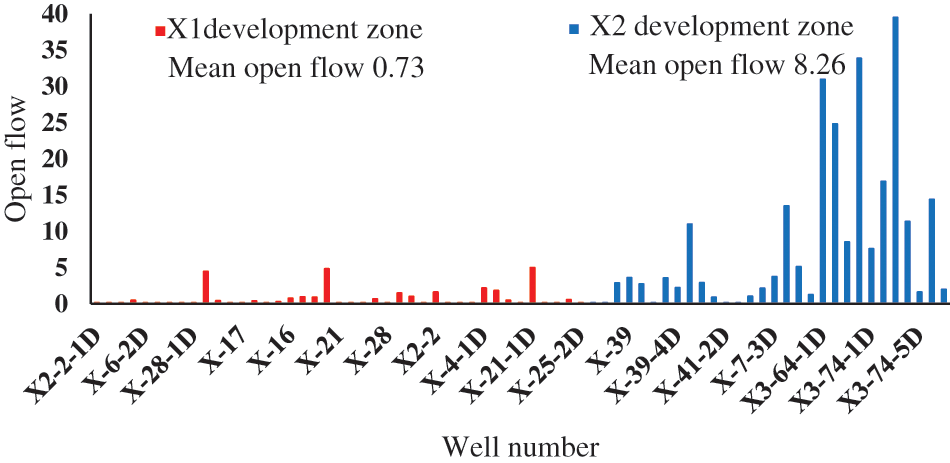
Figure 3: Comparison of gas production in X1 and X2 development zones
4.1 Difference Analysis of Geological Factors
Fig. 4 shows the comparison of geological parameters. The average porosity and gas saturation in the X2 development zone were similar to those in the X1 development zone (less than 10% difference). However, the average reservoir thickness and permeability increased by 32.95% and 33.65%, respectively. Therefore, it was found that the gas flow differential in the X1 and X2 development zones was greatly influenced by geological factors such as reservoir thickness and permeability. This result is also related to the deviation in understanding the well and layer selection in this area during the early development stage. With the continuous development and progress of new exploration technology, the development horizon can gradually approach the area with a better geological sweet spot. However, in the case of the X1 development zone, geological understanding is lacking, resulting in a poor selection of predevelopment wells in the optimal perforating zone.
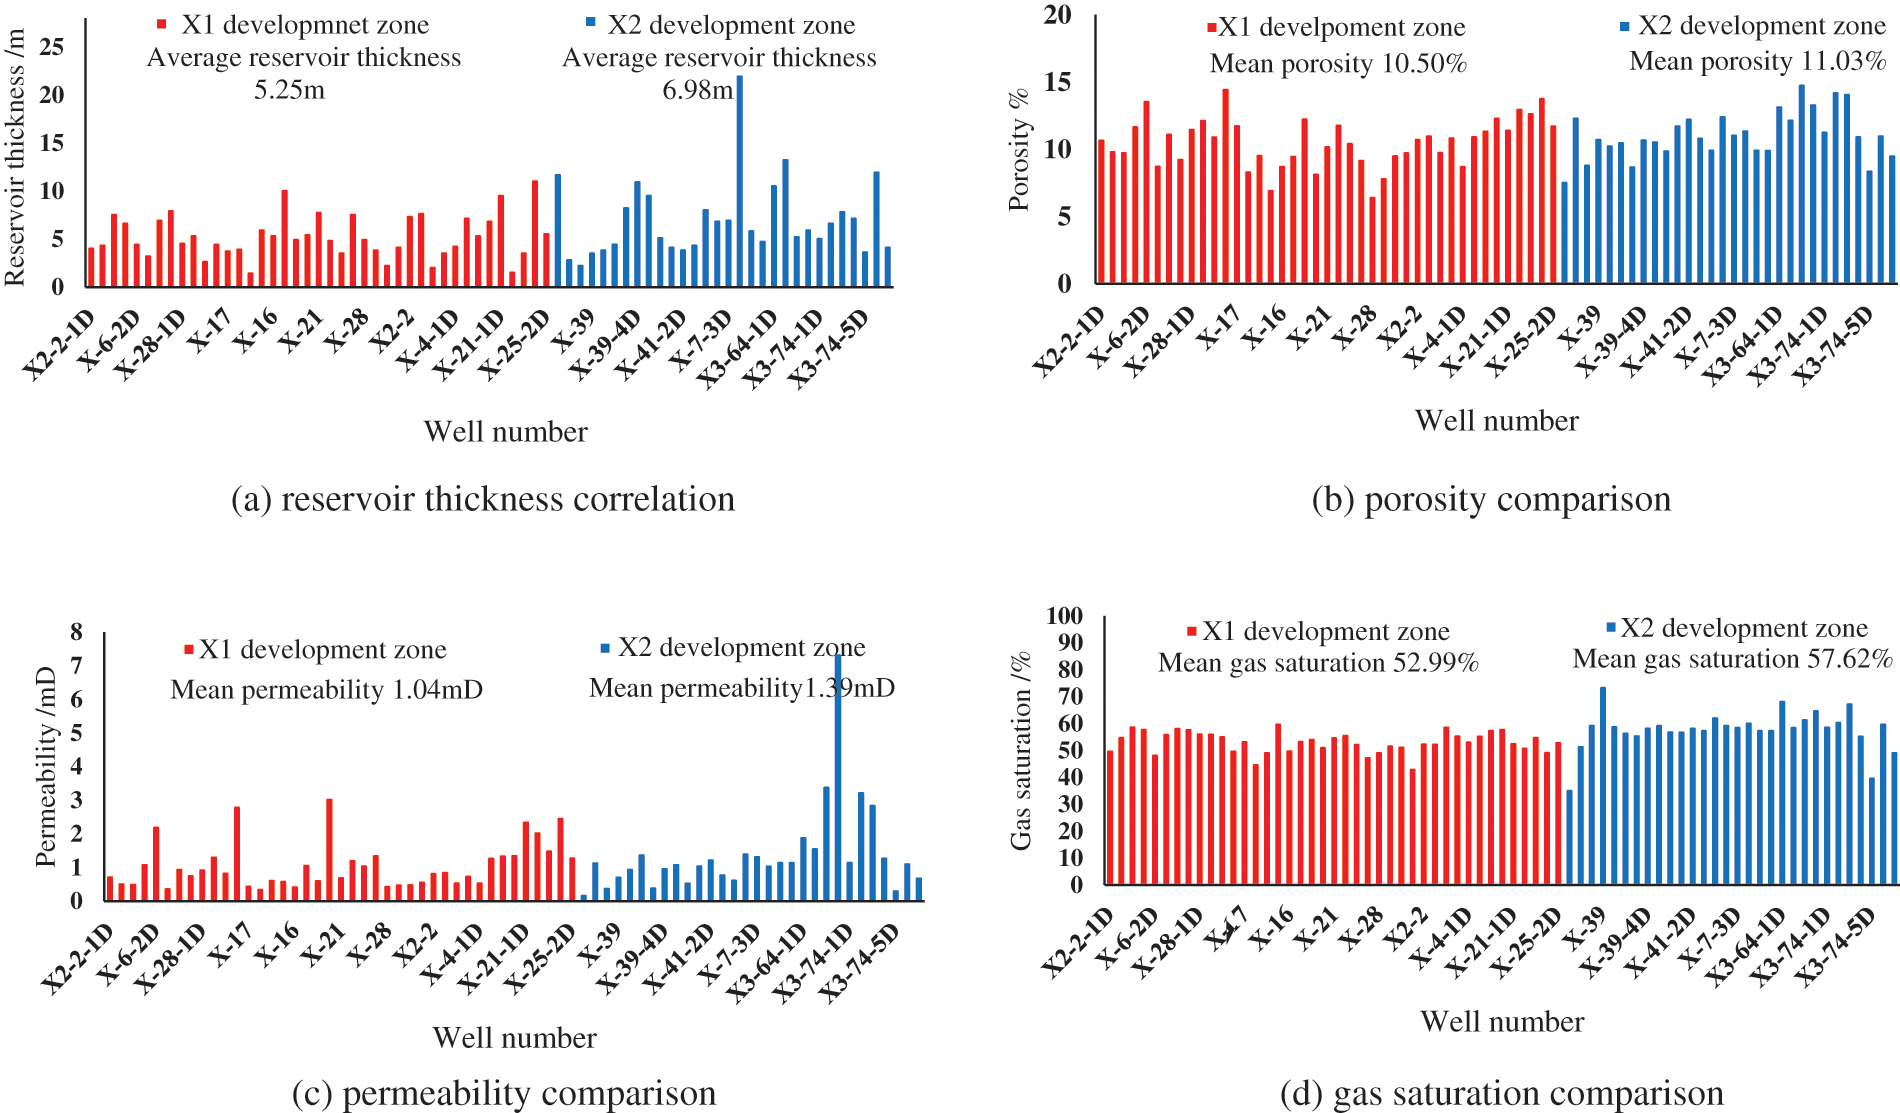
Figure 4: Comparisons of geological parameters in X1 and X2 development zones
4.2 Analysis of Variance of Engineering Factors
Fig. 5 shows the comparison of fracturing treatment parameters. A similar transformation method was adopted for fracturing in the X1 and X2 development zones, and there was little difference in the actual proppant volume and proppant ratio parameters. Compared with the X1 development zone, the average treatment fluid volume in the X2 development zone increased by 42%. The correlation analysis showed that the treatment fluid volume in X1 and X2 development zones was highly correlated with the gas flow. The average flow-back volume in the X2 development zone was 40% less than that in the X1, and the flow-back rate was less than half of that in the X1 production zone. After fracturing in the study block, the gas flow rate decreased with an increase in the actual fracturing fluid flow-back rate. This is because the reservoir physical property in the location of the fracturing well is relatively good; therefore, the volume of fracturing fluid into the ground will be smaller, and the fracturing effect will be better. The results of correlation analysis showed that the amount of flow-back liquid and rate was negatively correlated with the gas flow rate, and the flow-back rate had a more significant influence. Therefore, the difference in gas flow in X1 and X2 development zones is greatly affected by the amount of treatment fluid and proppant addition, which indicates that the geological condition of the X2 development zone is better than that of X1.
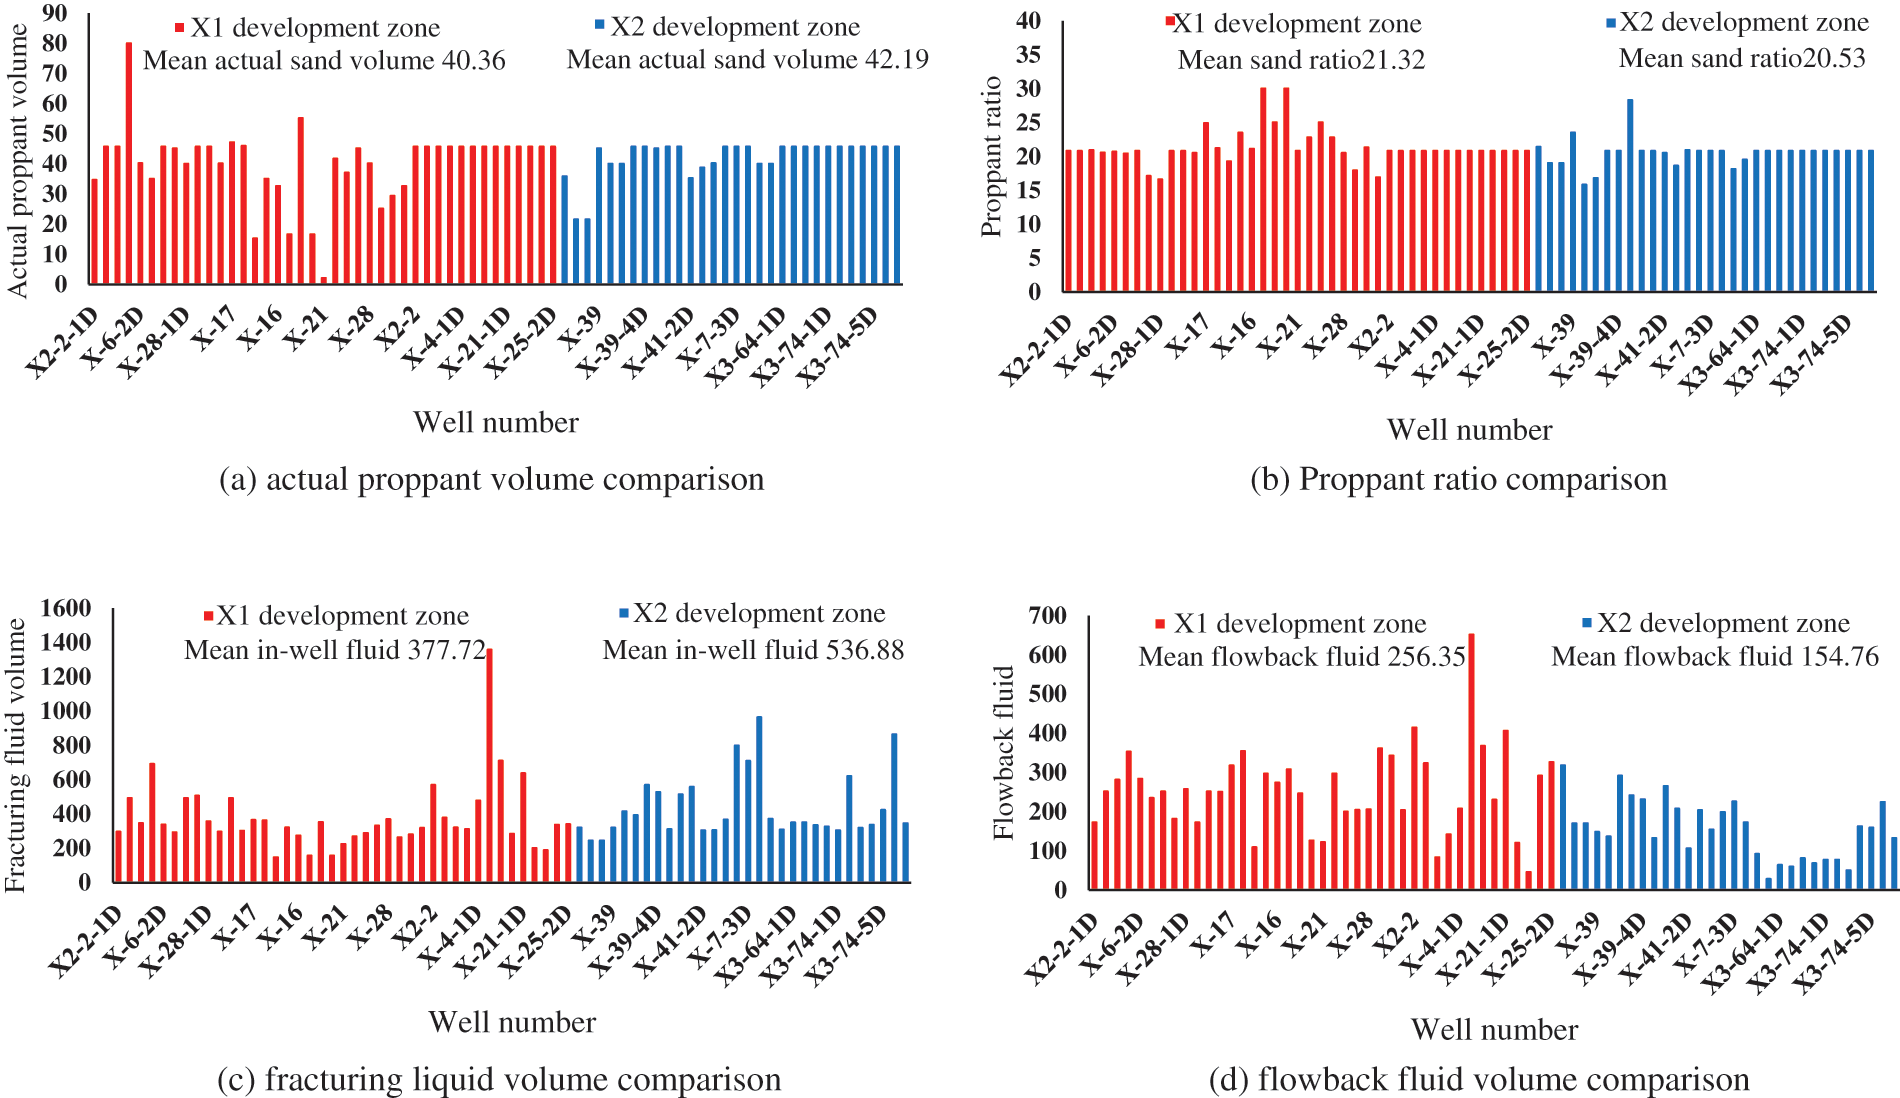
Figure 5: Comparison of engineering parameters of X1 and X2 development zones
4.3 Example of Data Driven Fracturing Parameter Optimization
After combining the data analysis results, it was found that the key parameters affecting the gas flow rate of the two blocks were not the same. Therefore, the basic data of multiple wells in this block was further used to conduct numerical simulations of fracturing production. The personalized fracture parameter optimization of different blocks was achieved using the dual-driven method of theory and data. Using the integrated fracturing numerical simulation software of geological engineering, two typical wells in X1 and X2 development zones, L1 and L2, were selected to analyze the numerical simulation results of fracture parameter optimization, and the change law of the modified volume after optimization was compared. The selected well L1 and L2, were buried between 1400 and 1500 m, and the main formation was situated in the He7 Member. The drilling rate of the sand body was 96.44%, and the geomechanical characteristics of the two wells were similar, with Young’s modulus between 17.76 and 24.52 GPa. The brittle index of both wells was between 65 and 76, and the different coefficients of horizontal stress were about 0.2. Both wells were treated with a tight sandstone gas fracturing liquid system with low temperature and low concentration of melon gum.
Fig. 6 shows the fracturing numerical simulation results. The length of the fractured well L1 was 148 m, and the fracture width was about 4.2 mm, whereas the length of the fractured well L2 was 91 m, and the fracture width was about 3.7 mm. The production of the fractured wells under different conditions was simulated by changing the treatment parameters, as shown in Fig. 7. According to the simulation results of fracture parameter optimization, it was observed that for the well L1 in the X1 development zone, the production of fracturing reconstruction showed a slow-increasing trend with a continuous increase in liquid injection volume, but the overall increase was not significant. However, the increase in proppant addition during fracturing showed a downward trend after increasing to a certain range. On the other hand, for well L2 in the X2 development zone, the production of fractured wells gradually increased with an increase in the fluid used strength and proppant-added volume. When the production of fractured wells reached a certain level, the injected fluid and liquid filtration volumes reached a balance. It was challenging to increase the production by increasing the fluid used volume. However, increasing the strength of sand addition can increase the effective support reconstruction volume and thus increase production. When the strength of sand addition reaches a certain value, the fracture conductivity meets the tight gas conductivity, which can increase the treatment displacement. The optimized liquid and proppant volumes were adopted for different fracture stage lengths. By comparing the simulation scheme with the field treatment examples, the development strategies of the X1 and X2 development zones were further determined. The perforation interval in the X1 development zone was further optimized to ensure that the advantageous geological sweet spot is fully utilized, whereas the X2 development zone can improve the production of a single well through fracturing measures such as optimizing the discharge rate and proppant injection intensity. The optimization technology was applied to 12 wells in this area, and the average test production reached 5.56 × 10⁴ m3, achieving the purpose of commercial development.
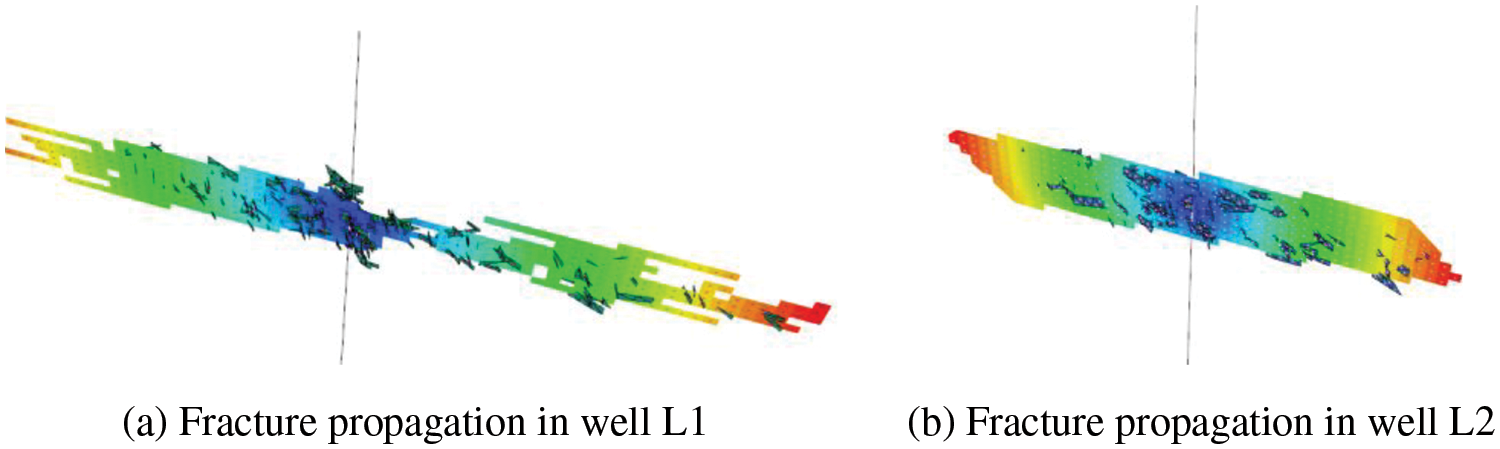
Figure 6: The numerical simulation results of fracture propagation in well L1 and well L2 were studied
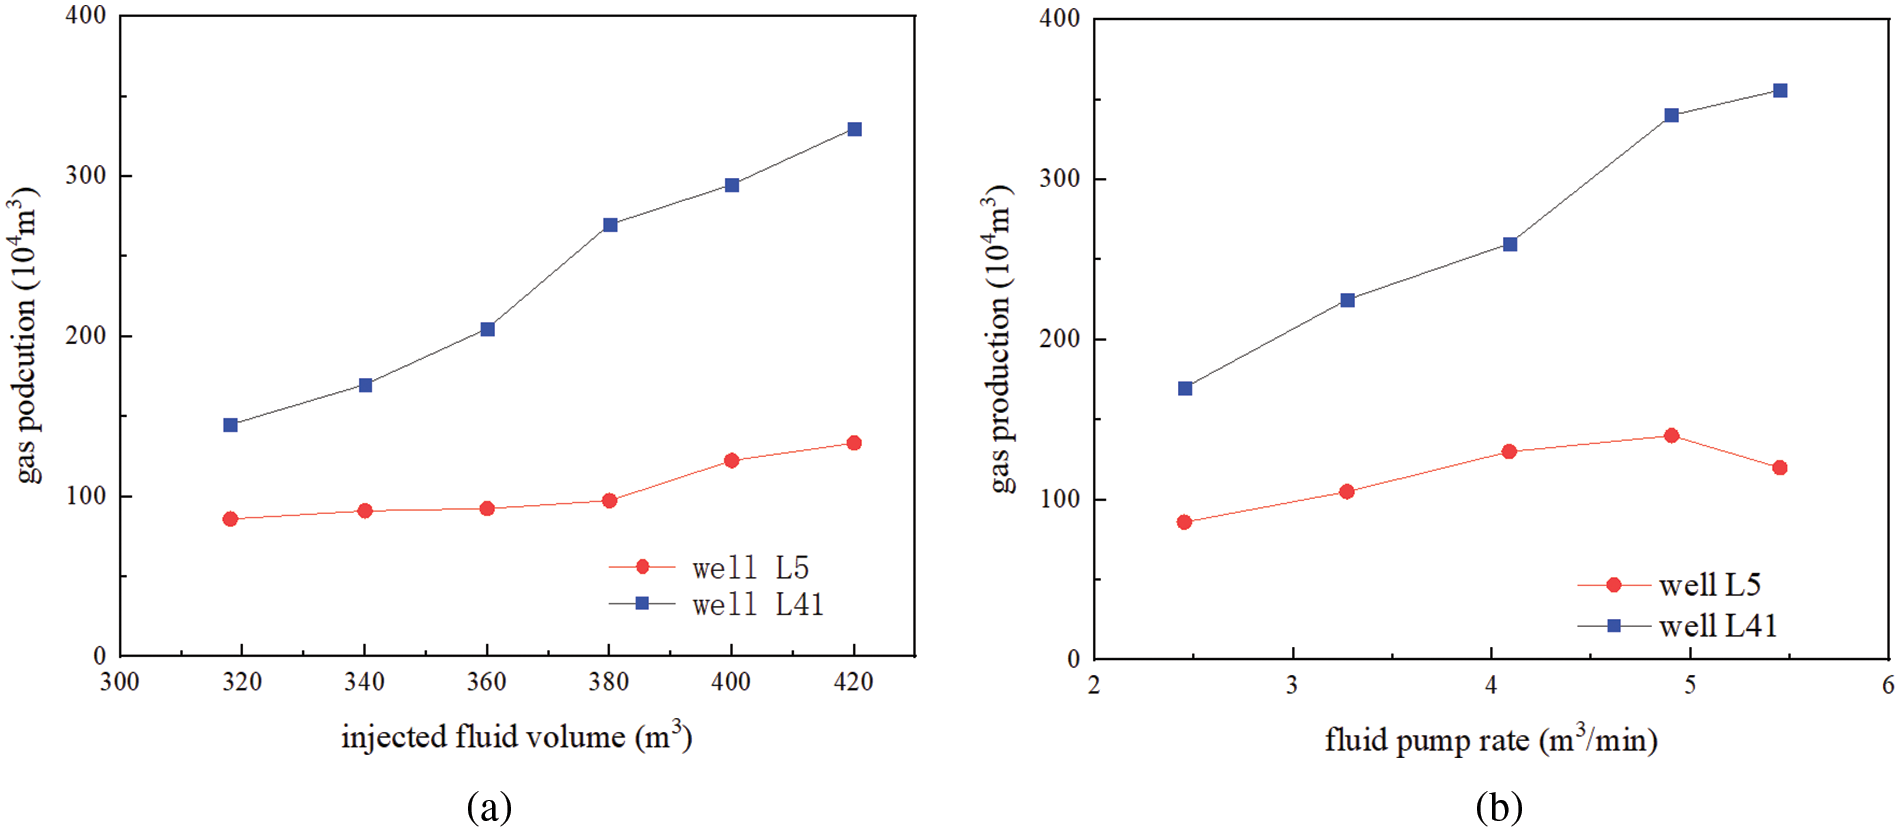
Figure 7: Comparison of numerical simulation results of gas production under different fracturing parameters in the research block
(1) The data screening was carried out to identify outliers in the entire data and the data-driven fracturing parameter optimization method can obtain the basic adjustment direction of reservoir stimulation in the target block, and the influences of geological, stimulation and completion parameters on gas production rate can be obtained. After that, the optimization design of fracturing parameters was further conducted with the help of data analysis. The research workflow can significantly reduce the modeling and simulation workload and guide the on-site improvement and optimization of the final fracturing effect.
(2) The gas flow rate after fracturing in the study block decreases with an increase in the actual fracturing fluid flow-back rate. This is because the reservoir’s physical property in the location of fracturing wells is relatively good. The smaller the volume of fracturing fluid flowing back to the surface, the better the fracturing effect. The correlation analysis results of fracturing treatment parameters show that flow-back fluid volume and rate are negatively correlated with gas flow rate, and the flow-back rate has a more significant influence.
(3) It is suggested to further optimize the perforation interval in the X1 development zone to ensure that the advantageous geological sweet spot is fully utilized, while the X2 development zone can improve the production of a single well by optimizing the flow rate and proppant injection intensity. Considering the larger density and density of the reservoir in the X2 development zone, the difficulty of fracturing and the ease of fracture closure after fracturing, similar development zones need to optimize fracturing parameters and select the appropriate proppant type to increase the reservoir reconstruction volume.
Acknowledgement: The authors acknowledge the CNOOC Research Institute Co. for their support in this project. In addition, special thanks for Teng Zhang from Yuanwang Jingsheng Technology Development Co., Ltd. for the fracturing numerical simulation test.
Funding Statement: This research is funded by Research and Application of Key Technologies for Tight Gas Production Improvement and Rehabilitation of Linxing Shenfu (YXKY-ZL-01-2021).
Author Contributions: The authors confirm contribution to the paper as follows: study conception and design: Zhengrong Chen; data collection: Mao Jiang, Xin Xie; analysis and interpretation of results: Jianshu Wu; draft manuscript preparation: Zhengrong Chen, Chuanzhi Ai. All authors reviewed the results and approved the final version of the manuscript.
Availability of Data and Materials: The data used in this study are from a tight gas reservoir in Ordos.
Conflicts of Interest: The authors declare that they have no conflicts of interest to report regarding the present study.
References
1. Wu, L., Dong, Z. Z., Li, W. R., Jing, C., Qu, B. C. (2021). Well-logging prediction based on hybrid network mode. Energies, 14, 83–85. [Google Scholar]
2. Li, W. R., Dong, Z. Z., Lee, J. W., Ma, X. L., Qian, S. H. (2022). Development of decline curve analysis parameters for tight oil wells using a machine learning algorithm. Geofluids, 2022, 8441075. [Google Scholar]
3. Albahrani, H., Papamichos, E., Moruta, N. (2021). Building an integrated drilling geomechanics model using a machine-learning assisted poro-elasto-plastic finite element method. SPE Journal, 26(4), 1893–1913. [Google Scholar]
4. Vikara, D., Remson, D., Khanna, V. (2020). Machine learning informed ensemble framework for evaluating shale gas production potential: Case study in the Marcellus shale. Journal of Natural Gas Science and Engineering, 84, 103679. https://doi.org/10.1016/j.jngse.2020.103679 [Google Scholar] [CrossRef]
5. Ren, G. L., Luo, Y., Gao, Z. B. (2021). Evaluation of main factors affecting horizontal well productivity for the Ordovician carbonate gas reservoir in Daniudi gas field. Fault-Block Oil & Gas Field, 28(1), 104–108. [Google Scholar]
6. Bhattacharya, S., Nikolaou, M. (2016). Comprehensive optimization methodology for stimulation design of low-permeability unconventional gas reservoirs. SPE Journal, 21(3), 947–964. https://doi.org/10.2118/147622-PA. [Google Scholar] [CrossRef]
7. Alfarge, D., Wei, M., Bai, B. (2019). Evaluating the performance of hydraulic fractures in unconventional reservoirs using production data: Comprehensive review. Journal of Natural Gas Science and Engineering, 61, 133–141. https://doi.org/10.1016/j.jngse.2018.11.002 [Google Scholar] [CrossRef]
8. Pankaj, P., Geetan, S., Macdonald, R., Shukla, P., Menasria, S. et al. (2018). Application of data science and machine learning for well completion optimization. Offshore Technology Conference, 28632. [Google Scholar]
9. Liang, Y., Zhao, P. (2019). A machine learning analysis based on big data for eagle ford shale formation. SPE Annual Technical Conference and Exhibition, 196158. [Google Scholar]
10. Luo, G., Tian, Y., Bychina, M. (2019). Production strategy insighes using machine learning: Application for Bakken shale. SPE Reservoir Evaluation & Engineering, 22, 800–816. https://doi.org/10.2118/195681-PA. [Google Scholar] [CrossRef]
11. Xu, J. X., Yang, L. F., Ding, Y. H. (2020). Influencing factors on the productivity of the volume-fractured horizontal well in the tight oil reservoir. Petroleum Geology & Oilfield Development in Daqing, 39(1), 162–168. [Google Scholar]
12. Sun, B., Liu, L. F., Ding, J. H. (2017). Main geologic factors controlling the productivity of horizontal wells in tight oil reservoirs. Special Oil and Gas Reservoirs, 24(2), 115–119. [Google Scholar]
13. Sun, J., Liu, D. H., Dong, C. Y. (2016). Horizontal-well productivity estimation by big data mining in tight gas reservoir. Special Oil and Gas Reservoirs, 23(5), 74–77. [Google Scholar]
14. Alghamdi, A. A., Almutairi, N. S., Muslim, A., Khaldi, H., Abdulraheem, A. (2021). Development of a gas flow rate model for multi-stage choke system in HPHT gas wells using artificial intelligence. SPE Europec featured at 82nd EAGE Conference and Exhibition, 205163. Netherlands, Amsterdam. [Google Scholar]
15. Rollins, B. T., Broussard, A., Cummins, B., Smiley, A., Dobbs, N. (2017). Continental production allocation and analysis through big data. Unconventional Resources Technology Conference, 2678296. [Google Scholar]
16. Trung, T. N., Truong, T. H., Tung, T. V., Hai, N. H., Khoa, D. Q. et al. (2022). Virtual multiphase flowmetering using adaptive neuro-fuzzy inference system (ANFISA case study of Hai Thach-Moc Tinh field, offshore vietnam. SPE Journal, 27(1), 504–518. https://doi.org/10.2118/206741-PA. [Google Scholar] [CrossRef]
17. Van, D., Heuvel, E., Zhang, Z. Z. (2022). Myths about linear and monotonic associations: Spearman’s r, Spearman’s ρ, and Kendall’s τ. The American Statistician, 76(1), 44–52. https://doi.org/10.1080/00031305.2021.2004922 [Google Scholar] [CrossRef]
18. Sklar, A. (1959). Fonctions de répartition à n dimensions et leurs marges. Annales de l’ISUP, 8, 229–231. [Google Scholar]
19. Xiao, Y., Wang, J. H., Li, Z. G., Yang, J. Y., Liu, S. Y. (2022). Study on production difference analysis method of shale oil play based on big data. Drilling and Production Technology, 45(3), 73–78. [Google Scholar]
20. Schweizer, B., Wolff, E. F. (2018). On nonparmateric measures of dependence for random variables. In: The annals of statistics, pp. 9879–9885. [Google Scholar]
Cite This Article
 Copyright © 2024 The Author(s). Published by Tech Science Press.
This work is licensed under a Creative Commons Attribution 4.0 International License , which permits unrestricted use, distribution, and reproduction in any medium, provided the original work is properly cited.
 Downloads
 Citation Tools