 Open Access
ARTICLE
Energy-Efficient and Cost-Effective Approaches through Energy Modeling for Hotel Building
1 Graduate Institute of Precision Manufacturing, National Chin-Yi University of Technology, Taichung, 41170, Taiwan
2 Department of Refrigeration, Air Conditioning and Energy Engineering, National Chin-Yi University of Technology, Taichung, 41170, Taiwan
* Corresponding Author: Fujen Wang. Email:
Energy Engineering 2024, 121(12), 3549-3571. https://doi.org/10.32604/ee.2024.056398
Received 22 July 2024; Accepted 13 September 2024; Issue published 22 November 2024
Abstract
Hotel buildings are currently among the largest energy consumers in the world. Heating, ventilation, and air conditioning are the most energy-intensive building systems, accounting for more than half of total energy consumption. An energy audit is used to predict the weak points of a building’s energy use system. Various factors influence building energy consumption, which can be modified to achieve more energy-efficient strategies. In this study, an existing hotel building in Central Taiwan is evaluated by simulating several scenarios using energy modeling over a year. Energy modeling is conducted by using Autodesk Revit 2025. It was discovered from the results that arranging the lighting schedule based on the ASHRAE Standard 90.1 could save up to 8.22% of energy consumption. And then the results also revealed that changing the glazing of the building into double-layer low-emissivity glass could reduce energy consumption by 14.58%. While the energy consumption of the building could also be decreased to 7.20% by changing the building orientation to the north. Meanwhile, moving the building location to Northern Taiwan could also minimize the energy consumption of the building by 3.23%. The results revealed that the double layer offers better thermal insulation, and low-emissivity glass can lower energy consumption, electricity costs, and CO2 emissions by up to 15.27% annually. While adjusting orientation and location can enhance energy performance, this approach is impractical for existing buildings, but this could be considered for designing new buildings. The results showed the relevancy of energy performance to CO2 emission production and electricity expenses.Keywords
Hotel buildings are categorized as one of the highest energy consumers in buildings. According to the Energy Audit Annual Report 2023 by The Bureau of Energy (BOE) of Taiwan, hotel buildings contributed 5.61% of annual energy consumption in Taiwan after hospitals (16.42%), transportation (13.11%), education buildings (11.62%), department stores (10.24%), and office buildings (7.59%). Even though the number is relatively low compared to other sectors, in terms of energy efficiency, hotel buildings have the third highest average energy use intensity (EUI) with a value of 188.3 kWh/m2/year, compared to other building sectors; healthcare facilities 224.0 kWh/m2/year, department stores 225.2 kWh/m2/year, office buildings 115.1 kWh/m2/year, governmental affairs 87.7 kWh/m2/year, and education building 66.3 kWh/m2/year. To the point that hotel buildings in Taiwan are not energy efficient. Moreover, based on its power flow, hotel buildings consume 57.60% of their energy consumption for HVAC systems, 11.90% for lighting systems, and the rest for other equipment [1]. With this information, to improve the energy efficiency of hotel buildings, it is essential to investigate every factor, such as high-consuming energy equipment and other factors that influence the energy efficiency of hotel buildings.
Recognizing the sources of problems is crucial for enhancing building performance. Conducting an energy audit helps identify weaknesses in an energy use system and determine potential energy savings in existing buildings. An energy audit essentially evaluates the energy performance of a building. This process includes reviewing utility bills to comprehend consumption patterns, analyzing energy usage through equipment measurement and inspection, surveying occupant behavior, examining electrical systems like HVAC, investigating operational hours, and studying local climate data [2]. Spudys et al. [3] conducted an energy audit and energy modeling to evaluate the energy-efficient potential. Energy audit results can be useful as the parameters to extract the necessary information for conducting energy modeling to simulate various energy efficiency approaches. Case studies are carried out using REVIT energy modeling tools to evaluate building envelope modifications and their impact on energy consumption and economic parameters. The energy modeling results were analyzed to determine the potential improvements and effectiveness of the existing building [4]. The other benefit of conducting an energy audit is that the results data of energy audit can be used to evaluate the credibility and validity of energy modelling results from energy modelling tools used in a research study. This could assess the accuracy in quantifying energy saving potential of various energy approaches [5].
Various factors influencing building energy performance, including occupancy rate, climate condition, building orientation, occupancy behavior, and control algorithms, are often overlooked and not considered [6]. One of the energy-saving strategies carried out by Lee et al. [7] is evaluating the impact of lighting and plug load variation on the energy performance of a residential building. The findings revealed that differing lighting load patterns could affect building energy performance by up to 23%. Additionally, Ye et al. [8] have conducted a similar study on implementing the ASHRAE Standard 90.1 lighting, occupancy, and equipment load schedule on commercial buildings through energy modeling. The results revealed that this method significantly saves more energy than space-specific methods. In addition, the lighting system affects the thermal environment inside of building which could impact on the cooling demand and influence the cooling system energy consumption. Changing the pattern of the lighting system might significantly save the overall energy consumption of a building [9]. On top of that, controlling the lighting system, such as light illumination and time pattern, could save lighting system energy consumption up to 54%. This approach also reduces 2%–5% of air conditioning system energy consumption. And the overall energy consumption could be reduced up to 9%–10%. This occurred due to the reduced heat generation of the lighting during the operation period, and less frequent the lighting system used may reduce the energy consumption as well [10].
Building envelope influences the thermal transmittance from outside to inside of a building. A window is a building envelope mostly used in a building environment, especially in hotel buildings. Utilizing the glazing might be the potential energy approach to mitigate the energy efficiency of a building. Windows transmit much more heat than common walls because their material is mainly glass. Different types of glazing utilization result in different heat transfer inside buildings. The most common glazing type is single-layer clear glass. Mujeebu et al. [11] compared the use of single-layer glazed windows and double-layer glazed windows in terms of energy-saving potential through energy modeling. The findings revealed that double-layer glazed windows provide lower cooling energy demand, ranging from 18% to 28%. These results will save the overall energy consumption of the building. Moreover, low-emissivity tinted windows could also be a design consideration since the low emissivity reduces the solar heat transmittance and glare into the building and compromises more visual and thermal comfort to the occupants, specifically in residential spaces [12,13]. This way, the cooling load of the spaces will be significantly reduced and induced the cooling energy consumption will be up to 30% [14]. Similarly, Pekdogan et al. [15] evaluated the potential for improving energy performance in residential space by replacing window glazing with lower emissivity and U value through energy modeling using REVIT energy modeling tools. The study found that utilizing the glass type with a lower U value significantly improves energy performance. This approach could contribute to building design development and practices in enhancing building energy performance by retrofitting the window [16].
However, the orientation of a building may affect the cooling load demand because the pattern of the sun throughout the year and the location of the building itself provide different climate conditions [17]. Moreover, Gupta et al. [18] found that the building orientation variables and the material properties of building envelopes have different energy-saving impacts. A study conducted by Haseeb et al. [19] showed that the orientation and shape of a building could affect the energy efficiency of a building. Considering the optimal building orientation might result in the potential of minimizing overall energy consumption and increasing economic benefits in architectural design. Energy efficiency may be the main objective of energy approaches of a building. Nevertheless, improving the building energy performance through several energy approaches could lead to other benefits, such as the cost-effectiveness of the overall electricity cost [20].
By using the building information modeling (BIM) tools Autodesk Revit. Comparing the single-layer clear glass (SLCG), double-layer clear glass (DLCG), and double-layer low emissivity glass (DLLG). The results revealed that the usage of double-layer low emissivity glass results in the saving of energy, cost, and less carbon emission. Several studies above showed that various changes in the design could influence the energy consumed by a building. Less energy consumption is more considered to achieve the energy efficiency of the building. In view of all these reasons, this study will investigate the influence of the various changes in an existing building on the energy efficiency of a building. The application of the proposed method aims not only to improve the improve energy performance of a hotel building but also to achieve optimization techniques to support the optimal design of the hotel building.
The energy analysis is carried out for the life cycle energy analysis of the hotel building using Autodesk Revit 2025. The workflow for the energy analysis of this study is illustrated in Fig. 1. Several methods are used to discover a decent energy simulation of the hotel building. Identifying the problem of the existing hotel building by collecting data from the hotel building, such as overall annual energy consumption, occupancy density, indoor environment (temperature, humidity), illumination level, and the building materials. This data is collected to ensure accurate models and parameters in the energy analysis tool. Then, the 3D model building was developed using the Autodesk Revit energy analysis tool. Through the collected data from the existing building, this study created a 3D model integrated with the building material properties, location, orientation, and climate parameters. After completing the integrated model of the building, the energy modeling process is conducted, and inputting various parameter settings of the building are based on the collected data of every space function, HVAC system, and space setting (loads and schedules of occupancy, lighting, and equipment). Subsequently, the model is validated to ensure the reliability of the simulation results, which are compared against the actual annual energy consumption collected from field measurements. This is followed by simulating the energy model to identify the experiment setup suitable for the design alteration in energy-efficient approaches, including rearranging the lighting schedules, replacing glazing types, and simulating the building in different orientations and locations to achieve adequate results for the investigated hotel building. After simulating several models and considering the additional factors, the purpose of deciding the most suitable energy-efficient approach will be achieved.
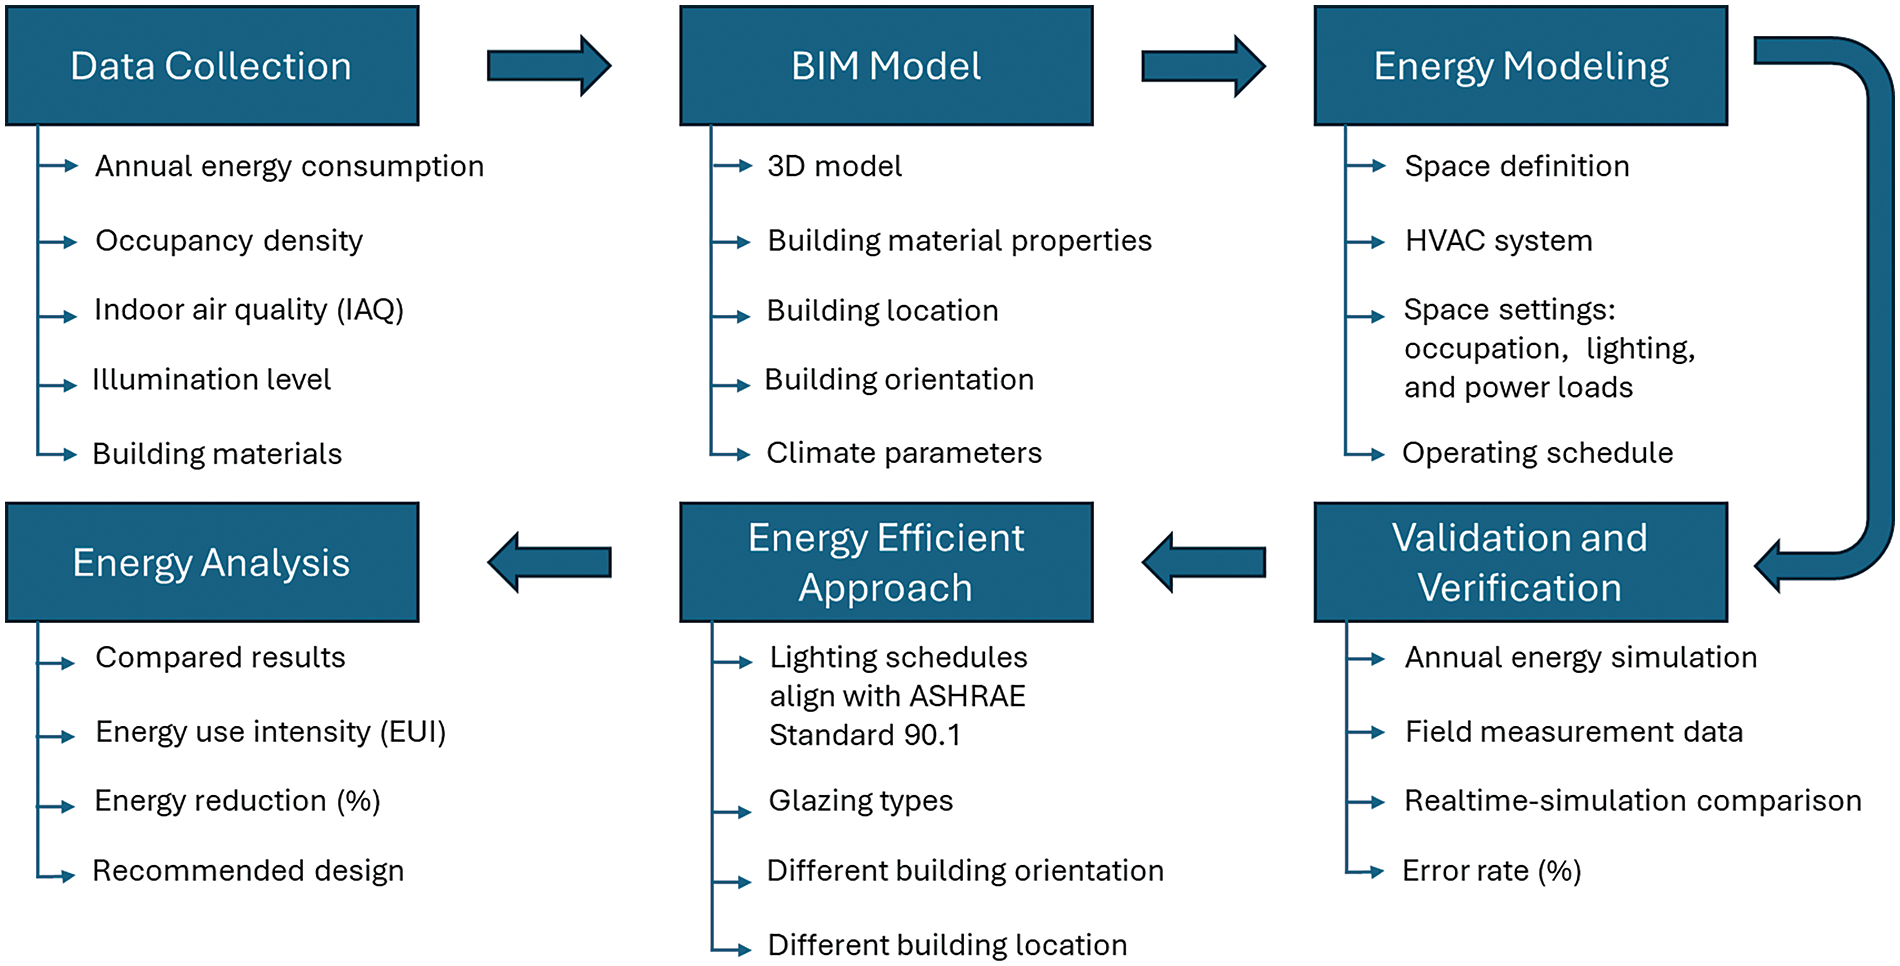
Figure 1: The workflow of energy analysis
This study utilizes an existing hotel building in Central Taiwan as a case study. The building has 13 above-ground floors and 3 underground floors. The total floor area is 14,880 m2. The existing hotel building orientation is facing the East. The existing hotel building is illustrated in Fig. 2a. The geometry model of the existing hotel building is illustrated in Fig. 2b. The geometry model of the investigated hotel building was created using the Revit energy modeling tool. The layout of the building is illustrated in Fig. 2c. The first floor of this hotel includes a lobby, coffee shop, and public toilet. The second floor to the twelfth floor contains guest rooms. The thirteenth floor includes a restaurant and kitchen, and the first to third basement floor is a parking lot. The floor area from the first floor to the thirteenth floor is 662 m2. And the floor area of basement 1 and basement 2 is 1095 m2. For basement 3, the floor area is 1905 m2.
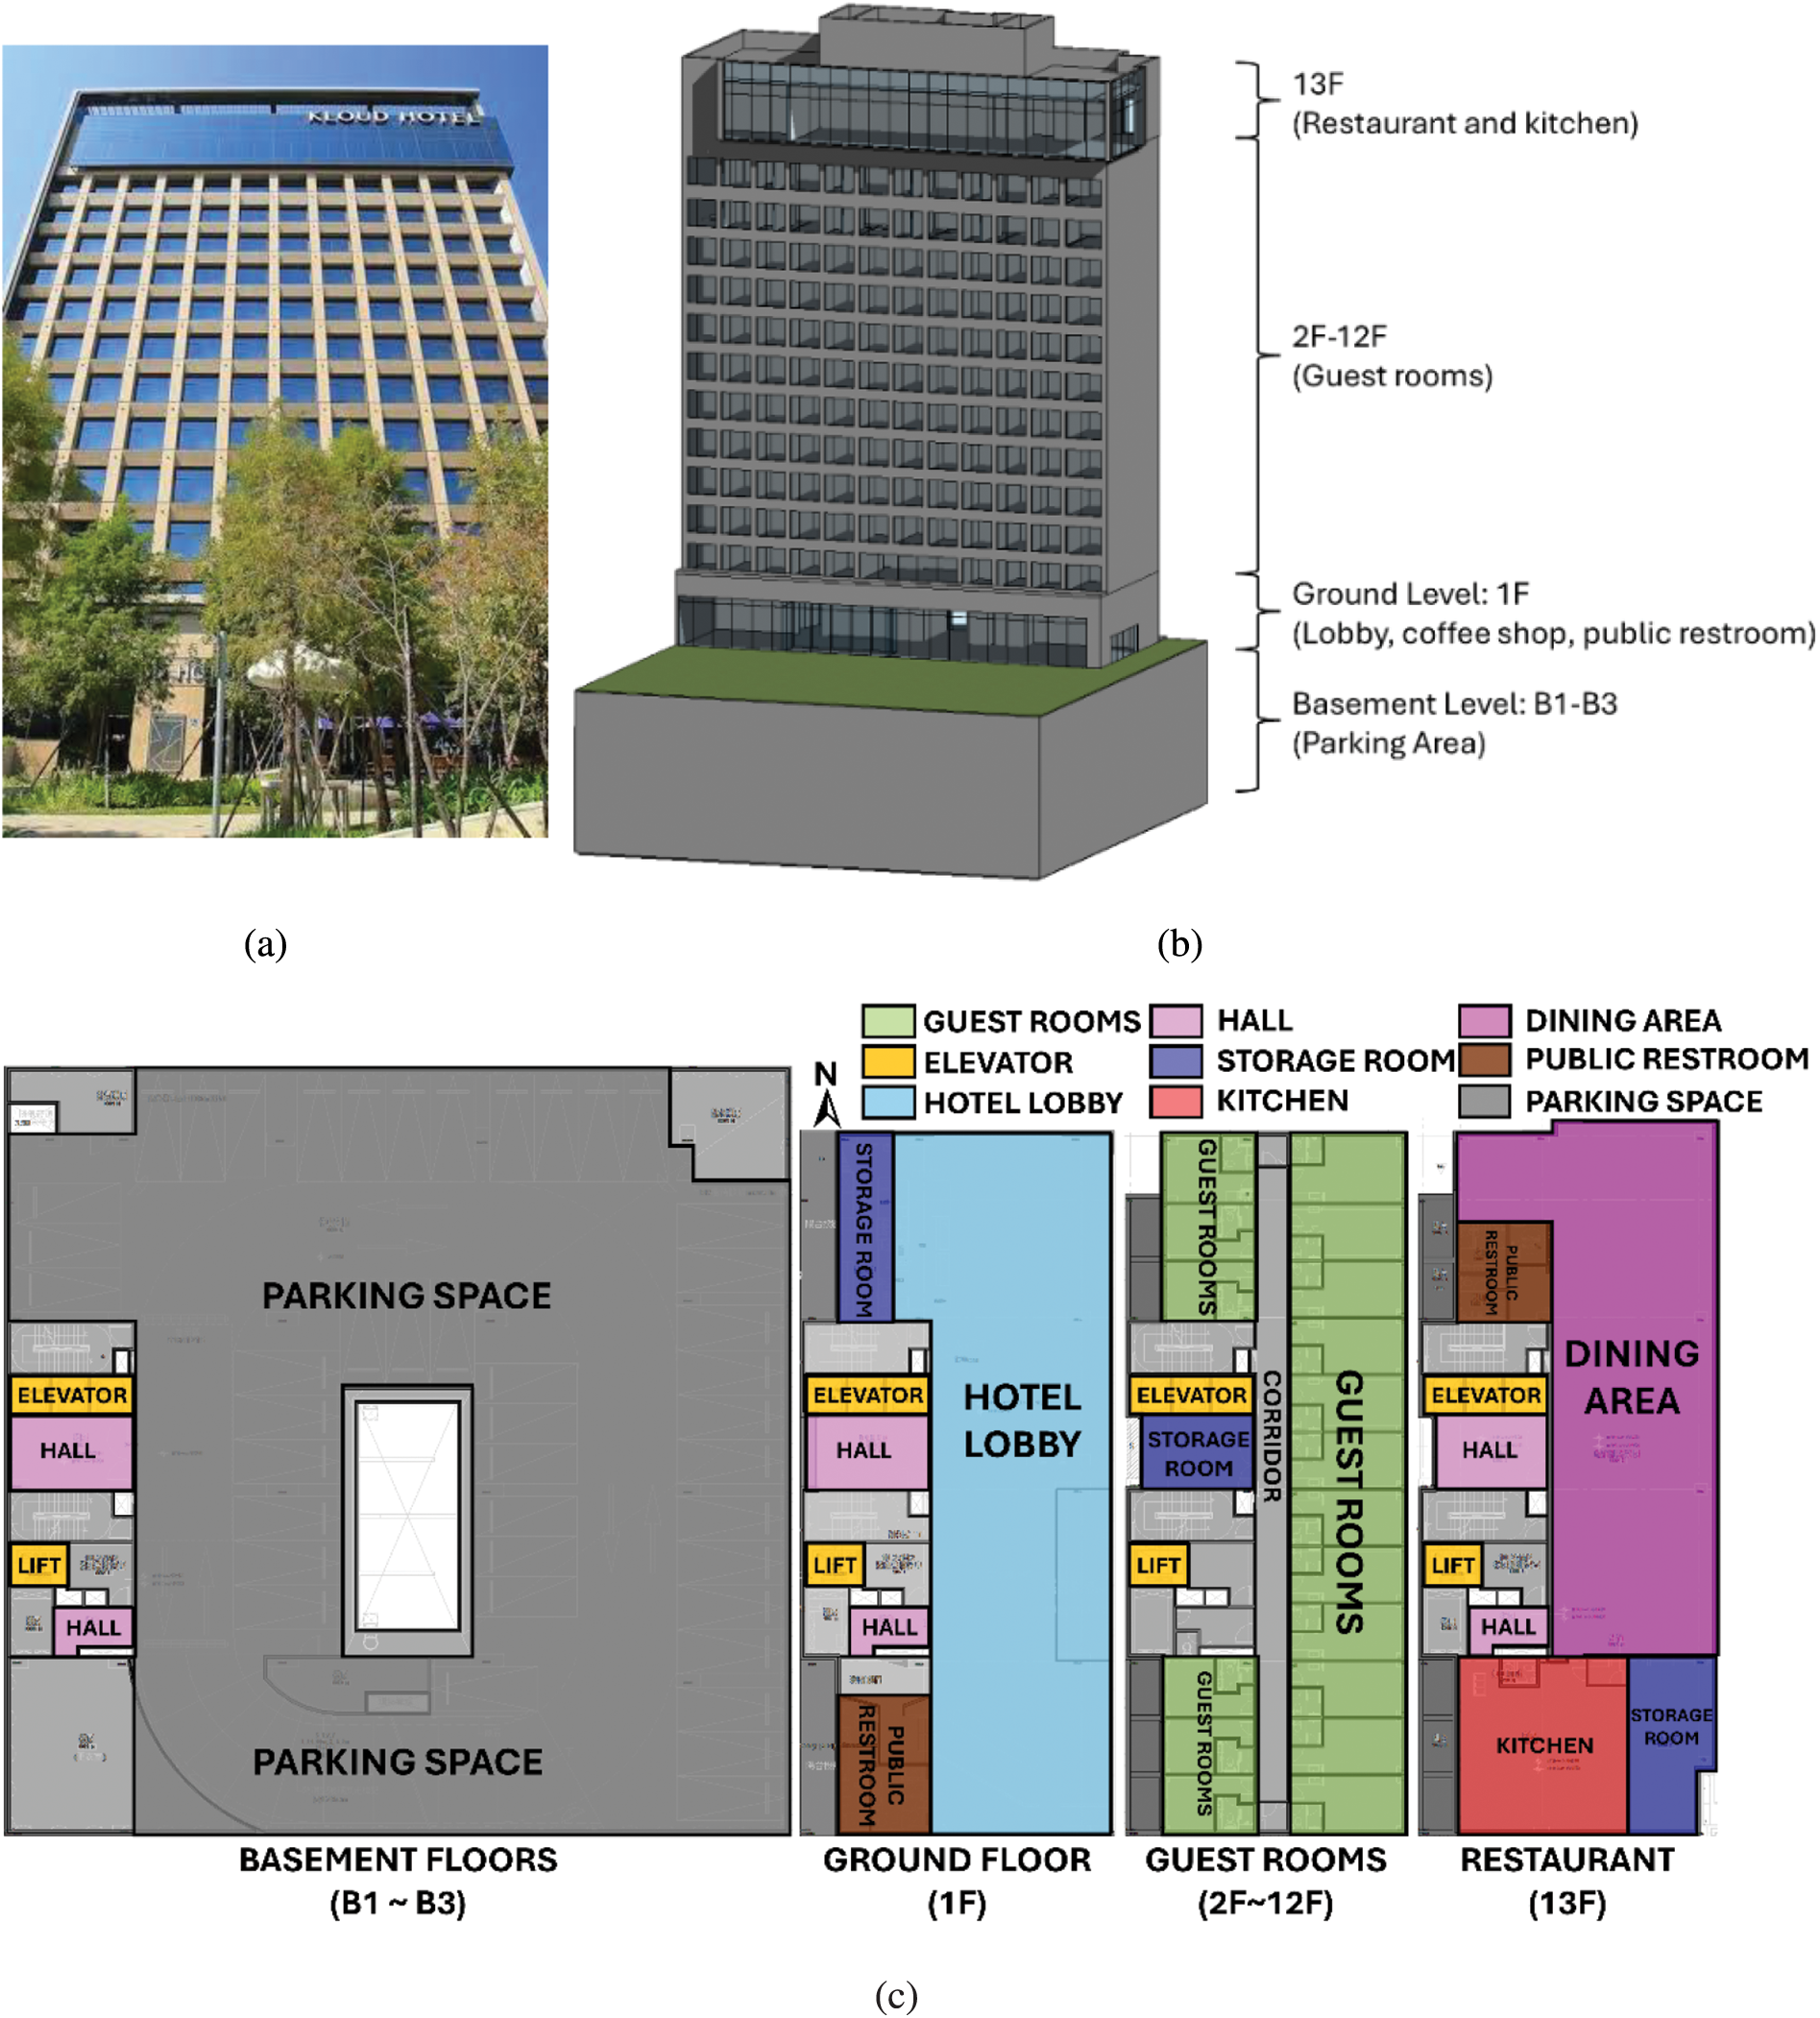
Figure 2: The investigated hotel building, (a) snapshot, (b) geometry model, (c) layout
Since the location of the existing hotel building is located in Central Taiwan, this study uses the weather data station No. 547272, which is indicated in Fig. 3. The weather station is located 4.53 km away from the actual existing hotel building location, which is the nearest weather station that is still in the same district with that available in the Revit energy modeling tool. This ensures the accuracy and relevancy of the weather data used in the energy simulation analysis of this study.
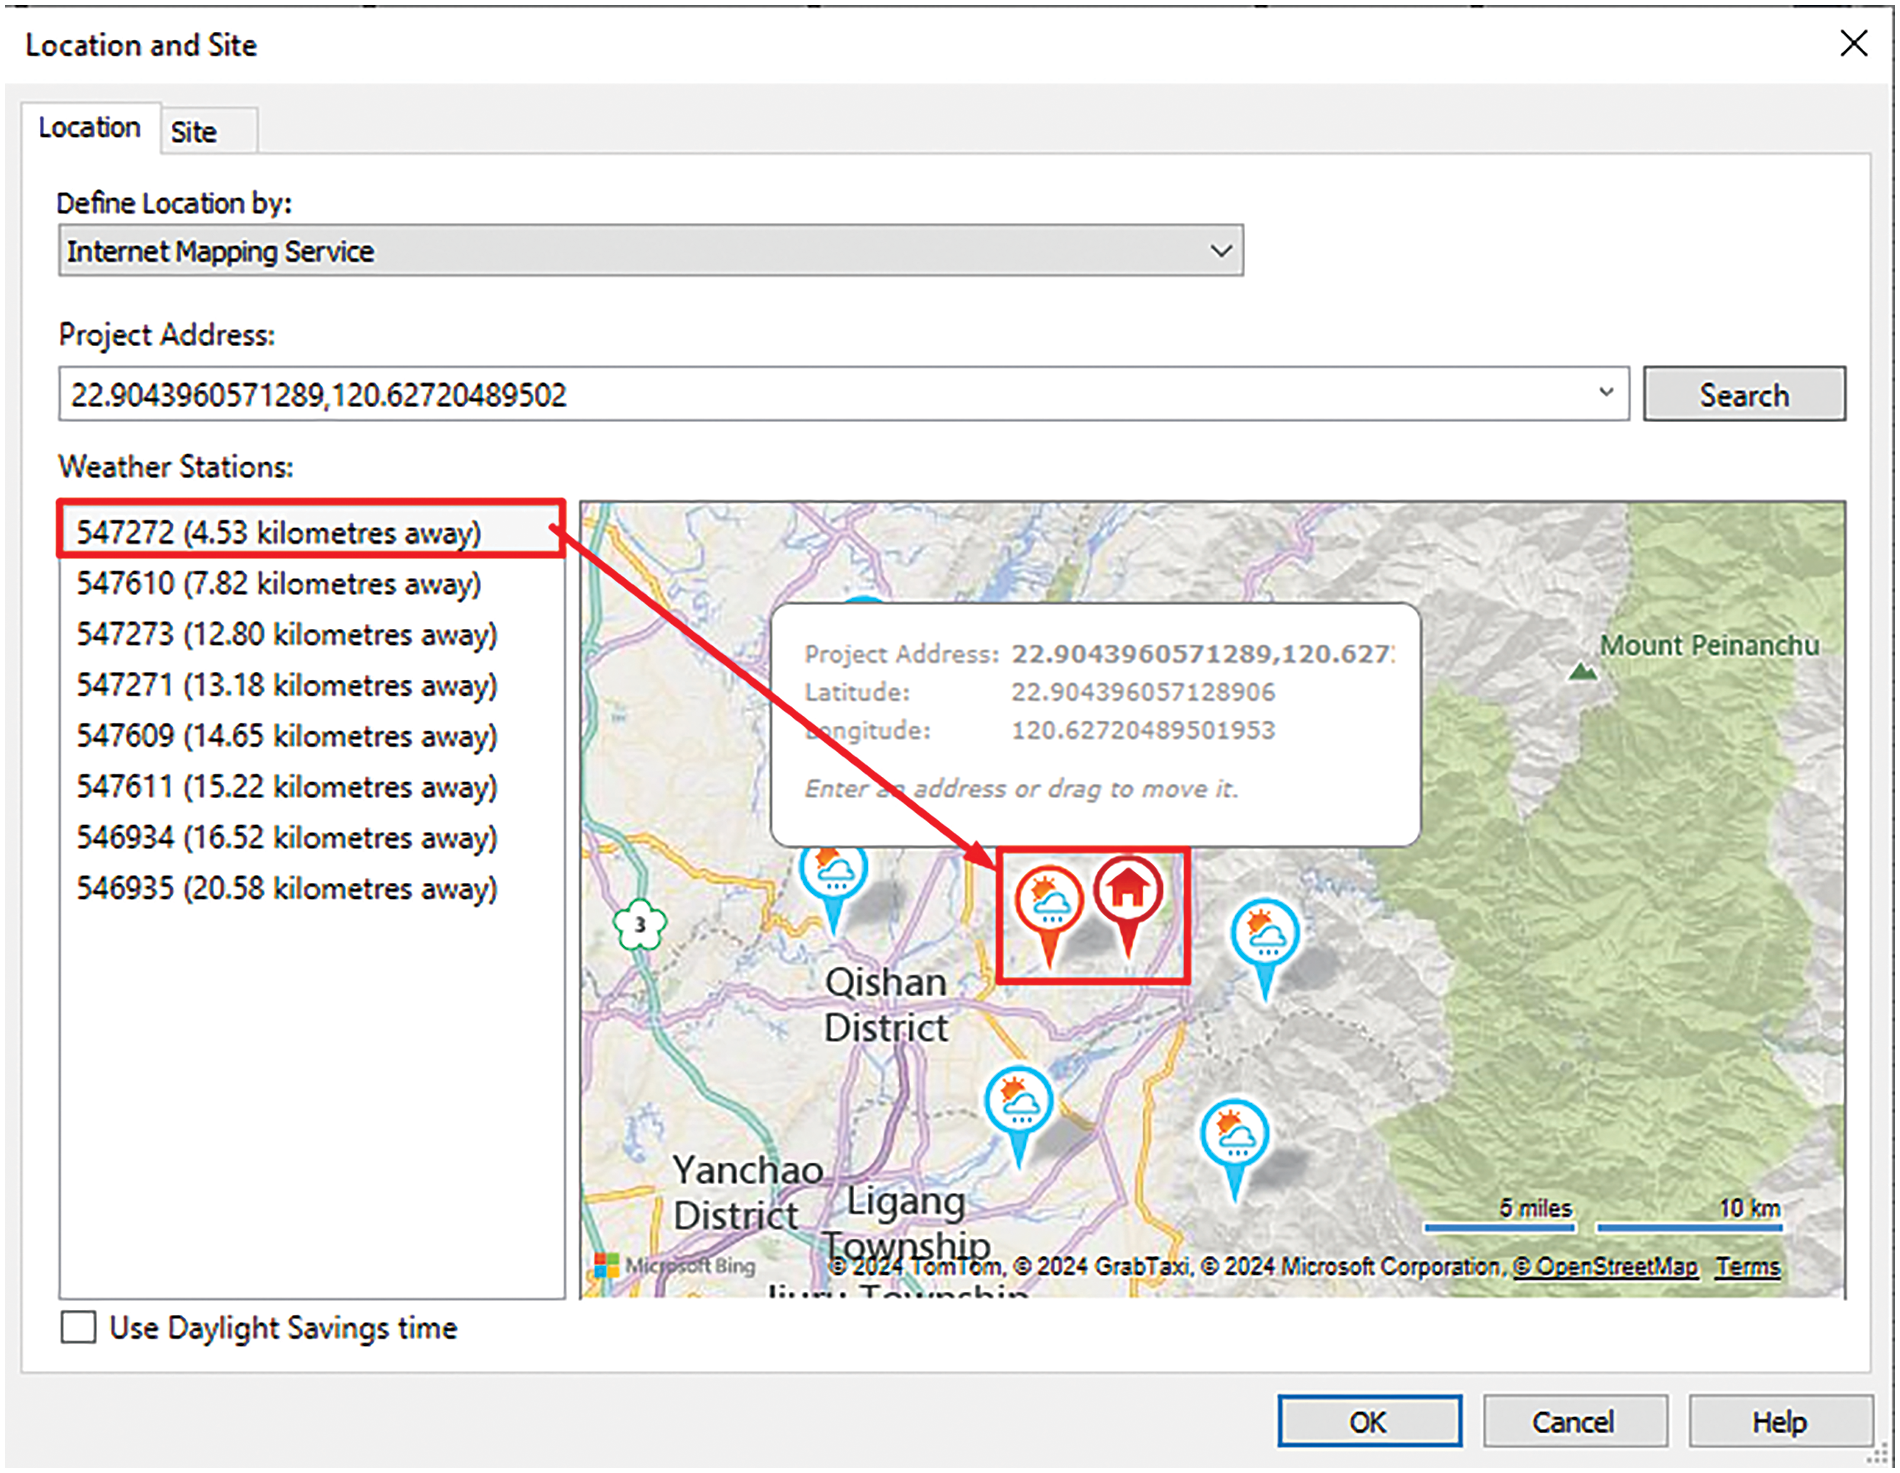
Figure 3: Weather station of the investigated hotel building in Revit
The domestic hot water (DHW) system in the investigated hotel building is illustrated in Fig. 4. The domestic hot water system in this hotel building is designed to provide a consistent supply of hot water for various uses, such as bathing, cleaning, and other domestic needs. The system starts with heat pumps that are responsible for heating the water. The heated water is then stored in two large water tanks, where the temperatures and liquid levels are carefully monitored. WT-H1 (heated water tank) maintains a temperature of 48.0°C with a liquid level of 91%, while WT1, WT2, WT3, and WT4 hold water at 47.4°C with a liquid level of 77%. These tanks ensure that there is always a reserve of hot water ready to be distributed throughout the building.
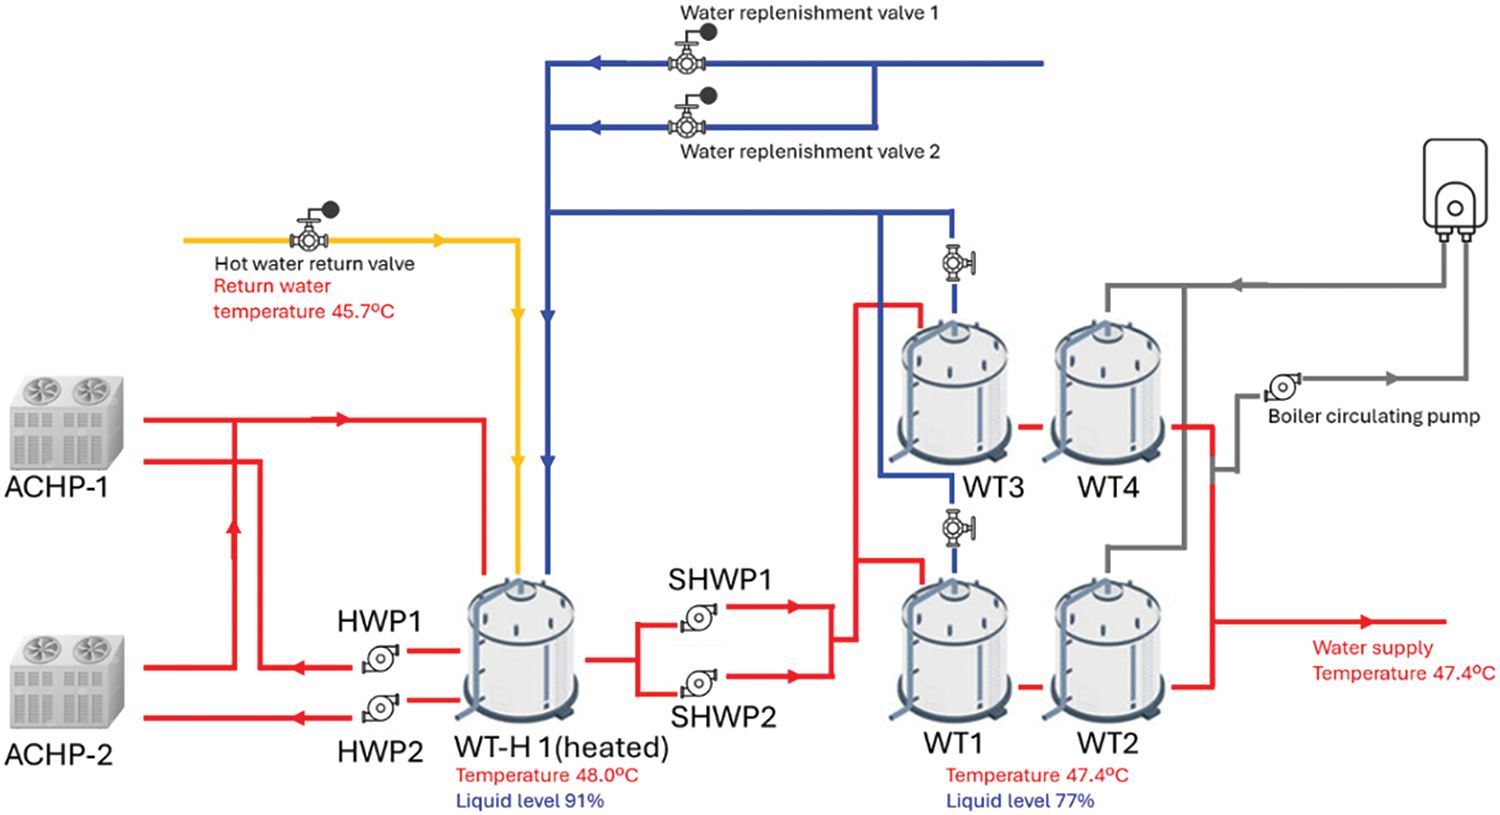
Figure 4: Domestic hot water system in investigated hotel building
Water pumps and heat exchangers play a crucial role in circulating the hot water from the tanks to where it is needed. The pumps move the hot water through the system, ensuring an even distribution, while heat exchangers transfer the heat between fluids without mixing them. Additionally, a boiler in the system serves as an auxiliary heat source, providing extra heating capacity when the demand for hot water is high. Finally, the hot water is supplied to the building at a temperature of 47°C, ensuring that the guests have a reliable source of hot water at all times.
The HVAC system in the existing hotel building utilizes the chiller and variable refrigerant volume (VRV). The underground floors, first floor, and thirteenth floor are conditioned by a chiller system with a capacity of 40 RT, and the second floor to the twelfth floor is conditioned by a VRV system with a capacity of 220.5 RT. Fig. 5 indicates the chilled water (CHW) system in the hotel building. CHP indicates the chilled water pump, and SCHP-1 and SCHP-2 are the variable frequency drives (VFDs). ACCH stands for the air-cooled chiller. Meanwhile, the ACHP-1 and ACHP-2 are the double-effect chiller pump.
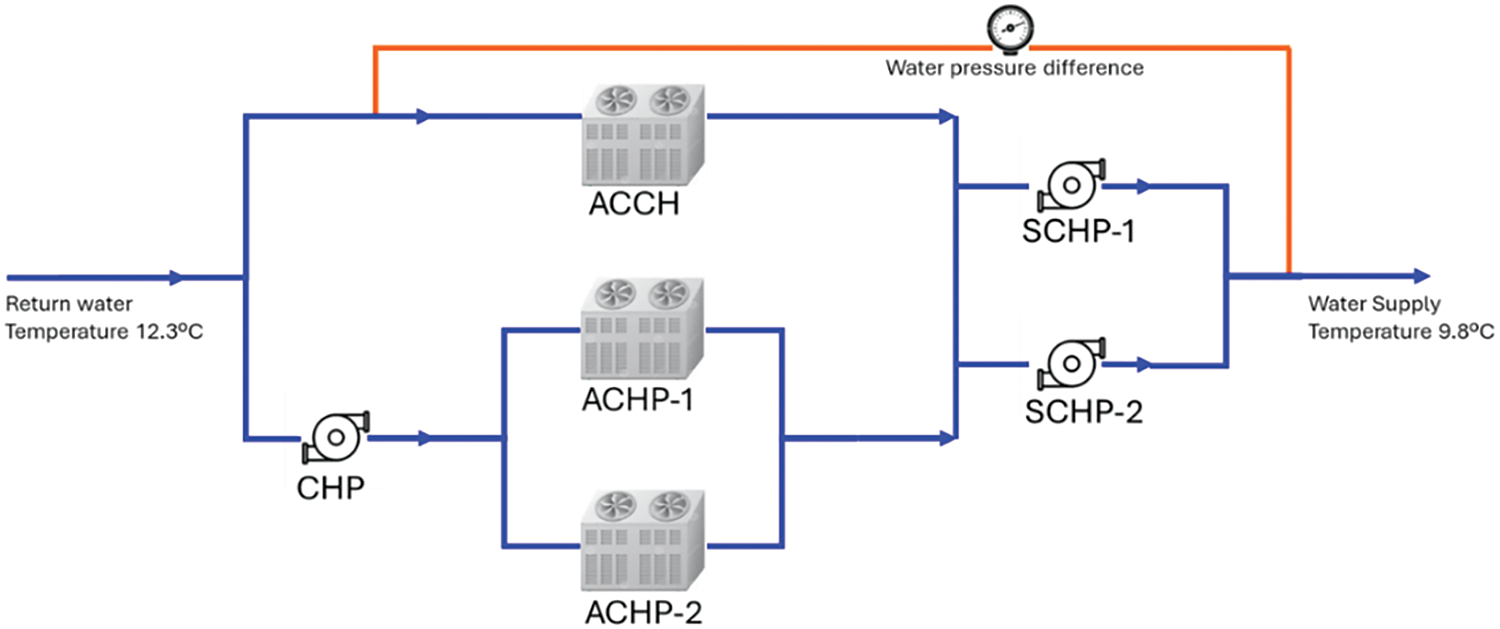
Figure 5: Domestic hot water system in investigated hotel building
The DHW and CHW systems in this hotel building are designed to operate simultaneously, yet they function independently to serve their specific purposes. While the DHW system focuses on heating and supplying hot water, the CHW system is dedicated to cooling the building. Both systems use advanced technology and equipment, such as heat pumps and CHPs, to achieve their respective goals efficiently. By operating together, they ensure that the hotel provides a comfortable environment for its guests and staff, with adequate hot water and a well-regulated indoor climate. However, their operational processes and the fluids they handle (hot water for DHW and chilled water for CHW) are distinct, ensuring that they do not interfere with each other while maintaining the building’s overall energy efficiency.
The hotel building properties are shown in Table 1. The existing hotel building consists of a U value of the wall exterior of 0.47 W/m2K, a U value of the roof of 0.35 W/m2K, and a solar heat gain coefficient (SHGC) from the SLCG of 0.79. Indoor condition within the space of each energy zone is shown in Table 2.


This paper collected adequate energy consumption data from The Kloud Hotel Building in Central Taiwan to discover the hotel’s energy consumption distribution. The energy audit facility is mostly used for short-term lodging, including lodging, food, and banquet rental spaces. The HVAC, lighting, elevator, and domestic hot water systems in this building all run on electricity.
According to the data collection report, the total electricity consumption in the prior year of 2023 was 2,158,863 kWh. The overall annual electricity cost is NT$7,451,963; the average price of electricity is NT$3.4518/kWh, and the average power factor is 97.9%. Lamps, sockets, monitoring equipment, the electrical consumption of equipment in guest rooms, and the electricity consumption of building public facilities: water, electricity, air conditioning, fire prevention, low current, and so on.
The field measurement is conducted in the investigated building as indicated in Fig. 6. Field measurement tests were carried out in order to provide credible baseline data for energy modeling and to validate simulation results for assessing performance improvement and energy-saving potential. Table 3 lists the measuring instruments used in the field measurement. A TSI-9565-P multifunction anemometer with a 3% accuracy was used to monitor and record temperature, humidity, and air velocity. HIOKI- PW3360-20 for 3-phase and HIOKI 3280-10F for 1-phase power meter equipment. Testo 540 was used to measure the illumination level.
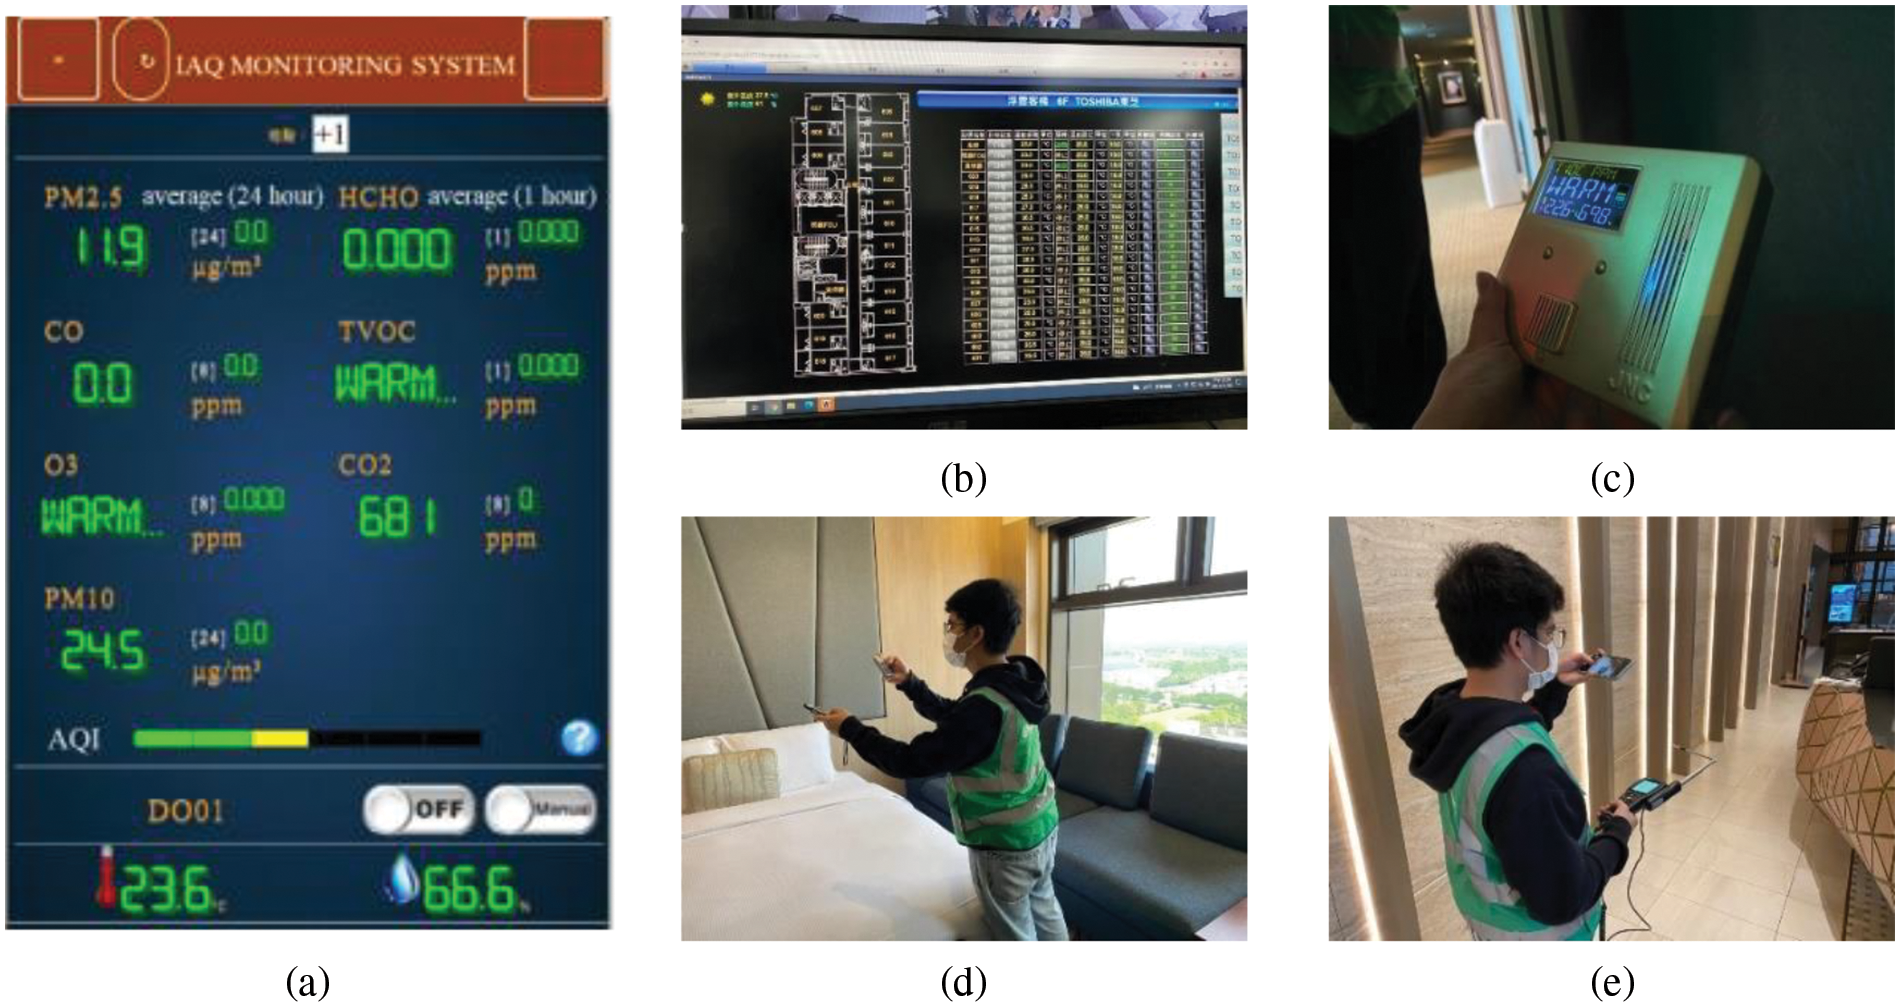
Figure 6: Data collection documentation, (a) environment monitoring device, (b) building control system, (c) monitoring device, (d) illumination measurement, (e) airflow velocity measurement

Validation involves evaluating the contrast between sufficiently accurate modeling results and the measurement data. In order to verify that the data is accurate and of high quality, data validation is the process of checking that the data has passed data cleansing. Validation requires error estimation, and uncertainty on both the modeling and measurement sides is required. The experimental measurements are just asserted to be the most accurate representations of reality for validation in this procedure, not that they are more accurate than the modeling results. Eq. (1) can be utilized to obtain the error rate (%).
To increase the accuracy of energy consumption of the Revit simulation and field measurement, validation data is required. Data validation is the process of ensuring that data has been cleansed for it to be accurate and valuable. Statistical methodologies such as percentage error are used to calculate the errors between simulation and field measurement (EER).
In this study, case comparison, sampling scenarios, or statistical computations are used to overcome both predicted and unexpected validity concerns. To effectively identify any alternative explanation for simulated scenarios, qualitative research must attempt to rule out most challenges to validity after the study begins by relying on information gathered during data collecting and the energy simulation itself. The overall electricity consumption errors between simulation and field measurement will be examined to determine whether they fall within acceptable boundaries. For monthly electricity usage, the permitted range of simulation errors between simulation and field measurement is 10%–15% according to IPMVP [21] and 5%–10% based on ASHRAE Standard 90.1 [22] for monthly electricity consumption, respectively. Fig. 7 depicts the annual energy usage curves. The chart depicts the slight difference between simulated and measured energy use annually. The error percentage in monthly energy consumption ranged below 10%, with an average error of 4.8%.
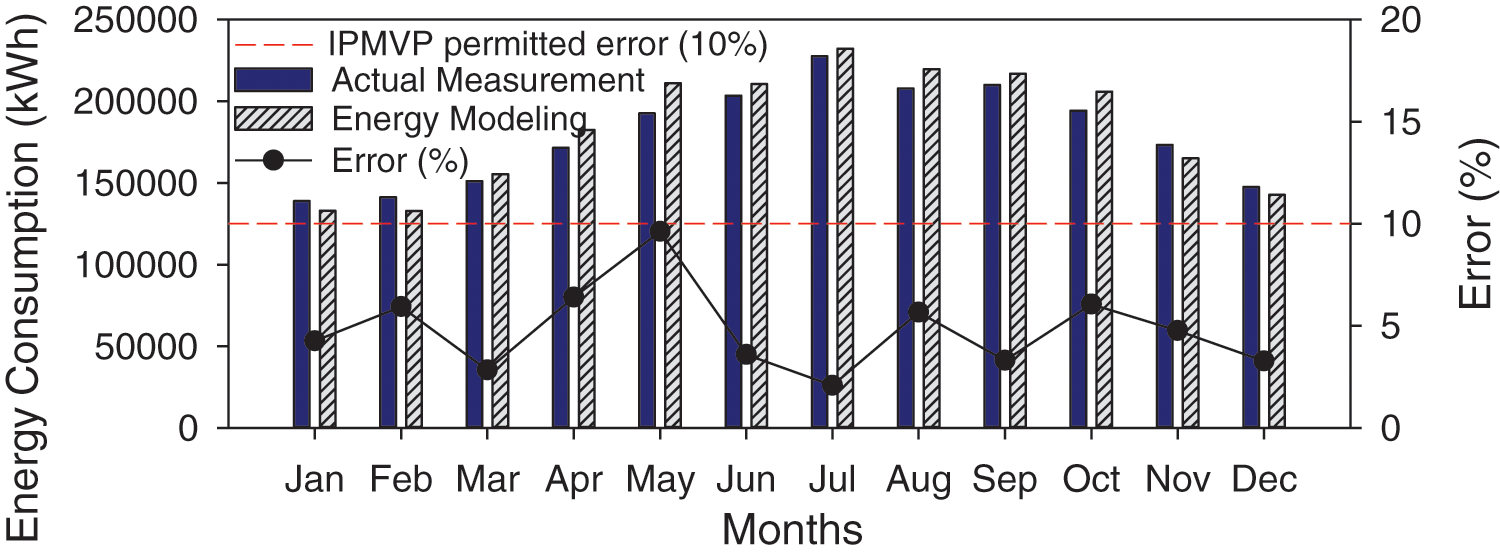
Figure 7: Energy consumption validation between actual and modeling
Several scenarios were carried out and simulated in order to improve the energy efficiency of hotel buildings. Energy modeling is used to simulate energy-efficient approaches such as arranging lighting schedules, glazing, building orientation, and building location, which can be made into a variety of options. On that occasion, this study was divided into four major scenarios to consider in order to reduce energy consumption.
The experiment setup will be divided into 4 scenarios:
a) Arranging the lighting schedule based on the ASHRAE Standard 90.1 [22].
b) Changing the glazing design: double-layer clear glass (DLCG), single-layer with low-emissivity glass (SLLG), and double-layer with low-emissivity glass (DLLG).
c) Changing the orientation of the building: South, West, and North.
d) Moving the building location to Northern Taiwan and Southern Taiwan.
The energy use intensity of a building is a measure of how energy-efficient its design and/or operations are. EUI can be compared to the miles per gallon rating used in the construction industry. It is utilized in a variety of ways, including establishing an energy performance objective before beginning design, benchmarking a building’s designed or operating performance against other buildings of the same type, and assessing compliance with energy code requirements. The EUI of a dwelling or small office building will be lower than that of a hospital or laboratory.
EUI is expressed as energy per square foot or meter per year. It is computed by dividing the total energy consumed by the building in one year by the entire gross floor area of the building. Eq. (2) expresses the calculation. The EUI of the simulated hotel building is 147.77 kWh/m2/year.
The HVAC system accounts for a large amount of the total energy consumption in hotel buildings annually. According to the modeling results, the HVAC system has enormous savings potential. As a result, finding energy-saving measures that may be adopted in the HVAC system to reduce energy usage is crucial. This study revealed four potential energy-saving strategies using energy modeling: lighting schedule, glazing, building orientation, and building location.
With a total of 4025 lights, most of the lighting fixtures in this building are specifically LED lamps. The lighting in public activities including; corridors, parking lots, elevator spaces, hallways, and basically public restrooms runs 24 h day. public activities including; the gym, café, and restaurant run 5 h a day. the bar, for all intents and purposes, runs 7 h a day. And guest rooms kind of run for all intents and purposes average of 8 h a day. Table 4 listed the percentage of lighting scheduled in different spaces.

Fig. 8 depicts the results of a full life cycle simulated energy consumption of the lighting schedule based on the ASHRAE Standard 90.1 [22], which really is quite significant. The EUI of the initial hotel building is 147.77 kWh/m2/year based on the existing measurement lighting schedule. The lighting schedule proposed in this study essentially was based on the ASHRAE Standard 90.1 for lighting requirements. The results of the energy modeling showed that rearranging the lighting schedule is definitely possible to actually reduce energy consumption by approximately 8.22%, respectively, compared to the energy consumed by the existing lighting schedule, in which the energy consumption is reduced by 189,807 kWh/year. The EUI was significantly reduced to 135.62 kWh/m2/year, respectively. The detailed compared results are listed in Table 5. Implementing the lighting schedule could be considered an excellent energy approach for a hotel building.
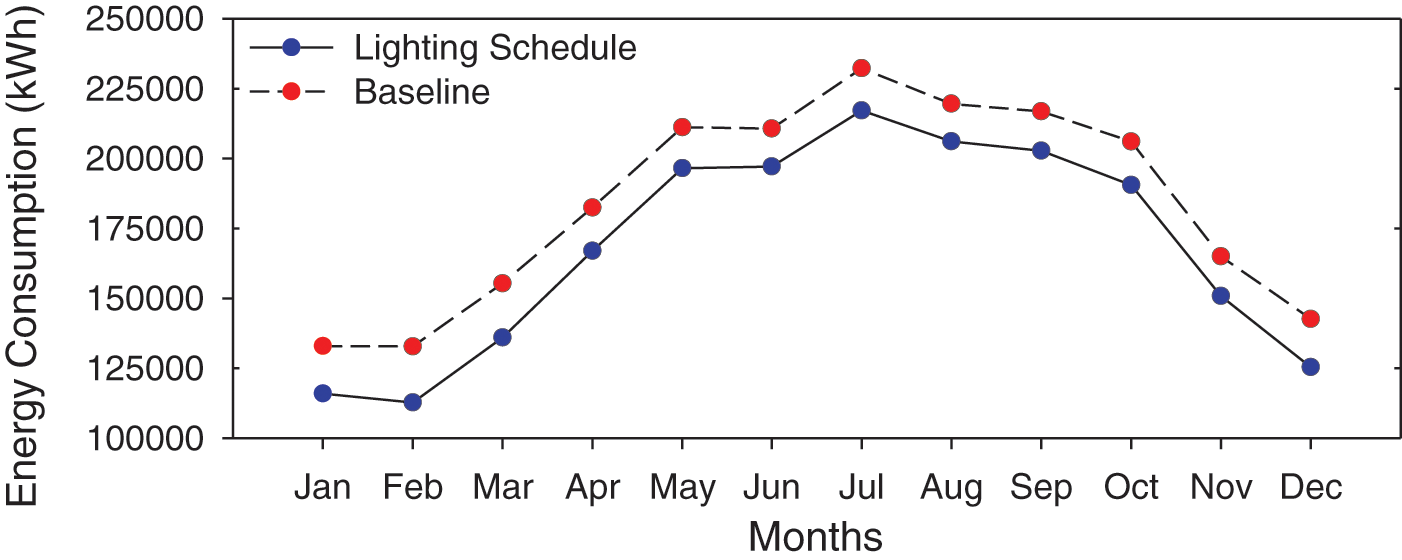
Figure 8: Annual energy consumption of existing design and arranged lighting schedule

Embodied energy is the energy used for raw material extraction, raw material processing, conveying the finished product to the construction site, and energy used during building installation/erection and renovation. Embodied energy accounts for roughly 20% of the total energy use of the building.
Table 6 listed the selected glazing to replace the existing glazing of the existing hotel building. The existing hotel building has a high SHGC from the SLCG with a value of 0.79, which means almost 80% of solar heat is transmitted into the hotel building. In this scenario, the selected glazing is DLCG with the value of SHGC of 0.71, SLLG with the value of SHGC of 0.64, and DLLG with the value of SHGC of 0.40, respectively.

Fig. 9 depicts the energy consumed by every kind of selected glazing for the hotel building. The current results present a quite high EUI for 147.77 kWh/m2/year hotel building. By considering to implementing the low-emissivity glass could potentially reduce the energy consumption of the hotel building. Low-emissivity glass could lead to cost savings on energy by minimizing the amount of heat that escapes and enters the building during the summer and winter. From the energy modeling results, DLCG presents an energy reduction of 7.28%, with an energy reduction value of 169,102 kWh/year. It significantly reduced the EUI to 137.01 kWh/m2/year. Meanwhile, the simulation results also revealed that a SLLG could reduce the energy consumption of the investigated building by 2.01%. And the value of EUI could be reduced to 144.80 kWh/m2/year. Implementing SLLG for the glazing of the building could reduce 53,166 kWh/year energy. Moreover, the results of the simulation indicate that a DLLG conveys a significant reduction of energy consumption by 14.58%. And the value of EUI is also sufficiently reduced to 126.22 kWh/m2/year, reducing 329,630 kWh of energy annually. The detailed compared results are listed in Table 7.
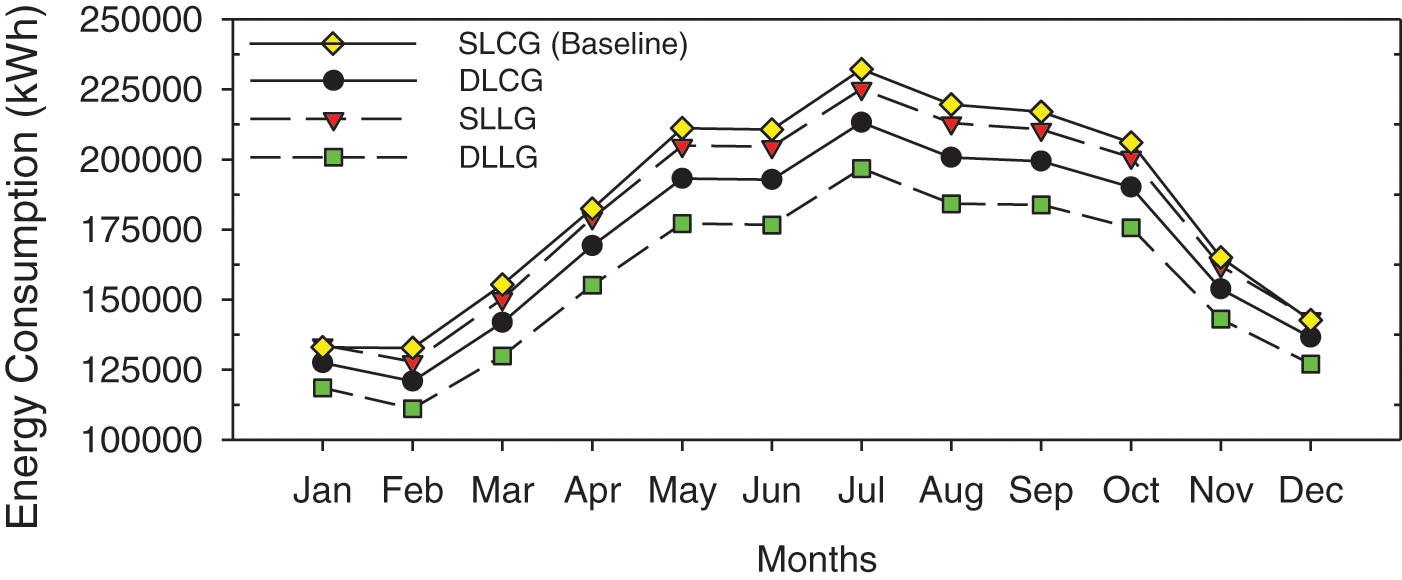
Figure 9: Annual energy consumption of existing design and different glazing

Low emissivity was shown in the results to reduce energy consumption in both single and double-layer glass varieties. Double-layer glass, on the other hand, is more efficient in decreasing the energy consumption of the investigated hotel building. The heat transfer is substantially eliminated by the air gap between the double-layer glass. Single-layer glass insulation is less effective than double-layer glass insulation. The concept behind double-layer glass is that by sealing the air space, and the air remains between the two layers of glass, effectively reducing the heat exchange through convection of the air dwelling in the gap of the double-layer of glasses and limiting the heat loss by the conduction of the layered glass inside the building due to the low thermal conductivity of air. Therefore, the heat inside the building is reduced which consequently prompts the energy consumption of the investigated building to be reduced significantly. And the reduction of the energy consumption in the investigated hotel building could be decreased successfully.
Based on the existing building information and schematics, the investigated building is facing the east. In the building orientation scenario, there were 3 cases in the investigated building to be simulated. The arrangement of building orientation was conducted to other orientations including South, West, and North. The climate in Taiwan is classified as being hot and muggy. Buildings in places with a high concentration of heat should be positioned to reduce solar gains, whilst buildings in regions with a high concentration of cold should be pointed to increase solar gains. Orientation is equally important when considering the wind direction. The amount of area inside a building that has to be heated or cooled is determined by the form of the building. The findings showed that the analyzed energy consumption of the investigated hotel building varied depending on the orientation of the building.
Fig. 10 shows the results of the building orientation scenario of the investigated hotel building. The existing hotel building currently has a high value of a EUI, 144.77 kWh/m2/year. From the result of the energy modeling, changing the orientation of the building could present various reductions in energy consumption. The result when the building is arranged to the South orientation showed a minor reduction of energy consumption by 1.96%, with the value of EUI reduced to 144.88 kWh/m2/year, reducing about 52,017 kWh of energy every year. However, arranging the building orientation to another orientation does not always present a satisfactory reduction in energy consumption. As given another instance by changing the orientation of the building to the West. The results revealed that even the West orientation has a greater energy consumption than the baseline. The energy consumption is 3.02% higher with the value of a EUI of 152.23 kWh/m2/year, which increases the energy consumption by 57,469 kWh/year. Contrariwise, the results of the North orientation arrangement of the hotel building present a significant energy reduction compared to other orientations. The North orientation could save energy to 7.20% with the value of the EUI of 137.12 kWh/m2/year, reducing energy consumption by around 167,411 kWh/year. Considering the relative solar intensity in every orientation, solar intensity is the key factor in the heat gain role of a building to decreasing the energy consumption with a proper building orientation as a consideration in passive solar design. Table 8 lists the detailed simulation results of the building orientation strategy.
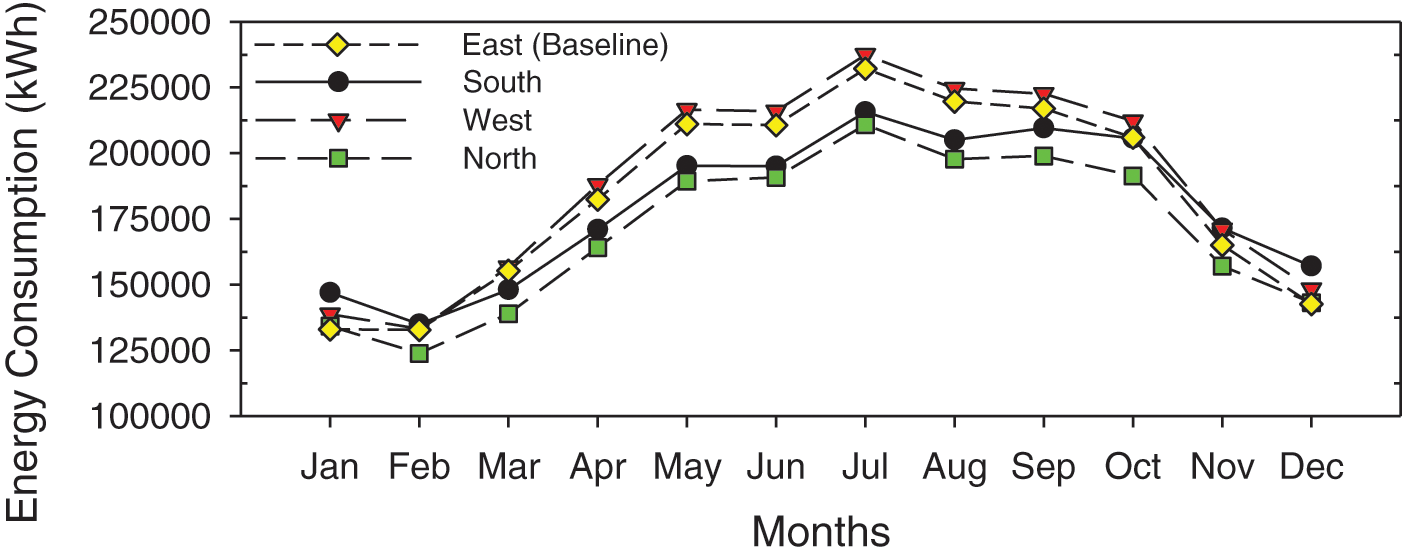
Figure 10: Annual energy consumption of existing design and different orientations

The climate in Taiwan is subtropical, except for the Southern part of the island, which is particularly tropical. Summers really are actually long and hot, lasting from April or May to September or October. The existing hotel building is located in the Center of Taiwan (Taichung) with a value of the EUI of 147.77 kWh/m2/year. In the building location scenario, the investigated building will be simulated in 2 different locations in Taiwan, including Taipei as the Northern part of Taiwan, and Kaohsiung as the Southern part of Taiwan.
Fig. 11 indicates the results of the energy modeling by moving the building into different locations. The location of the building could be a major influence on the output of the energy consumption in a building. When the building is moved to the Northern part of Taiwan (Taipei), the result revealed that there is a minor energy reduction. The energy consumption is reduced by 3.23% with a value of a EUI of 143.00 kWh/m2/year, reducing 79,995 kWh of energy in one year. The energy reduction occurred because the weather condition in Northern Taiwan is colder than the baseline case which was located in the Central part of Taiwan which could be classified as a subtropical climate. Contrarily to the results when the building was moved to the southern part of Taiwan, the weather condition is considered to be warmer than in other areas in Taiwan and classified as a tropical climate. The results revealed that moving the building to the South presents a higher energy consumption than the baseline case. The energy consumption is increased by 3.74%, or 73,316 kWh/year. And the value of the EUI is 153.30 kWh/m2/year. Therefore, determining the location of the building needs to be considered in order to obtain energy-efficient. The detailed comparative results of the baseline design and different building locations are listed in Table 9.
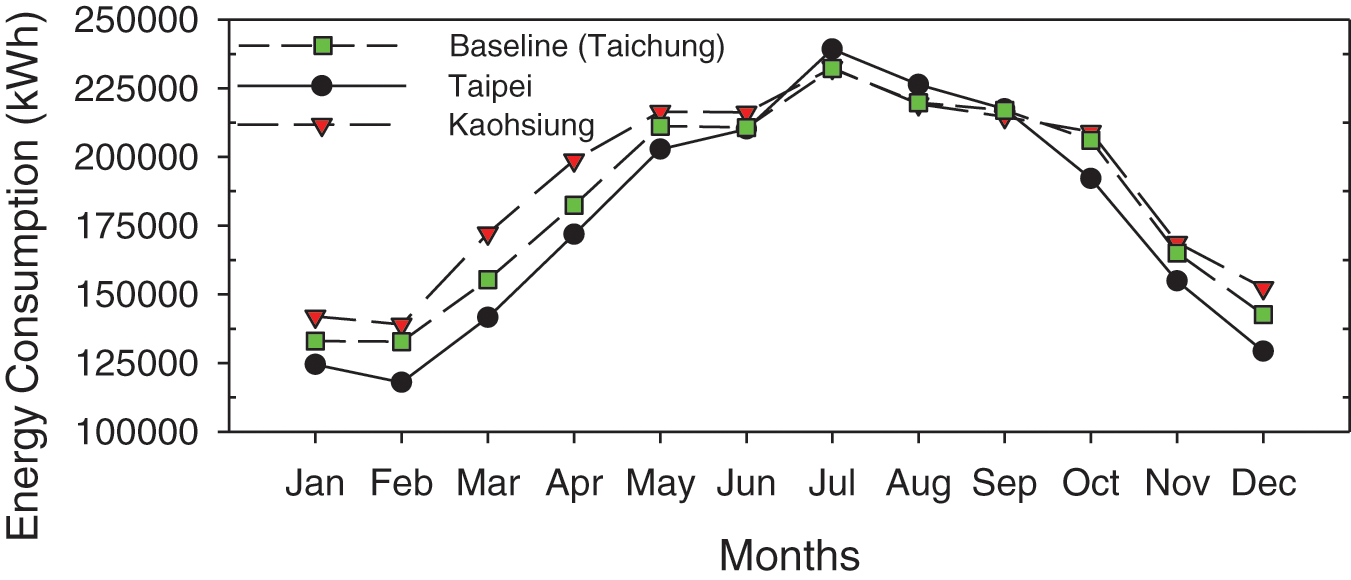
Figure 11: Annual energy consumption of existing design and different locations

From the data collection, the energy consumption of the existing building is gathered to be a baseline case of the simulated building to be compared to the several energy-efficient approaches scenario. Including the arrangement of a lighting schedule based on the ASHRAE Standard 90.1, glazing replacements, arranging building orientation and moving the building into different locations. Fig. 12 indicates the results of different cases in energy use intensity (EUI) and the percentage of energy reduction. Table 10 provides a detailed comparison of the baseline design and energy approaches. From the results, compared to the baseline case which was the initial result of the existing building. The glazing arrangement by using a DLLG has the most significant reduction of energy consumption of the investigated hotel building. It was discovered that energy consumption was reduced by 14.58% with the value of a EUI of 126.22 kWh/m2/year. Makes it the best energy-efficient approach scenario of all simulated results.
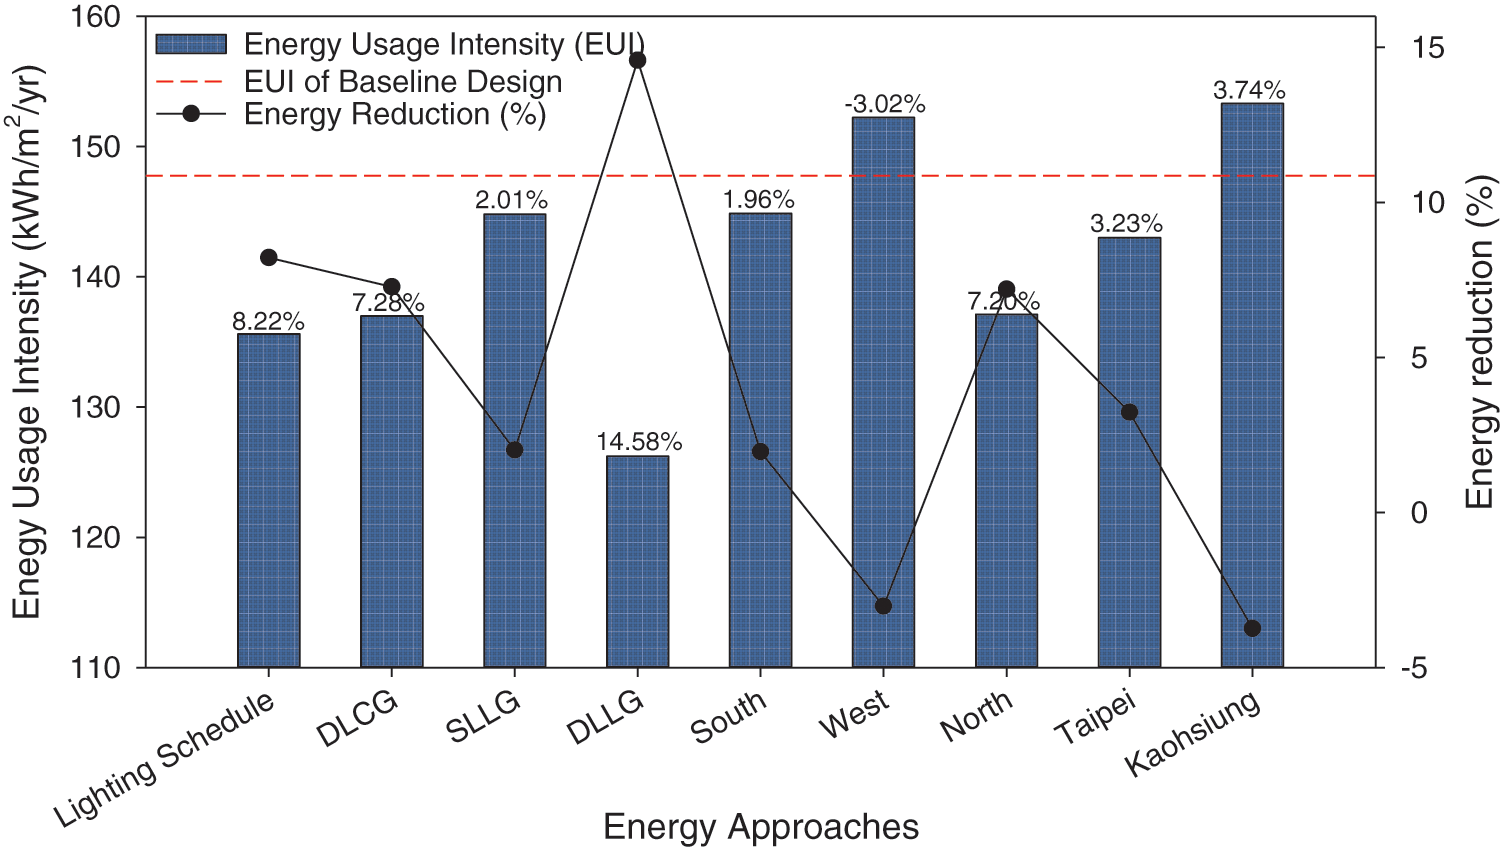
Figure 12: Comparison of each energy approach

Without the need of moving the building location or the building orientation, the energy consumption could be reduced by implementing double-layer glass in the building. the air gap between the double-layer glass affects the air that remains inside the gap to be insulated. And the air inside the gap of the double-layer glass eliminates the heat from the outside of the building through convection. Moreover, the glass used in the building has a low solar heat gain which could also reduce the heat from outside of the building. And the low emissivity glass prevents the heat from infiltrating into the building because of the low conductivity of the air. Therefore, the energy consumption could be significantly reduced by implementing a DLLG.
Contradictory to moving the building to the Southern part of Taiwan in Kaohsiung. The result revealed that this scenario presents a higher energy consumption of the building by 3.74% with the value of a EUI of 153.30 kWh/m2/year. The energy consumption gain occurred because the weather and climate in the Southern area of Taiwan are relatively warmer and more humid than in the baseline case where the location of the building is in the Central part of Taiwan. The temperature inside the building definitely will be warmer than the baseline case which increases the energy consumption of the building.
To effectively lower electricity costs and CO2 emissions, it is essential to evaluate the energy performance of a building, as overall energy consumption directly influences both electricity expenses and CO2 emissions [23,24]. The generation of CO2 emissions is contingent upon electricity consumption and the specific electricity emission factor in the area under study. In 2022, Taiwan’s electricity emission factor was recorded at 0.495 kg.CO2e/kWh [25]. This value will be used to determine the CO2 emission produced by each energy approach in this study. Considering the results of this study shows that some of the strategies reduced the overall energy consumption of the building, which can lead to the reduction of CO2 emissions annually.
Fig. 13 illustrates the compared CO2 emission productions of each strategy. Table 11 lists the CO2 emissions production and reduction by each strategy compared to the baseline design. The existing design produced around 1,092,834 kg.CO2e of CO2 emissions annually. Meanwhile, each strategy has different results and impact on CO2 emission production. Implementing lighting schedule aligned with ASHRAE Standard 90.1 could reduce 93,955 kg.CO2e emissions every year, and the CO2 emissions are significantly reduced by 8.79%. Similarly, replacing the glazing type presents significant enhance results as well as arranging the lighting schedule. The use of DLCG reduces the CO2 emission production to 1,009,129 kg.CO2e, resulting in 7.83% reductions. Moreover, replacing the glazing type with SLLG has slightly reduced the CO2 emission by 26,317 kg.CO2e or around 2.46%. Notably, utilizing DLLG significantly reduced the CO2 emission production to 929,667 kg.CO2e, being the highest decarbonization which reduced 15.27% CO2 emissions compared to all other strategies. While changing the orientation results vary, when the building is facing the South, the CO2 emissions slightly reduced by 2.41%, and when facing the North it is significantly reduced by 7.75%. On contrary, when the building is facing the West, the CO2 emission production was increased by 2.66% or 28,447 kg.CO2e. Correspondingly, moving the location to the Northern part of Taiwan could decrease the CO2 emissions by 3.71%, while moving the location to the Southern part of Taiwan will increase the CO2 emissions by 3.40%. From the results, it is discovered that energy consumption influences the production of CO2 emissions of a building correspondingly, and certain energy saving strategies could reduce the CO2 emissions production.
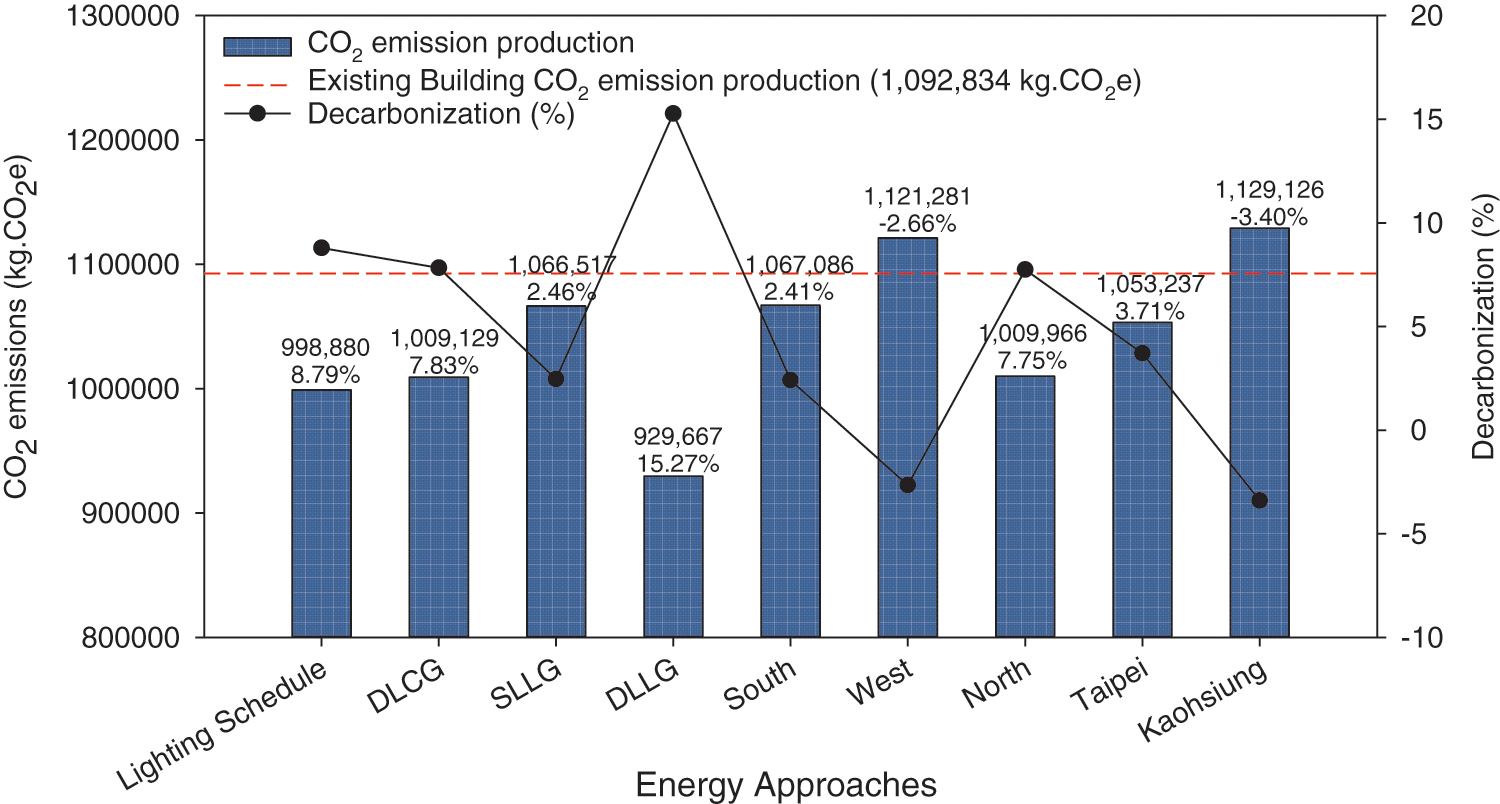
Figure 13: Comparison of each energy approach

Achieving energy savings in a building is beneficial not only in reducing the annual energy consumption but also in reducing the annual electricity bills which leads to cost savings. According to the data collection report, the overall annual electricity cost of the investigated hotel building is NT$7,451,963; with the average price of electricity is NT$3.4518/kWh in Taiwan.
Through several energy approach scenarios, each scenario will result in different annual electricity bill. Fig. 14 indicated the electricity bills analysis of each cases. Detailed electricity bill analysis is summarized in Table 12. Compared to the annual electricity bill of the existing building in 2023, the highest cost saving case is that replacing the exterior glazing of the building into DLLG. The electricity bill is reduced up to 13% of the initial cost, with the value of NT$969,082. The cost reduction is almost a million dollars which not only beneficial to the energy saving and energy efficiency but also to the cost saving of the existing building annually. The similar case which replacing the exterior glazing to DLCG without the low-emissivity type has also significantly reduced the annual electricity bill by 5.57% which equals to NT$414,972. The double layer glass design has the potential to reduce the energy consumption as aforementioned in previous section which results in the annual cost saving of the electricity bill.
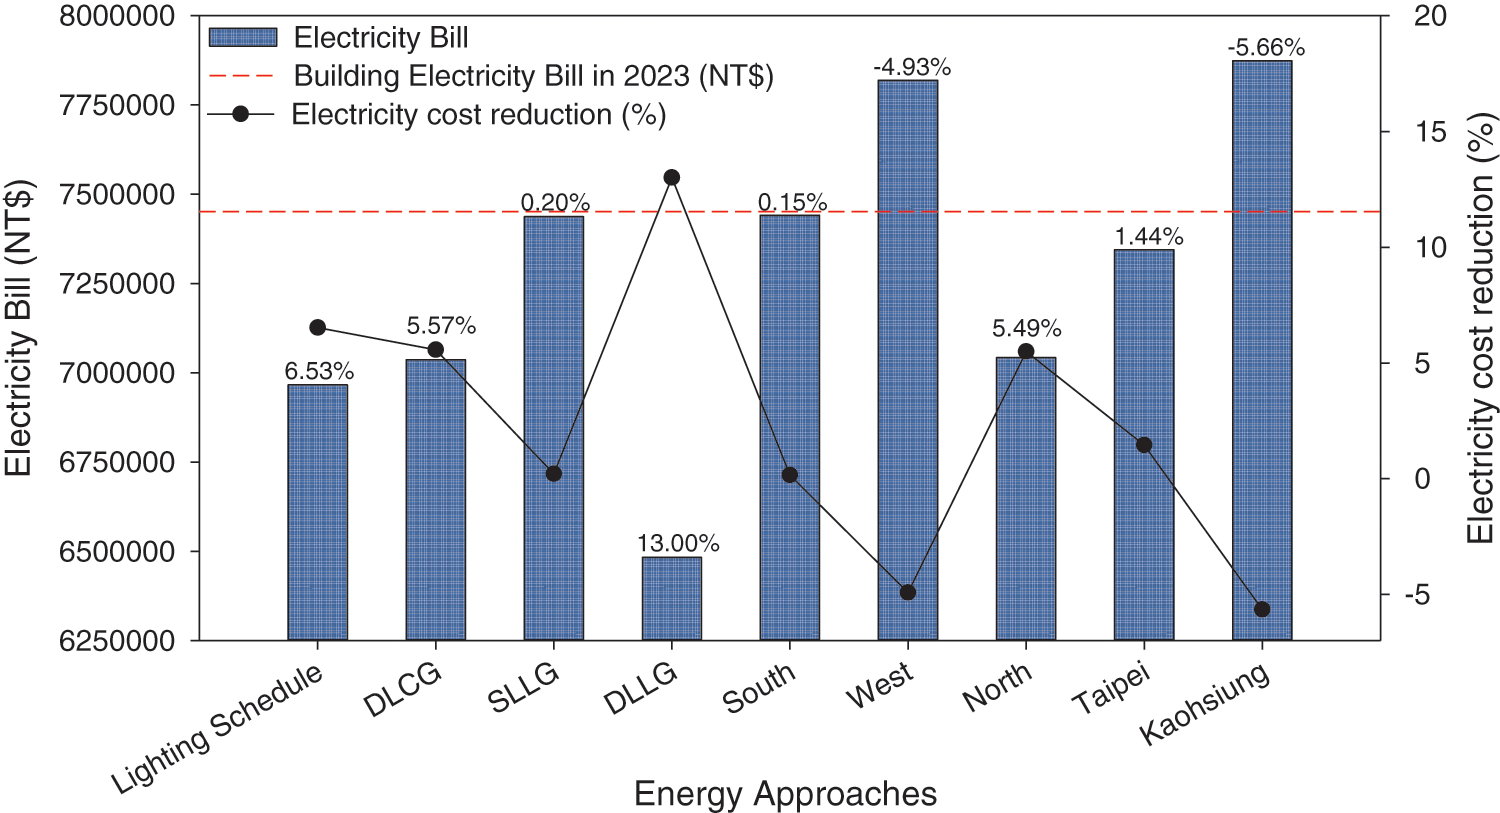
Figure 14: Comparison of electricity bills for each case

Another case that significantly reduces the annual electricity bill is arranging the lighting schedule align with the ASHRAE Standard 90.1, with the reduction up to 6.53% equals to NT$486,441. The reduction is almost half million dollars which would be more beneficial if the approach is combined with other beneficial approaches, such as replacing the exterior glazing into DLCG or DLLG. Meanwhile, slight reduction in electricity bill also occurred in several cases including: replacing exterior glazing to SLLG by 0.20%, changing the building orientation to the south by 0.15%, and moving the site location to the northern part of Taiwan (Taipei) by 1.44%.
On the contrary, the results of changing the building orientation to the west is actually exceeding the energy consumption of the baseline design which results in the increasing annual electricity bill by 4.93%, with the value of NT$7,819,069. Similarly, changing the location to the southern part of Taiwan (Kaohsiung) is also increasing the electricity by 5.66% with the value of $7,873,770.
By conducting this study, it is discovered that there are several factors that could influence the energy consumption of a hotel building. As well as lighting, building materials, location climates, and shadings. Therefore, this study presents four different energy-efficient approaches to be implemented in the investigated hotel building to reduce the energy consumption of the building. The four scenarios were analyzed and investigated. Including the arrangement of a lighting schedule based on the ASHRAE Standard 90.1, glazing replacements, arranging building orientation, and moving the building into different locations. The results of the study are summarized as follows:
a) The first scenario is that the investigated hotel building was proposed to arrange the lighting schedule based on the ASHRAE Standard 90.1 for lighting requirements. The simulation results revealed that arranging the lighting schedule could reduce the energy consumption of the investigated hotel building by around 8.22%, electricity cost reduced by 6.53%, and CO2 emissions reduced by 8.79%.
b) The second scenario of the investigated hotel building is the implementation of the glazing. The results indicate that DLLG effectively reduces the energy consumption of the building. Because the low-emissivity glass could potentially reduce the solar heat gain from outside the building, the air gap between the double-layer glass could eliminate the heat to be insulated. The energy consumption is reduced by 14.58%, and electricity cost is reduced by 13%, with the CO2 emissions reduced by 15.27%.
c) The third scenario is changing the orientation of the investigated hotel building. The results revealed that changing the orientation to the South could reduce energy by 1.96%, the CO2 emissions reduced by 2.41%. In addition, the building orientation to the North also presents a lower energy consumption that could reduce energy by 7.20%, electricity cost slightly reduced by 5.49%, and the CO2 emissions reduced by 7.75%.
d) The last scenario is by moving the building location. It has been revealed that building location could influence energy consumption compared to hotel buildings in Central Taiwan. It is reported that energy reduction could be achieved by 3.23% with the CO2 emissions reduced by 3.71%. When the hotel building was located in the Northern part of Taiwan. In contrast, the southern part of Taiwan presents a higher energy consumption of 3.74%, and electricity cost is increased by 5.66%, with the CO2 emissions increased by 3.40%.
Overall results in this study revealed that the energy performance relevant to the CO2 emissions produced by a building as well as the electricity expenses. The results show arranging the lighting schedule align with the ASHRAE Standard 90.1 and utilizing the DLLG glazing are the most suitable strategies to implement to enhance the energy performance of the hotel building. However, the strategy of changing the building orientation and location is not applicable despite the capability of reducing the overall energy consumption of the building. This study includes these strategies to present the insight for helping to design new buildings to take into consideration by the building owners.
Acknowledgement: None.
Funding Statement: The authors would like to express great appreciation for the financial support by the National Science and Technology Council under grant no. NSTC 112-2221-E-167-017-MY3.
Author Contributions: The authors confirm contribution to the paper as follows: study conception and design: Alya Penta Agharid, Susan Gustiyana; data collection: Indra Permana, Susan Gustiyana, Fujen Wang; energy modelling and validation: Alya Penta Agharid, Susan Gustiyana; analysis and interpretation of results: Alya Penta Agharid, Susan Gustiyana, Indra Permana, Nitesh Singh; supervision and funding acquisition: Fujen Wang; draft manuscript preparation: Alya Penta Agharid, Susan Gustiyana, Indra Permana, Nitesh Singh, Fujen Wang. All authors reviewed the results and approved the final version of the manuscript.
Availability of Data and Materials: Data available on request from the authors.
Ethics Approval: Not applicable.
Conflicts of Interest: The authors declare that they have no conflicts of interest to report regarding the present study.
References
1. BOE of Taiwan, Energy Audit Annual Report for Non-Productive Industries 2023 (In ChineseTaipei, Taiwan: MOEA 2023. Accessed: Apr. 3, 2024. [Online]. Available: https://www.ecct.org.tw/Knowledge/knowledge_more?id=b719206f7aa641e8bce17edd1e9be451 [Google Scholar]
2. I. Bosu, H. Mahmoud, and H. Hassan, “Energy audit, techno-economic, and environmental assessment of integrating solar technologies for energy management in a university residential building: A case study,” Appl. Energy, vol. 341, Jul. 2023, Art. no. 121141. doi: 10.1016/j.apenergy.2023.121141. [Google Scholar] [CrossRef]
3. P. Spudys, A. Jurelionis, and P. Fokaides, “Conducting smart energy audits of buildings with the use of building information modelling,” Energy Build., vol. 285, Apr. 2023, Art. no. 112884. doi: 10.1016/j.enbuild.2023.112884. [Google Scholar] [CrossRef]
4. V. Karki, R. Mostafa, B. Gopalakrishnan, and D. R. Johnson, “Determination of effectiveness of energy management system in buildings,” Energy Eng., vol. 120, no. 2, pp. 561–586, Nov. 2022. doi: 10.32604/ee.2023.025218. [Google Scholar] [CrossRef]
5. E. McLaughlin and J. K. Choi, “Utilizing machine learning models to estimate energy savings from an industrial energy system,” Resour. Environ. Sustain., vol. 12, no. 1, Jun. 2023, Art. no. 100103. doi: 10.1016/j.resenv.2022.100103. [Google Scholar] [CrossRef]
6. L. Vandenbogaerde, S. Verbeke, and A. Audenaert, “Optimizing building energy consumption in office buildings: A review of building automation and control systems and factors influencing energy savings,” J. Build. Eng., vol. 76, no. 8, Oct. 2023, Art. no. 107233. doi: 10.1016/j.jobe.2023.107233. [Google Scholar] [CrossRef]
7. R. Lee, M. Choi, J. Yoon, and D. Kim, “Impacts of lighting and plug load variations on residential building energy consumption targeting zero energy building goals,” J. Build. Eng., vol. 75, Sep. 2023, Art. no. 106962. doi: 10.1016/j.jobe.2023.106962. [Google Scholar] [CrossRef]
8. Y. Ye, C. A. Faulkner, W. Jung, J. Zhang, and E. Brock, “A new database of building-space-specific internal loads and load schedules for performance based code compliance modeling of commercial buildings,” Build. Simul., vol. 17, no. 6, pp. 877–892, May 2024. doi: 10.1007/s12273-024-1111-z. [Google Scholar] [CrossRef]
9. S. Song, J. Long, H. Jiang, B. Ran, and L. Yao, “Characteristics of office lighting energy consumption and its impact on air conditioning energy consumption,” Energy Built. Environ., vol. 5, no. 4, pp. 529–543, Aug. 2024. doi: 10.1016/j.enbenv.2023.04.003. [Google Scholar] [CrossRef]
10. G. Kang, K. Kang, and D. Song, “Optimized blind control method to minimize heating, cooling and lighting energy,” Energy Procedia, vol. 78, no. 5, pp. 2857–2862, Nov. 2015. doi: 10.1016/j.egypro.2015.11.651. [Google Scholar] [CrossRef]
11. M. A. Mujeebu and N. Ashraf, “Energy-saving benefits of thermal insulation and glazing in code-compliant office building in cooling-dominated climates,” Renew. Sustain. Energy Rev., vol. 199, no. 4, Jul. 2024, Art. no. 114532. doi: 10.1016/j.rser.2024.114532. [Google Scholar] [CrossRef]
12. E. Sorooshnia et al., “A novel approach for optimized design of low-E windows and visual comfort for residential spaces,” Energy Built. Environ., vol. 6, no. 1, pp. 27–42, Aug. 2023. doi: 10.1016/j.enbenv.2023.08.002. [Google Scholar] [CrossRef]
13. S. J. Lee and S. Y. Song, “Energy efficiency, visual comfort, and thermal comfort of suspended particle device smart windows in a residential building: A full-scale experimental study,” Energy Build., vol. 298, no. 12, Nov. 2023, Art. no. 113514. doi: 10.1016/j.enbuild.2023.113514. [Google Scholar] [CrossRef]
14. N. Kunwar, K. S. Cetin, U. Passe, X. Zhou, and Y. Li, “Energy savings and daylighting evaluation of dynamic venetian blinds and lighting through full-scale experimental testing,” Energy, vol. 197, Apr. 2020, Art. no. 117190. doi: 10.1016/j.energy.2020.117190. [Google Scholar] [CrossRef]
15. T. Pekdogan, H. Yildizhan, M. H. Ahmadi, and M. Sharifpur, “Assessment of window renovation potential in an apartment with an energy performance approach,” Int. J. Low-Carbon Technol., vol. 19, pp. 1529–1539, Jul. 2024. doi: 10.1093/ijlct/ctae066. [Google Scholar] [CrossRef]
16. M. Nur-E-Alam, M. Vasiliev, B. K. Yap, M. A. Islam, Y. Fouad and T. S. Kiong, “Design, fabrication, and physical properties analysis of laminated Low-E coated glass for retrofit window solutions,” Energy Build., vol. 318, Sep. 2024, Art. no. 114427. doi: 10.1016/j.enbuild.2024.114427. [Google Scholar] [CrossRef]
17. W. Ren, J. Zhao, and M. Chang, “Energy-saving optimization based on residential building orientation and shape with multifactor coupling in the Tibetan areas of western Sichuan, China,” J. Asian Archit. Build. Eng., vol. 22, no. 3, pp. 1476–1491, Jun. 2022. doi: 10.1080/13467581.2022.2085725. [Google Scholar] [CrossRef]
18. V. Gupta and C. Deb, “Envelope design for low-energy buildings in the tropics: A review,” Renew Sustain. Energy Rev., vol. 186, Oct. 2023, Art. no. 113650. doi: 10.1016/j.rser.2023.113650. [Google Scholar] [CrossRef]
19. Q. S. Haseeb, S. M. Yunus, A. A. A. Shoshan, and A. I. Aziz, “A study of the optimal form and orientation for more energy efficiency to mass model multi-storey buildings of Kirkuk city, Iraq,” Alex Eng. J., vol. 71, no. 9, pp. 731–741, May 2023. doi: 10.1016/j.aej.2023.03.020. [Google Scholar] [CrossRef]
20. H. G. Kim, H. J. Kim, C. H. Jeon, M. W. Chae, Y. H. Cho and S. S. Kim, “Analysis of energy saving effect and cost efficiency of ECMs to upgrade the building energy code,” Energies, vol. 13, no. 18, Sep. 2020, Art. no. 4955. doi: 10.3390/en13184955. [Google Scholar] [CrossRef]
21. IPMVP, International Performance Measurement and Verification Protocol: Concepts and Options for Determining Energy and Water Savings. Oak Ridge, USA: Efficiency valuation organization (EVO2012. Accessed: Jan. 15, 2024. [Online]. Available: https://evo-world.org [Google Scholar]
22. ASHRAE, ASHRAE Standard 90.1 Energy Standard for Buildings Except Low-Rise Residential Buildings. Atlanta, Georgia, USA: ASHRAE, 2013. [Google Scholar]
23. O. Mohiuddin, S. Asumadu-Sarkodie, and M. Obaidullah, “The relationship between carbon dioxide emissions, energy consumption, and GDP: A recent evidence from Pakistan,” Cogent. Eng., vol. 3, no. 1, Jul. 2016, Art. no. 1210491. doi: 10.1080/23311916.2016.1210491. [Google Scholar] [CrossRef]
24. A. Rokhmawati, “The nexus between type of energy consumed, CO2 emissions, and carbon-related costs,” Int. J. Energy Econ. Policy., vol. 10, no. 4, pp. 172–183, Apr. 2020. doi: 10.32479/ijeep.9246. [Google Scholar] [CrossRef]
25. MOEEA of Taiwan, 2022 Electricity Carbon Emission Factor. Taipei, Taiwan: MOEEA, 2022. Accessed: Jan. 28, 2024. [Online]. Available: https://www.moeaea.gov.tw/ECW/english/content/Content.aspx?menu_id=24200 [Google Scholar]
Cite This Article
 Copyright © 2024 The Author(s). Published by Tech Science Press.
This work is licensed under a Creative Commons Attribution 4.0 International License , which permits unrestricted use, distribution, and reproduction in any medium, provided the original work is properly cited.


 Submit a Paper
 Propose a Special lssue
 View Full Text
 Download PDF
 Downloads
 Citation Tools