 Open Access
ARTICLE
Rapid Parameter-Optimizing Strategy for Plug-and-Play Devices in DC Distribution Systems under the Background of Digital Transformation
1 Information and Communication Research Institute, State Grid Information & Telecommunication Group, Co., Ltd., Beijing, 102200, China
2 School of Electrical Engineering, Xi’an Jiaotong University, Xi’an, 710049, China
* Corresponding Author: Zaibin Jiao. Email:
Energy Engineering 2024, 121(12), 3899-3927. https://doi.org/10.32604/ee.2024.055899
Received 09 July 2024; Accepted 20 September 2024; Issue published 22 November 2024
Abstract
By integrating advanced digital technologies such as cloud computing and the Internet of Things in sensor measurement, information communication, and other fields, the digital DC distribution network can efficiently and reliably access Distributed Generator (DG) and Energy Storage Systems (ESS), exhibiting significant advantages in terms of controllability and meeting requirements of Plug-and-Play (PnP) operations. However, during device plug-in and -out processes, improper system parameters may lead to small-signal stability issues. Therefore, before executing PnP operations, conducting stability analysis and adjusting parameters swiftly is crucial. This study introduces a four-stage strategy for parameter optimization to enhance system stability efficiently. In the first stage, state-of-the-art technologies in measurement and communication are utilized to correct model parameters. Then, a novel indicator is adopted to identify the key parameters that influence stability in the second stage. Moreover, in the third stage, a local-parameter-tuning strategy, which leverages rapid parameter boundary calculations as a more efficient alternative to plotting root loci, is used to tune the selected parameters. Considering that the local-parameter-tuning strategy may fail due to some operating parameters being limited in adjustment, a multi-parameter-tuning strategy based on the particle swarm optimization (PSO) is proposed to comprehensively adjust the dominant parameters to improve the stability margin of the system. Lastly, system stability is reassessed in the fourth stage. The proposed parameter-optimization strategy’s effectiveness has been validated through eigenvalue analysis and nonlinear time-domain simulations.Keywords
The rapid development of Distributed Renewable Sources (DRS), Energy Storage Systems (ESS), and controllable loads has rendered traditional AC distribution systems increasingly unsustainable. In contrast, DC distribution technology, providing efficient and reliable integration of Distributed Generation (DG) and storage units, is considered a more attractive solution for meeting the requirements of Plug-and-Play (PnP) operations [1]. Digital DC distribution networks, by integrating advanced digital technologies such as big data, the Internet of Things (IoT), blockchain, and artificial intelligence (AI) in areas including sensing and measurement, data mining, information communication, and operational control, are poised to become a critical component of future grids [2–4]. In the area of information communication, technologies such as switching ripple communication [5], cognitive radio [6], and 5G networks [7] support high-quality, low-latency communication, facilitating interaction between various control stations and the central controller. The advancement of cloud computing [8] and hardware devices has further enhanced the computing capability of central controllers, enabling the rapid resolution of more complex problems.
Although DC distribution systems are free from reactive power, phase, and frequency issues, the complex interactions among numerous power electronic devices lead to significant small-perturbation stability problems. Poorly designed control schemes or improperly tuned controllers may lead to small-signal stability issues during device plug-in and -out processes [9]. In this context, to achieve PnP operations, establishing an accurate small-signal model and proposing a parameter-optimizing strategy that can rapidly enhance system stability is paramount for digital DC distribution systems.
As mentioned above, individual inappropriate parameters may decrease the stability margin of DC distribution networks. Therefore, employing local-parameter-tuning instead of simultaneously adjusting numerous parameters is faster and more feasible in such cases for enhancing system stability. Traditional individual parameter tuning strategy typically begins by utilizing Participation Factor (PF) and Eigenvalue Parametric Sensitivity (EPS) to determine dominant parameters affecting stability. Subsequently, root loci are drawn as the selected parameters vary, with the goal of determining their feasible ranges and suitable values [10]. Nonetheless, the Modulus of Eigenvalue Parametric Sensitivity (MEPS), which does not consider the angle of EPS, was utilized to identify dominant parameters, potentially leading to less accurate descriptions of parameter impacts on system stability. Additionally, generating root locus requires repeated calculation of high-order matrix eigenvalues, resulting in excessive time consumption and computing burden, which fail to meet the rapid adjustment requirements specified for digital PnP DC distribution systems.
Current research employs parameter boundary calculation to determine the small-signal stability margin of power systems, offering an alternative to drawing root loci that require less time. System parameters are classified into control parameters and operating parameters based on variations in system equilibrium points [11]. Reference [12] introduced a Newton-based iteration method for calculating parameter boundaries. However, this method necessitates repeated computation of EPS during each iteration when estimating new values using the Newton formula, which proves time-consuming. Literature [13] proposed a secant-based iteration method that avoids repeated EPS calculations, which speeds up boundary computation. It is worth noting that, for control parameters, Reference [11] presented a boundary calculation approach utilizing Eigenvalue Perturbation Theory (EPT), eliminating the need for solving nonlinear equations.
Given that some operating parameters are limited in adjustment, local-parameter-tuning may fail. Therefore, a multi-parameter-tuning strategy is necessary to enhance system stability and ensure the realization of PnP operation. Literature [14] proposed a multi-parameter-tuning method based on EPS, but it requires recalculating EPS at each iteration, which is time-consuming. Currently, metaheuristic algorithms such as Particle Swarm Optimization (PSO) [15–18], genetic algorithms [19], and ant colony optimization [20] have been widely used in parameter optimization for power systems. However, existing optimization algorithms typically focus solely on optimizing control parameters and are often tailored for parameter design, making them unsuitable for direct application in multi-parameter-tuning scenarios.
Based on the issues above, the main contributions of this paper are:
• Establishes a small-signal model that comprehensively considers the components and topological characteristics of digital DC distribution systems.
• Proposes a parameter-optimizing strategy for digital PnP DC distribution systems that consist of correction, locating, tuning, and verification stages, which aims to swiftly enhance the system’s small-signal stability before performing PnP operations.
• Develops a multi-parameter-tuning method based on PSO to enhance the system’s stability margin when local-parameter-tuning proves inadequate.
The rest of the paper is organized as follows: Section 2 proposes the control strategies and dynamic models for digital DC distribution systems. Various boundary calculation methods and improvement measures are introduced, and the implementation process of the parameter-optimizing strategy is shown in Section 3. Meanwhile, a multi-parameter-tuning strategy based on PSO is presented in Section 4. Section 5 verifies the established small-signal model’s precision and demonstrates the proposed parameter-optimization strategy’s effectiveness within a practical system. Finally, Section 6 summarizes the primary conclusions and contributions of this study.
2 The Model of the PnP DC Distribution System
2.1 Introduction of the Analyzed System
Fig. 1 illustrates the classic configuration of a digital DC distribution system, comprising the main grid, DG, VSC, DC distribution network, and loads [21–24]. Additionally, a dedicated central controller is employed to perform the calculations required for parameter optimization and to determine the control actions for all units [25]. Fig. 2 shows the equivalent circuit of the studied system. The DGs and main grid are treated as ideal AC sources, with their internal controllers omitted. These sources are connected through series impedance, and a constant output voltage is assumed, thereby neglecting the impact of the dynamic behaviors of the AC system on the stability analysis [10,26]. The DC distribution network adopts a symmetrical single-pole structure, with DC cables equivalent to the RL circuit [22]. Loads are considered as RL-parallel constant impedance loads. Filters are installed on the AC side of the two-level VSC to suppress the significant harmonics it injects.
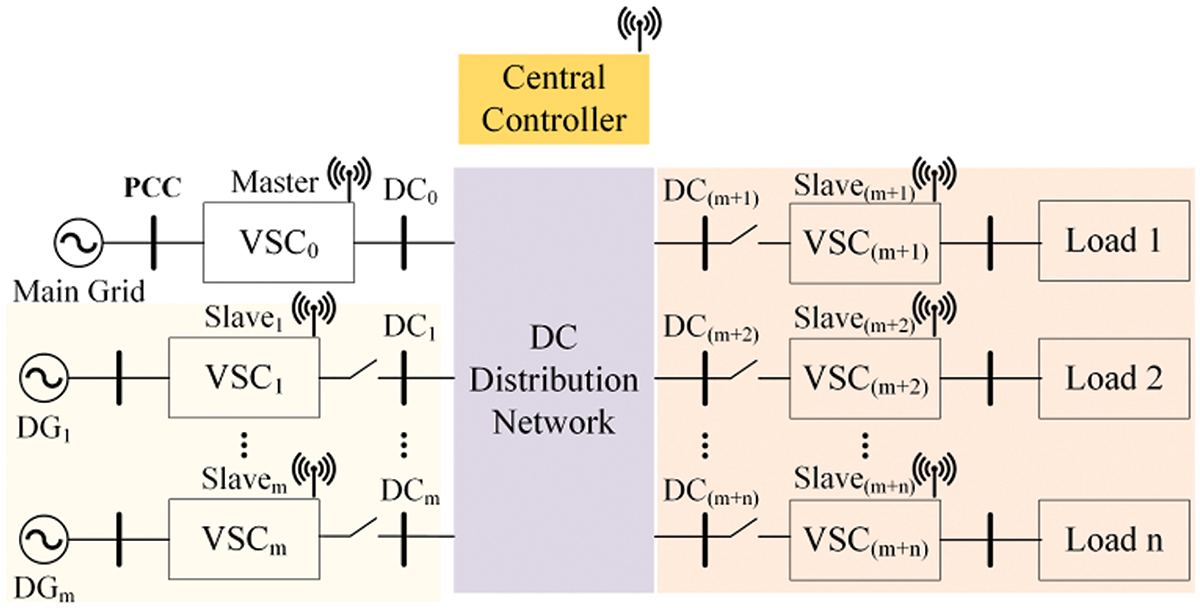
Figure 1: Classic configuration of a digital VSC-based DC distribution system
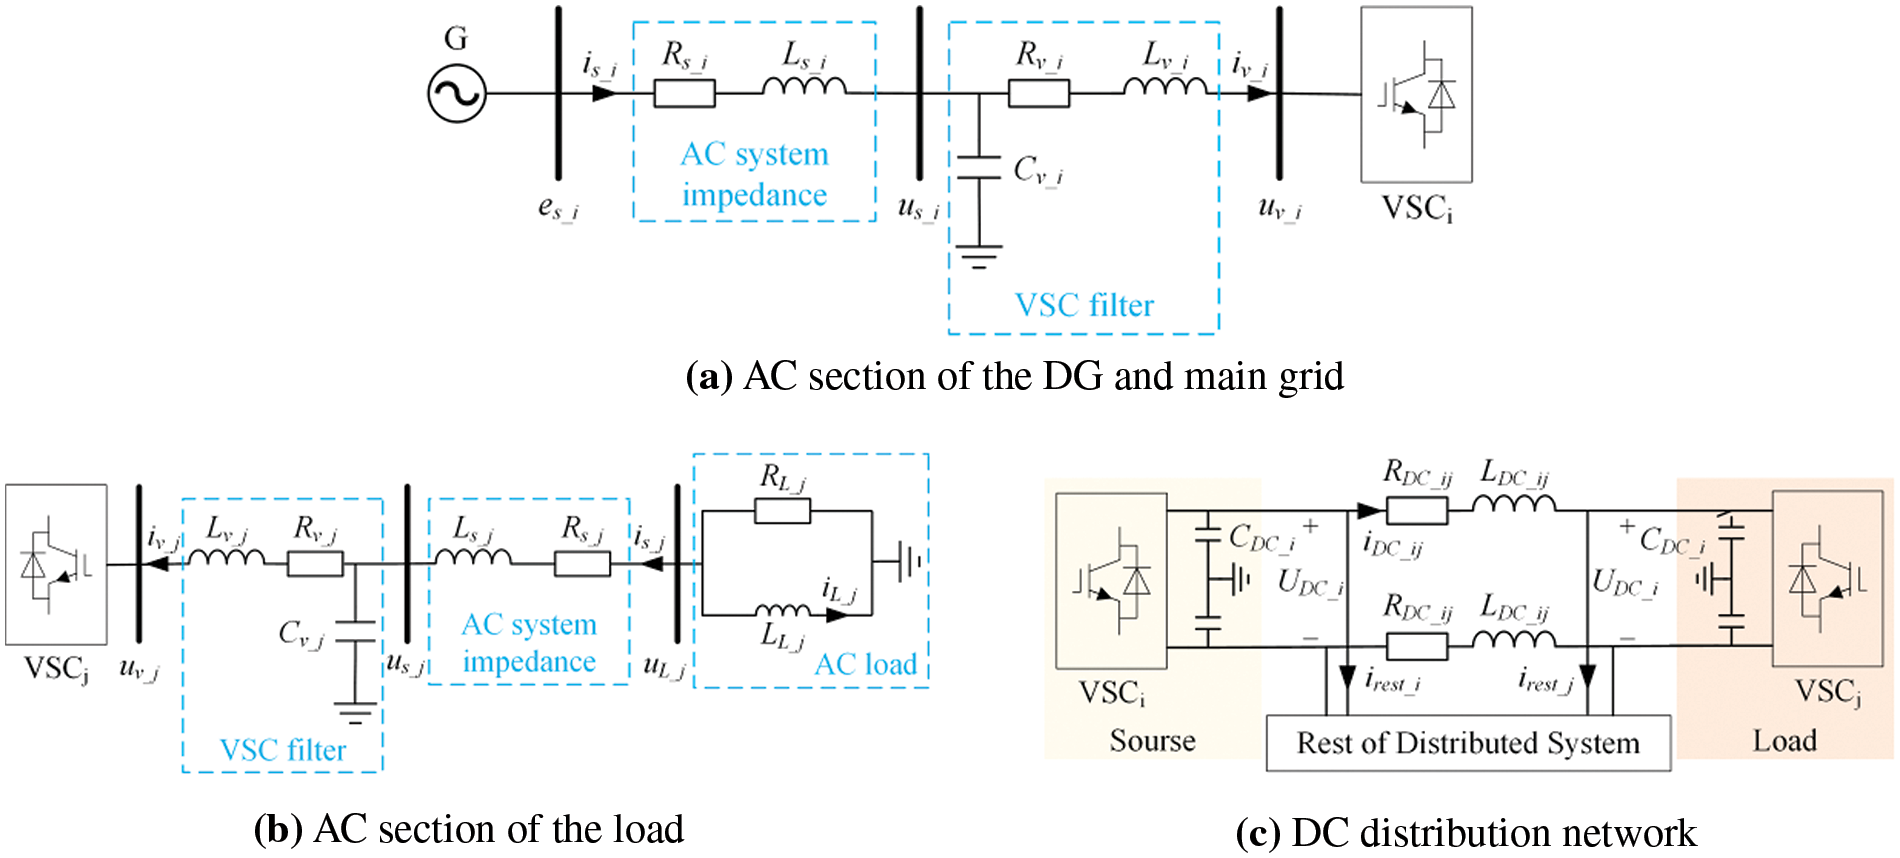
Figure 2: Equivalent circuits
2.2 Nonlinear State-Space Model
The differential equations for the DGs and main grid, as depicted in Fig. 2a, can be formulated as Eq. (1).
where
The mathematical equations for the load depicted in Fig. 2b are:
where
The dynamic model of the DC section, as illustrated in Fig. 2c, is formulated as follows:
If the power loss of the VSC is neglected:
2.3 Control Strategy of the VSC
This paper employs the dq coordinate system and the Proportional Integral (PI) algorithm to control the VSC output. Regarding power-sharing control strategies, the droop control method is widely used in DC distribution systems because it eliminates the need for communication [25,27,28]. However, a central controller is essential in this paper, which diminishes the primary advantage of droop control and makes the master-slave strategy, which leverages the existing communication framework, a more suitable choice. Fig. 3 illustrates the comprehensive control system of the VSC, utilizing a phase locked loop (PLL) for synchronizing the control system’s voltage with the AC system [29]. Notably, the load’s VSC no longer requires PLL because it is designed as a grid-forming converter supplying passive impedance [30]. A vector current controller (VCC) is composed of an inner-loop current controller and an outer-loop power controller [10,21].
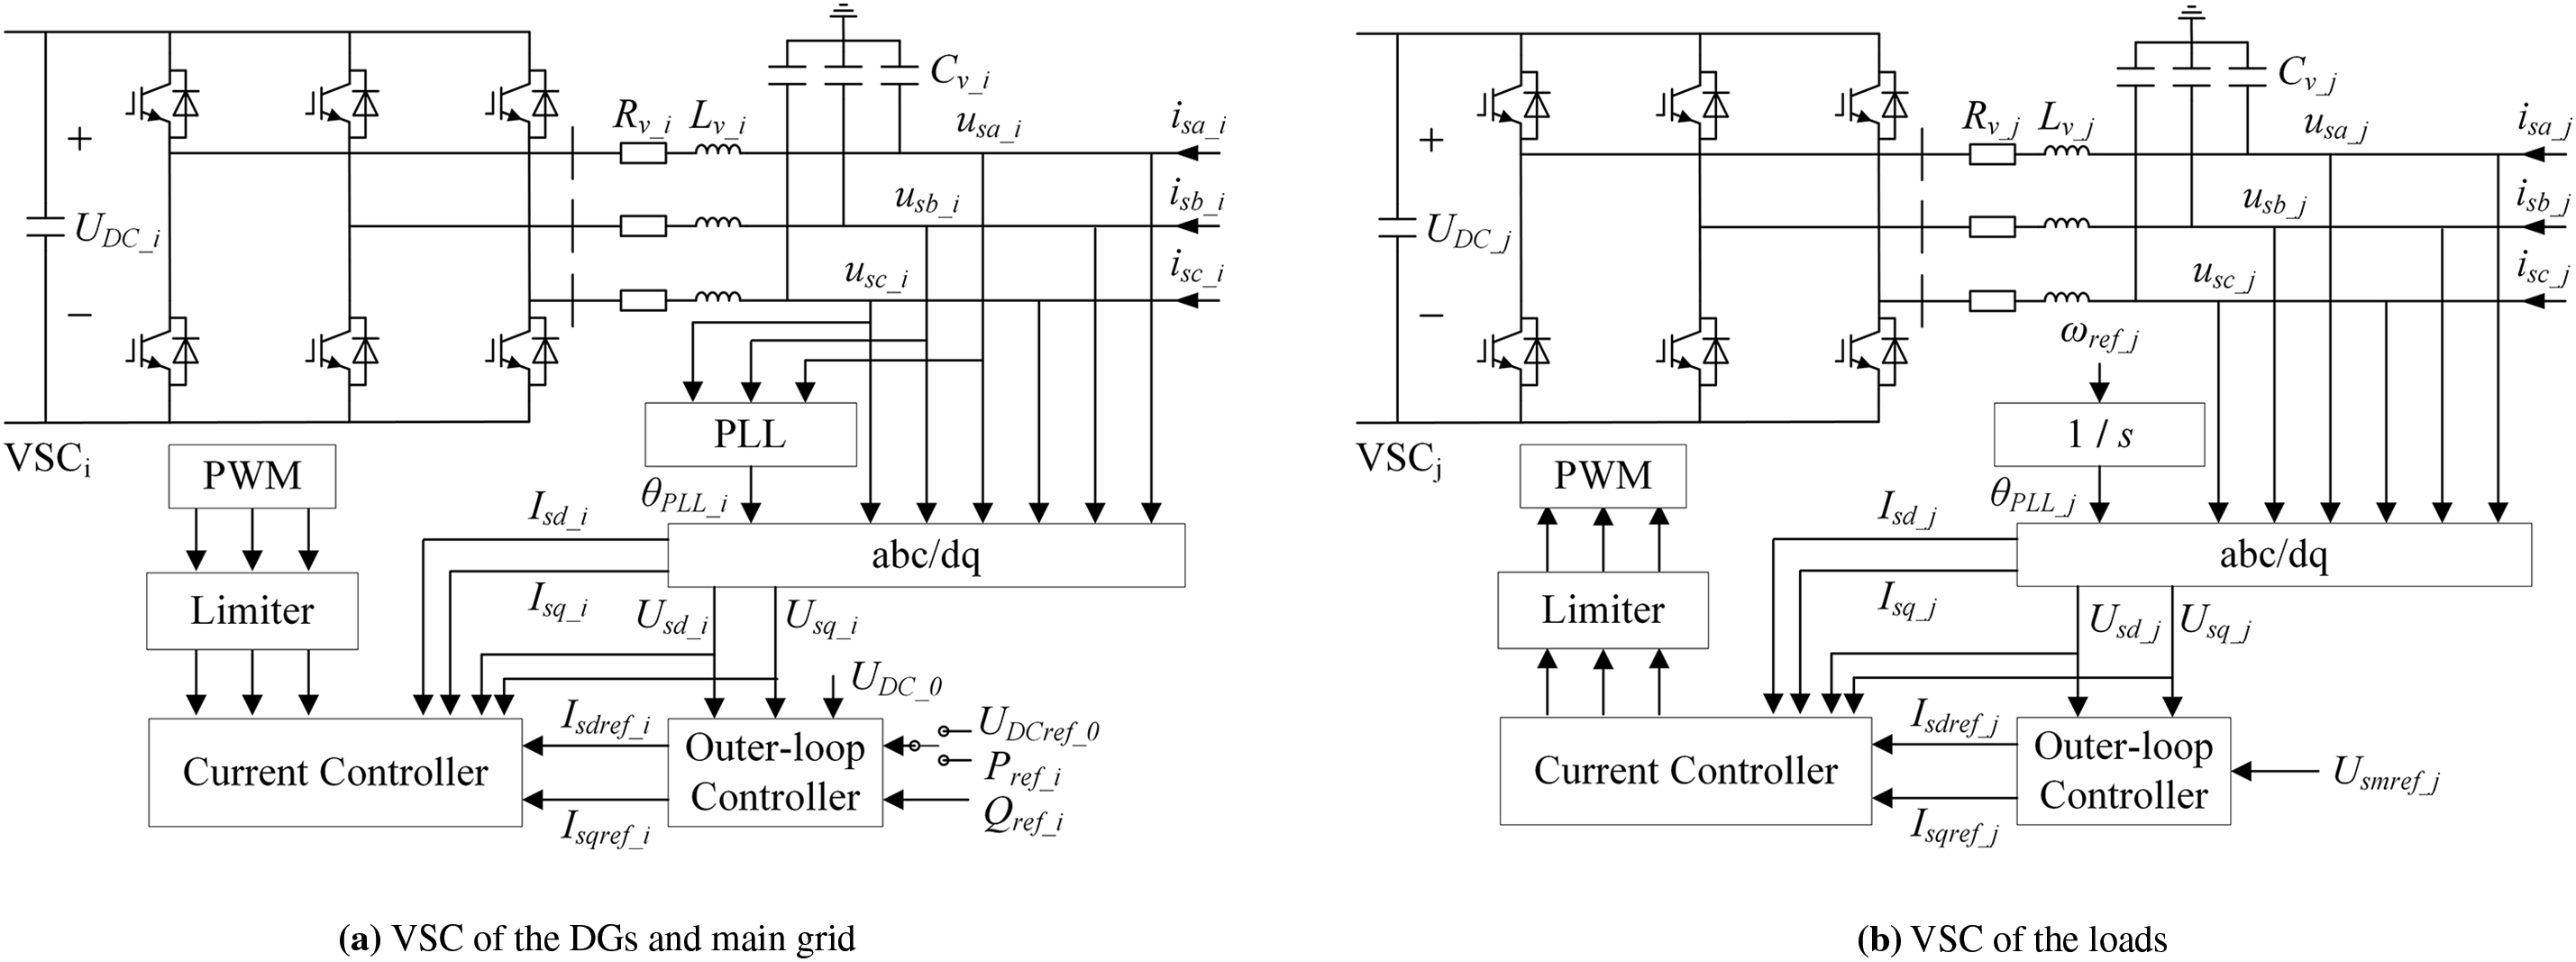
Figure 3: Control system of the VSC
The PLL’s control block diagram is shown in Fig. 4, and its dynamic model is described by:

Figure 4: Control diagram of the PLL
2.3.2 Inner-Loop Current Controller
The current controller adjusts the VSC terminal voltage
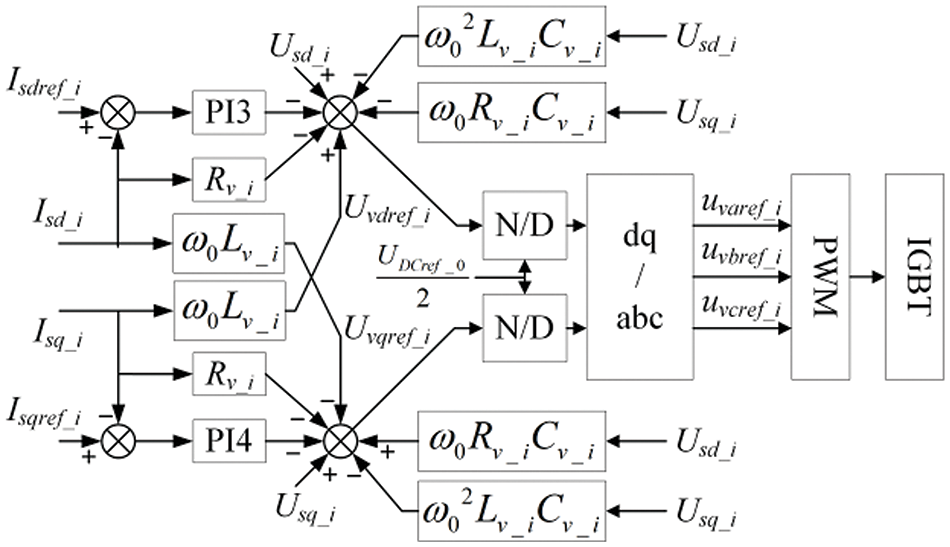
Figure 5: Control diagram of the current controller
According to the principle of Pulse Width Modulation (PWM), for a three-phase bridge converter circuit:
2.3.3 Outer-Loop Power Controller
In this paper, the master station connected to the main grid adopts a scheme of constant
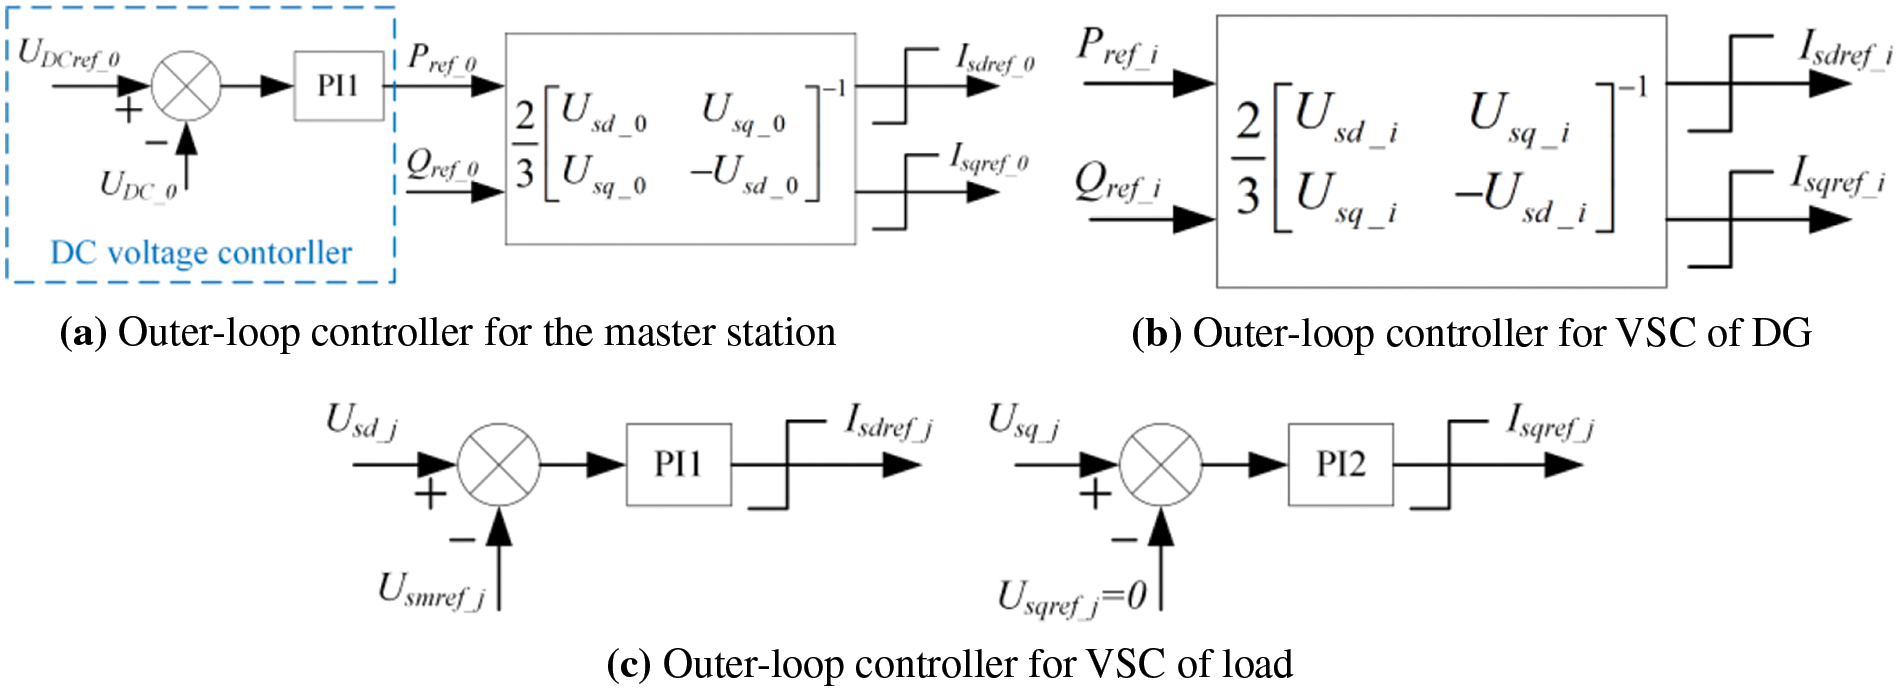
Figure 6: Control diagram of the outer-loop controller
The dynamic models of the outer-loop controllers shown above are, respectively:
State variables that represent the outputs of each PI controller’s integral component are presented to streamline the VCC model. For instance, considering the master station, the mathematical equations are:
In summary, the mathematical model of the typical DC distribution system is formulated using Eqs. (1)–(13) as:
where u and x denote the input and state variables, respectively. By solving the algebraic equation in Eq. (15), the system’s equilibrium points can be determined.
The small-signal model of the studied system is derived by linearizing its nonlinear state-space model at the equilibrium points.
3 Rapid Local-Parameter-Tuning Strategy Based on Boundary Calculation
After devices are plugged in or out, an originally stable system may experience small-signal instability due to inappropriate individual parameters. Therefore, adjusting one or more key parameters, rather than globally optimizing all parameters, is a quicker and more feasible approach to enhance small-signal stability. However, current researches on parameter-tuning strategies often rely on root locus analysis [10], which is time-consuming and fails to meet the rapid adjustment requirements posed by PnP operation in digital DC distribution networks. A detailed strategy for local-parameter-tuning to address this issue will be proposed in this section.
3.1 Locating Dominant Parameters
The damping ratio describes the rate and characteristics of decay for the corresponding eigenvalue (
EPS measures the ability of parameter change to affect the system eigenvalue, whose definition is:
where
When
where
Considering the different orders of magnitude for various parameters, a change in parameters with smaller orders has a more significant impact on the eigenvalues than those in parameters with larger orders. In order to facilitate the identification of dominant parameters with significant influence on eigenvalue through EPS, normalization of EPS has been performed.
where
However, MEPS does not value the angle of EPS, which leads to potential inaccuracies when assessing how a parameter impacts system stability. Therefore, this paper introduces a novel indicator, more accurate than MEPS, known as the projection of EPS (PEPS) [22]. This metric describes the influence of a parameter on system stability, as defined in Eq. (24).
Fig. 7 illustrates the geometric interpretation of EPS, MEPS, and PEPS. The small-signal security boundary
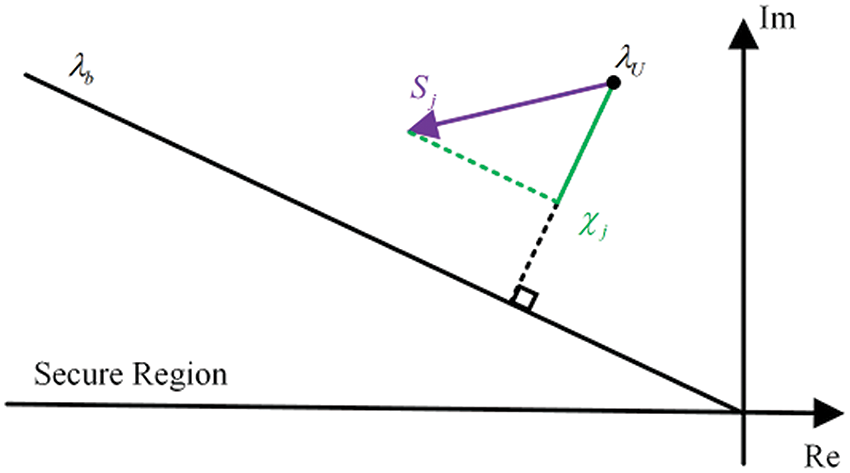
Figure 7: Schematic diagram of EPS, MEPS, PEPS
From a mathematical perspective,
3.2 EPT-Based Method for Calculating Control Parameter Boundaries
This paper rapidly determines the feasible region of control parameters using an EPT-based strategy [11], thus avoiding drawing root loci and freeing up resources for solving high-order nonlinear algebraic equations.
3.2.1 Principle of the EPT-Based Method
As mentioned above, the equilibrium points are not affected by variations in control parameters. Furthermore, analysis shows that the partial derivatives of elements in matrix A to control parameters
where
where
Assuming that the eigenvalues of A do not contain
To simplify the expression, define
Assuming that a change in
After obtaining
The order of
3.2.2 Simplification of E and D
Suppose the amount of non-zero columns and rows in Y are denoted as
When
When
Given that the control systems of each VSC operate independently, the mathematical equations introduced by state variables from other VSCs do not include the control parameters of a certain VSC. Therefore,
3.2.3 Determination of Feasible Region
After obtaining the parameter boundary
The values of
where
In conclusion, the steps for calculating the control parameter boundaries are outlined below:
First, calculate the matrix Y of A and form the matrices E and D according to Eqs. (33) or (34). Then, calculate the sign of the imaginary part of
3.3 Secant-Based Method for Calculating Operating Parameter Boundaries
Due to the fact that changes in operating parameters affect power flow and the partial derivatives of matrix A to certain operating parameters vary, the variation of A cannot be expressed by Eq. (26), which makes the EPT-based method mentioned above ineffective. Consequently, this section introduces a test function method for operating parameters to swiftly identify the security boundaries [13].
Given the estimated value of the operating parameter
where
The iteration halts once
where
The method requires two sets of initial values,
where the derivative term is the EPS used for locating the dominant parameters, which does not need to be recalculated. Fig. 8 illustrates the specific process of the secant method.

Figure 8: Flowchart of secant-based method
3.4 Process of Parameter-Optimizing Strategy
The process of the four-stage parameter-optimizing approach proposed in this paper is detailed in the flowchart presented in Fig. 9.
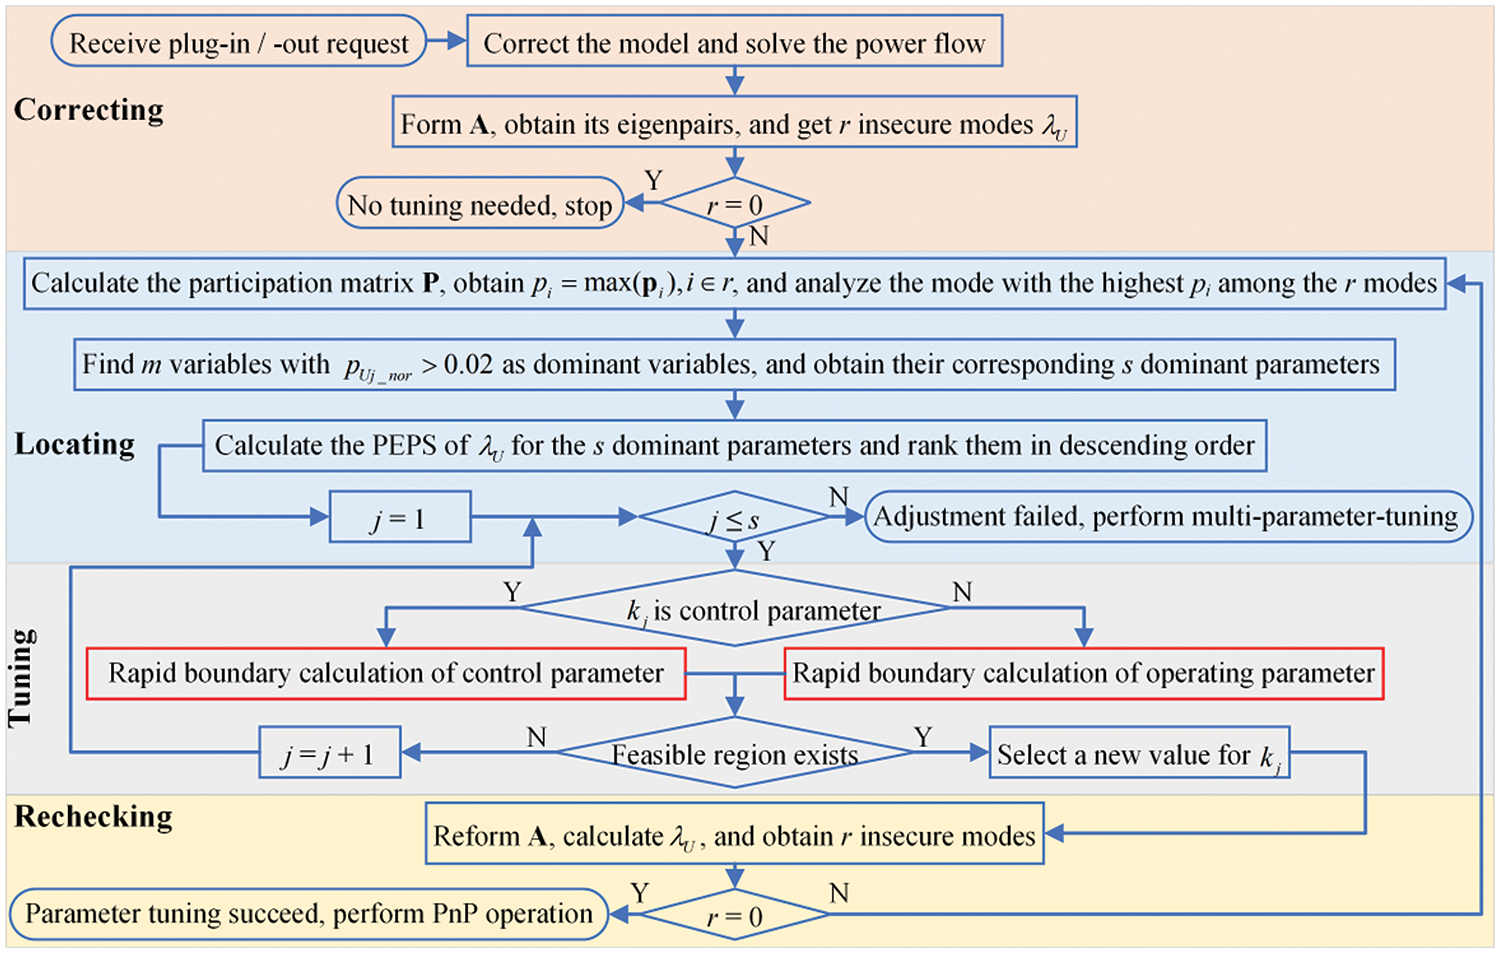
Figure 9: Flowchart of parameter-optimizing strategy
Stage 1 (Correcting Stage): Load fluctuations are common, and changes in the main grid’s operating mode may cause variations in the AC system impedance. Considering the importance of accurate system parameters for stability analysis, model parameters must be corrected first before any parameter tuning, which can be achieved using high-precision wide-area digital synchronized measurements based on phasor measurement unit (PMU) and synchrophasor communication technologies [34,35].
Stage 2 (Locating Stage): All insecure modes are sorted in descending order based on their maximum PFs, and the first mode is located as the dominant mode. Then, m dominant state variables are determined based on normalized PFs, i.e.,
The relationship between dominant state variables and system parameters is detailed in Section 5. Once the PEPSs are calculated, the dominant parameters can be adjusted sequentially in descending order.
Stage 3 (Tuning Stage): The feasible region for the selected dominant parameter is rapidly calculated based on parameter boundaries calculation, and a new parameter value is determined within the secure range. Note that if the adjustment of all dominant parameters does not meet stability requirements, i.e., j > s, local-parameter-tuning fails. In this case, the multi-parameter-tuning strategy based on PSO, as proposed in Section 4, is used to adjust multiple parameters comprehensively to improve system stability.
Stage 4 (Verification Stage): The system stability is rechecked using the updated parameter values from Stage 3. If instability persists, revisit the initial step of Stage 2 and evaluate the newly identified insecure modes. Alternatively, perform the PnP operation.
4 PSO-Based Multi-Parameter-Tuning Strategy
Due to the fact that some operating parameters, such as line impedance, cannot be adjusted in most cases, and others, such as control station setpoints, are usually limited in adjustment, the local-parameter-tuning strategy may fail. Thus, it becomes necessary to adjust multiple parameters comprehensively to improve the small-signal stability.
A simple and rapid method for simultaneous adjustment of multiple parameters has not been proposed yet. However, compared to traditional algorithms, metaheuristic algorithms, such as genetic algorithms and PSO, demonstrate significant advantages in handling complex problems, which provide effective solutions for multi-parameter-tuning. Considering that PSO, compared to other intelligent algorithms, offers fast search speeds, high efficiency, and good convergence, this section proposes a PSO-based multi-parameter-tuning strategy to enhance the system stability margin.
4.1 Design of Objective Function
To ensure that the system meets small-signal stability requirements, the objective function expressed in Eq. (42) aims to optimize the minimum damping ratio among all modes.
where
4.2 Selection and Boundary Determination of Adjustable Parameters
In most DC distribution systems, parameters such as line impedance and VSC filter parameters cannot be changed during operation. Moreover, due to constraints from power flow and DG output, the setpoints of the control station are limited in tuning. Although the PI parameters of converters can be freely adjusted, most control parameters have minimal impact on any specific mode. Therefore, before beginning multi-parameter-tuning, it is crucial to select parameters that significantly affect the dominant mode from all adjustable parameters, which allows the dominant mode to rapidly move past the security boundary and reduces the effect of parameter adjustments on system performances. This paper employs the PEPS proposed in Section 3 to determine the parameters to be optimized, and the detailed process will be introduced in the next section.
The boundaries of the parameters to be optimized are determined by various factors. For voltage setpoints in control station setpoints, considering power flow constraints and power quality requirements, fluctuations are limited within 5% [18]. For power setpoints in the control station, limitations are imposed by DG output and VSC transmission capacity. Unlike related research [16], this paper does not rely on empirical boundaries for PI parameters but only requires control parameters to be greater than zero, avoiding unsuitable boundary values that affect tuning results. Consequently, the constraints on the parameters to be optimized are expressed as Eq. (43).
4.3 Process of Multi-Parameter-Tuning Strategy
Fig. 10 shows the steps of the multi-parameter-tuning approach. After the failure of local-parameter-tuning, it is necessary to determine the parameters to be adjusted first.
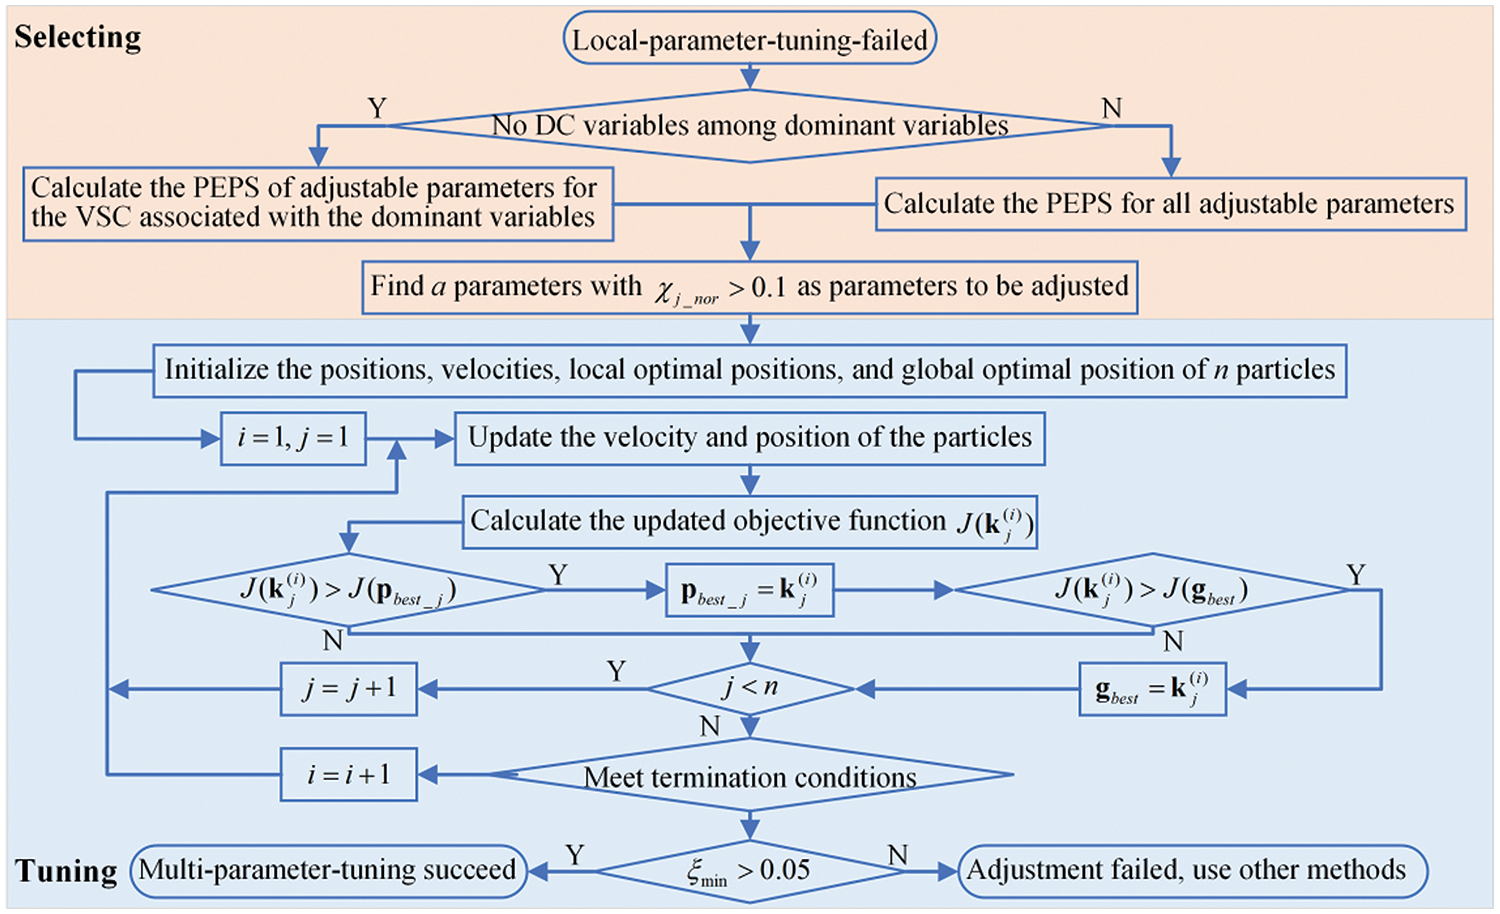
Figure 10: Diagram of the strategy for multi-parameter-tuning
a) Although local-parameter-tuning has failed, we have identified dominant variables and the PEPS of dominant parameters.
b) If the dominant variables do not include DC variables, calculate the PEPS for the setpoints and control parameters corresponding to the VSCs introducing these dominant variables. Note that if the PEPSs for adjustable parameters have already been computed during local-parameter-tuning, they do not need to be recalculated in this step. Otherwise, calculate the PEPS for all adjustable parameters because all VSCs significantly impact the DC system.
c) To rapidly drive the insecure modes across the security boundary, select parameters with normalized PEPS of at least 0.1, i.e.,
With a parameters to be optimized identified, we can proceed with adjusting them based on PSO. The boundaries for these parameters were provided in the last section. The detailed steps of the algorithm are as follows:
1. Initialization
Randomly generate n particles within the feasible region of the adjustable parameters and assign each particle a random initial velocity. Note that to accelerate the convergence of the PSO, a larger boundary is set for the control parameters during initialization, but these parameters will not be constrained by the boundary during the iterative process.
Simultaneously, the initial position of each particle is set as the local optimal position, and the objective function for each particle is computed. The particle with the smallest initial objective function is set as the global optimal position.
2. Velocity Update
Update the particle velocities using the formula shown in Eq. (45).
where
The constriction factors are employed to eliminate velocity boundary constraints and ensure the convergence of the PSO. Since a larger inertia weight facilitates global search and a smaller weight is more conducive to local search, adaptive inertia weight is introduced to enhance the optimization capability and convergence speed of the PSO.
3. Position Update
Update each particle’s position based on the updated velocity from the previous step.
4. Update of Local and Global Optimal Positions
Calculate the objective function for the updated particles and compare it with the objective function of
5. Termination of Iteration
The iteration terminates when the change in the global optimal value remains smaller than a certain threshold or when the maximum number of iterations is reached.
In this section, we build a digital four-terminal VSC-based DC distribution network to verify the accuracy of the small-signal model presented in Section 2 and the effectiveness of the proposed parameter-optimizing strategy. As shown in Fig. 11, this system includes a master station, a power slave station, and two passive loads. Switches
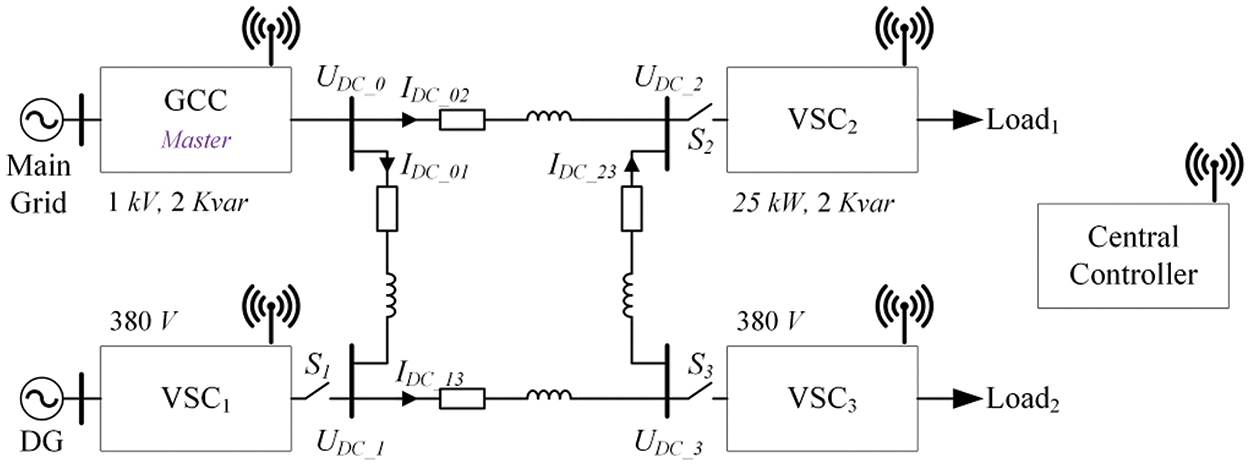
Figure 11: Configuration of the four-terminal DC distribution network

5.1 Establishment and Verification of Small-Signal Model
A mathematical model of the system mentioned above, comprising 53 state variables and 6 input variables as expressed by Eq. (49), is established in MATLAB. The linearized model can be represented as Eq. (50).
A small disturbance is introduced, and the response curves of different state variables obtained from the linearized model in MATLAB and the simulation model in PSCAD are plotted, as shown in Fig. 12. The results obtained from PSCAD simulations and MATLAB numerical computations align, ensuring the accuracy of proposed small-signal models.
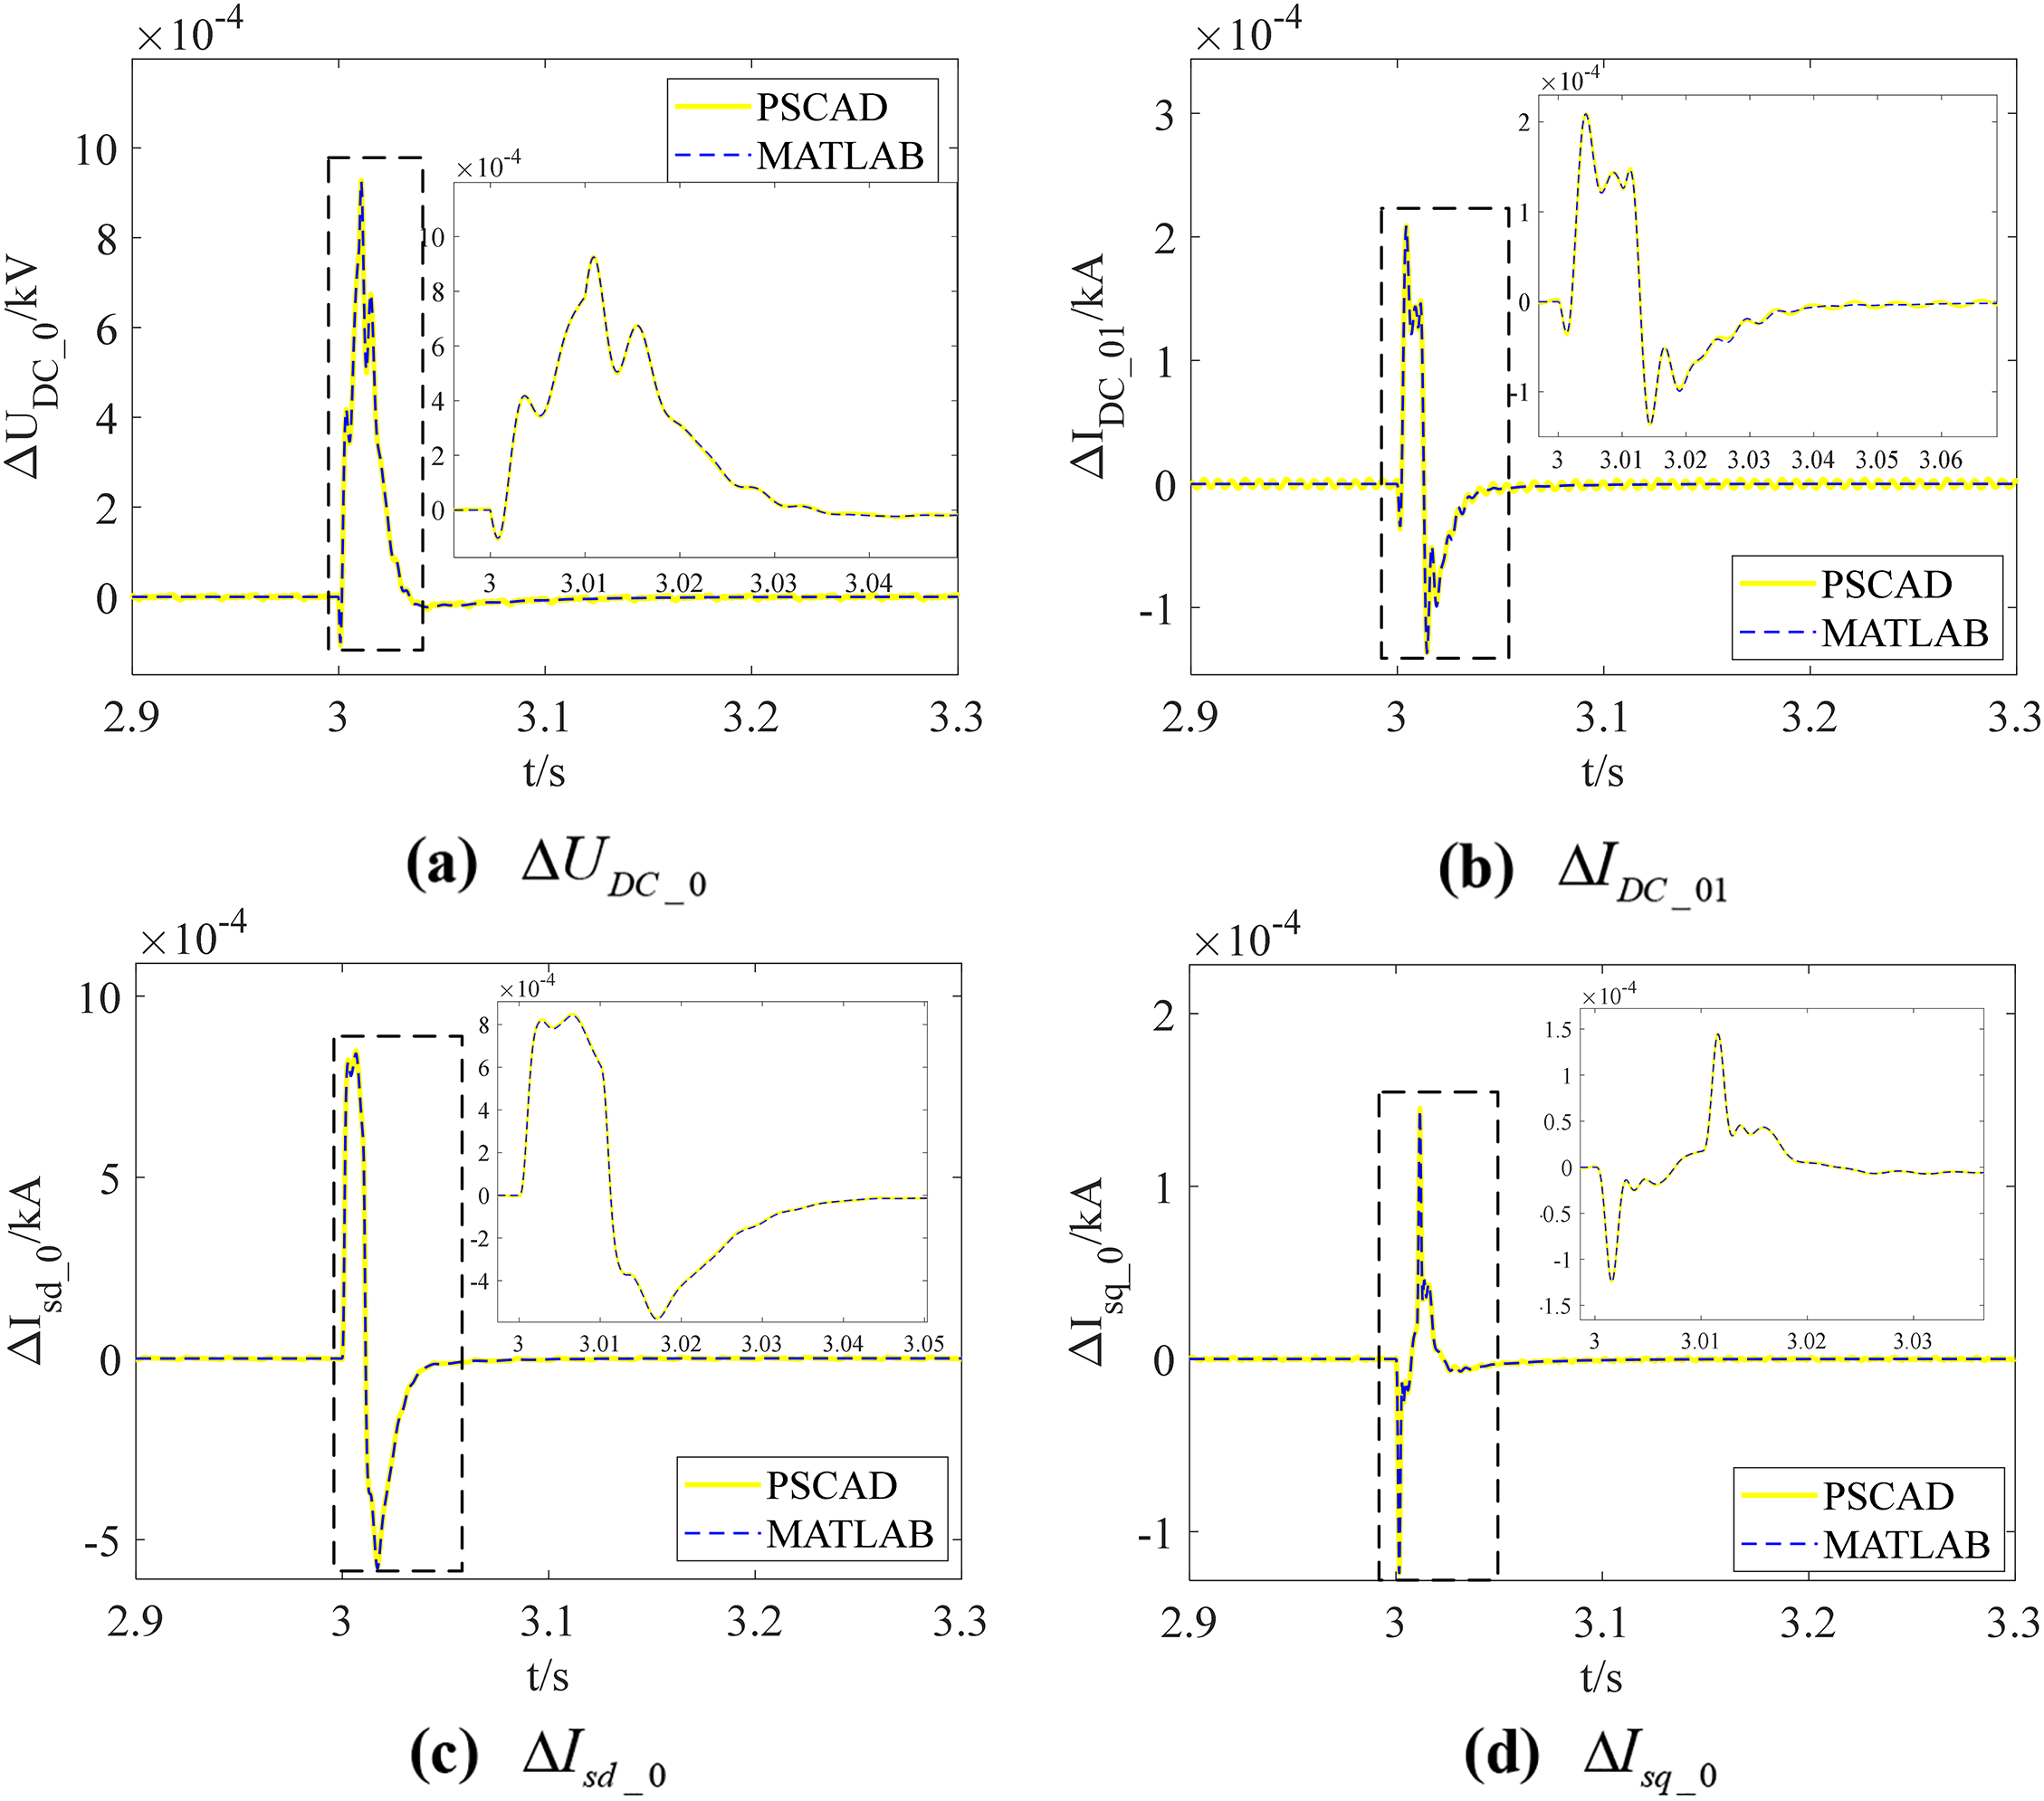
Figure 12: Response of different state variables to a small disturbance in MATLAB and PSCAD
5.2 Verification of Parameter-Optimizing Strategy
This section discusses two varieties of instability issues arising from plugging-in operations to assess the proposed parameter-optimization strategy’s effectiveness. The parameters listed in Table 1 have been deliberately altered to induce small-signal instability in the system.
In Case 1, the q-axis PI parameters of the current controller of Load 2 are changed to (5, 1800). Initially, S1 and S2 are closed, while S3 is open. At a certain moment, VSC3 sends an insertion request to the central controller, resulting in the closure of S3. After correcting the model parameters based on measurement equipment results, the system has a sensitive mode
According to Fig. 13, the state variables which have significant participation in
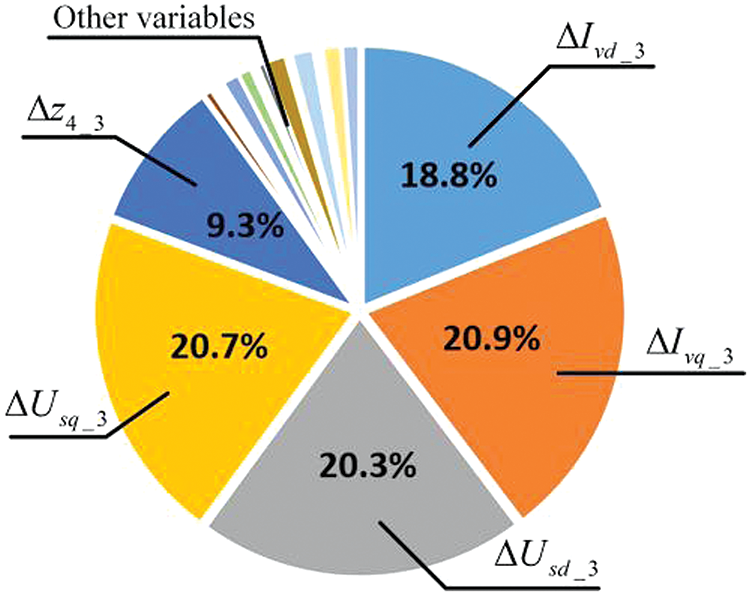
Figure 13: PF analysis in Case 1


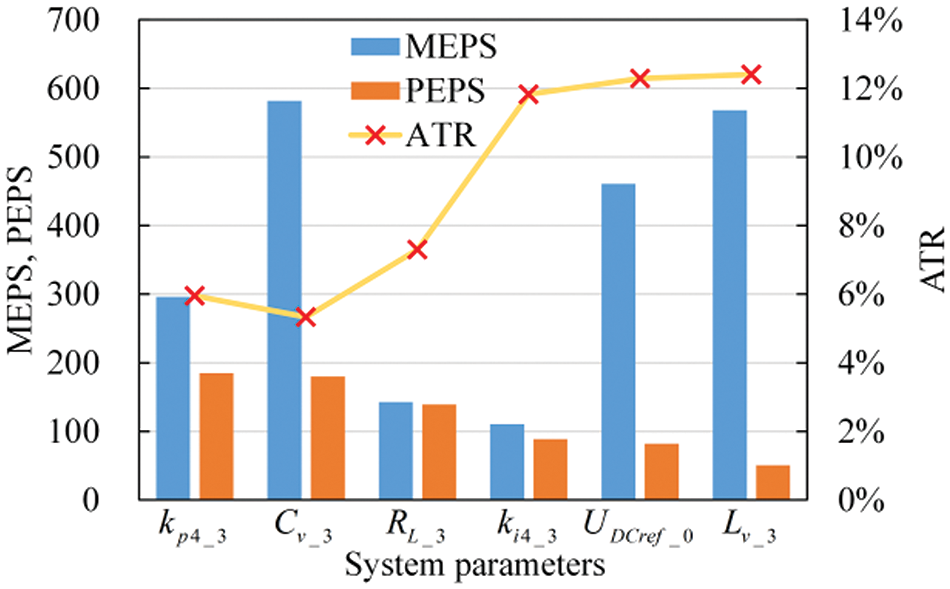
Figure 14: Comparison of PEPS, MEPS, and ATR
Fig. 15 illustrates the loci of
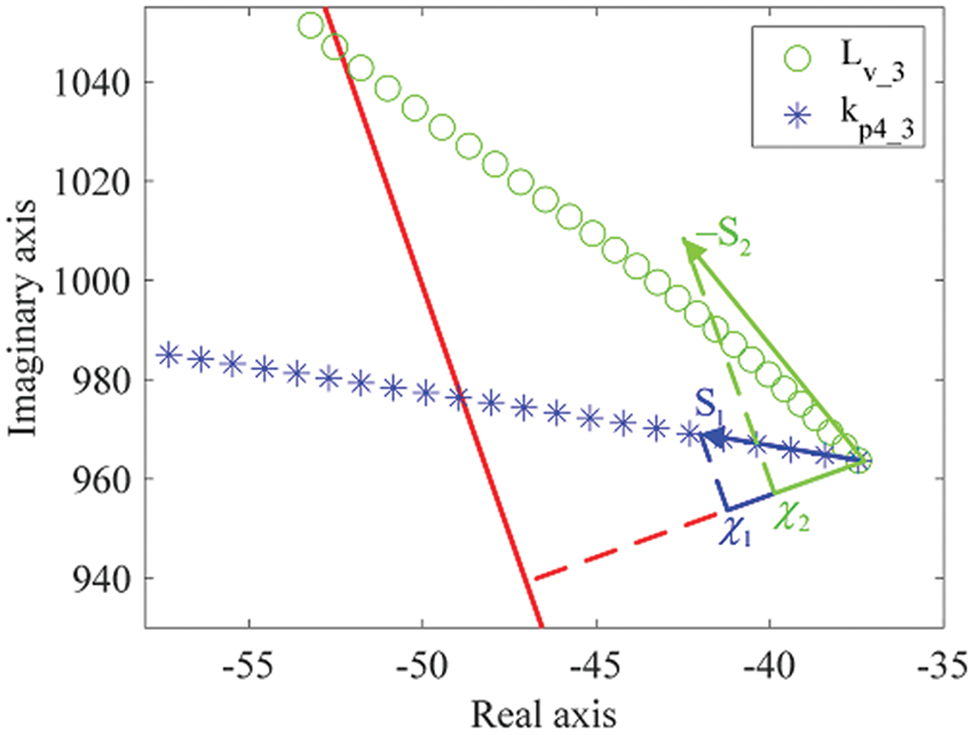
Figure 15: Comparison of root loci under different parameter changes
Table 3 indicates that the parameter with the largest PEPS is
Fig. 16 shows the eigenvalue loci of the coefficient matrix A as
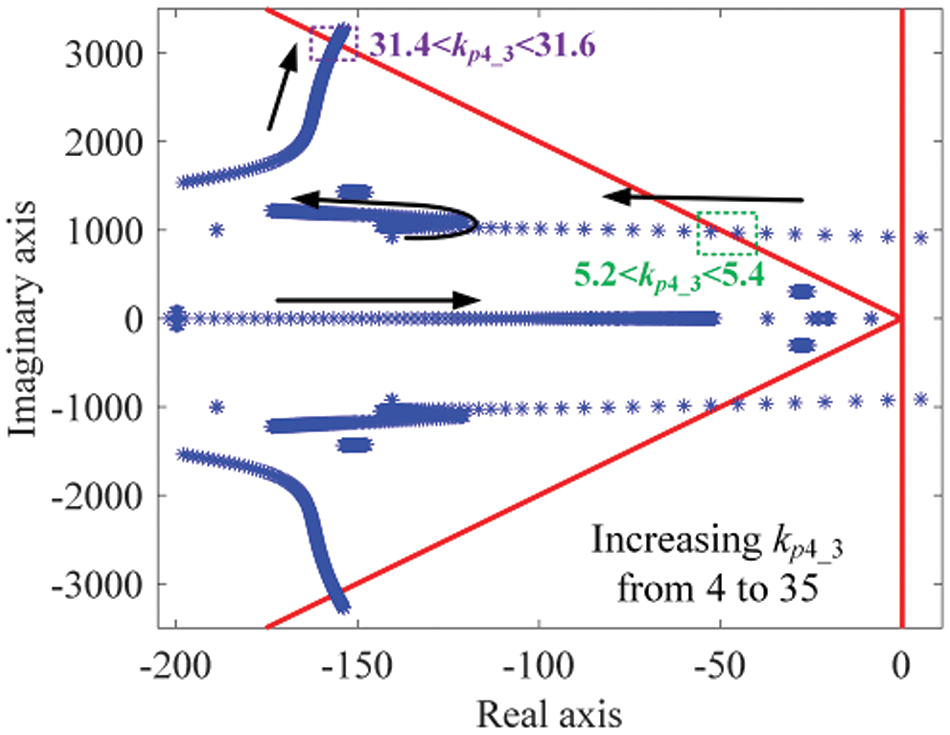
Figure 16: Root loci of A as


Finally, adjust kp4_3 = 8 and recheck system stability. The red asterisks and circles in Fig. 17 represent positions of sensitive mode before and after tuning, respectively. It is clear that all eigenvalues are within the security boundary after adjustment, proving the effectiveness of the parameter-optimizing strategy. To further validate the tuning results, the plug-in operation of VSC3 before and after adjustment is simulated in PSCAD, with the simulation curves shown in Fig. 18. The figure shows significant improvement in the system’s dynamic performance after tuning. Note that the oscillation frequency of the curves increases slightly, and the decay speed of the oscillations significantly accelerates, which is consistent with the eigenvalue changes shown in Fig. 17.
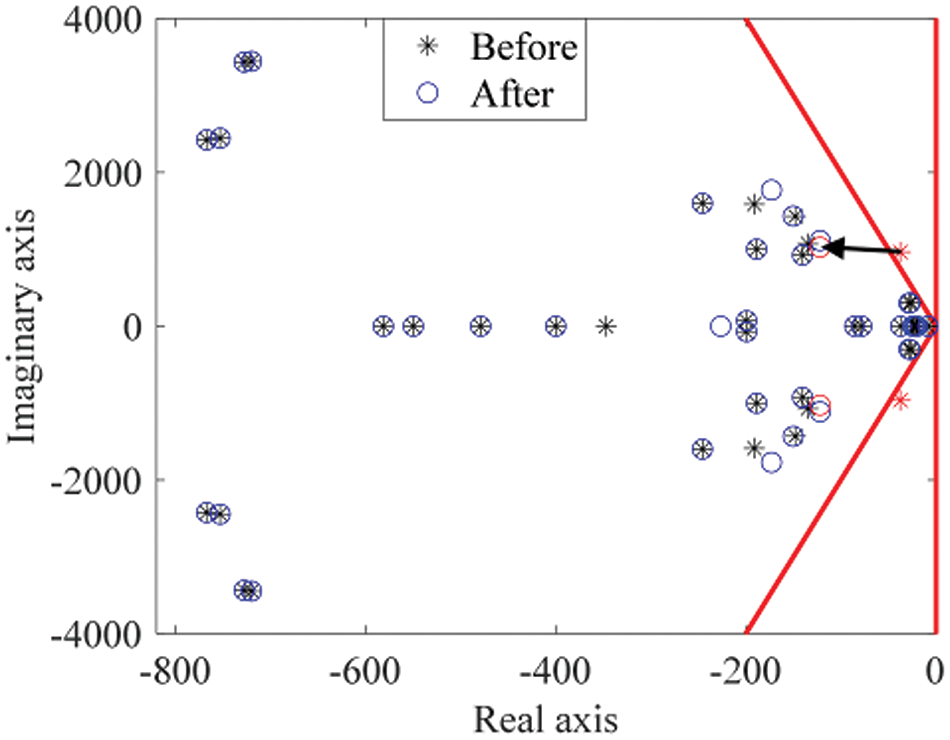
Figure 17: Comparison of eigenvalues before and after tuning
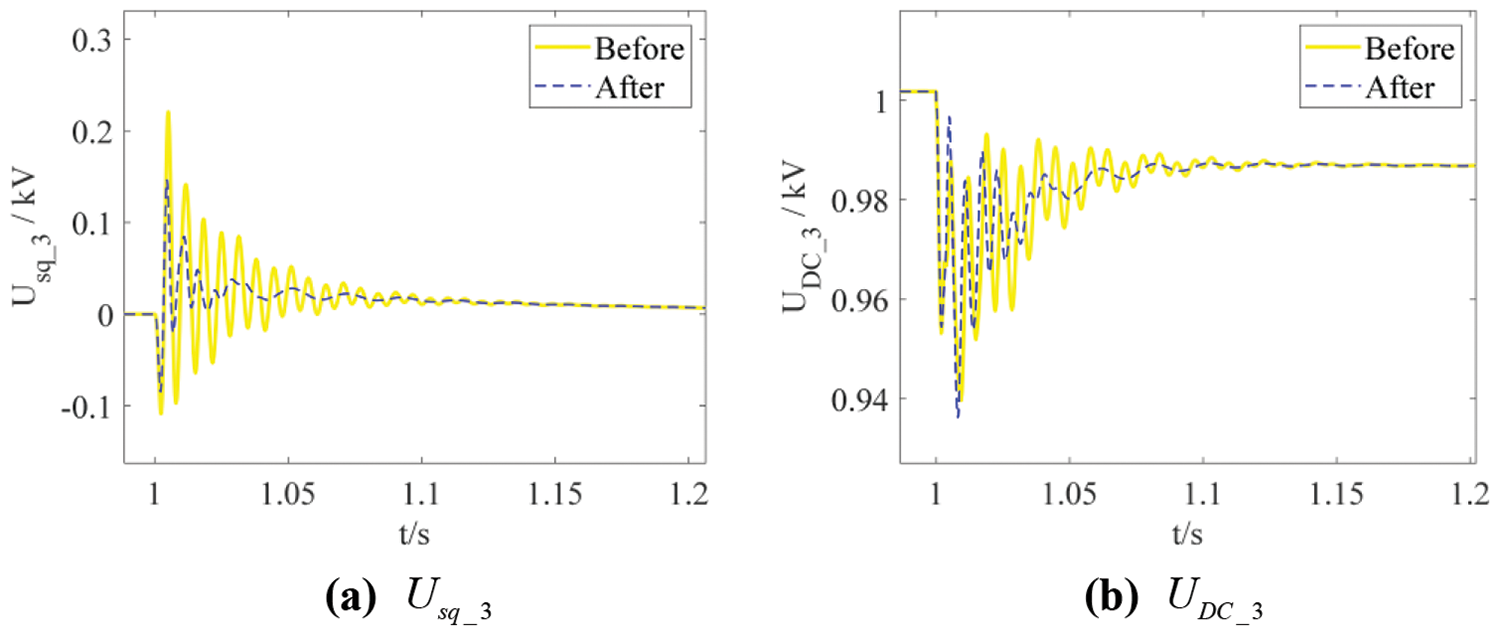
Figure 18: Curves of state variables in the simulations of the VSC3 plugging-in operations
In this case, the AC filter inductor of VSC1 is Lv_1 = 2.5 mH, and it is assumed that the line impedance and RLC parameters of the AC filters in this system are not adjustable.
Initially, S2 and S3 are closed while S1 is open. At a particular moment, VSC1 sends an insertion request to the central controller, causing S1 to close. Based on the measurement equipment’s results, the model parameters are corrected, i.e., equivalent active loads in VSC2 and VSC3 are changed to
Firstly, the dominant mode is determined through PF, which is identified as
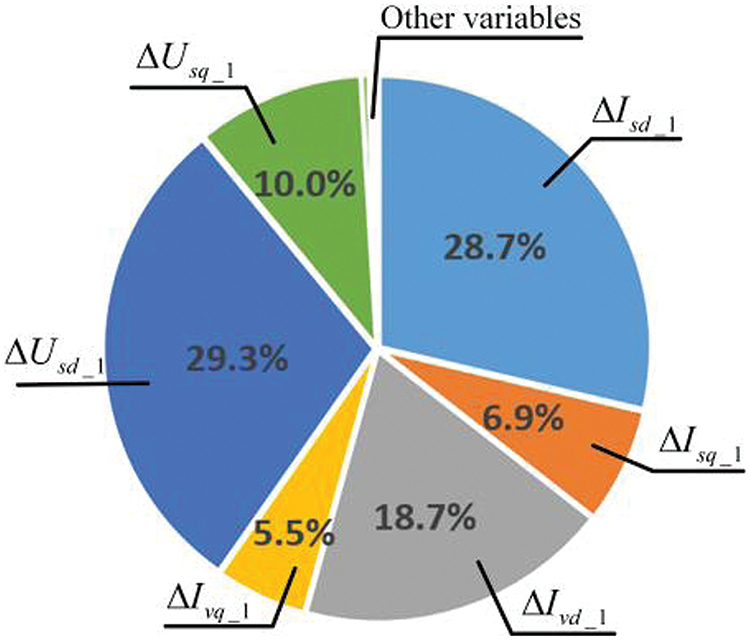
Figure 19: PF analysis in Case 2

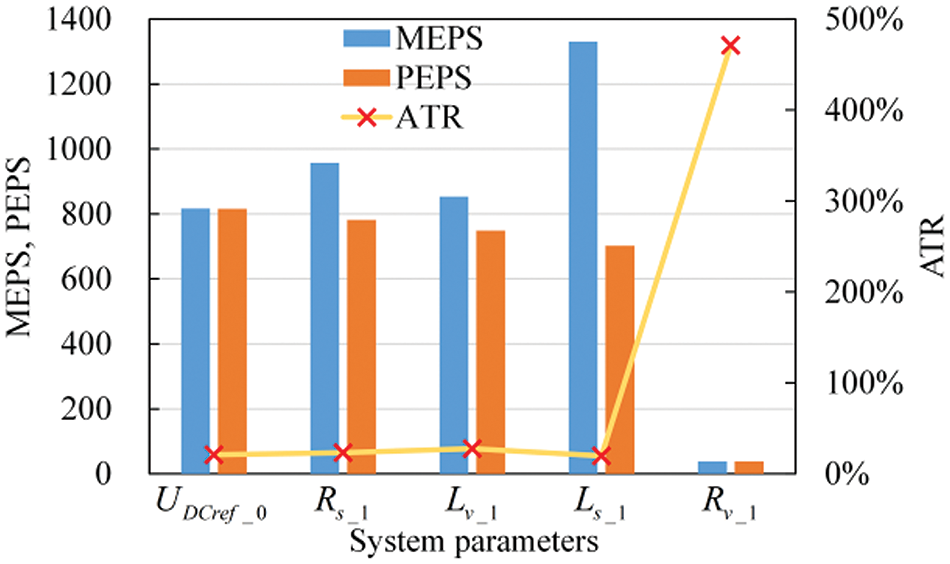
Figure 20: Comparison of PEPS, MEPS, and ATR
The feasible region is determined using the secant-based iterative method due to
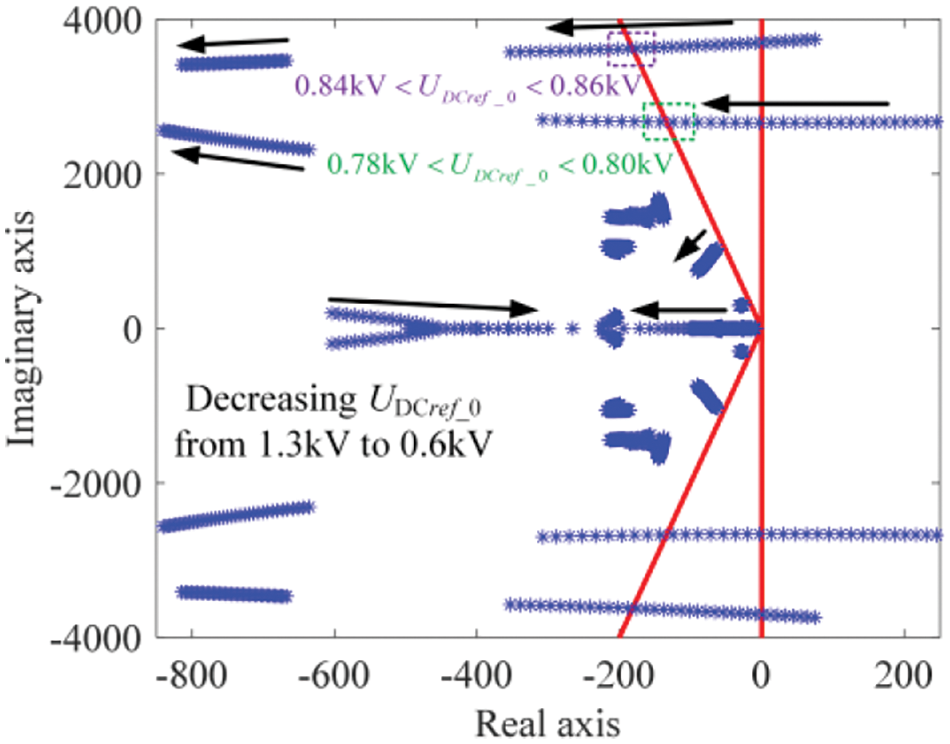
Figure 21: Root loci of A as UDCref_0 varies in Case 2

However, the adjustment of
Therefore, the local-parameter-tuning fails, necessitating the use of the multi-parameter-tuning strategy based on PSO proposed in Section 4 to meet the stability margin requirements. Since the dominant state variables do not include DC variables and are all introduced by VSC1, the PEPS of all control parameters, setpoints, and

With the parameters to be optimized identified, the PSO is used to tune these parameters based on the objective function expressed in Eq. (42). The optimization results are shown in Table 9. Fig. 22 illustrates the eigenvalues before and after adjustment, with red asterisks and circles indicating the positions of the unsecure modes before and after optimization, respectively. It is clear that all eigenvalues are within the secure region after adjustment, indicating that the system meets the stability margin requirements. The minimum damping ratio among all modes is 0.083, indicating good small-signal stability. Table 10 shows the overall time consumption of the parameter-optimizing strategy, revealing that although the multi-parameter-tuning stage is relatively time-consuming, it can still stabilize an otherwise unstable system rapidly. On the powerful central controller, this strategy would be even faster.

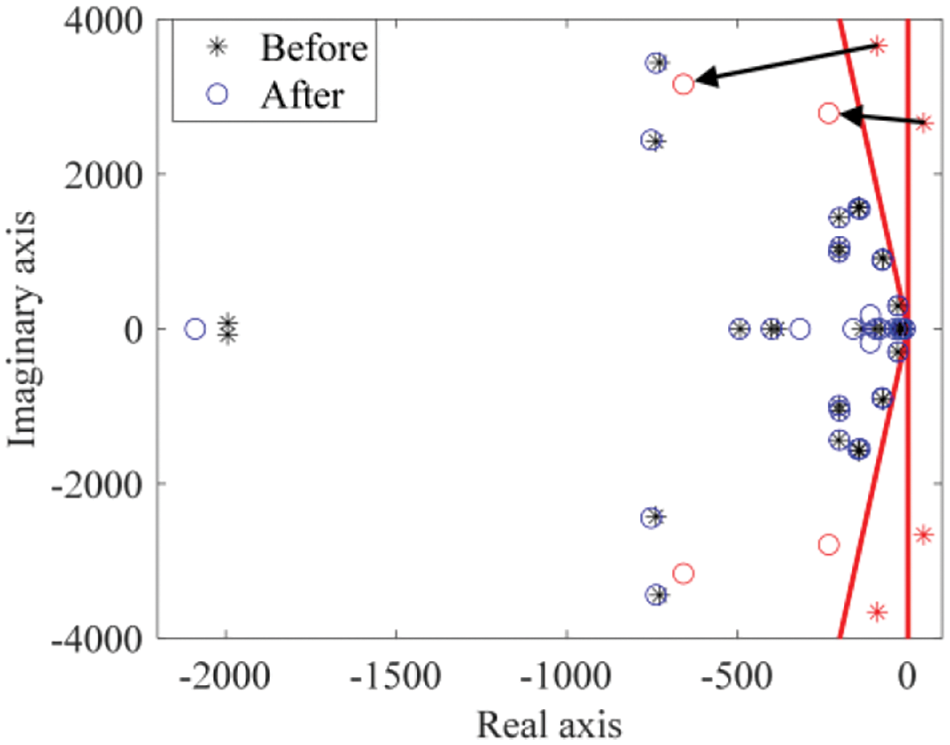
Figure 22: Comparison of eigenvalues

To further assess the performance of the multi-parameter-tuning strategy mentioned above, the process of DG insertion before and after parameter adjustment is simulated in PSCAD, with the simulation curves of different state variables shown in Fig. 23. It is noteworthy that the multi-parameter-tuning changes the operating parameters, altering the power flow of the system. To better observe the influence of parameter optimization, some state variable curves are shown as changes relative to their equilibrium points. It is clear that the previously unstable system can return stable after multi-parameter adjustment.
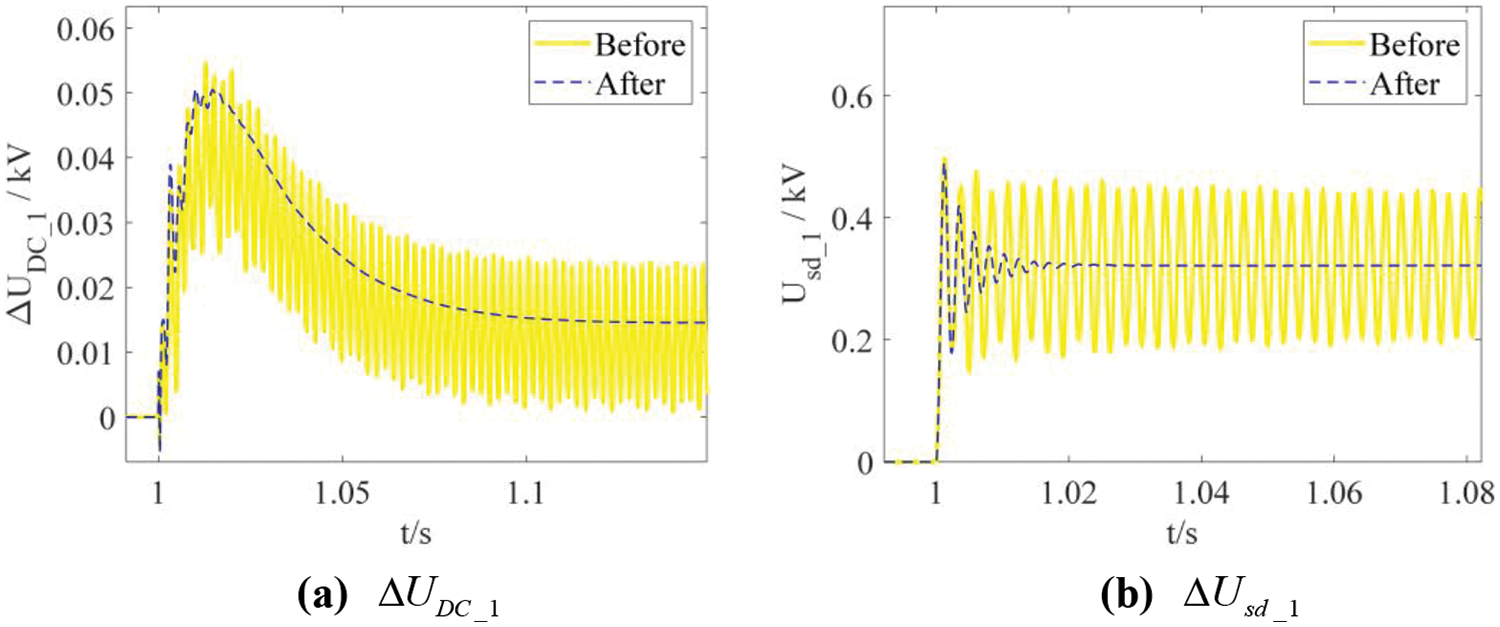
Figure 23: Curves of state variables in the simulations of the DG plugging-in operations
5.2.3 Effectiveness and Robustness of PSO for Multi-Parameter-Tuning
In order to demonstrate the effectiveness and assess the robustness of the PSO algorithm for multi-parameter-tuning, several runs were carried out with different initial populations. The iteration process is shown in Fig. 24. The objective values consistently converge to similar values across all runs, confirming the algorithm’s robustness and high computational accuracy.
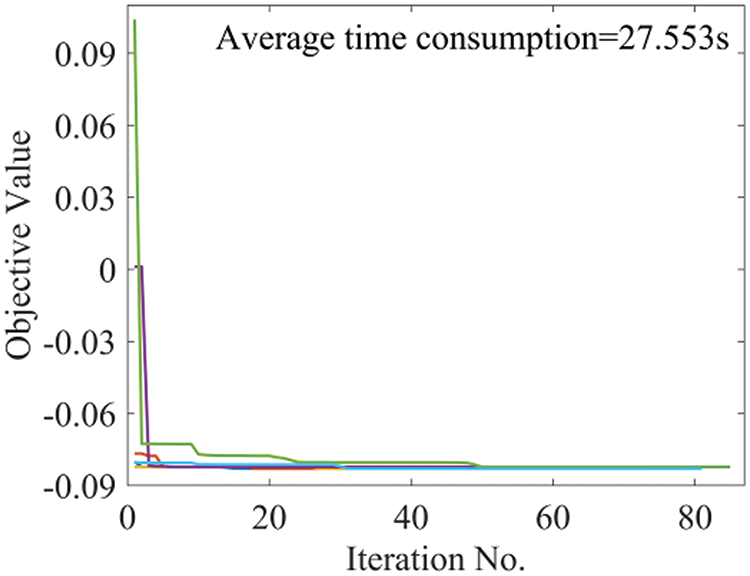
Figure 24: Convergence curve of PSO algorithm
The computation time of the PSO algorithm is significantly influenced by the initial population. Therefore, Fig. 24 presents the average time consumption across all runs to represent the algorithm’s computational time.
The digital DC distribution system, leveraging advanced digital technologies, offers significant advantages in terms of controllability and integration of DG and energy storage units. However, due to the presence of numerous power electronic devices, its stability issues become prominent during the PnP process. Therefore, based on digital technology, this paper proposes a four-stage parameter-optimizing strategy to rapidly enhance the system’s stability margin. The entire process of this approach is illustrated within a digital four-terminal DC distribution system, with the VSC’s PnP operation simulated in PSCAD to confirm both the efficacy and efficiency of the proposed method. The primary conclusions drawn from this study are:
• The results in Case 2 demonstrate that the multi-parameter-tuning strategy mentioned above can effectively improve system stability when local-parameter-tuning fails.
• The results in Tables 4 and 7 show that the method utilizing EPT for determining control parameter boundaries and the secant-based approach for assessing operating parameter limits are faster and more accurate than drawing root loci.
• The simulation results in Figs. 18 and 23 demonstrate the effectiveness of the proposed parameter-optimizing strategy, while the results in Tables 5 and 9 validate the rapidity of the strategy.
Acknowledgement: The authors acknowledge the reviewers for providing valuable comments and helpful suggestions to enhance the manuscript.
Funding Statement: This work was supported by State Grid Information and Telecommunication Group Scientific and Technological Innovation Project “Research on Power Digital Space Technology System and Key Technologies” (Program No. SGIT0000XMJS2310456).
Author Contributions: The authors confirm their contribution to the paper as follows: Study conception and design: Zhi Li, Yufei Zhao, Yueming Ji and Hanwen Gu. Data collection: Zhi Li, Yufei Zhao and Hanwen Gu. Analysis and interpretation of results: Yueming Ji and Zaibin Jiao. Draft manuscript preparation: Yufei Zhao, Hanwen Gu and Zaibin Jiao. All authors reviewed the results and approved the final version of the manuscript.
Availability of Data and Materials: Data supporting this study are included within the article.
Ethics Approval: Not applicable.
Conflicts of Interest: The authors declare that they have no conflicts of interest to report regarding the present study.
References
1. A. M. I. Mohamad and Y. A. R. I. Mohamed, “Investigation and enhancement of stability in grid-connected active DC distribution systems with high penetration level of dynamic loads,” IEEE Trans. Power Electron., vol. 34, no. 9, pp. 9170–9190, Sep. 2019. doi: 10.1109/TPEL.2018.2883091. [Google Scholar] [CrossRef]
2. S. Huang and Y. Li, “Digitalized power grid technology and power communication platform,” (in ChineseTelecommun. Electr. Power Syst., vol. 29, no. 6, pp. 15–20, Jun. 2008. doi: 10.3969/j.issn.1005-7641.2008.06.006. [Google Scholar] [CrossRef]
3. P. Li et al., “Architecture and key technologies of digital power grids,” (in ChineseProc. CSEE, vol. 42, no. 14, pp. 5002–5017, Jul. 2022. doi: 10.13334/j.0258-8013.pcsee.212086. [Google Scholar] [CrossRef]
4. J. Wang, X. Wu, H. Lin, J. Liang, and Y. Song, “Concepts, features and architectures of digital grids,” (in ChineseSouthern Power Syst. Technol., vol. 17, no. 12, pp. 36–41+89, Dec. 2023. doi: 10.13648/j.cnki.issn1674-0629.2023.12.005. [Google Scholar] [CrossRef]
5. L. Zhou, Q. Liu, Y. Chen, Q. Ning, Z. Xiao and S. Wang, “Digital-power-communication concept for energy coordination in PV-battery-charging DC microgrid,” IEEE Trans. Smart Grid, vol. 14, no. 6, pp. 4219–4229, Nov. 2023. doi: 10.1109/TSG.2023.3262583. [Google Scholar] [CrossRef]
6. A. A. Khan, M. H. Rehmani, and M. Reisslein, “Cognitive radio for smart grids: Survey of architectures, spectrum sensing mechanisms, and networking protocols,” IEEE Commun. Surv. Tutor., vol. 18, no. 1, pp. 860–898, Firstquarter 2016. doi: 10.1109/COMST.2015.2481722. [Google Scholar] [CrossRef]
7. S. S.R., T. Dragičević, P. Siano, and S. R. S. Prabaharan, “Future generation 5G wireless networks for smart grid: A comprehensive review,” Energies, vol. 12, no. 11, Jun. 2019, Art. no. 2140. doi: 10.3390/en12112140. [Google Scholar] [CrossRef]
8. S. Bera, S. Misra, and J. J. P. C. Rodrigues, “Cloud computing applications for smart grid: A survey,” IEEE Trans. Parallel Distrib. Syst., vol. 26, no. 5, pp. 1477–1494, May 2015. doi: 10.1109/TPDS.2014.2321378. [Google Scholar] [CrossRef]
9. M. Farrokhabadi et al., “Microgrid stability definitions, analysis, and examples,” IEEE Trans. Power Syst., vol. 35, no. 1, pp. 13–29, Jan. 2020. doi: 10.1109/TPWRS.2019.2925703. [Google Scholar] [CrossRef]
10. H. Gu, Z. Jiao, and R. Li, “Comprehensive small-signal modeling and stability analysis of medium-voltage AC/DC distribution networks based on the master-slave control strategy,” in 2020 IEEE Sustain. Power Energy Conf. (iSPEC), 2020, pp. 732–737. [Google Scholar]
11. C. Li and Z. Du, “A novel method for computing small-signal stability boundaries of large-scale power systems,” IEEE Trans. Power Syst., vol. 28, no. 2, pp. 877–883, May 2013. doi: 10.1109/TPWRS.2012.2210741. [Google Scholar] [CrossRef]
12. A. Ozcan and H. Schattler, “A computational method for the calculation of the feasibility boundary and clustering in differential-algebraic systems,” IEEE Trans. Circuits Syst. I: Reg. Papers, vol. 52, no. 9, pp. 1940–1952, Sep. 2005. doi: 10.1109/TCSI.2005.851671. [Google Scholar] [CrossRef]
13. C. Li, H. -D. Chiang, and Z. Du, “Investigation of an effective strategy for computing small-signal security margins,” IEEE Trans. Power Syst., vol. 33, no. 5, pp. 5437–5445, Sep. 2018. doi: 10.1109/TPWRS.2018.2810229. [Google Scholar] [CrossRef]
14. A. Zheng, C. Guo, Z. Yin, and C. Zhao, “Optimal adjustment method of control parameters for improving small-signal stability of hybrid multi-terminal HVDC system under weak AC condition,” (in ChineseTrans. China Electr. Soc., vol. 35, no. 6, pp. 1336–1345, Mar. 2020. doi: 10.19595/j.cnki.1000-6753.tces.190160. [Google Scholar] [CrossRef]
15. X. Wu, C. Shen, and R. Iravani, “Feasible range and optimal value of the virtual impedance for droop-based control of microgrids,” IEEE Trans. Smart Grid, vol. 8, no. 3, pp. 1242–1251, May 2017. doi: 10.1109/TSG.2016.2519454. [Google Scholar] [CrossRef]
16. M. A. Hassan and M. A. Abido, “Optimal design of microgrids in autonomous and grid-connected modes using particle swarm optimization,” IEEE Trans. Power Electron., vol. 26, no. 3, pp. 755–769, Mar. 2011. doi: 10.1109/TPEL.2010.2100101. [Google Scholar] [CrossRef]
17. J. He, X. Wu, X. Wu, Y. Xu, and J. M. Guerrero, “Small-signal stability analysis and optimal parameters design of microgrid clusters,” IEEE Access, vol. 7, pp. 36896–36909, Apr. 2019. doi: 10.1109/ACCESS.2019.2900728. [Google Scholar] [CrossRef]
18. B. Pournazarian, R. Sangrody, M. Lehtonen, G. B. Gharehpetian, and E. Pouresmaeil, “Simultaneous optimization of virtual synchronous generators parameters and virtual impedances in Islanded microgrids,” IEEE Trans. Smart Grid, vol. 13, no. 6, pp. 4202–4217, Nov. 2022. doi: 10.1109/TSG.2022.3186165. [Google Scholar] [CrossRef]
19. M. A. Ebrahim, M. N. Ahmed, H. S. Ramadan, M. Becherif, and J. Zhao, “Optimal metaheuristic-based sliding mode control of VSC-HVDC transmission systems,” Math. Comput. Simul., vol. 179, pp. 178–193, Jan. 2021. doi: 10.1016/j.matcom.2020.08.009. [Google Scholar] [CrossRef]
20. A. Ahmad et al., “Controller parameters optimization for multi-terminal DC power system using ant colony optimization,” IEEE Access, vol. 9, pp. 59910–59919, Apr. 2021. doi: 10.1109/ACCESS.2021.3073491. [Google Scholar] [CrossRef]
21. H. Gu, Y. Hu, Z. Jiao, Y. Zhao, and Y. Xiang, “Rapid individual parameter optimization of plug-and-play modules in DC active distribution networks considering virtual impedance,” IEEE Trans. Smart Grid, vol. 15, no. 5, pp. 4522–4536, Sep. 2024. doi: 10.1109/TSG.2024.3398146. [Google Scholar] [CrossRef]
22. H. Gu, Z. Jiao, and Y. Xiang, “A rapid parameter-tuning strategy of plug-and-play DC distribution systems based on fast parameter boundary calculation,” IEEE Trans. Smart Grid, vol. 15, no. 3, pp. 2586–2600, May 2024. doi: 10.1109/TSG.2023.3321091. [Google Scholar] [CrossRef]
23. P. Sun, G. Li, G. Town, and G. Konstantinou, “Identifying opportunities for medium voltage DC systems in Australia,” in IEEE PES 14th Asia-Pacific Power Energy Eng. Conf. (APPEEC), Nov. 2022, pp. 1–6. doi: 10.1109/APPEEC53445.2022.10072035. [Google Scholar] [CrossRef]
24. K. Peng, Z. Wei, J. Chen, and H. Li, “Hierarchical virtual inertia control of DC distribution system for plug-and-play electric vehicle integration,” Int. J. Electr. Power Energy Syst., vol. 128, Jun. 2021, Art. no. 106769. doi: 10.1016/j.ijepes.2021.106769. [Google Scholar] [CrossRef]
25. D. E. Olivares et al., “Trends in microgrid control,” IEEE Trans. Smart Grid, vol. 5, no. 4, pp. 1905–1919, Jul. 2014. doi: 10.1109/TSG.2013.2295514. [Google Scholar] [CrossRef]
26. J. Liu, W. Zhang, and G. Rizzoni, “Robust stability analysis of DC microgrids with constant power loads,” IEEE Trans. Power Syst., vol. 33, no. 1, pp. 851–860, Jan. 2018. doi: 10.1109/TPWRS.2017.2697765. [Google Scholar] [CrossRef]
27. J. M. Guerrero, J. Matas, L. G. de Vicuna, N. Berbel, and J. Sosa, “Wireless-control strategy for parallel operation of distributed generation inverters,” in Proc. IEEE Int. Symp. Indus. Electron., Dubrovnik, Croatia, Jun. 2005, vol. 2, pp. 845–850. doi: 10.1109/ISIE.2005.1529025. [Google Scholar] [CrossRef]
28. P. Simiyu, A. Xin, G. T. Bitew, M. Shahzad, W. Kunyu, and L. K. Tuan, “Review of the DC voltage coordinated control strategies for multi-terminal VSC-MVDC distribution network,” J. Eng., vol. 2019, no. 16, pp. 1462–1468, Dec. 2019. doi: 10.1049/joe.2018.8841. [Google Scholar] [CrossRef]
29. Q. Jia, G. Yan, Y. Cai, Y. Li, and J. Zhang, “Small-signal stability analysis of photovoltaic generation connected to weak AC grid,” J. Mod. Power Syst. Clean Energy, vol. 7, no. 2, pp. 254–267, Mar. 2019. doi: 10.1007/s40565-018-0415-3. [Google Scholar] [CrossRef]
30. J. Rocabert, A. Luna, F. Blaabjerg, and P. Rodríguez, “Control of power converters in AC microgrids,” IEEE Trans. Power Electron., vol. 27, no. 11, pp. 4734–4749, Nov. 2012. doi: 10.1109/TPEL.2012.2199334. [Google Scholar] [CrossRef]
31. M. Yang, X. Pei, M. Zhang, Y. Zhang, and H. Wang, “An improved master-slave control strategy for automatic DC voltage control under the master station failure in MTDC system,” IEEE J. Emerg. Sel. Top. Power Electron., vol. 11, no. 2, pp. 1530–1541, Apr. 2023. doi: 10.1109/JESTPE.2022.3216863. [Google Scholar] [CrossRef]
32. X. Tang and D. D. -C. Lu, “Enhancement of voltage quality in a passive network supplied by a VSC-HVDC transmission under disturbances,” Int. J. Electr. Power Energy Syst., vol. 54, no. 1, pp. 45–54, Jan. 2014. doi: 10.1016/j.ijepes.2013.06.030. [Google Scholar] [CrossRef]
33. H. Chen, “Research on the control strategy of VSC based HVDC system supplying passive network,” in 2009 IEEE Power Energy Soc. General Meet., Jul. 2009, pp. 1–4. doi: 10.1109/PES.2009.5275968. [Google Scholar] [CrossRef]
34. A. Abdolahi, N. Taghizadegan, M. R. Banaei, and J. Salehi, “A reliability-based optimal μ-PMU placement scheme for efficient observability enhancement of smart distribution grids under various contingencies,” IET Sci., Measur. Technol., vol. 15, no. 8, pp. 663–680, Oct. 2021. doi: 10.1049/smt2.12067. [Google Scholar] [CrossRef]
35. Y. Seyedi, H. Karimi, C. Wetté, and B. Sansò, “A new approach to reliability assessment and improvement of synchrophasor communications in smart grids,” IEEE Trans. Smart Grid, vol. 11, no. 5, pp. 4415–4426, Sep. 2020. doi: 10.1109/TSG.2020.2993944. [Google Scholar] [CrossRef]
Cite This Article
 Copyright © 2024 The Author(s). Published by Tech Science Press.
This work is licensed under a Creative Commons Attribution 4.0 International License , which permits unrestricted use, distribution, and reproduction in any medium, provided the original work is properly cited.


 Submit a Paper
 Propose a Special lssue
 View Full Text
 Download PDF
 Downloads
 Citation Tools