 Open Access
ARTICLE
Maximum Power Point Tracking Based on Improved Kepler Optimization Algorithm and Optimized Perturb & Observe under Partial Shading Conditions
1 School of Electrical and Information Engineering, Jiangsu University of Technology, Changzhou, 213001, China
2 Jiangsu Key Laboratory of Power Transmission & Distribution Equipment Technology, Jiangsu University of Technology, Changzhou, 213001, China
* Corresponding Author: Fuyin Ni. Email:
(This article belongs to the Special Issue: Carbon Reduction and Optimized Recovery Strategies for Unconventional Resource)
Energy Engineering 2024, 121(12), 3779-3799. https://doi.org/10.32604/ee.2024.055535
Received 30 June 2024; Accepted 02 August 2024; Issue published 22 November 2024
Abstract
Under the partial shading conditions (PSC) of Photovoltaic (PV) modules in a PV hybrid system, the power output curve exhibits multiple peaks. This often causes traditional maximum power point tracking (MPPT) methods to fall into local optima and fail to find the global optimum. To address this issue, a composite MPPT algorithm is proposed. It combines the improved kepler optimization algorithm (IKOA) with the optimized variable-step perturb and observe (OIP&O). The update probabilities, planetary velocity and position step coefficients of IKOA are nonlinearly and adaptively optimized. This adaptation meets the varying needs of the initial and later stages of the iterative process and accelerates convergence. During stochastic exploration, the refined position update formulas enhance diversity and global search capability. The improvements in the algorithm reduces the likelihood of falling into local optima. In the later stages, the OIP&O algorithm decreases oscillation and increases accuracy. compared with cuckoo search (CS) and gray wolf optimization (GWO), simulation tests of the PV hybrid inverter demonstrate that the proposed IKOA-OIP&O algorithm achieves faster convergence and greater stability under static, local and dynamic shading conditions. These results can confirm the feasibility and effectiveness of the proposed PV MPPT algorithm for PV hybrid systems.Keywords
Nomenclature
| PV system output current (A) | |
| PV system output current (V) | |
| PV system output power (W) | |
| IKOA planets or solar positions | |
| IKOA planetary velocity | |
| IKOA planets and sun gravity |
With advancements in technology, the efficiency and reliability of photovoltaic (PV) inverters have markedly improved [1]. Features such as maximum power point tracking (MPPT) [2] and remote monitoring have significantly enhanced the widespread adoption of PV power systems. However, traditional PV inverters are limited to converting DC power from solar energy to AC power and cannot store excess energy, which leads to unstable power supply during low-light conditions [3].
With the development of energy storage technology [4] and the reduction of battery costs, energy storage and bi-directional charging and discharging functions [5] can be integrated in PV inverters. In the article, these devices are referred to as PV hybrid inverters. PV hybrid inverters overcome the limitations of traditional PV inverters [6] by storing surplus power for later use, thereby improving system stability, reliability and overall energy efficiency. PV hybrid inverters offer consistent power supply and enhance grid quality, which support the expansion of renewable energy and the development of smart grids [7]. However, the issue of power output variability due to PV panel shading remains a challenge, which impacts the efficiency and performance of PV hybrid inverters [8].
Changes in ambient temperature and light can easily affect PV cell power output. Partial shading conditions (PSC) [9], which are caused by tree shading, cloud shading and ash accumulation [10], make light distribution uneven [11]. MPPT technology aims to keep the PV array operating at the maximum power point (MPP), adapting to changes in temperature and light intensity to quickly find the optimal point. MPPT technology greatly reduces power loss. Traditional methods like the constant voltage method, short-circuit current method, perturbation observation method [12] and conductance increment method [13] work well under consistent light conditions, but struggle with local shading, leading to local optima due to multiple peaks in the output curve [9,14].
To address this, intelligent algorithms such as the particle swarm algorithm (PSO) [14], grey wolf optimization (GWO) algorithm [15], horse herd optimization algorithm (HOA) [16], cuckoo search (CS) algorithm [10], flower pollination algorithm [17] and kepler optimization algorithm (KOA) [18] have been proposed. Literature [14] proposed that a dual optimization particle swarm algorithm optimizes the voltage interval for the MPP and enhances convergence with optimized coefficients and a search degree factor. Literature [15] proposed that an improved gray wolf optimization algorithm with variable-step perturbation observation improves search efficiency and global randomness to avoid local optima. Literature [16] proposed that the horse herd optimization algorithm achieves fast convergence with minimal computation. Literature [10] proposed an adaptive differential evolution of the improved cuckoo search algorithm combined with the conductance incremental method balances search efficiency and randomness. Literature [18] proposed that the KOA uses planetary motion principles for position and velocity updates. These approaches optimize local shading problems, but still struggle to balance output stability with speed and accuracy under various environmental conditions.
This paper proposes a composite algorithm that combined the improved kepler optimization algorithm (IKOA) and the optimized variable-step perturbation observation method (OIP&O). IKOA is used for global optimization in early iterations, adjusting switching probabilities and orbital motion step coefficients adaptively. Early iterations use a smaller switching probability and a larger step coefficient to promote global search, while later iterations use a larger switching probability and a smaller step coefficient to enhance accuracy and convergence speed. The velocity and position update formulas are optimized to increase diversity and improve the ability to escape local optima, which enhance global search randomness. In later stages, the algorithm switches to OIP&O for local optimization, which reduces output oscillation and improves stability and accuracy. Simulation and experimental results confirm the correctness and effectiveness of this PV MPPT algorithm for the PV hybrid inverter.
This paper is structured as follows, Section 2 describes the PV hybrid inverter system modeling and presents its main combinatorial elements to introduce the PV array that is the object of study. Section 3 describes the basics of PV modeling and analyzes the effect of PSC on the power output of the PV array. The IKOA-OIP&O algorithm and the corresponding MPPT process are presented in Section 4. Experimental results by the proposed algorithm and comparison between different algorithms are given in Section 5. The paper is summarized in Section 6.
2 PV Hybrid Inverter System Design
PV hybrid inverter is a smart energy solution that utilizes solar power to generate electricity and realizes power storage and power supply management [19], through bi-directional inverter and energy storage system, as shown in Fig. 1. PV hybrid inverter mainly consists of PV battery system, energy storage battery system, bi-directional inverter and so on.

Figure 1: PV hybrid inverter system
The PV cell system in a PV hybrid inverter is a technological device that converts solar energy into electrical energy and consists mainly of PV panels, boosting circuits and a MPPT controller [11]. It converts solar energy directly into usable DC energy through the PV effect, which is then passed through an inverter for domestic and commercial use [5,6]. PV cell systems can reduce carbon emissions, realize sustainable use of energy, and bring economic benefits through reduced electricity bills and revenue from electricity sales, providing users with a stable and reliable power supply [1,20].
The storage battery system in a PV hybrid inverter is a device for storing and managing the electrical energy generated by PV panels [7]. It includes a battery module, a battery management system (BMS) and bi-directional charging and discharging circuits [5]. Its main function is to store excess electrical energy during the day for use at night or on cloudy days to ensure the continuity and stability of power supply. The system effectively improves the overall efficiency of the PV hybrid inverter, reduces dependence on the grid, optimizes energy utilization and provides a backup power function, thus enhancing the reliability and economy of the energy system.
The bi-directional inverter circuit in a PV hybrid inverter is a power electronic device capable of realizing bi-directional conversion between DC and AC power [7]. It includes a bidirectional DC/AC converter [21], an inverter module and a control system [22]. As the demand for energy storage and management continues to rise, bidirectional converters are poised to become a critical technology for optimizing electrical energy utilization and enhancing system flexibility and efficiency [23]. These converters not only facilitate efficient bidirectional conversion of PV power but also provide precise control between energy storage and release, addressing power demand fluctuations and improving system reliability [7].
PV panels, which are crucial components of PV hybrid inverters, have primarily been categorized into single-sided and bifacial panels [20] to improve PV conversion efficiency [24]. Bifacial panels can simultaneously receive light from both the front and back sides, resulting in higher current and power output under identical illumination conditions compared to single-sided panels [25]. However, the output characteristic curves (I-V and P-V curves) of both types are very similar in shape, with the curves of bifacial panels being steeper and more efficient. Due to this similarity, it is feasible to approximate the output curves of bifacial panel arrays under shading conditions using those of single-sided panel arrays. Therefore, the focus of this study will primarily be on single-sided PV panels. PV panels have P-U and I-U output curves that are greatly affected by light intensity and operating ambient temperature. the equivalent model of PV cells is shown in Fig. 2.

Figure 2: Equivalent model diagram of PV modules
The expression for the output current is shown below [20]:
where
where
where
The PV array is made of
In the simulation to build a PV cell model, set up five PV panels connected in parallel as a group, a total of five groups connected in series in turn, components arranged PV arrays, and change the lighting conditions, the temperature is constant 25°C. The key parameters of a single PV cell (TSM-200DA01.08) as shown in Table 1.

PV systems are usually operated in natural environments, so the power output is generally nonlinear. When the illumination is uneven due to natural factors, especially the PV cells are greatly affected by temperature and illumination in the environment, the P-U output curve will show a phenomenon of multiple peaks. If the peaks do not differ much, it will increase the probability of falling into the local optimum solution and also trigger the hot spot effect. In order to avoid the hot spot effect, a bypass diode is usually connected in parallel next to the PV array, and the presence of the bypass diode will also make the P-V output characteristics of the PV array characterized by multiple peaks.
4 Implementation of IKOA-OIP&O Based Multi-Peak MPPT Algorithm
4.1 Improved Kepler Optimization Algorithm
Inspired by Kepler’s laws of planetary motion, the KOA is a novel meta-heuristic optimization algorithm [18]. KOA simulates the interaction between the sun and the planets, provides an intuitive optimization method using the natural laws of celestial motion. It has good global search capability for the PV maximum power tracking problem in PV hybrid inverters, and avoids the probability of falling into a local optimum through the introduction of stochastic perturbations that can be mentioned [26,27].
However, the traditional KOA is computationally large due to the complexity of simulating planetary motions, leading to slow convergence, as well as the complex optimization problem, although random perturbations are introduced, it is still easy to fall into the local optimal solution, which is difficult to jump out of [27]. At the same time, in order to target the specific scenario of the PV maximal power tracking, it is necessary to modify and adjust the parameters of the KOA algorithm (e.g., the number of planets, the initial speed, the strength of the perturbations, etc.).
In order to effectively balance the relationship between the search accuracy and convergence speed of the KOA algorithm, the convergence speed and stability of the algorithm are improved while maintaining the global search capability of the algorithm. The IKOA algorithm is described below:
4.1.1 IKOA Parameter Initialization Settings
As shown in Fig. 3, the IKOA algorithm has to initialize the positions of the individual planets in the search space, i.e., the target duty cycle, whose position equations are shown in Eq. (5):
where
where
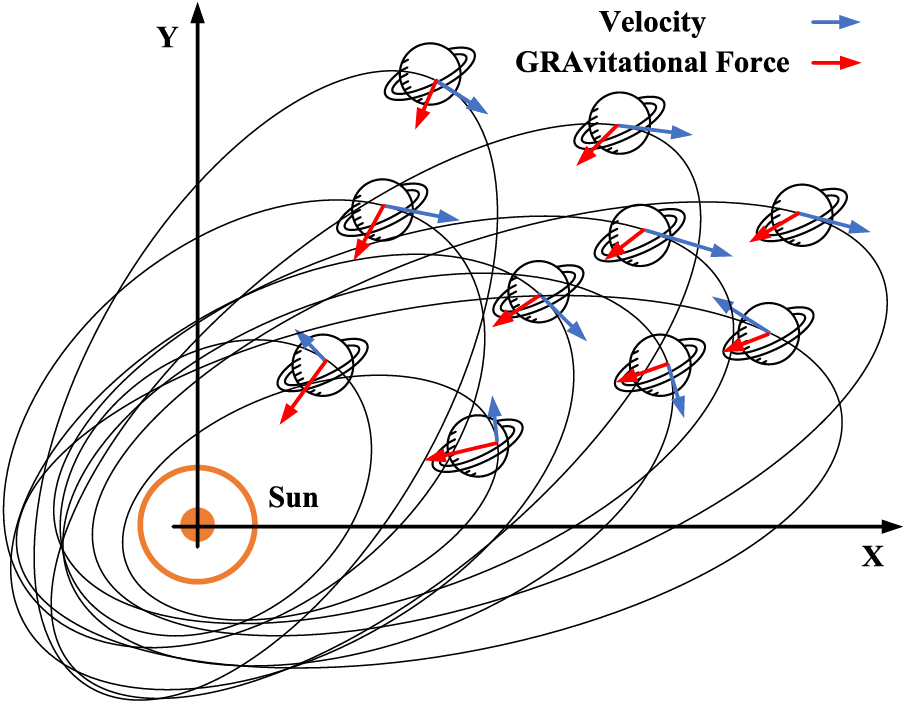
Figure 3: Schematic diagram of the position of the planets in relation to the sun
4.1.2 Calculation of IKOA Gravitational Force
The gravitational force
where
4.1.3 Calculation of Planetary Orbital Velocities in IKOA
The planetary velocity is calculated by the distance from the sun, and the planetary velocity increases as the planet gets closer to the sun and decreases as it gets farther away from the sun. In the traditional KOA, the planetary velocity update step parameter is a fixed value of 1 or −1. The step size of planetary velocity update is too large, which leads to the results of skipping the optimal solution, slower convergence, oscillations or discretization, and lower accuracy. In order to ensure that the algorithm has a sufficient search range and at the same time ensure a fine search near the optimal solution, the planetary velocity update step size is improved by nonlinearly incrementing in the range of 0~1. In turn, according to the Vis-viva equation [18], the velocity of the planet relative to the Sun, modified based on the MPPT, is shown in Eqs. (16) to (27) [18]:
The purpose of Eq. (26) is to calculate the percentage of steps in which each object undergoes a change; if
4.1.4 Escape from IKOA Local Optimization
The improved adaptive perturbation switching probability facilitates the optimal solution to jump out of the local optimum at a later stage of the algorithm. In the traditional KOA, the normalized Euclidean distance between a celestial body and the condition for judgment is fixed, typically 0.5, so that the probability of updating the planetary velocity is the same throughout the iteration period. Therefore, this paper proposes an adaptive probability
where
4.1.5 Update of Planetary Positions in IKOA
Escaping the local optimum, as shown in Fig. 4, by simulating the gravitational pull of the Sun on the planet, the local optimum region is broken through by periodically switching the search direction to provide the planet with a better chance to explore the whole space. The exploration operation is simulated in IKOA when the planets are farther away from the sun, while the mining operation is realized when the planets are closer to the sun. The positions are updated as shown below [18]:
where

Figure 4: Exploration and exploration of planets in search space
The positions of the celestial planets are updated to simulate the natural change in the distance between the sun and the planets over time. As the planets get closer to the sun, the mining operator is activated to increase the rate of convergence, while when the sun is farther away, The exploration operator is activated to minimize falling into a local optimum, as shown below [18]:
where
where
where
where
When the number of iterations of the above IKOA algorithm reaches a set value and the tracking is near the current MPP, in order to further improve the accuracy of the algorithm in tracking the maximum power, an optimized variable-step perturbation algorithm is used to perform a small-scale local search to find the global MPP.
4.2 Optimized Variable-Step Perturbation Observation Method Algorithm Implementation
The P&O perturbation observation method is one of the commonly used MPPT methods, which has the characteristics of easy implementation and simplicity, and can help the optimization algorithm’s further search for the optimal point. However, the traditional P&O perturbation method, its step size is usually a constant fixed value. If the step size is set too small, it will reduce the search speed and lead to a long convergence time; when the step size is set too large, it will lead to large fluctuations at the MPP, which reduces the accuracy of the search. Therefore, in this paper, an OIP&O is used to improve the perturbation step size by sampling the PV system, which is comparing and calculating the output power and output voltage before and after the perturbation and their change rates to optimize the step size, and the perturbation process is shown in the following equation:
where
The OIP&O initially approaches the MPP faster by a larger amount of perturbation. After successfully tracking near the MPP, the reduction of power variation and voltage variation causes the perturbation amount to be reduced accordingly, thus improving the tracking accuracy.
4.3 Algorithm Restart Condition
For the MPPT control strategy algorithm, it is necessary to ensure that the whole system works at the MPP in real time, but the sudden change of the external environment often affects the output power of the system, in order to avoid the loss of power to ensure the stable operation of the system, the restart of the algorithm is also very important. This paper adopts the absolute magnitude of the fluctuation of the output power of the PV array and the ratio of the maximum output power. Under the working conditions as the restart conditions, that is, to meet Eq. (34) when the algorithm restarts [28].
where
In summary, as shown in the algorithm flowchart in Fig. 5 below. In the early stage of this paper, the IKOA algorithm is used as a means of global search, and the initial planetary population position, spatial upper bound, spatial lower bound, orbital parameters and orbital period are generated, according to the improved Kepler algorithm. The search and exploration of the solution space are carried out to determine the value of the maximum PV power and the corresponding duty cycle, through the optimal strategy. Subsequently, an OIP&O is adopted to locally search the current optimal duty cycle, in order to improve the search accuracy of the PV MPP. Then the algorithm restart setting is carried out. The planet position represents the duty cycle of the Boost circuit, which realizes the maximum power tracking control and eliminates the traditional PI control loop, simplifying the design and operation of the controller.
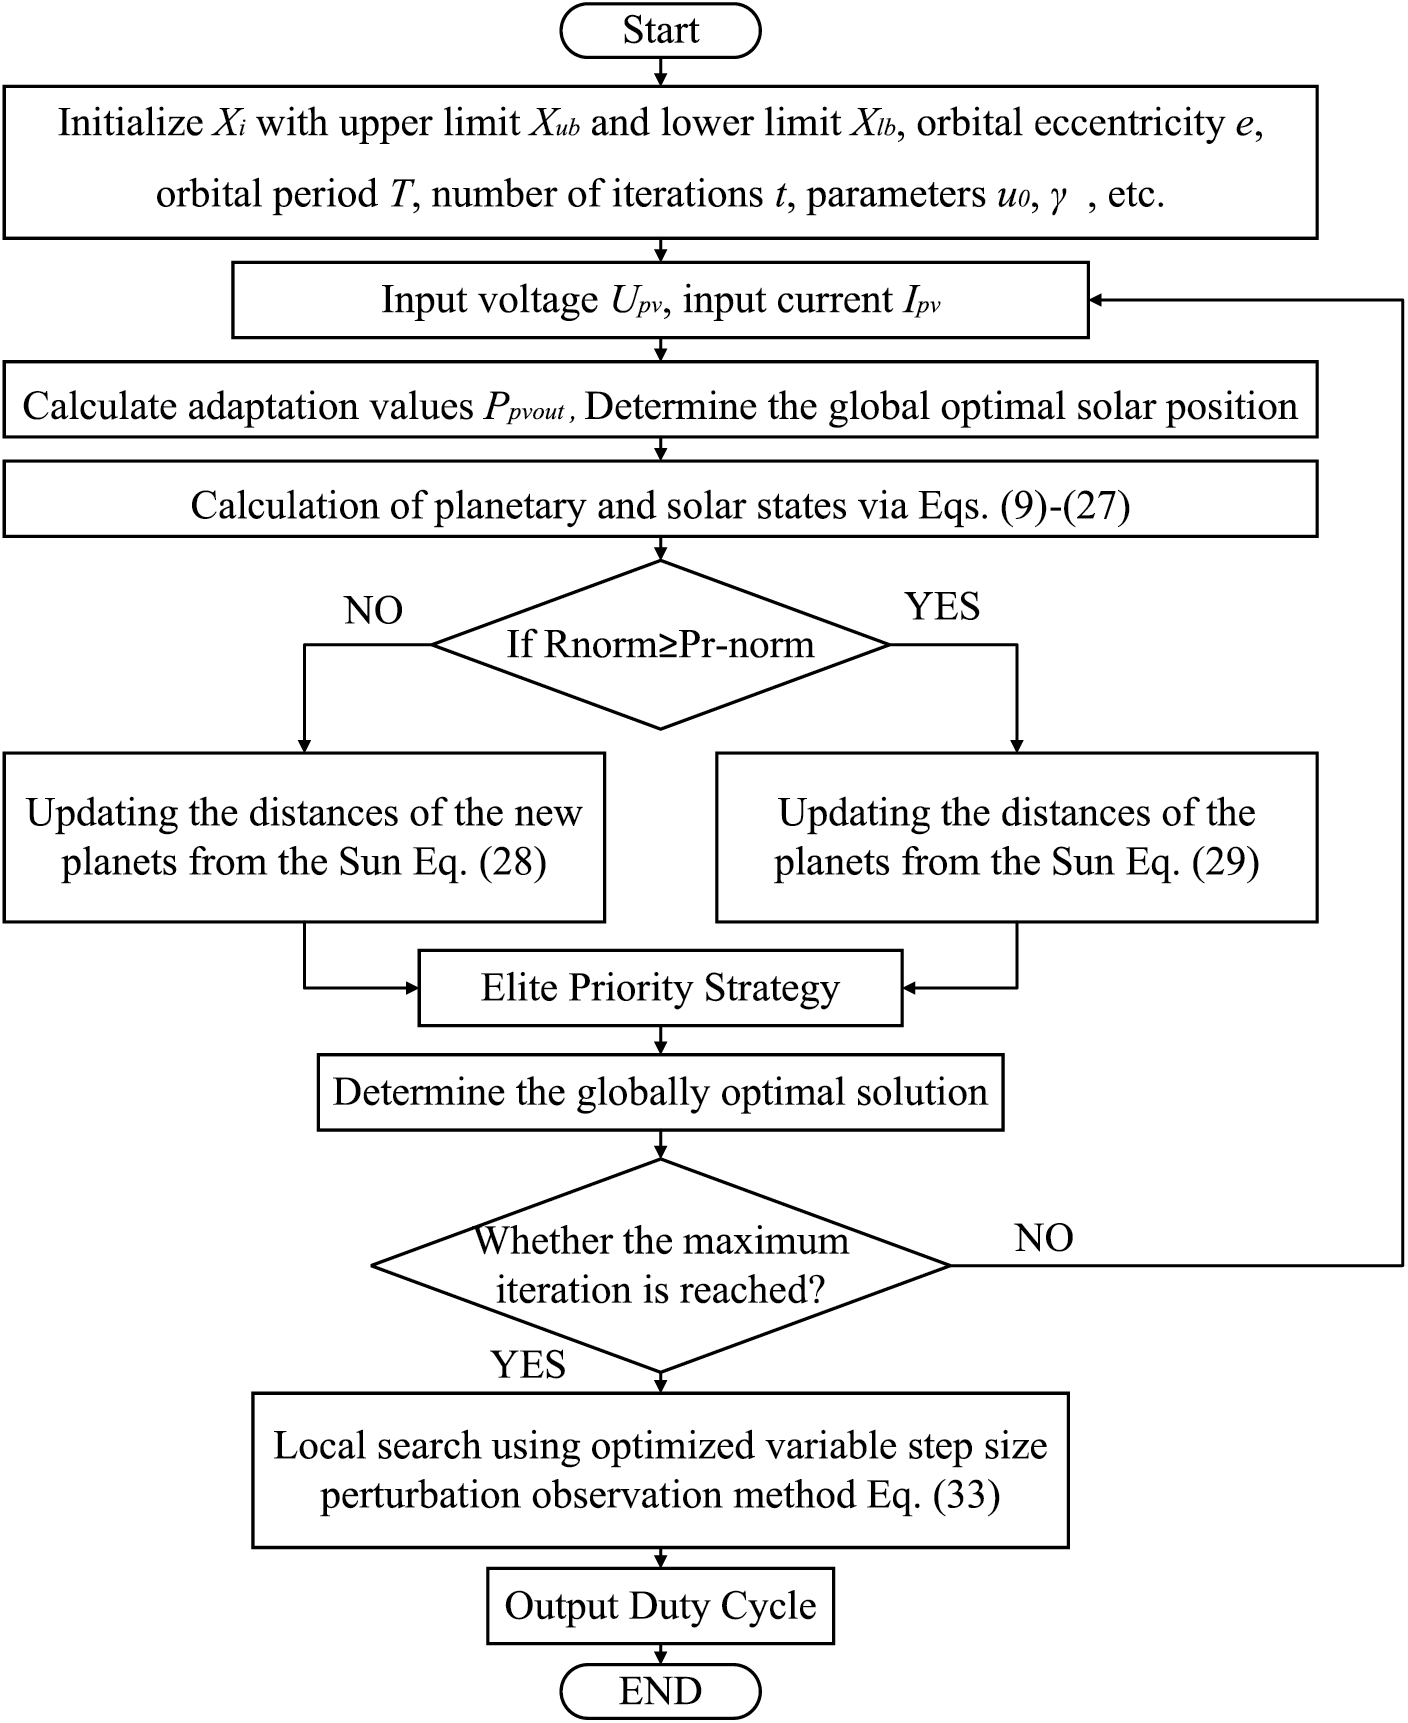
Figure 5: Flowchart of IKOA-OIP&O algorithm
5 Algorithm Simulation Results and Simulation
In order to verify the effectiveness and performance of the present proposed improved Keplerian algorithm, simulations are carried out in Simulink. The PV array consists of 5 × 5 module blocks with individual module parameters

In order to specifically analyze the multi-peak output characteristics of PV arrays under localized PSC, the localized shading conditions are simulated by giving four groups of PV cells set with different light intensities, respectively. In order to highlight the impact of localized shading on PV arrays, the environmental parameters are set as shown in Table 3, with the STC as the unshaded state, the set light intensity of 1000 constant and the temperature of 25°C.

The P-U and I-U characteristic curves of the PV array under four working conditions are shown in Fig. 6. As can be seen from Fig. 6, under working condition I (uniform illumination), the P-U characteristic curve of the PV array has only one peak point, and the traditional MPPT algorithm can effectively track to the MPP. However, under working condition PSC1, PSC2 and PSC3, due to changes in the external environment (light intensity, temperature, etc.), the P-U characteristic curve of the PV array is a nonlinear curve with multiple peak points, but there is one and only one global MPP. Therefore, in order to ensure that the PV array can always work at the MPP under complex operating conditions, the study of PV multi-peak MPPT is of great significance.
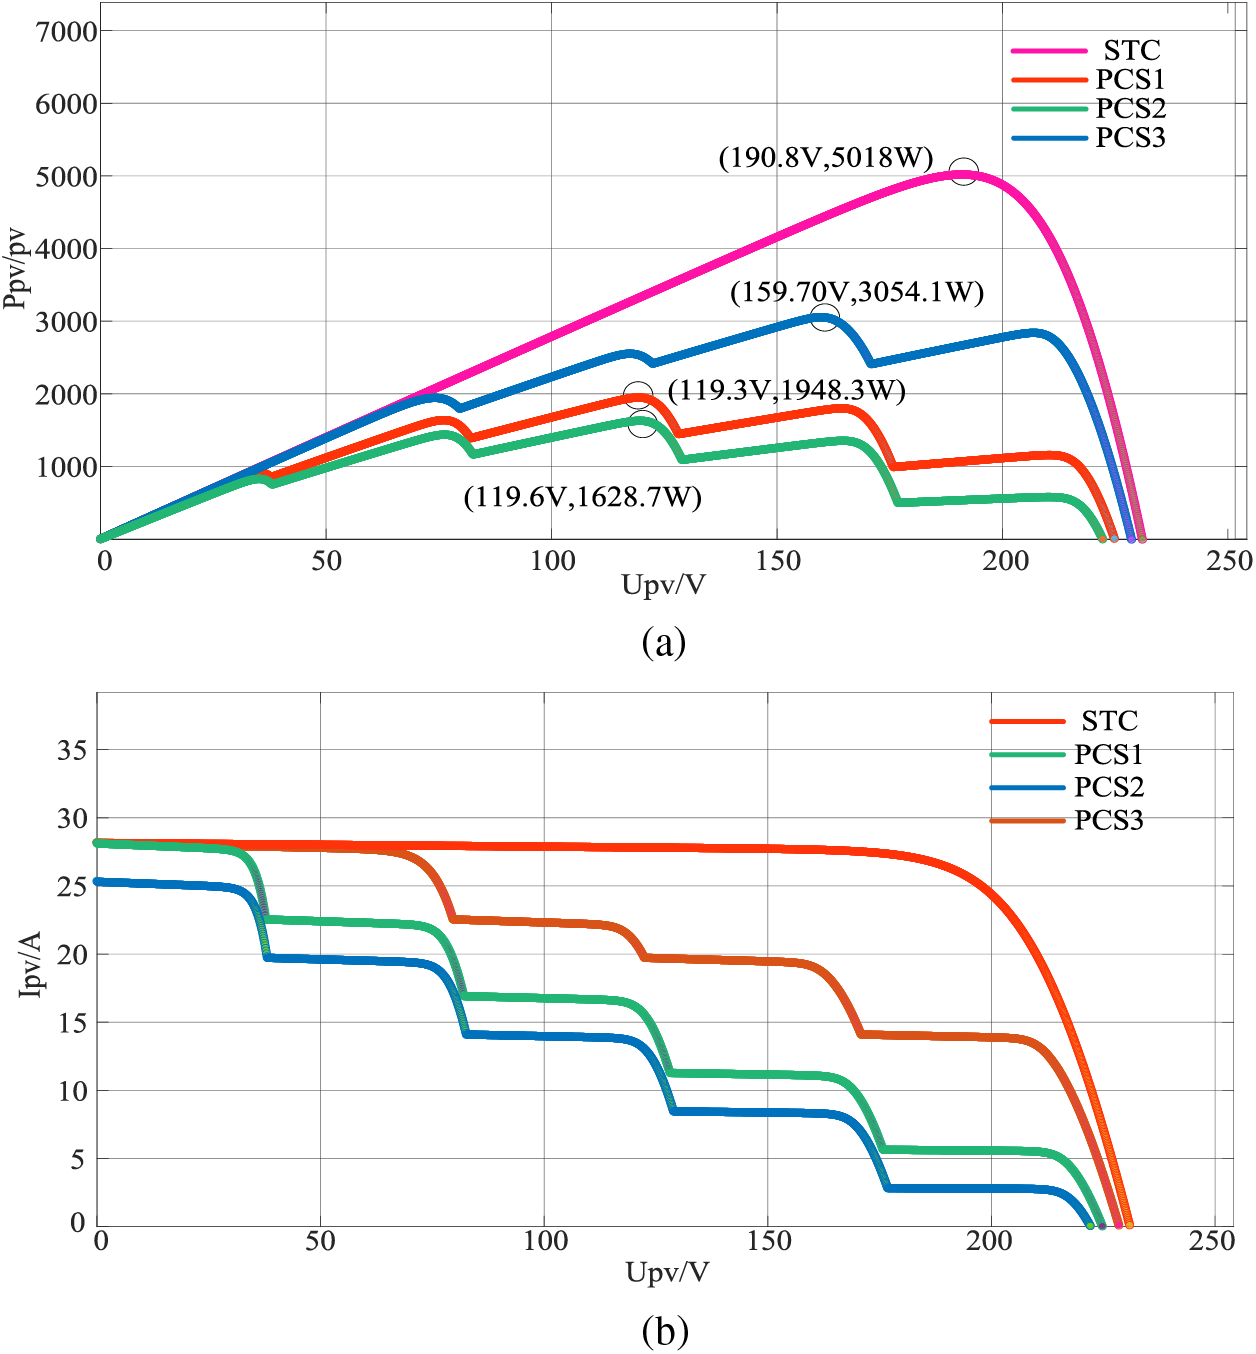
Figure 6: Characteristic curve of PV array output power under different working conditions. (a) U-I characteristic curves for four operating conditions. (b) P-U characteristic curves for four operating conditions
The simulation environment is selected to be at 25°C, and a total of four states are simulated, so that the PV arrays are simulated under the two conditions of standard working condition (STC) and switching to working condition PSC1 (uniform illumination and localized shade), and the mutation of working condition PSC1 to working condition PSC2, and then to working condition PSC3 (dynamic shading), and the simulation experiments are conducted to compare the same conditions of CS, GWO-P&O, KOA-P&O, and IKOA-OIP&O algorithms under the same conditions, and analyze the convergence speed and tracking accuracy of the algorithms.
This study evaluates a proposed MPPT algorithm in comparison with three existing methods designed for PV panel output characteristics: CS algorithm, Grey Wolf Optimization-Perturb and Observe (GWO-P&O), and kepler optimization algorithm-perturb and observe (KOA-P&O). The CS algorithm, known for its simplicity and reliability, may exhibit slower dynamic response and instability under varying PV conditions. This comparison assesses the advancements achieved over these traditional methods.
The GWO-P&O and KOA-P&O algorithms, representing recent advancements in optimization, aim to enhance MPPT efficiency and accuracy for PV panels. Despite their improvements, these methods may face higher computational complexity and adaptability challenges. By contrasting the proposed algorithm with these advanced methods, strengths in dynamic response, tracking accuracy, and computational efficiency are highlighted, demonstrating its practical value and potential for further research and application in optimizing PV panel performance.
5.1 Uniform Light and Partial Shade
When the PV array is working in uniform illumination (STC), the PV power output curve has only one peak. At this time, the maximum power of the system is 5018 W. The IKOA-OIP&O algorithm is simulated and output, and the three algorithms of CS, GWO-P&O, and KOA-P&O are compared, and the simulation time reaches 1 s when switching to the PSC1 condition, as shown in Fig. 7, the PV power output presents multiple peaks, and when the peaks do not have much difference, it will appear to fall into the local optimal The maximum power of the system is 1948.3 W. The simulation results of the four algorithms are shown in Fig. 6, and the simulation results of STC and PSC1 are shown in Table 4 and Fig. 8.
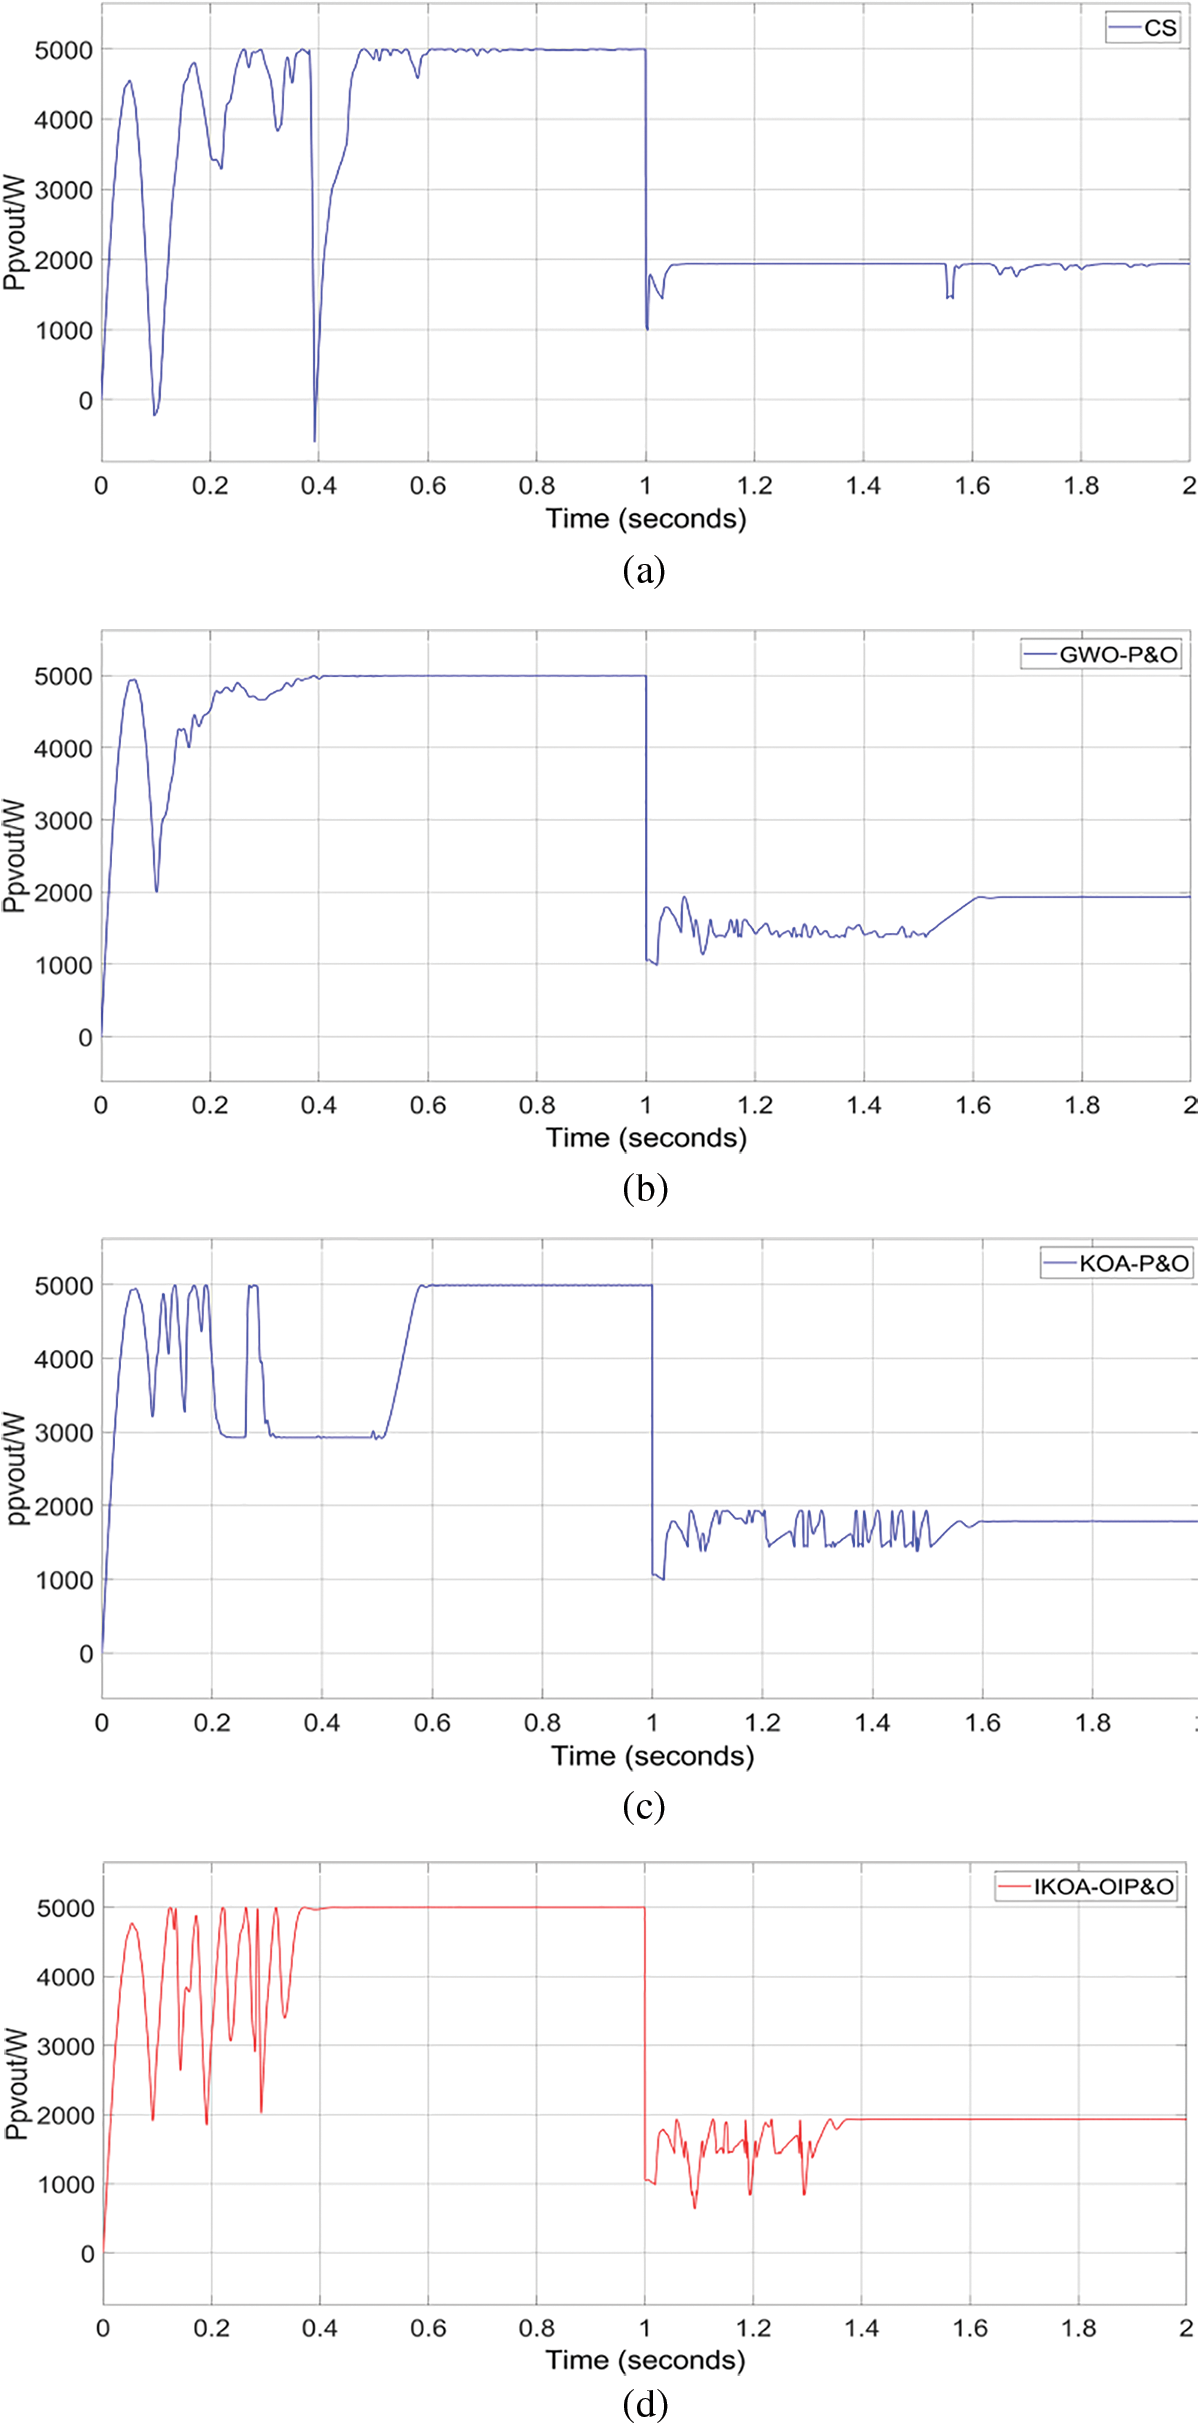
Figure 7: Comparison of algorithms under uniform light and partial shade conditions. (a) CS. (b) GWO-P&O. (c) KOA-P&O. (d) IKOA-OIP&O

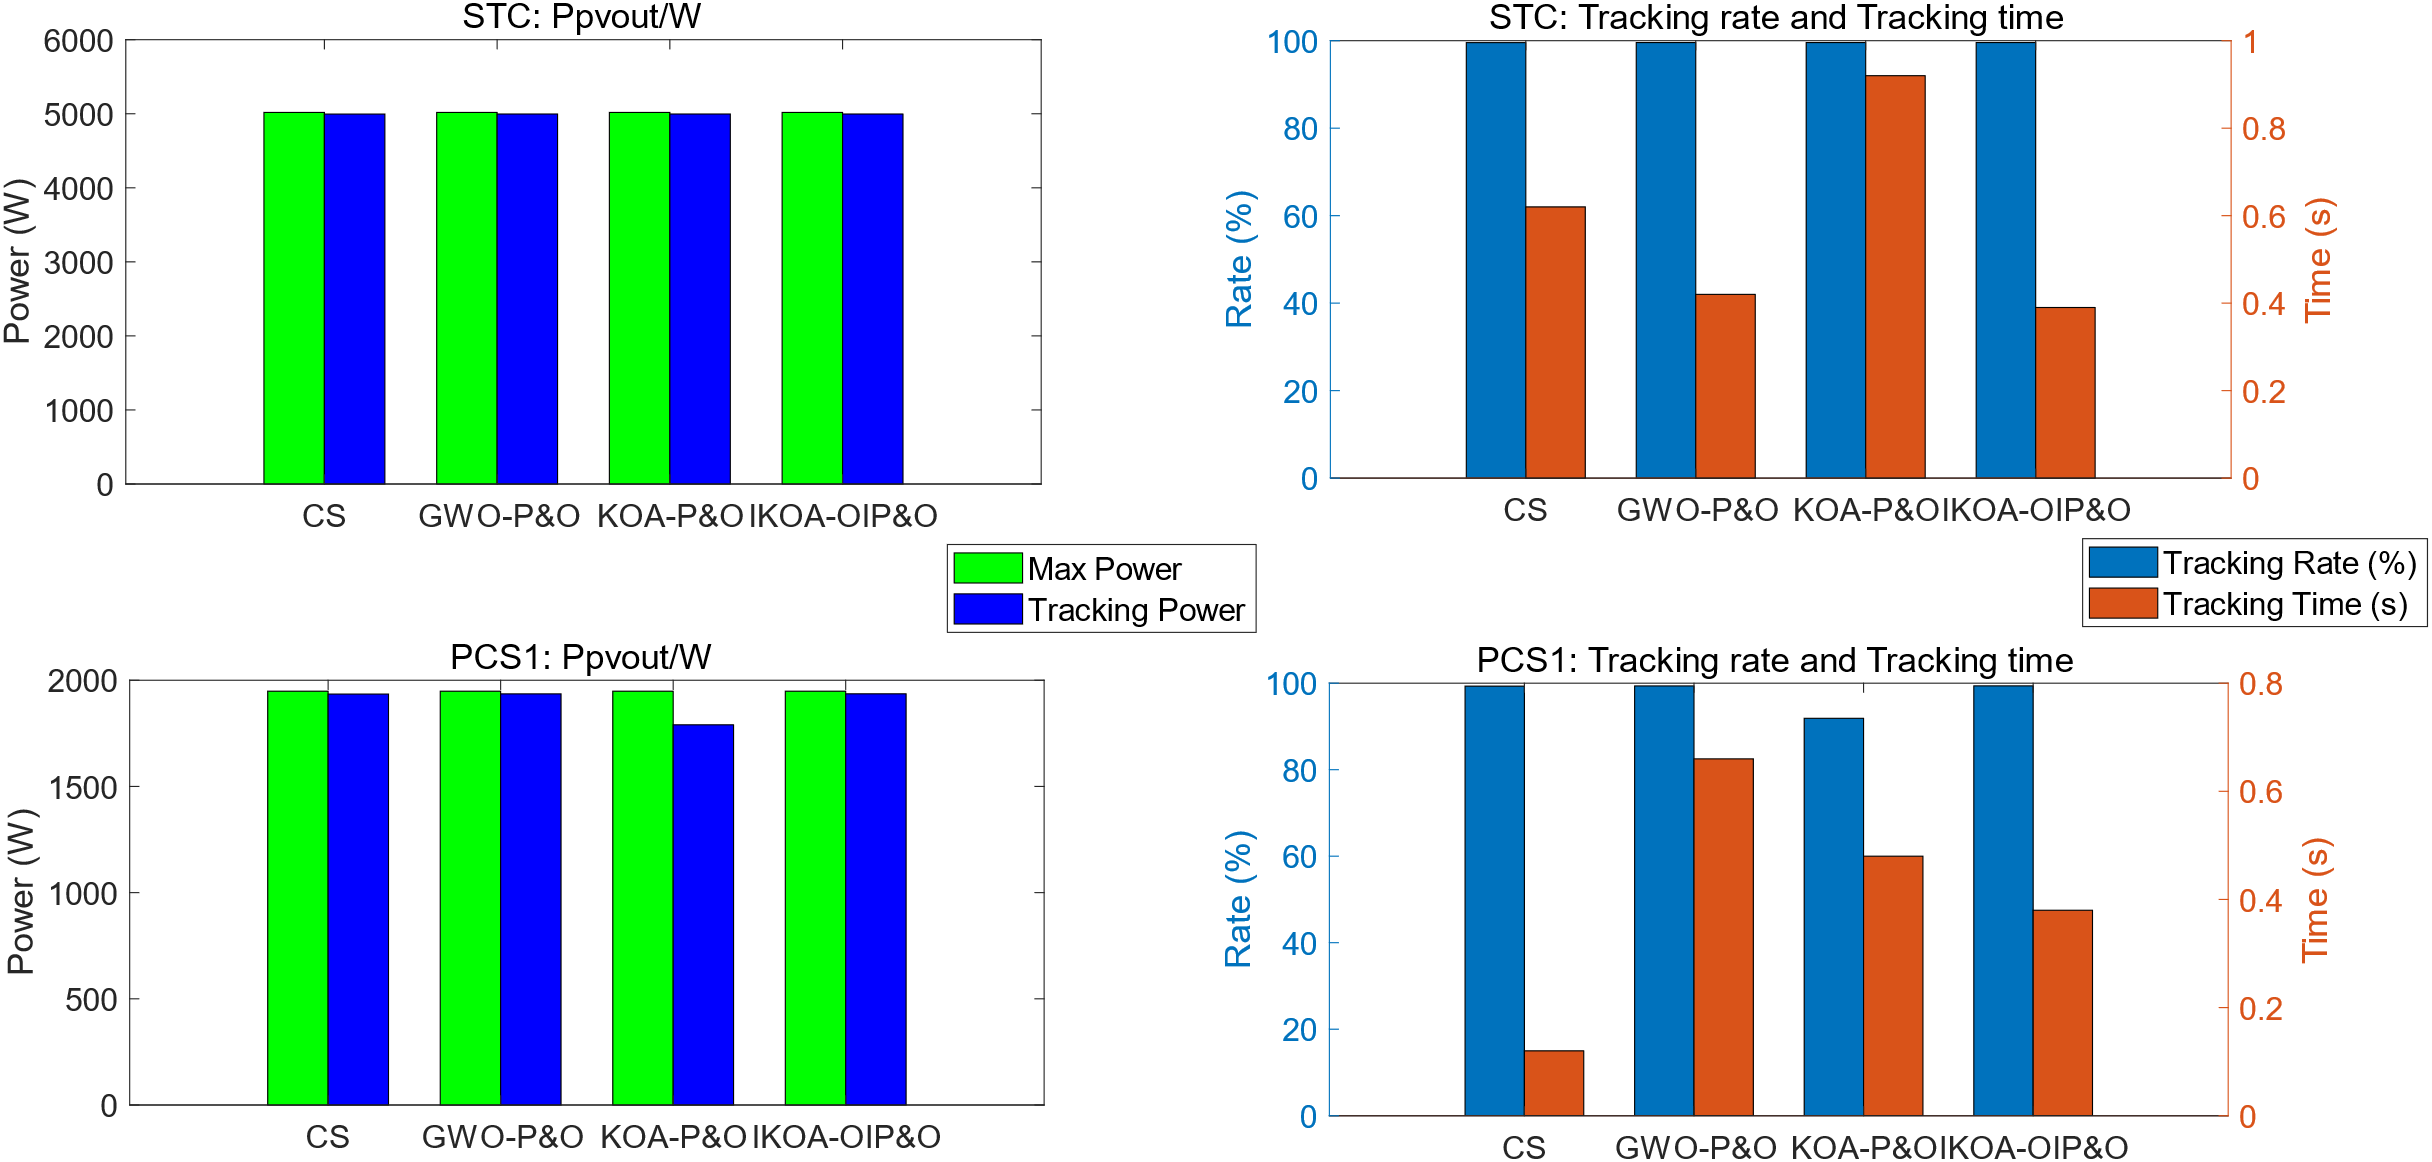
Figure 8: Comparison chart of algorithm results under STC-PSC1
From Figs. 7, 8 and Table 4, it can be seen that: in the initial STC for maximum power tracking, CS system finds the optimal value around 0.62, and the optimal value is around 4996.1 W; GWO-P&O finds the optimal value (around 4996.6 W) around 0.42 s; KOA-P&O system finds the optimal value (around 4996 W) in approximately 0.6 s. the system based on IKOA-OIP&O finds the optimal value around 0.39 s, and the optimal value is around 4996.9 W. It can be seen that IKOA-OIP&O algorithm is better than the other three algorithms in terms of optimization speed and accuracy.
When the system is switched from STC to PSC1, CS system finds the optimal value around 0.12 after switching, and the optimal value is about 1934.9 W, however, oscillations occur at a later stage, leading to system instability; GWO-P&O system finds the optimal value around 0.66 s after switching, and the optimal value is about 1935.9 W; KOA-P&O system finds the optimal value around 0.6 s after switching, and the optimal value is about 1790.1 W, which is caught in the local optimum; IKOA-OIP&O system finds the optimal value around 0.38 s after switching, and the optimal value is about 1936.1 W. It can be seen that the accuracy of the system based on IKOA-OIP&O algorithm is better than the other three algorithms, and the speed of finding the optimal value still belongs to the top.
5.2 Simulation Analysis under Dynamic Shade State Conditions
The natural shade environment is simulated by setting different light intensities, at which time the power output curve has multiple peaks, and it is easy to fall into possibility of local optimization when the peaks do not differ much. The power outputs of PSC1, PSC2 and PSC3 are shown in Fig. 5, and the maximum power in STC1 is 1948.3 W, the maximum power in STC2 is 1628.7 W, and the maximum power in STC3 is 3054.1 W. The simulation outputs are performed for the IKOA-OIPO algorithm, and the simulation outputs for the IKOA-OIPO algorithm, while the comparison with three algorithms, CS, GWO-P&O, and KOA-P&O, the results of the four algorithms are shown in Fig. 9, and the PSC1, PSC2, and PSC3 simulation results are shown in Table 5 and Fig. 10.
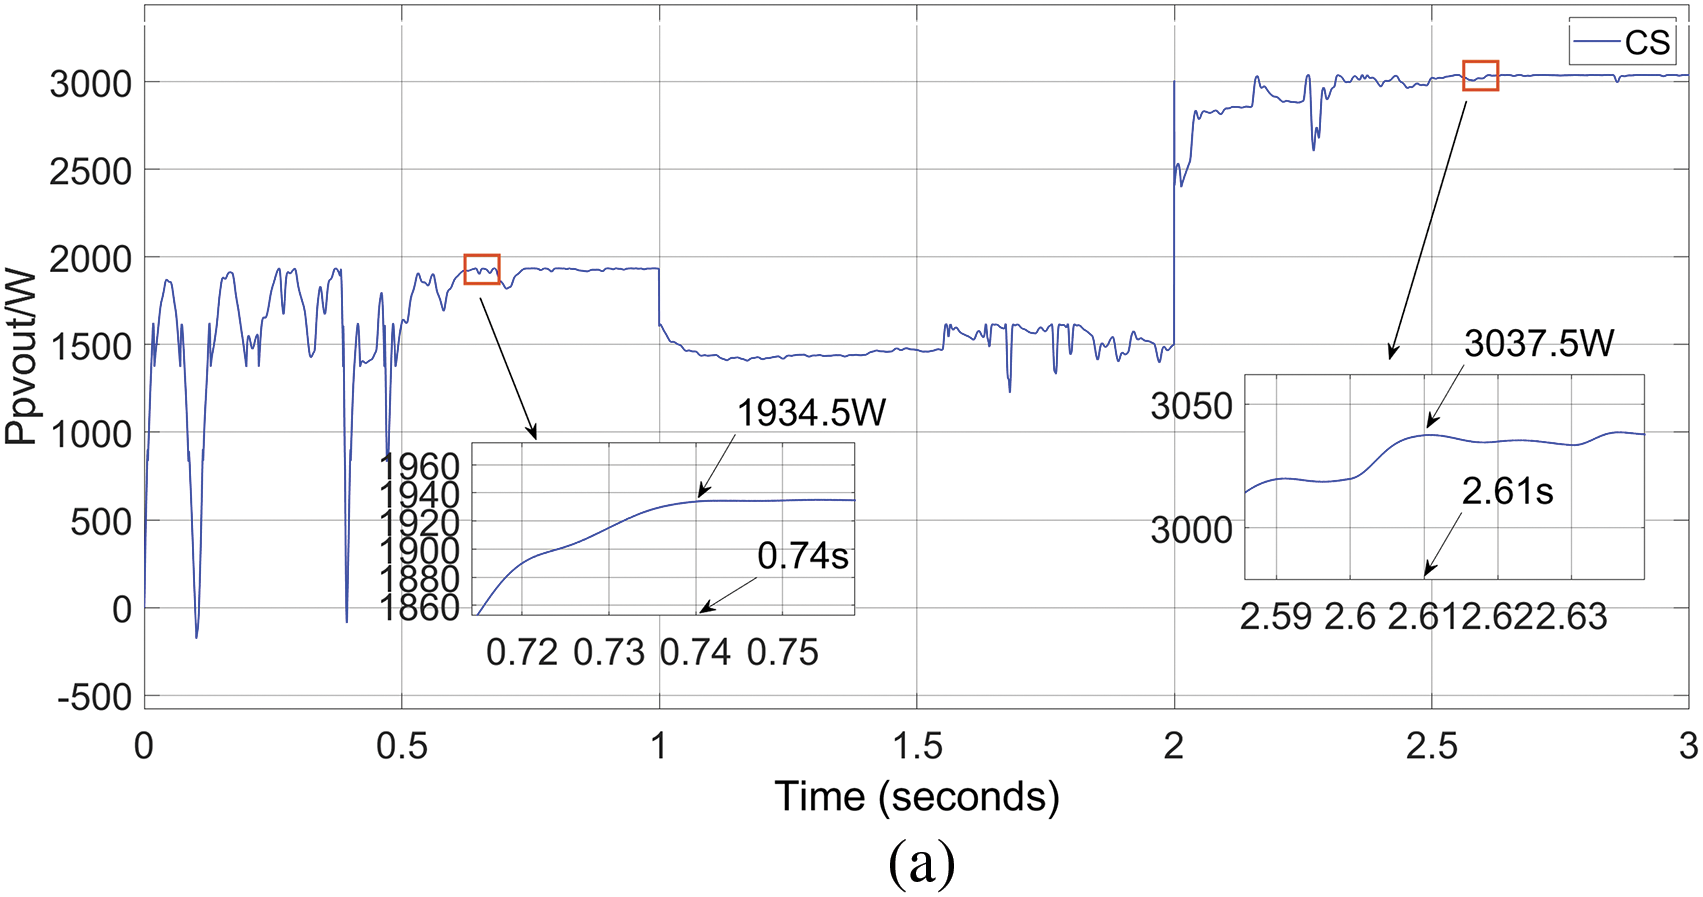

Figure 9: Comparison of algorithms in dynamic shade condition. (a) CS. (b) GWO-P&O. (c) KOA-P&O. (d) IKOA-OIP&O

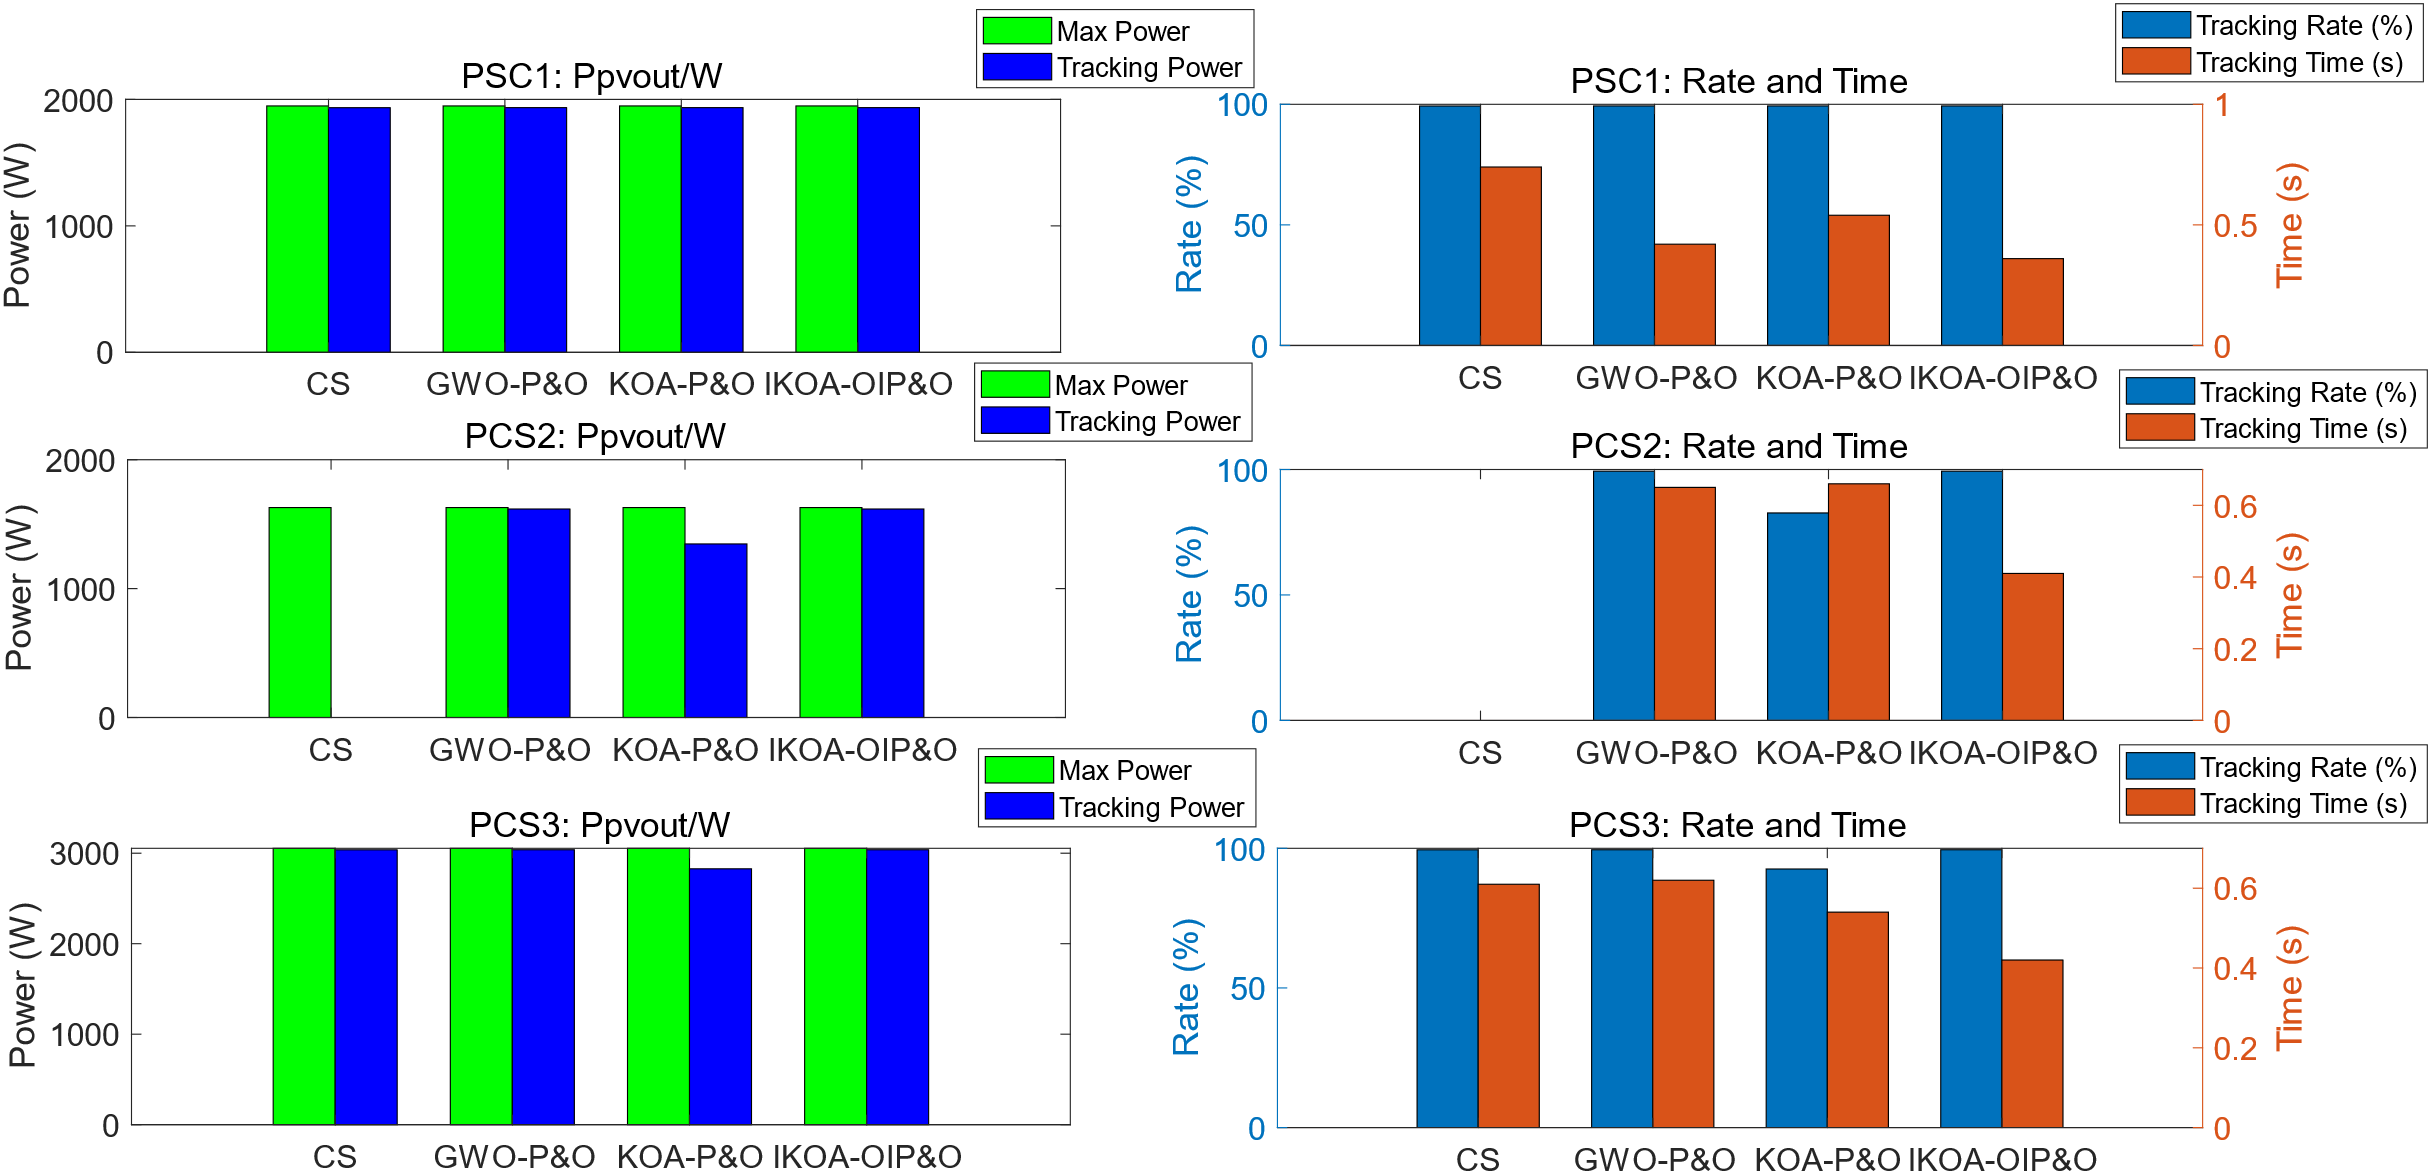
Figure 10: Comparison of algorithm results under PSC1-PSC2-PSC3
From Figs. 9, 10 and Table 5, it can be seen that: in the initial PSC1 condition for MPPT, CS system finds the optimal value around 0.74 s of tracking, and the optimal value is around 1934.5 W; GWO-P&O system finds the optimal value around 0.42 s of tracking, and the optimal value is around 1934.9 W; KOA-P&O system finds the optimal value around 0.54 s and the optimal value is around 1934.9 W; IKOA-OIP&O system finds the optimal value around 0.36 s of tracing and the optimal value is around 1934.9 W.
When the simulation time reaches 1 s, PSC1 switches to PSC2, CS system initially falls into a local optimum during early tracking, but later becomes unstable due to multiple closely spaced peaks under condition two; GWO-P&O system finds the optimal value in the tracking of around 0.65 s, and the optimal value is around 1617.6 W; KOA-P&O system finds the optimal value around 0.66 s, and the optimal value is around 1346.4 W, but falls into the local optimum; IKOA-OIP&O system finds the optimal value around 0.41 s, and the optimal value is around 1617.5 W.
When simulation time reaches 2 s, PSC2 is switched to PSC3 condition, CS system finds the optimal value around the tracking 0.61 s process, and the optimal value is around 3037.5 W; the GWO-P&O system finds the optimal value around the tracking 0.62 s, and the optimal value is around 3038.4 W; KOA-P&O system finds the optimal value around the tracking 0.54 s, but falls into the local optimum; IKOA-OIP&O based on finds the optimal value around tracking around 0.42 s, and the optimal value is around 3038.4 W. In summary, the IKOA-OIP&O algorithm outperforms the other three algorithms in both speed and accuracy.
This paper proposes an MPPT optimization algorithm for PV systems in hybrid inverters, named the IKOA-OIP&O algorithm. This algorithm combines the IKOA with the OIP&O. The integration of algorithmic improvements and adaptive optimization coefficients enhances the MPPT accuracy and convergence speed.
Simulation analysis shows that compared to CS, GWO-P&O, and KOA-P&O algorithms with the same PV output sampling rate, IKOA-OIP&O exhibits stronger global search randomness in its early stages. Later, leveraging the OIP&O allows for swift local convergence, achieving up to 30% faster convergence time. Faster MPPT speeds enable the inverter to respond more quickly to changes in solar irradiance and temperature, thus optimizing power extraction in real time. This rapid adaptation minimizes energy losses and maximizes the energy harvested from the PV panels. More accurate MPPT tracking rates enhance the precision of power extraction by maintaining the inverter’s operation at the true MPP. This precision ensures that the system operates efficiently even under fluctuating environmental conditions, leading to better overall system performance and energy yield. Improved MPPT accuracy also contributes to the stability and reliability of the energy storage system by preventing unnecessary power fluctuations and maintaining consistent energy flow to the grid or storage units. The algorithm mitigates power oscillations in PV outputs, showing stability and faster convergence in multi-state MPPs and single-state multi-peak shading conditions, making it suitable for MPPT in diverse shading scenarios.
The main contribution of this study is a systematic comparison of the performance of MPPT algorithms for single-and double-sided PV panels in hybrid PV inverters. Additionally, this study proposes an optimized MPPT strategy tailored for varying light conditions to enhance the dynamic responsiveness and accuracy of the MPPT algorithm, thereby improving overall power generation efficiency.
However, the algorithm has certain limitations. For instance, its performance may be compromised under extreme climatic conditions, such as high temperatures or significant shading. Additionally, challenges related to hardware deployment and computational resources may arise. Future research should address these limitations by enhancing the algorithm’s robustness and computational efficiency to improve its applicability and performance across diverse environmental conditions.
Acknowledgement: The authors would like to thank and acknowledge the Jiangsu Key Laboratory of Power Transmission & Distribution Equipment Technology.
Funding Statement: The authors received funding from the Graduate Practice Innovation Program of Jiangsu University of Technology (XSJCX23_58), and Changzhou Science and Technology Support Project (CE20235045), and Open Project of Jiangsu Key Laboratory of Power Transmission & Distribution Equipment Technology (2021JSSPD12).
Author Contributions: The authors confirm contribution to the paper as follows: Study conception and design: Zhaoqiang Wang; data collection: Zhaoqiang Wang; analysis and interpretation of results: Zhaoqiang Wang; draft manuscript preparation: Zhaoqiang Wang and Fuyin Ni. All authors reviewed the results and approved the final version of the manuscript.
Availability of Data and Materials: The authors confirm that the data used in this study are available on request.
Ethics Approval: Not applicable.
Conflicts of Interest: The authors declare that they have no conflicts of interest to report regarding the present study.
References
1. Z. Lin and S. Li, “A review of the current research situation of photovoltaic inverters,” Electric. Switchgear, vol. 55, no. 5, pp. 10–13+18, 2017. [Google Scholar]
2. J. A. Salim, M. S. Alwan, and B. M. Albaker, “A conceptual framework and a review of AI-based MPPT techniques for photovoltaic systems,” J. Phys.: Conf. Series, vol. 1963, no. 1, 2021, Art. no. 12168. doi: 10.1088/1742-6596/1963/1/012168. [Google Scholar] [CrossRef]
3. K. Bao, H. Chen, Q. Cheng, and H. Wu, “Control method of photovoltaic energy storage Quasi-Z-source grid-connected inverter based on passive theory,” Smart Power, vol. 50, no. 2, pp. 35–41, 2022. [Google Scholar]
4. P. Ali and H. Constantine, “Employing load and irradiance profiles for the allocation of PV arrays with inverter reactive power and battery storage in distribution networks—A fast comprehensive QSTS technique,” Int. J. Electr. Power Energy Syst., vol. 130, 2021, Art. no. 106915. doi: 10.1016/J.IJEPES.2021.106915. [Google Scholar] [CrossRef]
5. A. Moses and H. Sun, “Bidirectional energy storage photovoltaic grid-connected inverter application system,” Int. J. Energy Res., vol. 44, no. 14, pp. 11509–11523, 2020. doi: 10.1002/er.5771. [Google Scholar] [CrossRef]
6. P. Padmavathi, N. Sudhakar, A. Belqasem, B. Karthik, and T. S. Babu, “PV-Fed micro-inverter with battery storage for single phase grid applications,” Elect. Power Compon. Syst., vol. 51, no. 11, pp. 1051–1074, 2023. doi: 10.1080/15325008.2023.2189758. [Google Scholar] [CrossRef]
7. L. de Oliveira-Assis et al., “Simplified model of battery energy-stored quasi-Z-source inverter-based photovoltaic power plant with Twofold energy management system,” Energy, vol. 244, 2022, Art. no. 122563. doi: 10.1016/J.ENERGY.2021.122563. [Google Scholar] [CrossRef]
8. Y. Fan, J. Chen, Q. Bian, Y. Wu, J. Tong and C. Zhan, “Design of maximum power point energy storage and inverter for photovoltaic power generation,” J. Phys.: Conf. Series, vol. 2771, no. 1, 2024, Art. no. 12018. doi: 10.1088/1742-6596/2771/1/012018. [Google Scholar] [CrossRef]
9. M. H. E. Banna, M. R. Hammad, A. I. Megahed, K. M. AboRas, A. Alkuhayli and N. Gowtham, “On-grid optimal MPPT for fine-tuned inverter based PV system using golf optimizer considering partial shading effect,” Alex. Eng. J., vol. 103, pp. 180–196, 2024. doi: 10.1016/j.aej.2024.05.115. [Google Scholar] [CrossRef]
10. B. Wang, W. Zhu, and Z. Bian, “Maximum power point tracking based on improved Cuckoo search algorithm combined with incremental conductance method,” Sci. Technol. Eng., vol. 24, no. 13, pp. 5388–5395, 2024. [Google Scholar]
11. B. Yang, R. Xie, and Z. Guo, “Maximum power point tracking technology for PV systems: Current status and perspectives,” Energy Eng., vol. 121, no. 8, pp. 2009–2022, 2024. doi: 10.32604/ee.2024.049423. [Google Scholar] [CrossRef]
12. K. Guo, D. Yan, and J. Fu, “MPPT research of photovoltaic system based on improved perturbation and observation method,” (in ChineseChinese J. Power Sources, vol. 45, no. 1, pp. 56–59, 2021. [Google Scholar]
13. M. A. Bakar Siddique, A. Asad, R. M. Asif, A. U. Rehman, M. T. Sadiq and I. Ullah, “Implementation of incremental conductance MPPT algorithm with integral regulator by using boost converter in grid-connected PV array,” IETE J. Res., vol. 69, no. 6, pp. 3822–3835, 2023. doi: 10.1080/03772063.2021.1920481. [Google Scholar] [CrossRef]
14. C. B. Regaya, F. Farhani, H. Hamdi, A. Zaafouri, and A. Chaari, “A new MPPT controller based on a modified multiswarm PSO algorithm using an adaptive factor selection strategy for partially shaded PV systems,” Trans. Inst. Meas. Contr., vol. 46, no. 10, pp. 1991–2000, 2024. doi: 10.1177/01423312231225992. [Google Scholar] [CrossRef]
15. B. Liu, B. Chen, L. Qian, Y. Shi, and L. Lü, “Photovoltaic array power tracking strategy with an improved levy-flight grey wolf optimization and variable-step perturbation & observation,” J. Power Supply, pp. 1–12, 2024. [Google Scholar]
16. S. Sajid, H. M. Annas, J. M. Yaqoob, A. A. Bilal, and E. Krzysztof, “A horse herd optimization algorithm (HOA)-based MPPT technique under partial and complex partial shading conditions,” Energies, vol. 15, no. 5, pp. 1880–1880, 2022. doi: 10.3390/en15051880. [Google Scholar] [CrossRef]
17. X. Liu, J. Zhu, H. Guo, and F. Bao, “Photovoltaic arrays MPPT method based on improved flower optimization algorithm,” Eng. J. Wuhan Univ., pp. 1–9, 2024. [Google Scholar]
18. A. -B. Mohamed, M. Reda, A. S. A. Abdel, J. Mohammed, and A. Mohamed, “Kepler optimization algorithm: A new metaheuristic algorithm inspired by Kepler’s laws of planetary motion,” Knowl. Based Syst., vol. 268, 2023, Art. no. 110454. doi: 10.1016/J.KNOSYS.2023.110454. [Google Scholar] [CrossRef]
19. H. -Q. Pablo, G. -T. Pablo, S. -M. Raúl, C. A. García-Vázquez, and L. M. Fernández-Ramírez, “Model predictive control of a microgrid with energy-stored quasi-Z-source cascaded H-bridge multilevel inverter and PV systems,” Appl. Energy, vol. 346, 2023, Art. no. 121390. doi: 10.1016/J.APENERGY.2023.121390. [Google Scholar] [CrossRef]
20. A. Garrod and A. Ghosh, “A review of bifacial solar photovoltaic applications,” Front. Energy, vol. 17, no. 6, pp. 704–726, 2023. doi: 10.1007/s11708-023-0903-7. [Google Scholar] [CrossRef]
21. M. H. Ibrahim, M. A. Ibrahim, and S. I. khather, “Modelling and analysis of SA-SPV system with bi-directional inverter for lighting load,” Przegląd Elektrotechniczny, vol. 1, no. 5, pp. 128–131, 2022. doi: 10.15199/48.2022.05.23. [Google Scholar] [CrossRef]
22. C. Wang, “Research on three-phase bidirectional inverter based on Zeta-Sepic,” M.S. thesis, Information Engineering, Nanchang Hangkong Univ, Nanchang, China, 2021. [Google Scholar]
23. A. Musaed and R. Saifur, “A bi-level optimization method for voltage control in distribution networks using batteries and smart inverters with high wind and photovoltaic penetrations,” Int. J. Electr. Power Energy Syst., vol. 151, 2023, Art. no. 109217. doi: 10.1016/J.IJEPES.2023.109217. [Google Scholar] [CrossRef]
24. S. Han, J. Hu, Y. Han, J. Wang, L. Wang and P. Lund, “Research on modeling and power generation performance of bifacial photovoltaic module,” Acta Energiae Solaris Sinica, vol. 44, no. 9, pp. 94–100, 2023. doi: 10.19912/j.0254-0096.tynxb.2022-0793. [Google Scholar] [CrossRef]
25. M. Tang et al., “MPPT strategy of waterborne bifacial photovoltaic power generation system based on economic model predictive control,” Energies, vol. 17, no. 1, 2023, Art. no. 152. doi: 10.3390/en17010152. [Google Scholar] [CrossRef]
26. F. Duan, M. Eslami, M. Khajehzadeh, A. Basem, D. J. Jasim and S. Palani, “Optimization of a photovoltaic/wind/battery energy-based microgrid in distribution network using machine learning and fuzzy multi-objective improved Kepler optimizer algorithms,” Sci. Rep., vol. 14, no. 1, 2024, Art. no. 13354. doi: 10.1038/s41598-024-64234-x. [Google Scholar] [PubMed] [CrossRef]
27. R. Mohamed, M. A. Basset, K. M. Sallam, I. M. Hezam, A. M. Alshamrani and I. A. Hameed, “Novel hybrid Kepler optimization algorithm for parameter estimation of photovoltaic modules,” Sci. Rep., vol. 14, no. 1, 2024, Art. no. 3453. doi: 10.1038/s41598-024-52416-6. [Google Scholar] [PubMed] [CrossRef]
28. X. Bai, S. Mo, S. Fan, L. Xu, and J. Xiong, “Research on MPPT control of photovoltaic systems based on NACS-PSO algorithm,” Electron. Meas. Technol., vol. 47, no. 3, pp. 62–70, 2024. doi: 10.19651/j.cnki.emt.2314795. [Google Scholar] [CrossRef]
Cite This Article
 Copyright © 2024 The Author(s). Published by Tech Science Press.
This work is licensed under a Creative Commons Attribution 4.0 International License , which permits unrestricted use, distribution, and reproduction in any medium, provided the original work is properly cited.


 Submit a Paper
 Propose a Special lssue
 View Full Text
 Download PDF
 Downloads
 Citation Tools