 Open Access
ARTICLE
Combined Wind-Storage Frequency Modulation Control Strategy Based on Fuzzy Prediction and Dynamic Control
1 Northeast Electric Power University, Key Laboratory of Modern Power System Simulation and Control & Renewable Energy Technology of the Ministry Education, Jilin, 132012, China
2 State Grid Songyuan Electric Power Supply Company, Songyuan, 138000, China
* Corresponding Author: Yulong Cao. Email:
Energy Engineering 2024, 121(12), 3801-3823. https://doi.org/10.32604/ee.2024.055398
Received 26 June 2024; Accepted 16 August 2024; Issue published 22 November 2024
Abstract
To ensure frequency stability in power systems with high wind penetration, the doubly-fed induction generator (DFIG) is often used with the frequency fast response control (FFRC) to participate in frequency response. However, a certain output power suppression amount (OPSA) is generated during frequency support, resulting in the frequency modulation (FM) capability of DFIG not being fully utilised, and the system’s unbalanced power will be increased during speed recovery, resulting in a second frequency drop (SFD) in the system. Firstly, the frequency response characteristics of the power system with DFIG containing FFRC are analysed. Then, based on the analysis of the generation mechanism of OPSA and SFD, a combined wind-storage FM control strategy is proposed to improve the system’s frequency response characteristics. This strategy reduces the effect of OPSA and improves the FM capability of DFIG by designing the fuzzy logic of the coefficients of FFRC according to the system frequency index in the frequency support stage. During the speed recovery stage, the energy storage (ES) active power reference value is calculated according to the change of DFIG rotor speed, and the ES output power is dynamically adjusted to reduce the SFD. Finally, taking the IEEE 39-bus test system as an example, real-time digital simulation verification was conducted based on the RTLAB OP5707 simulation platform. The simulation results show that the proposed method can improve the FM capability of DFIG, reduce the SFD under the premise of guaranteeing the rapid rotor speed recovery, and avoid the overshooting phenomenon so that the system frequency can be quickly restored to a stable state.Keywords
Nomenclature
| DFIG | Doubly-fed induction generator |
| OPSA | Output power suppression amount |
| FM | Frequency modulation |
| SFD | Second frequency drop |
| FFRC | Frequency fast response control |
| ES | Energy storage |
| MPPT | Maximum power point tracking |
| FLC | Fuzzy logic controller |
| WTG | Wind turbine generator |
| SG | Synchronous generator |
| SOC | State of charge |
In recent years, with the shortage of fossil energy resources and the increasing deterioration of the environment, global power energy is transforming to the renewable direction, and wind power, as a representative new energy source, has been developed rapidly [1–3]. Doubly-fed induction generators (DFIGs) have more flexible control methods and faster response times than conventional thermal generators. However, the decoupling between the rotor speed of the DFIG and the grid frequency results in a “zero inertia” characteristic for the whole system. This increases the difficulty of frequency modulation (FM) of the system [4]. For this reason, countries worldwide have made it clear that wind energy equipment must have a certain ability to inertia support and modulate frequency through establishing strict regulations for grid connection. Therefore, the participation of wind turbine generators (WTGs) in the FM technology of the power system has become the focus of scholars in the industry [5,6].
To ensure that the DFIG can actively participate in FM, current FM control strategies mainly focus on power backup load shedding control and frequency fast response control (FFRC) [7–10]. The load-shedding control method makes the DFIG work in load-shedding mode and thus leaves spare capacity for FM. However, prolonged periods in load-shedding mode can reduce the efficiency of wind energy utilisation. The FFRC strategy, on the other hand, actively participates in FM by modulating the rotor speed and using the rotor kinetic energy to provide active power support to simulate the inertial response of the synchronous generator (SG) [11–13]. When an active power deficit occurs in the system, and the DFIG uses the FFRC strategy to release rotor kinetic energy, the rotor speed decreases continuously. During this process, the electromagnetic power output of the DFIG deviates from the maximum power point tracking (MPPT) curve. The additional reference power of the FFRC increases the output power and encourages the DFIG to participate in the FM. The output reference power of the turbine governor decreases along the MPPT curve, generating an output power suppression amount (OPSA) and attempting to prevent the DFIG from participating in FM [14]. DFIG’s FM capability is greatly diminished by the paradoxical relationship between the two mentioned above.
To improve the FM capability of the WTG, the literature [15,16] proposed the use of a fuzzy logic controller (FLC) to change the parameters of the governor control dynamically but did not analyse and solve the OPSA. Literature [17] added time-varying gains in the inertia and droop control loops based on the frequency response time to take full advantage of the turbine’s frequency support capability, however, the second frequency drop (SFD) problem triggered by the switching speed recovery process after excessive rotor kinetic energy release is not considered. After the WTG exits FM, the rotor must absorb energy to return to the initial operating state, which may cause SFD. If left unchecked, even more severe situations than once the frequency has dropped may occur.
Literature [18] reduced SFD by designing an active power reference curve for the rotor speed recovery process of WTGs, still it prolongs the rotor speed recovery time which is not conducive to the system’s ability to counteract secondary disturbances. The combined wind-storage FM control strategy proposed in the literature [19] can avoid the SFD phenomenon, still it can only provide short-term frequency support for the system, and cannot be used throughout the primary FM process. Literature [20] proposed a continuous power scheduling scheme to efficiently coordinate the responses of different wind turbines based on the characteristics of the system’s frequency support stage and frequency recovery stage, however, some wind turbines must leave some spare capacity to operate in power-limited mode.
Aiming at the above problems, this paper proposes a new combined wind-storage FM control strategy that can improve the FM capability of DFIG and consider the solution of SFD and rotor recovery speed problems. Firstly, by analysing the generation mechanism of OPSA, quantitatively calculating the suppression amount, and designing FLC to dynamically change the parameters of FFRC to explore the FM potential of DFIG. Then, the auxiliary FM power of the energy storage (ES) is determined, according to the changing characteristics of the rotor speed during the recovery process, to avoid SFD and overshooting phenomena. Finally, the DFIG and ES control strategies are combined according to the timing logic to construct a combined control strategy throughout the FM process, which jointly improves the frequency response characteristics of the system.
2 Analysis of Frequency Response Characteristics of Power System with DFIG
The DFIG captures mechanical energy through the wind turbine, which spins the rotor and then converts the mechanical energy into electrical energy. The captured mechanical power Pm can be expressed as:
where, ρ is the air density; vw is the wind velocity; A, R, λ, β are the unit swept area, impeller radius, blade tip speed ratio, and pitch angle, respectively; Cp(λ,β) is the wind energy utilisation coefficient, which is a non-linear function consisting of λ and β.
Fig. 1 shows the relation characteristic curve of the Cp-λ-β and its expression can be described as [21]:
where, λi is the intermediate variable; ωr is the rotor speed of the DFIG.

Figure 1: Relation characteristic curve of the Cp-λ-β
Under different wind speeds, since R is a constant, the maximum wind energy capture of WTGs can be achieved only if ωr and vw are always maintained at the best ratio, that is, the optimal tip speed ratio.
The MPPT curve of DFIG can be represented by Eq. (3):
where, λopt is the optimal tip speed ratio of the wind turbine; kopt is the characteristic coefficient of the MPPT curve; CP,max is the maximum wind energy utilisation coefficient of the wind turbine, at this time β = 0°, λ = λopt.
2.2 Frequency Response Model of Power System with DFIG
The DFIG is grid-connected using a doubly-fed converter to achieve a flexible connection to the grid. Although DFIGs can deliver power to the grid, they cannot provide inertial support to the system through rotating equipment, as with conventional thermal turbines. To enhance the inertia of the power system, the flexibility of the DFIG’s control is utilised to release the rotor kinetic energy using the FFRC strategy to give it FM capability. FFRC strategy consists of virtual inertia control with a frequency rate of change as input and droop control with frequency deviation as input. The power system containing DFIG with FFRC strategy is shown in Fig. 2.
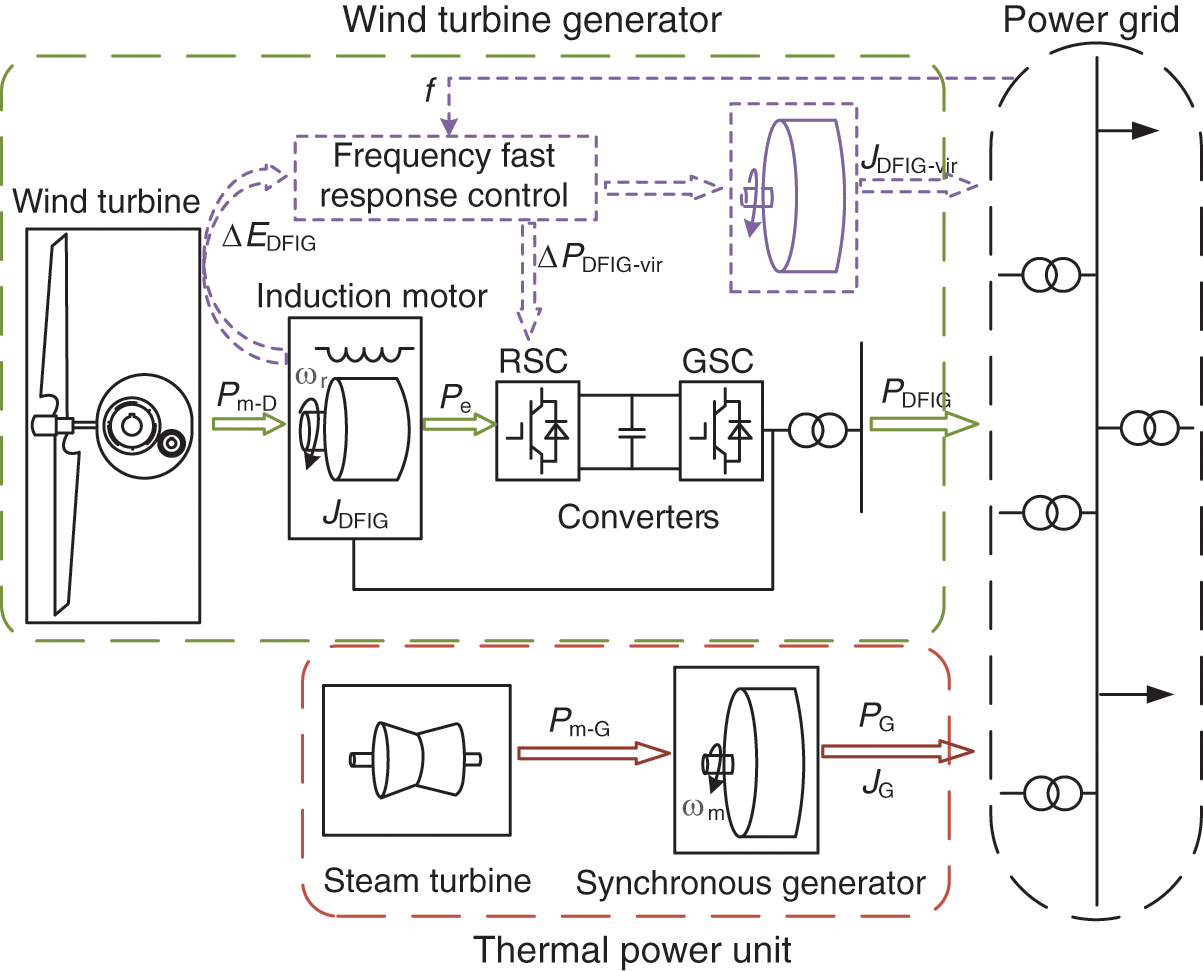
Figure 2: Power system containing DFIG with FFRC strategy
In Fig. 2, ΔEDFIG, JDFIG-vir, Pm-D, Pe, PDFIG and ΔPDFIG-vir are rotor kinetic energy variation, virtual moment of inertia, captured mechanical power, electromagnetic power, output power, and FFRC strategy additional active power of the DFIG during the inertial response, respectively. Pm-G, PG, ωm, and JG are the mechanical power, electromagnetic power, mechanical angular velocity and moment of inertia of the SG, respectively.
The frequency dynamic response equation of DFIG is shown in Eq. (4):
where, HDFIG-vir and DDFIG-vir are the virtual inertia time constant and virtual damping coefficient of the DFIG, respectively.
The simplified model of the power system with DFIG is shown in Fig. 3. The system’s generation part mainly consists of thermal units and DFIGs with FFRC strategy; the power consumption part is the load.

Figure 3: Simplified model of power system with DFIG
Where, Km is the mechanical power gain coefficient; FH is the fraction of the total power of the high-pressure turbine; TR is the turbine reheating time constant; K is the static modulation factor of the SG; HG-D and DG-D are the inertia time constant and damping constant of the system; ΔPL is the load power variation of the system; ΔPG is the output power variation of thermal power units.
The dynamic response equation of the system frequency can be expressed as:
Eq. (6) can be obtained from Eqs. (4) and (5):
The mathematical expressions for the maximum frequency rate of change (RoCoFmax) and the maximum frequency deviation (Δfmax1) of the grid-connected WTGs system with FFRC strategy after disturbance are shown below, and the specific derivation process is detailed in the literature [22,23].
where, ζ is the damping ratio; α is the coefficient resulting from the model derivation process; ωn is the natural oscillation frequency; and tnadir1 is the time at which the frequency minimum occurs.
The RoCoFmax and Δfmax1 of the power system after disturbance are essential indicators of the frequency dynamic response. From Eqs. (7) and (8), it can be seen that the RoCoFmax and Δfmax1 of the system are positively correlated with the load disturbance presentation degree. The equivalent inertia time constant and damping coefficient of the system play a vital role in the frequency dynamic response of the system under a certain load disturbance. Fig. 4 shows the curve of the system frequency at different HDFIG-vir and DDFIG-vir after the step disturbance. Kd and Kp are the virtual inertia and droop coefficients of FFRC, which are described in the next chapter. In summary, wind power participation in the system FM can be equated to increasing the system’s equivalent inertia and damping.

Figure 4: System frequency dynamic response curve (a) System frequency at different HDFIG-vir (b) System frequency at different DDFIG-vir
3 Analysis of DFIG FM Process Based on FFRC Strategy
The FFRC strategy of DFIG consists of two stages that respond to the dynamic change of frequency: the frequency support stage (A-B-C) and the rotor kinetic energy recovery stage (C-D-E-A), as shown in Figs. 5 and 6.
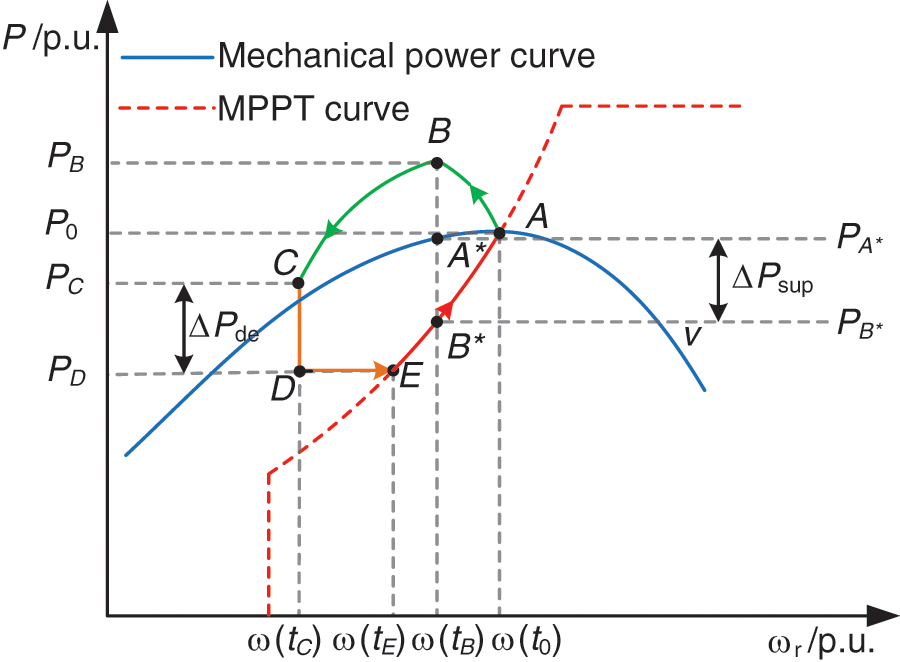
Figure 5: Power-rotor speed trajectory of FFRC strategy
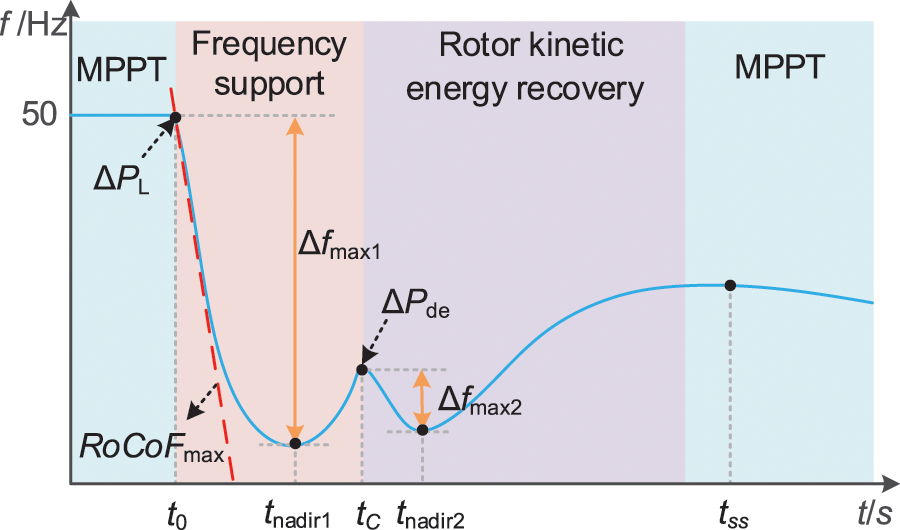
Figure 6: System frequency response curve based on FFRC
In Fig. 5, ω(t0), ω(tB), ω(tC), and ω(tE) are the rotor speed at points A, B, C, and E corresponding to the moments of t0, tB, tC, and tE, respectively. P0, PB, PC, and PD are the output power of the WTG at points A, B, C, and D, corresponding, to the moments of t0, tB, tC, and tD, respectively. PA* and PB* are the WTG’s captured power and the governor’s reference output power at the corresponding points A* and B* at the moment tB, respectively. ΔPde is the active load derating for DFIG speed recovery.
In Fig. 6, t0, tnadir1, tC, tnadir2, and tss are the moments corresponding to the system load disturbance, the lowest point of the first drop, the active power derating of the DFIG, the lowest point of the second drop, and the system restoration to the steady state, respectively. Δfmax2 is the maximum deviation of the second drop in frequency.
3.1 Analysis of Frequency Response Characteristics and OPSA in Frequency Support Stage
The frequency support stage is divided into 2 main processes, corresponding to the point A and the curve A-B-C in Fig. 5.
A: The system is steady, and the DFIG operates at point A of the MPPT curve. At this point, the DFIG wind energy utilisation is maximum, and the output power is P0.
A→B→C: FFRC strategy action when the system frequency is reduced by a disturbance or load increase. The DFIG with FFRC can simulate the SG’s inertia support and primary FM characteristics in this process, and its output electromagnetic power moves along the curve A-B-C.
As the DFIG releases rotor kinetic energy, the rotor speed decreases and the turbine captured power is shifted away from the maximum power output point A. At the same time, the outer loop power reference value Pref of the rotor-side inverter is changed.
The reference power input to the rotor side inverter is expressed as:
where, Kd and Kp are the virtual inertia and droop coefficients of FFRC, respectively.
When the electromagnetic power of the DFIG in Fig. 5 runs along the curve A-B-C to point B, meaning that the rotor speed decreases from ω(t0) to ω(tB), the captured power of the WTG moves from point A along the mechanical power curve to point A* at constant wind speed. The corresponding capture power variation ΔPcap is expressed as:
where, λA and λA* are the tip speed ratios corresponding to points A and A* under the wind speed vw, respectively; CP(λA,β) and CP(λA*,β) are the corresponding wind energy utilisation coefficients of A and A* points, respectively.
The DFIG’s governor impedes the active FM of the WTG, and the rotor speed controller output reference power deviates from the original maximum power tracking point, which is a drop from point A in Fig. 5 along the MPPT curve to point B*. The difference ΔPsup between the captured power PA* and the reference power PB* of the DFIG can be expressed as:
At a steady wind speed with a small range of rotor speed variation, the captured power at points A* and B* is approximately equal, i.e., ΔPcap ≈ 0. Eq. (13) can be simplified as:
At this point, the reference power of the control power outer loop of the rotor side inverter can be expressed as:
From Eqs. (14) and (15), the DFIG responds to the frequency change by releasing rotor kinetic energy and simultaneously inputs additional power to the system. The reference output power of the DFIG governor gradually deviates from the set value with a cubic exponential function. It reduces the rotor-side inverter power reference value and inhibits the FM capability of the DFIG. Because ΔPsup acts as a suppressor of Pref, ΔPsup is called OPSA.
3.2 Analysis of Rotor Speed Recovery Characteristics and SFD in Kinetic Energy Recovery Stage
When the frequency support stage is over, if the rotor speed is not restored and the rotor kinetic energy is not lifted in time, it will not only cause the DFIG to deviate from the optimal power point, thus reducing the efficiency of wind energy utilisation, but may even lead to the rotor stalling, resulting in the DFIG going off-grid and severe system frequency fluctuations.
This paper’s judgement condition for entering the speed recovery stage is set as dωr/dt > 0 or ωr ≤ 0.67 p.u.
The rotor kinetic energy recovery stage is mainly divided into 2 processes, corresponding to the curves C-D-E and E-A in Fig. 5:
C→D→E: The DFIG exits FM when the electromagnetic output power from the DFIG is running to point C. The rotor speed recovery is accelerated by reducing the electromagnetic power to point D and maintaining constant power operation to point E.
E→A: When the rotor speed is accelerated to point E at constant output power, it recovers to point A along the MPPT curve.
After the DFIG exits the FM, only the SG participates in the primary FM, and at this time, the wind turbine has to absorb energy from the grid, which exacerbates the system power imbalance. The unbalanced power ΔPU(tC) in the system is:
where, PL0 is the initial value of load.
At this time, the rotor equation of motion for a synchronous unit can be expressed as:
By substituting Eq. (18) into Eq. (17), the frequency variation of the rotor speed recovery stage can be obtained as:
where, f ′ and f ″ are the first and second derivatives of the system frequency, respectively; f(tC) is the system frequency at tC.
By substituting Eq. (20) into Eq. (19), the time-domain expression of system frequency during speed recovery is:
where, the intermediate variables θ, γ and ω2 are expressed as [24]:
By further derivation of Eq. (22), the maximum deviation of the frequency second drop Δfmax2 is expressed as:
As shown in Eq. (23), the severity of SFD is affected by tC and ΔPU(tC). ΔPU(tC) is closely related to ΔPde. Therefore, the starting rotor speed recovery strategy should be reasonably selected at the starting moment and the size of the derating power.
3.3 Combined Wind-Storage FM Control Strategy for Improving System Frequency Response Characteristics
Currently, many scholars have improved the FFRC strategy of DFIG. They improved the frequency response characteristics of the WTG when it is involved in FM, but none of them analysed and solved the OPSA generated when DFIG applies the FFRC strategy. In addition, few studies have combined the improvement of the SFD phenomenon in the rotor kinetic energy recovery process with the enhancement of rotor speed recovery performance. In this paper, we first propose using FLC to weaken the OPSA in the frequency support stage. Then, an ES output power control strategy coupled with the rotor speed is proposed to further compensate for the power deficit generated during the speed recovery stage of the DFIG, thus eliminating the SFD phenomenon. Finally, the control strategy flow of the combined wind and storage FM is proposed based on the timing logic of the DFIG and the ES system cooperating at different stages in the frequency response process.
3.4 DFIG FFRC Strategy Combined with Fuzzy Prediction
The analysis in Chapter 3 shows that the FFRC strategy of the DFIG provides inertia to the system and performs primary FM through rotor kinetic energy release, whereas the OPSA generated during the rotor speed reduction weakens the effect of the control to a certain extent. In this section, a variable coefficient FFRC based on fuzzy logic optimisation is proposed by improving on the conventional FFRC. The structural block diagram of the control strategy proposed in this paper is shown in Fig. 7.
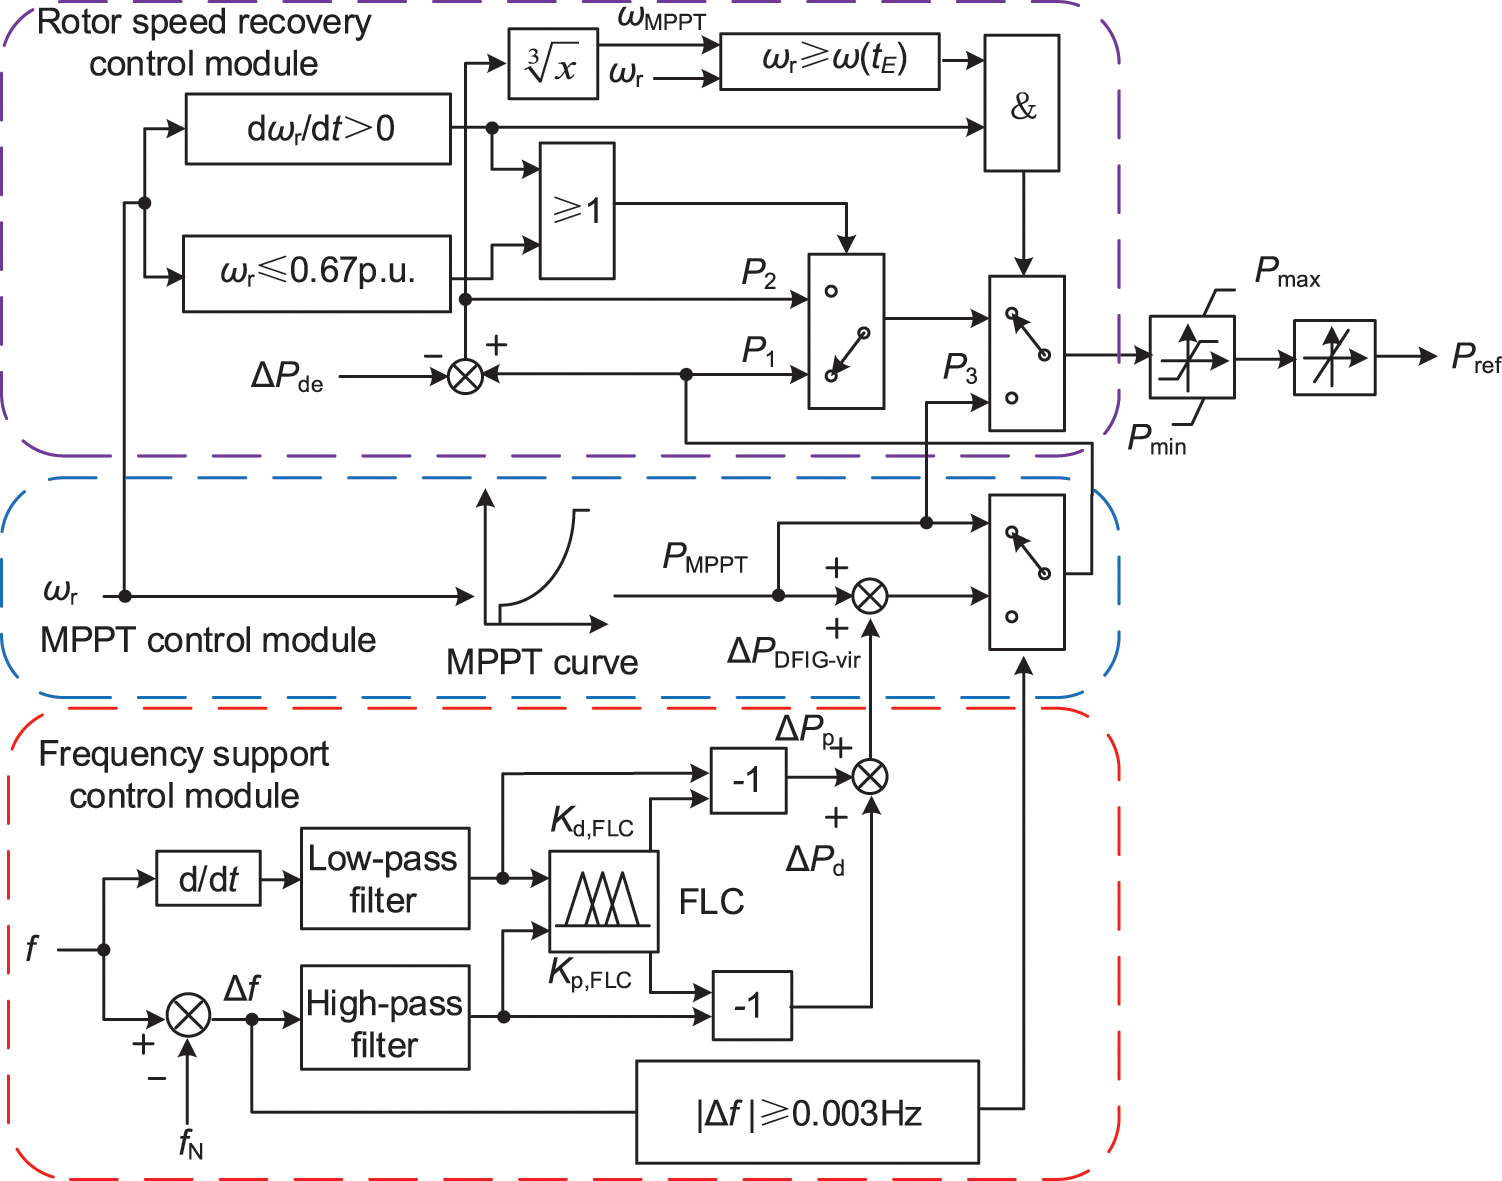
Figure 7: Control diagram of variable coefficient FFRC strategy
In Fig. 7, ωMPPT and PMPPT are the rotor speed and output power of DFIG in MPPT mode, respectively; Kd,FLC, Kp,FLC and ΔPd, ΔPp are the control parameters and the incremental electromagnetic power of the response frequency rate of change, frequency deviation when the DFIG is involved in FM, respectively; P1, P2 and P3 correspond to the reference power of the DFIG in the curves A-B-C, D-E and E-A of Fig. 5, respectively; f, fN and Δf are the actual frequency, rated frequency, and frequency deviation of the system, respectively; Pmax and Pmin are the maximum and minimum limits of DFIG output power, respectively; Pref is the active reference value output to the control side of the DFIG converter.
In this paper, we perform fuzzy inference on the virtual inertia coefficient (Kd) and droop coefficient (Kp) of the FFRC. The FLC constructed in this paper takes the system frequency change rate (df/dt) and the system frequency deviation (Δf) as inputs, and adjusts the coefficients of the FFRC in real-time according to the detected frequency changes. The input quantities of df/dt take values in the range of −0.1~0.1 Hz/s, and Δf takes values in the range of −0.3~0 Hz. The range of values of df/dt is divided into seven fuzzy intervals {NH, NC, NT, NP, PT, PC, PH} (Letters indicate fuzzy intervals, which will not be discussed in this paper), and the range of values of Δf is divided into seven fuzzy intervals {ET, CT, T, C, H, CH, EH}. The divided intervals of df/dt and Δf together determine the frequency state of the system. The value of Kd in the output ranges is 0~0.8, and the value of Kp ranges is −0.8~0.8. The range of Kd is divided into seven fuzzy intervals {ET, CT, T, C, H, CH, EH}, and the range of Kp is divided into seven fuzzy intervals {NH, NC, NT, NP, PT, PC, PH}. Real-time variation of FFRC coefficients achieved by interval division of Kd and KP. FLC is calculated using the trimf affiliation function with Mamdani fuzzy system inference.
The fuzzy rule designed according to the frequency response process when the system load increases is: At the beginning of the system frequency drop, df/dt is significant, and Δf changes from small to large. In this case, a larger Kd should be output to reduce the df/dt, and a smaller Kp should be output to avoid excessive release of rotor kinetic energy at the beginning of the frequency drop, which would cause the rotor speed to drop too quickly and produce a large OPSA. As the frequency drop gradually approaches its nadir, df/dt is small, and Δf is large. At this point, the FLC should output smaller Kd and larger Kp to raise the frequency nadir. When the frequency recovers, df/dt becomes positive and Δf gradually decreases. At this time, the WTG can appropriately reduce the active power output to promote the rotor speed recovery. The table of fuzzy logic rules and the figure of the FLC affiliation function are shown in Tables 1, 2 and Fig. 8.


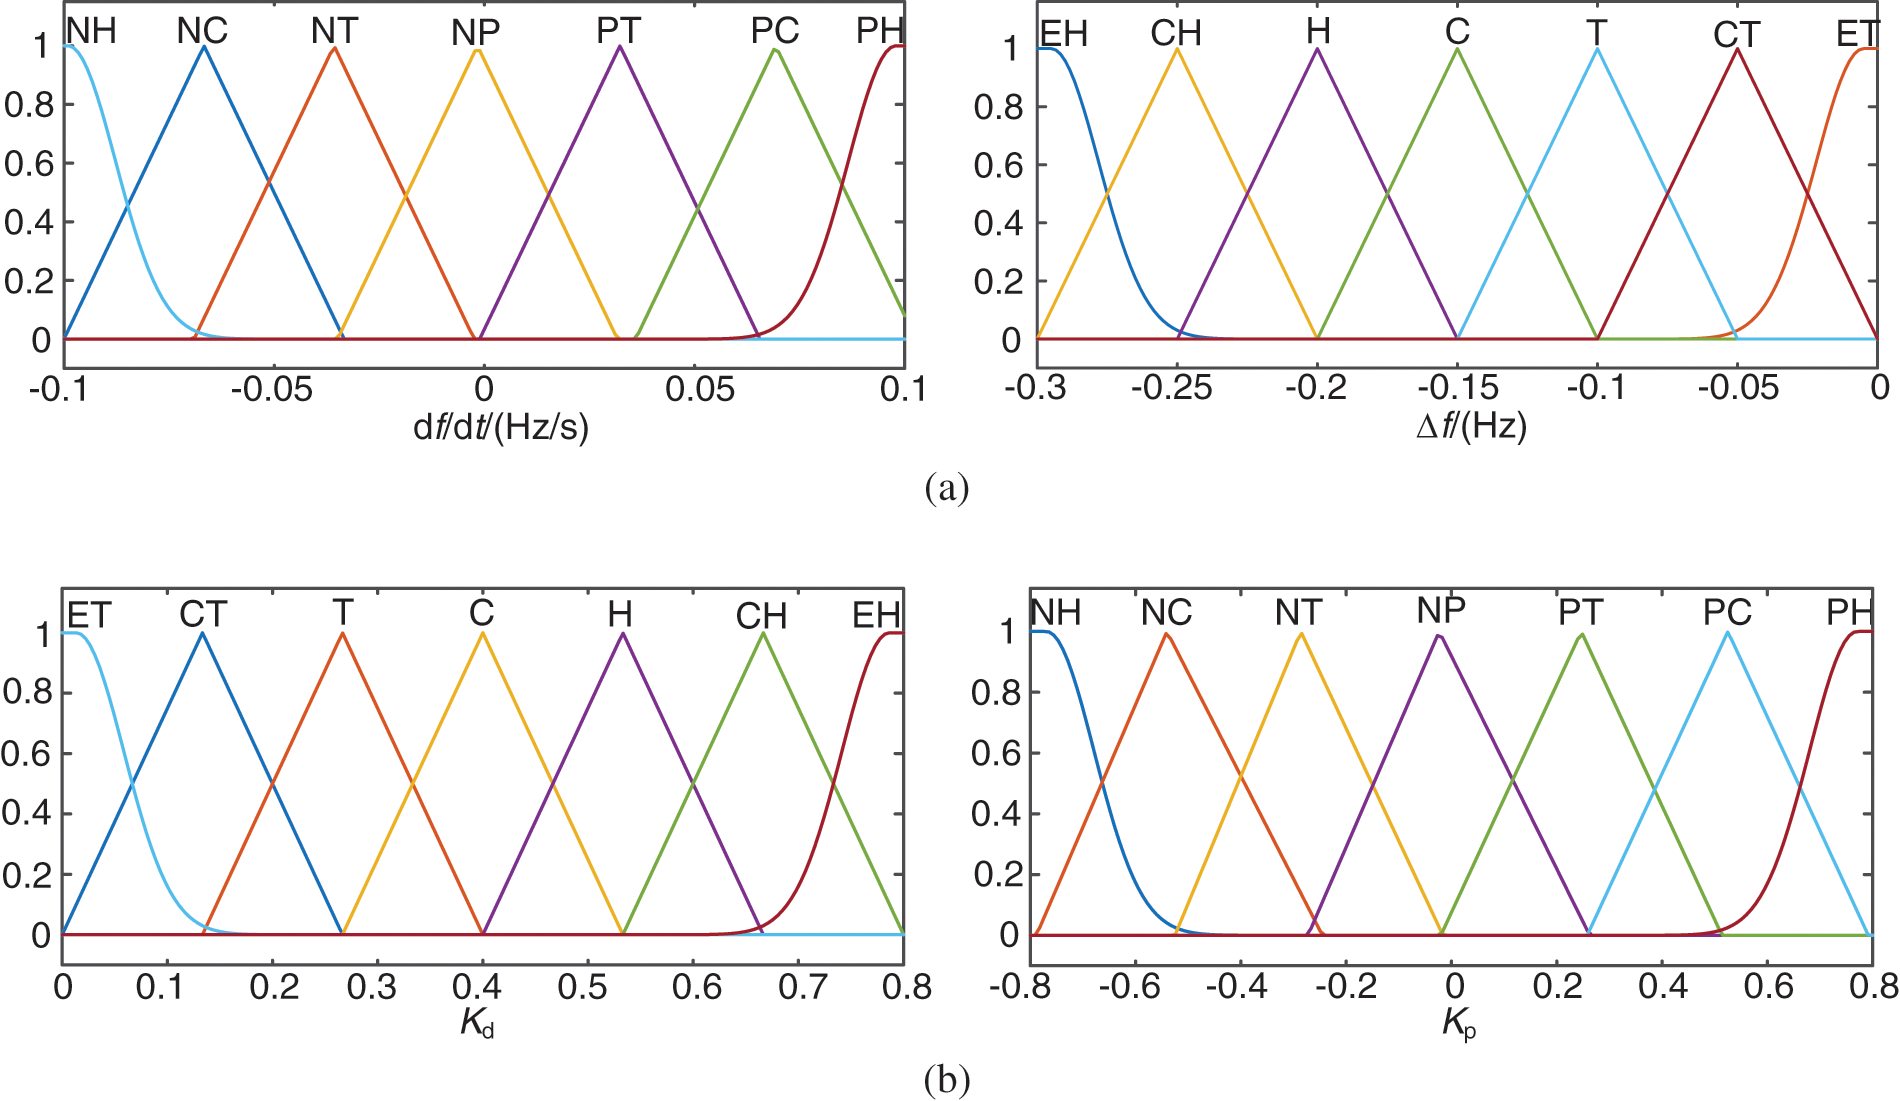
Figure 8: Affiliation function of FLC. (a) Input affiliation function of FLC. (b) Output affiliation function of FLC
The output Kd,FLC and Kp,FLC results after editing according to the rules of Tables 1 and 2 are shown in Fig. 9.

Figure 9: Three-dimensional diagram of FLC variable FFRC coefficient. (a) FLC output of Kd,FLC. (b) FLC output of Kp,FLC
When the system load increases, the system frequency fluctuates, and the FFRC strategy of DFIG proposed in this paper starts to respond, the reference value of the outer-loop power of the rotor-side inverter at point B shown in Fig. 5 becomes:
Fig. 9 shows that Kd,FLC tends to decrease gradually and Kp,FLC tends to increase and then decrease. Combined with Eq. (24), it can be seen that the rotor speed decreases less, and ΔPsup is small in the pre-inertial support. At this time, the larger Kd,FLC can effectively solve the problem of the large df/dt. In the middle and late periods of inertia support, the rotor speed changes greatly, and the output power is strongly inhibited. In this case, a large Kp,FLC multiplied by a large Δf to increase the additional power can eliminate the suppression effect and thus raise the frequency nadir. During speed recovery, Kd,FLC gradually decreases to zero, and Kp,FLC gradually decreases to a negative value. At this time, the rotor absorbs energy from the grid, speeding up the rotor speed recovery.
3.5 ES Output Power Control Strategy Coupled with Rotor Speed
Chapter 3 analyses that when the DFIG with conventional FFRC strategy enters the rotor kinetic energy recovery stage, it no longer provides power to the system and absorbs energy from the grid. This causes an active power imbalance in the system, which leads to the SFD phenomenon. ES has a fast and flexible power control capability, which can eliminate the SFD phenomenon through storage-assisted FM and enable the rotor speed to be quickly recovered to the initial state. An ES output power control strategy coupled with the rotor speed, as shown in Fig. 10, is proposed to enable the ES to make instantaneous power adjustments.

Figure 10: Control diagram of ES output power control strategy
The active power output from the ES system is zero when the system is in a steady state. When the system is perturbed and the speed of the DFIG decreases and is greater than the minimum speed, the DFIG can respond to the frequency change by releasing rotor kinetic energy. At this time, the active power output of the ES system remains at zero value. At the end of the measured DFIG frequency support stage, the rotor speed begins to recover (dωr/dt > 0). or when the rotor speed is lower than the minimum speed (ωr ≤ 0.67 p.u.), the DFIG starts deriving power to recover the rotor kinetic energy. At this point, the ES switches to the power output mode to compensate for the unbalanced power due to the power deficit of the DFIG and to reduce the amplitude of the SFD. Its output power PE1 is:
where, PC and PD are the electromagnetic power at points C and D in Fig. 5, respectively.
If the active power from storage is less than the actual active power deficit of the system, it is ineffective in improving the SFD; on the contrary, if the active power from storage is too large, it may lead to frequency overshooting. To let the ES reasonably output FM power, when the measured DFIG speed reaches point E in Fig. 5 and is recovered along the MPPT curve, the power output from the ES decreases smoothly with the increase of the rotor speed. The variable power PEva of the ES output power in this process is:
where, ωr, ω(tE), ω(t0) are the actual rotor speed of the DFIG and the rotor speeds at points E and A in Fig. 5, respectively; KE is the ES power modulation factor.
The difference between the actual power PEmeas of the ES feedback and the output power reference PEref in Fig. 10 is outputted by the PI controller. The PI control loop is used as an auxiliary control, and the output result ΔPE superimposed on the PEva can slow down the magnitude of the stored power reduction. This allows the ES system to exit FM slowly, reducing power fluctuations to ensure smooth frequency recovery.
In summary, during the whole DFIG rotor speed recovery stage, the reference value of ES output power PEref is:
where, ΔPE is the output power of the PI control loop; ω(tC) is the rotor speed of DFIG at point C in Fig. 5.
When the DFIG rotor speed returns to the initial value, ωr = ω(t0), the ES smoothes out the FM, and slower responding synchronous units take over from storage for subsequent power support.
3.6 Flow of the Combined Wind-Storage FM Control Strategy
The coordination between DFIG and ES can not only fully use the rotor kinetic energy to improve the frequency response process of the primary FM but also effectively solve the SFD problem and accelerate the rotor speed back to the value before the disturbance. The flow of the control strategy containing the wind-storage system is shown in Fig. 11.
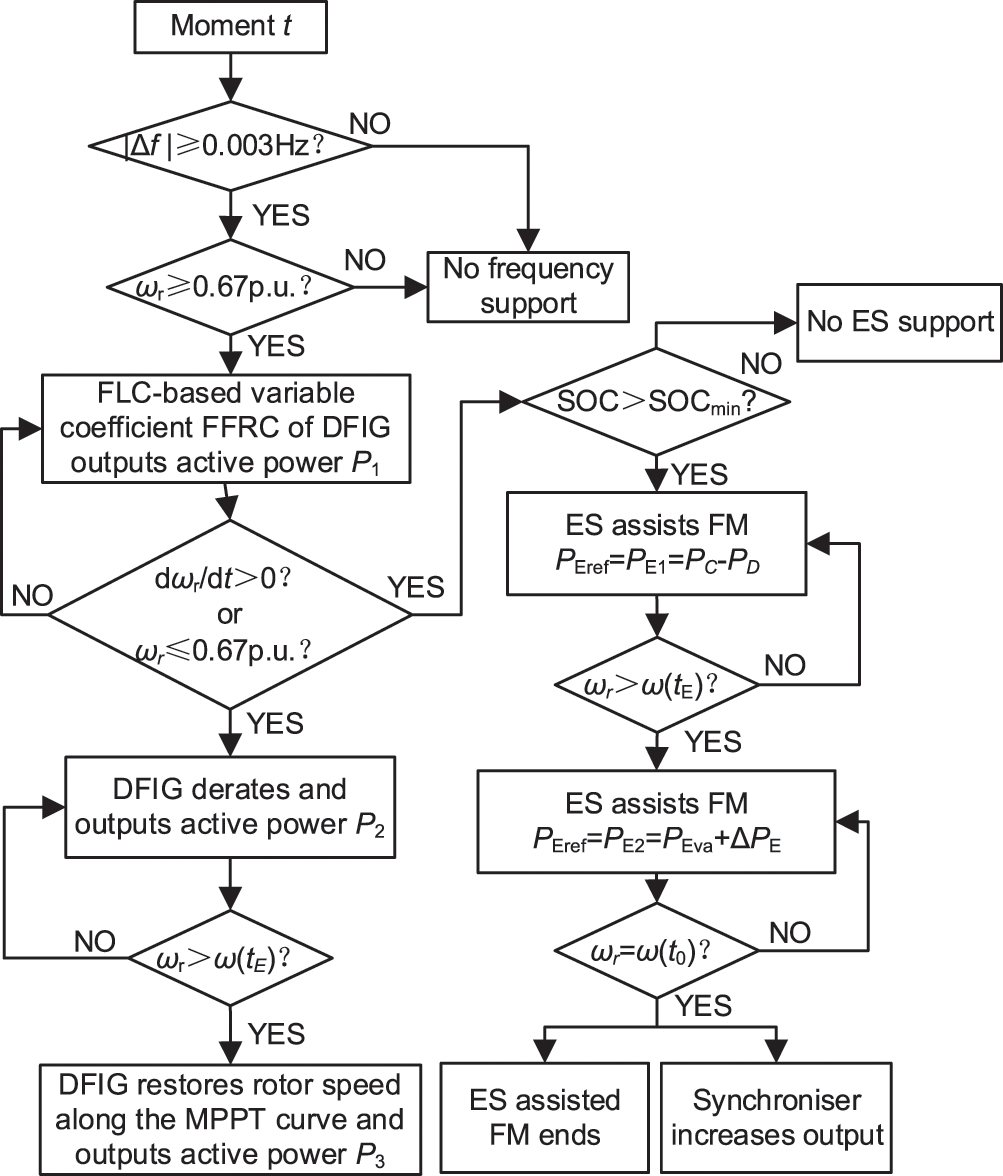
Figure 11: Flow chart of coordinated control strategy for the DFIG and ES to provide FM
The system operates steadily, and the DFIG operates at the maximum power output point. When the load changes and the system frequency fluctuation is detected beyond the dead zone and the DFIG rotor speed is not lower than the minimum speed of 0.67 p.u., the FLC outputs the appropriate coefficients of FFRC to increment the output power of DFIG and releases the rotor kinetic energy according to df/dt and Δf of the system frequency. The DFIG derates active power when it detects that the speed is beginning to recover or when the rotor speed is below 0.67 p.u. At the same time, it is determined whether the storage state of charge (SOC) is above the minimum limit. If the SOC exceeds the minimum value, the storage assists FM and provides power support to the system according to Eq. (25).
When the DFIG rotor speed rises to ω(tE) in Fig. 5, it starts to recover to the initial value along the MPPT curve. The DFIG’s output power constantly rises at this stage according to the MPPT curve’s tendency. According to Eq. (26), the ES reduces the output power until it exits the FM to minimise the system’s overshooting phenomenon.
To verify the effectiveness of the wind-storage combined FM control strategy proposed in this paper, this chapter takes the IEEE 39-bus test system as an example and conducts real-time digital simulation verification based on the RTLAB OP5707 simulation platform. The RTLAB OP5707 simulation platform is shown in Fig. 12.

Figure 12: Real-time digital simulation platform
The system consists of 10 SGs (G01–G10), 2 aggregated wind farms (W01, W02) and 2 ES systems (E01, E02). The nominal parameters of each power generation equipment are shown in Table 3. The specific parameters of the DFIG and SG are shown in Table 4.


Initial conditions are balanced between load and generation. The system frequency is 50 Hz, the WTGs are running at maximum power tracking, the wind speed is set to a constant 8 m/s, and there is no wind abandonment. The penetration rate of WTGs is 10%, and the proportion of wind power is 9.13%. After 35 s of stable operation, the load of bus 16 step increases by 300 MW.
3.8 Simulation Analysis 1: Analysis of the Influence of OPSA on Primary FM
The changes in system frequency, the reference power, the actual power and the rotor speed of DFIG are analysed under DFIG without participating in FM (Case1), with additional conventional FFRC strategy (Case2), and with additional FFRC strategy combined with fuzzy prediction (Case3) proposed in this paper. To visualise the effect of ΔPsup, no active power derating of the DFIG is performed when the rotor speed is recovered, and the rotor speed is only slowly recovered through the wind turbine’s intrinsic governor.
From Fig. 13a combined with Table 5 (Table 5 is at the end of this chapter), it can be seen that the use of FFRC strategy combined with fuzzy prediction proposed in this paper can enhance the system’s perturbation resistance and improve the frequency response characteristics of the DFIG. This can be illustrated by Fig. 13b: the governor reference power decreases with time when the FFRC strategy is used, and the OPSA becomes larger. In the 36th s, the additional reference power starts to decrease continuously, which causes the DFIG output power to drop too fast, greatly weakening the FM ability of the DFIG. The use of fuzzy logic control can enhance the DFIG additional reference power as the governor reference power of the WTG decreases towards its minimum value. This reduces the weakening effect of OPSA on the FM capability of DFIG and improves the DFIG primary FM effect. In Fig. 13c, the DFIG of Case3 eliminates the impact of OPSA and outputs the most energy to the grid in participating in FM, further proving the effectiveness of the improved FFRC proposed in this paper.
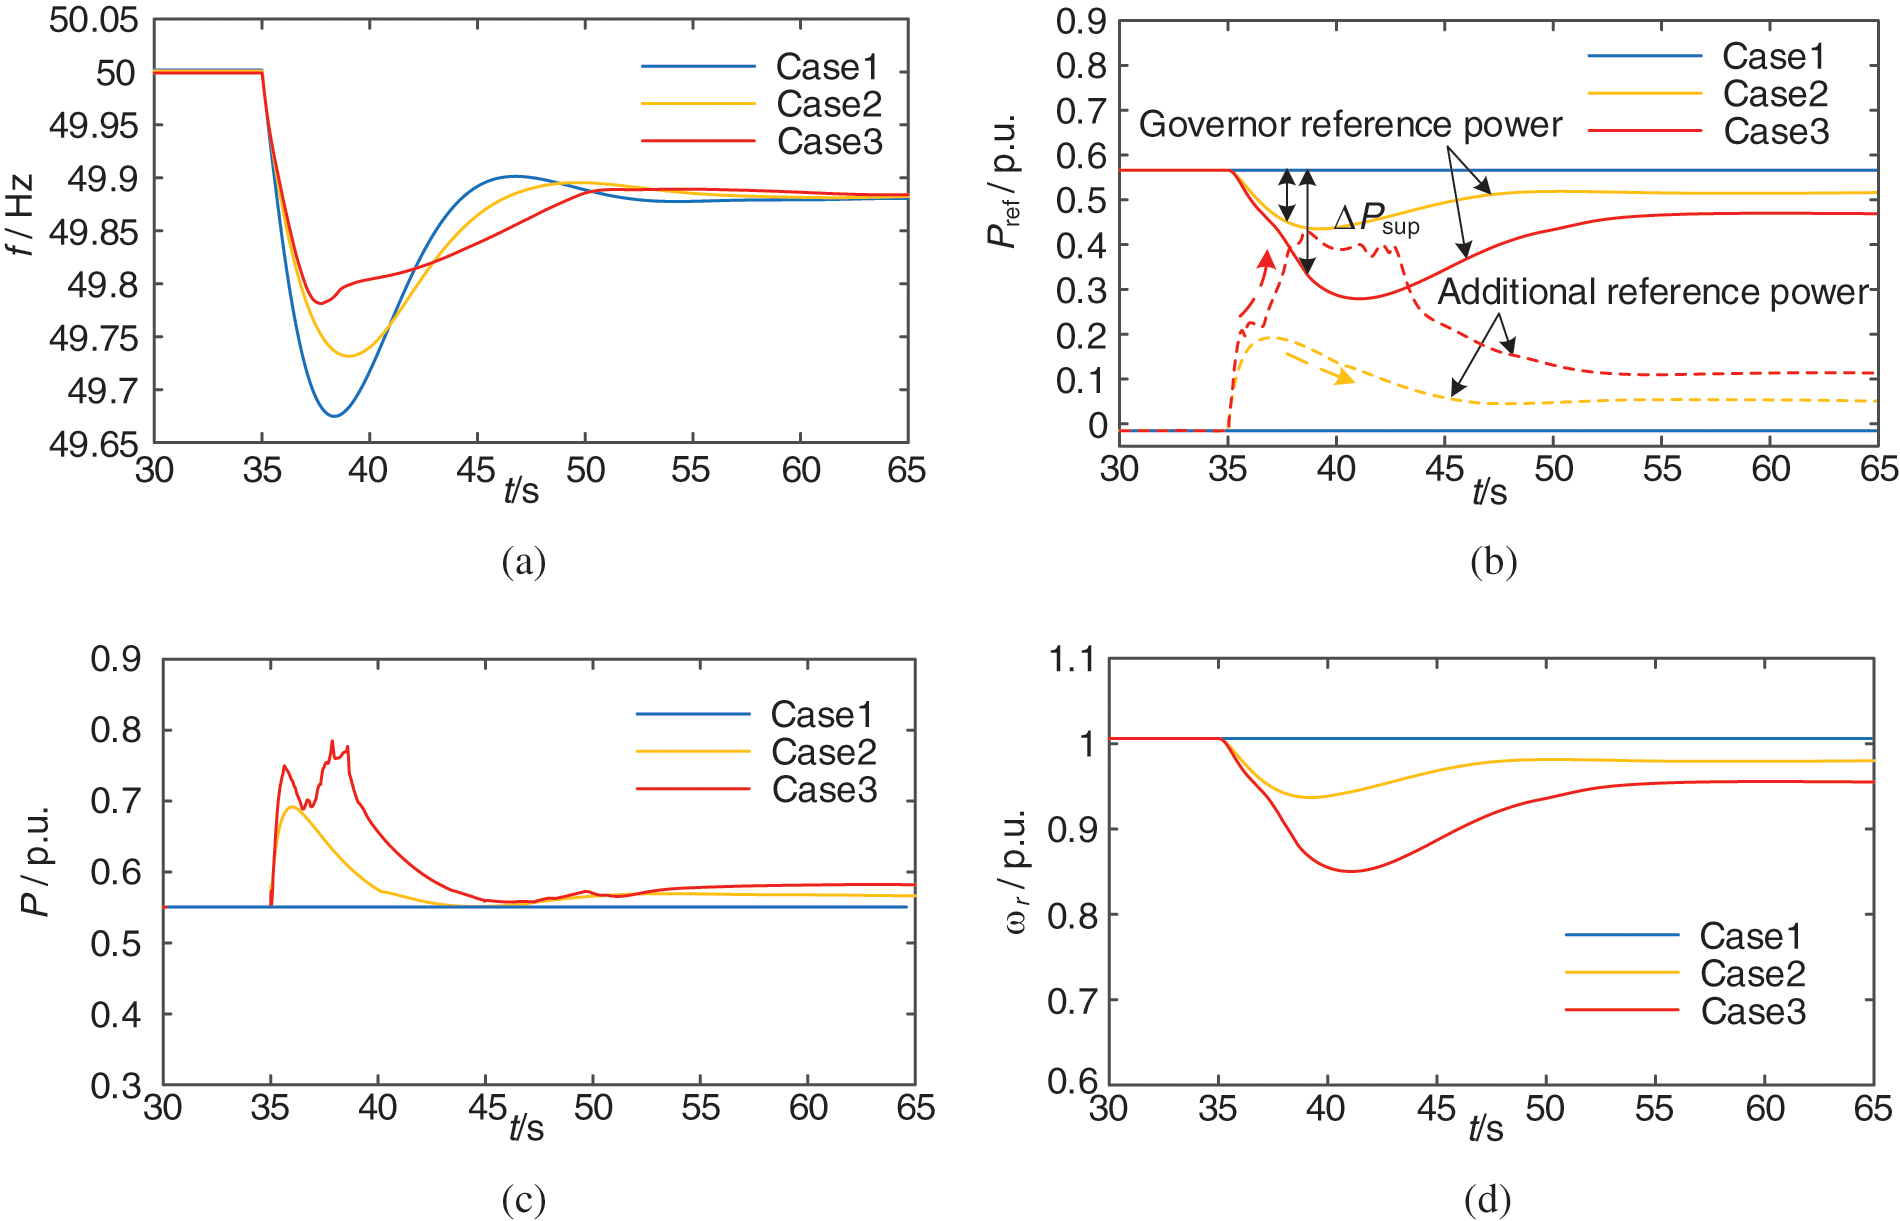
Figure 13: Simulation results of system (1). (a) System frequency. (b) Reference power of DFIG. (c) Actual output power of DFIG. (d) Rotor speed of DFIG

According to Fig. 13d and Table 5, it can be seen that the rotor speed recovery time (Δtω) of Case3 is longer, because the rotor speed of Case3 drops more. But the rate of recovery is the fastest. This is because, during the frequency recovery stage, the FLC output Kd,FLC gradually decreases to 0 and Kp,FLC gradually decreases to a negative value, which promotes the recovery of the rotation speed. It is worth noting that because no active power derating is performed on DFIG, Δtω of Case2 and Case3 is too long and cannot return to the initial value, which is not conducive to the system’s dealing with secondary disturbances.
3.9 Simulation Analysis 2: Analysis of the Effect of Different Active Power Derating on SFD
When the rotor speed is recovered, the changes in system frequency, output power, and DFIG rotor speed are analysed under different ΔPde for DFIG with the FFRC strategy. In turn, the effect curves of |Δfmax1| and Δtω under different ΔPde are plotted. It is worth noting that in Fig. 14a–c, the dark blue line is the simulation result curve of DFIG not participating in FM. Therefore, ΔPde = 0.
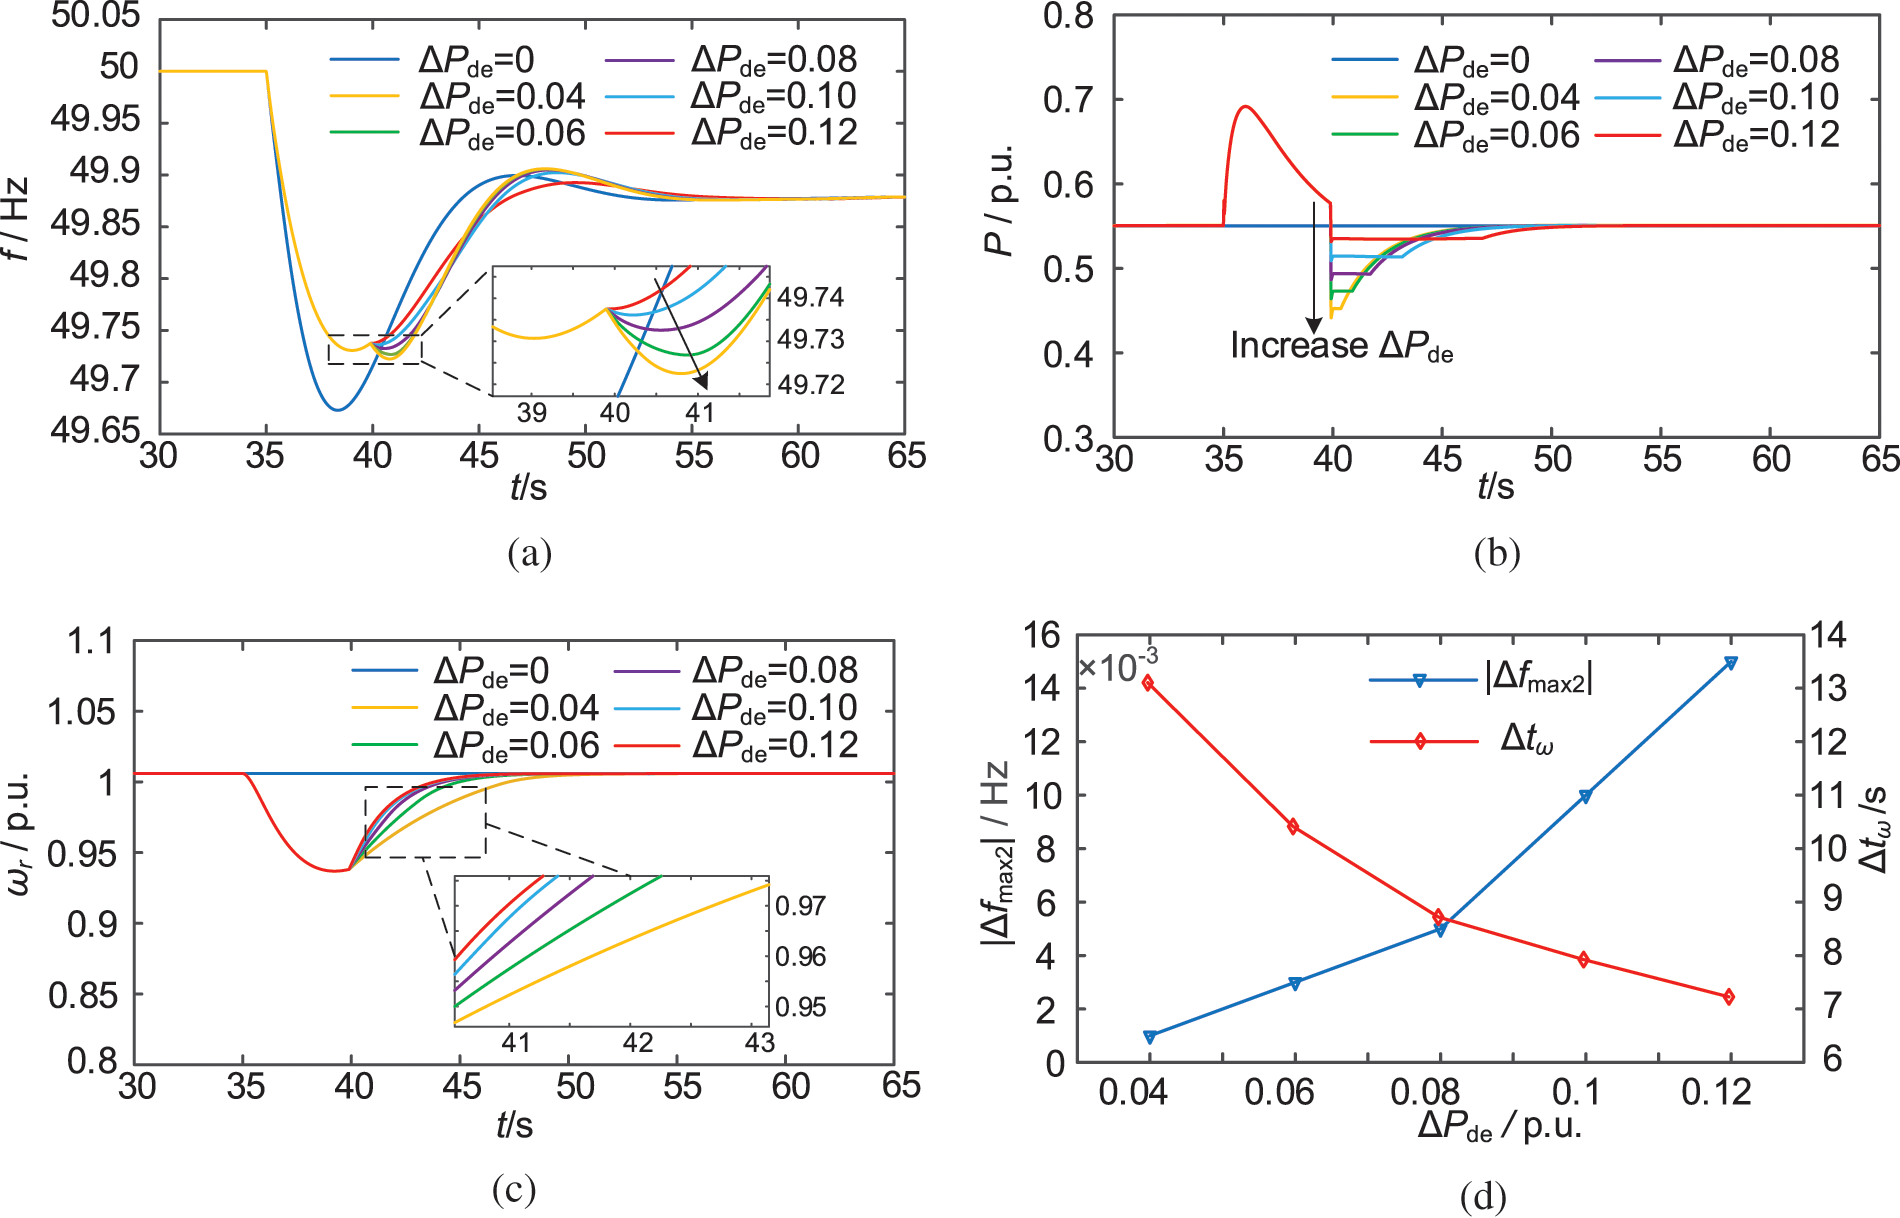
Figure 14: Simulation results of system (2). (a) System frequency. (b) Actual output power of DFIG. (c) Rotor speed of DFIG. (d) |Δfmax1| and Δtω under different ΔPde
From Fig. 14 and Table 5, it can be seen that with the increase of ΔPde, the degree of SFD increases, the speed of rotor recovery is accelerated, and the time for the frequency to reach a steady state (Δtss) is prolonged. A smaller ΔPde results in a longer Δtω, which is not favourable for the DFIG to participate in the next FM in time. When ΔPde takes a larger value of 0.12 p.u., the system takes 22.69 s to return to a steady state, and the second drop in the system frequency is already lower than the lowest value of the primary drop. Therefore, considering the rotor recovery speed, second frequency deviation, and other factors, the active power derating is set to 0.08 p.u. for the simulation conditions in this paper.
3.10 Simulation Analysis 3: Analysis of the Simulation Effect of Combined Wind-Storage FM
The changes in system frequency, the output power and the rotor speed of the DFIG, and the output power of ES are analysed under DFIG without participating in FM (Case*1), with additional FFRC strategy (Case*2), and with the adoption of the combined wind-storage FM control strategy (Case*3) proposed in this paper. It should be noted that ΔPde is set to 0.08 p.u. for Case*2 in this section. To induce faster speed recovery, the ΔPde of Case*3 is set to 0.12 p.u., increasing the difference between the mechanical and electromagnetic power of the DFIG. In Fig. 15d, the green dotted line is the SOC curve of ES.
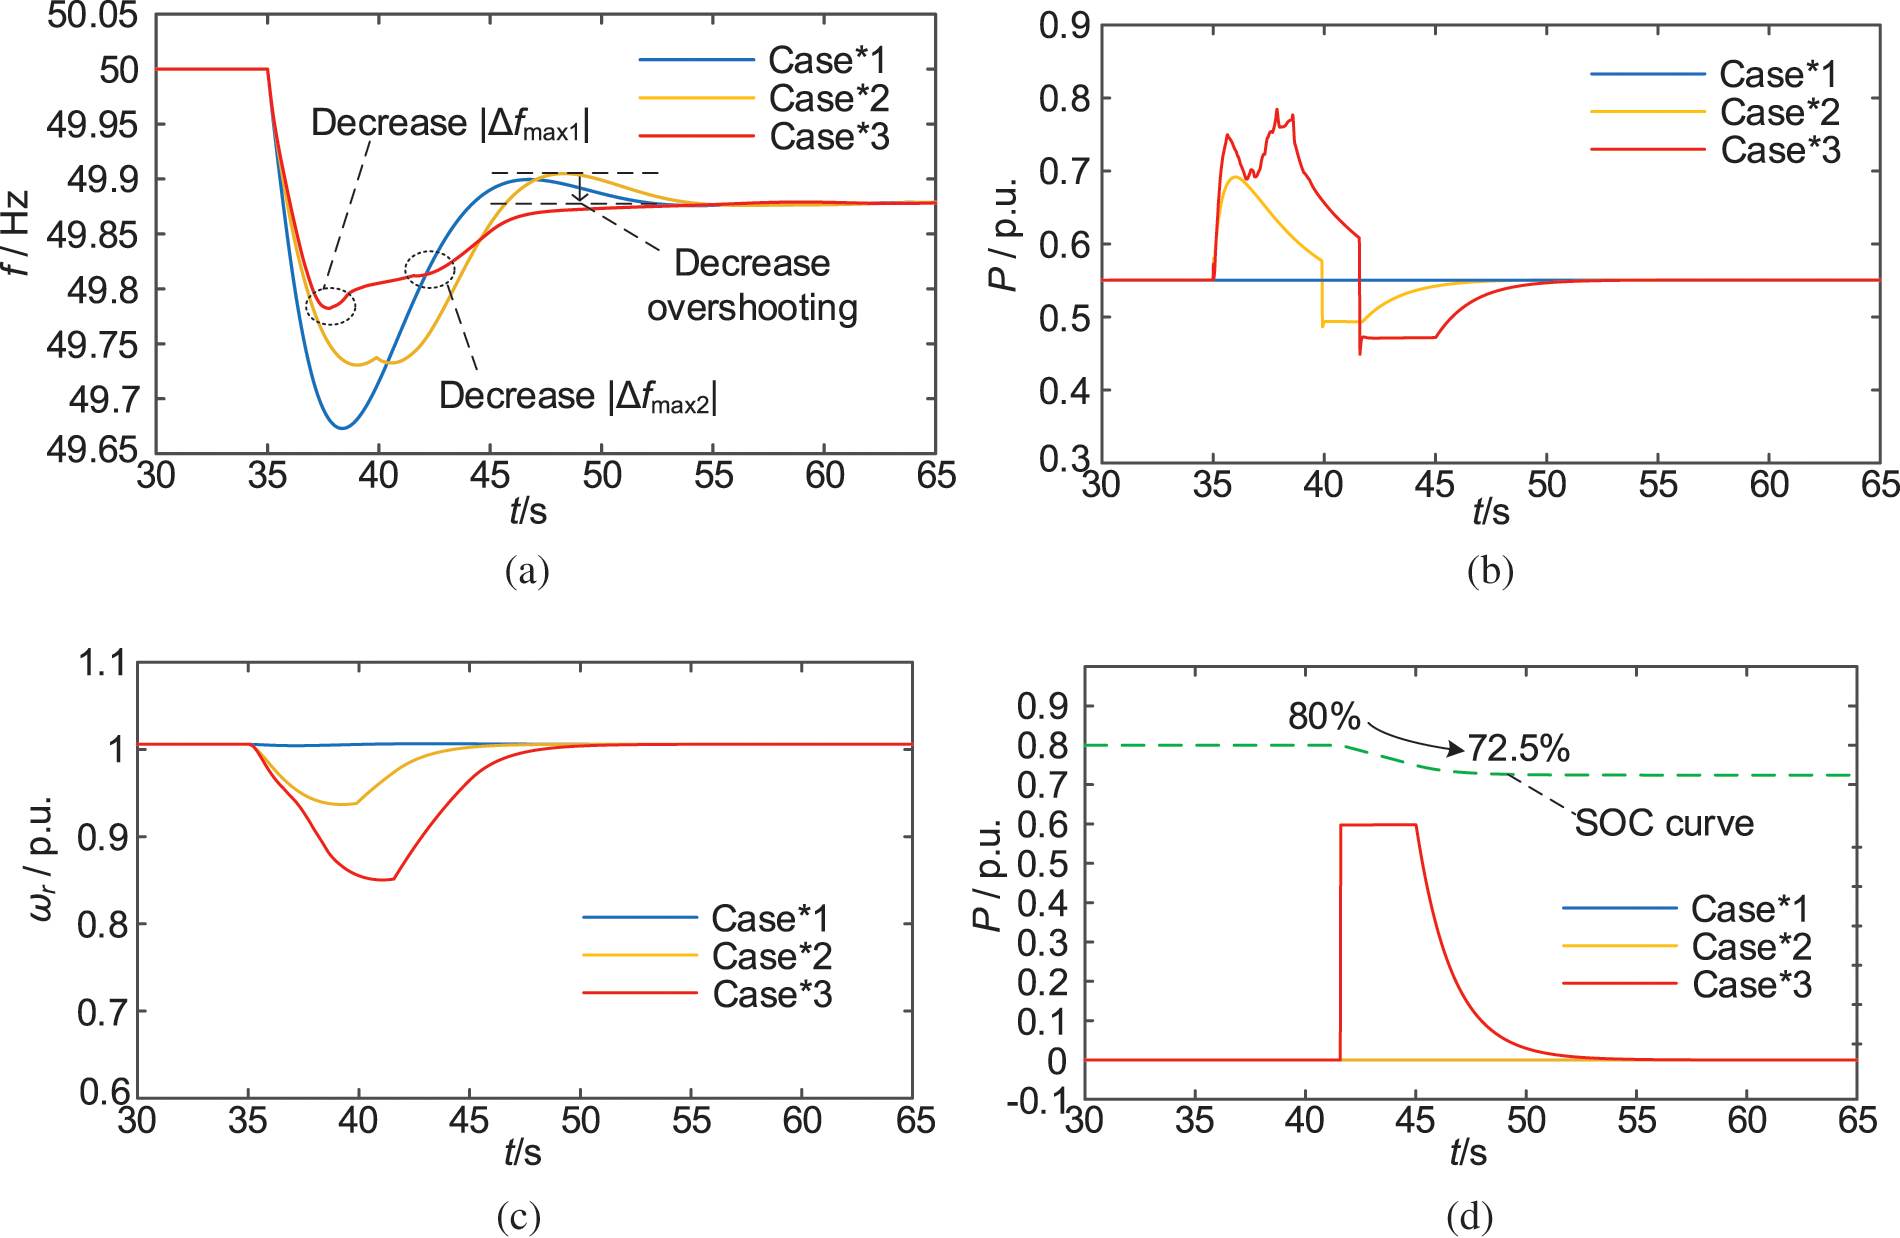
Figure 15: Simulation results of system (3). (a) System frequency. (b) Output power of DFIG. (c) Rotor speed of DFIG. (d) Output power of ES
Fig. 15, combined with Table 5, shows that using the wind-storage combined FM control strategy proposed in this paper improves the frequency nadir of the system after disturbance by 0.05 Hz compared to the conventional FFRC strategy of DFIG. This is because it eliminates the output power suppression problem of conventional FFRC and enhances the FM capability of DFIG. At the same time, it also weakens the SFD under the premise of ensuring rapid rotor speed recovery. It avoids the overshooting phenomenon by adjusting the output power of ES, so that the system frequency returns to the steady state 5.98 s earlier.
To further verify the superiority of the control strategy proposed in this paper, the FM performance of the proposed control method is tested in complex wind conditions with a simulation time of 100 s.
Under complex wind conditions, the output power of the wind farm has strong volatility. The system frequency fluctuation range is within ±0.1 Hz, which meets the requirement of safe and stable operation of system frequency. When t = 35 s, the load fluctuation causes the frequency drop event. When the DFIG does not participate in FM, the system frequency deteriorates rapidly, which poses a threat to the safe and stable operation of the system. It can be seen from Fig. 16 that although the lowest frequency of the system is improved under FFRC, the effect is not obvious. When the method proposed in this paper is used for FM, it has the best FM effect under complex wind conditions, effectively reduces the degree of frequency drop, and verifies that the method has strong robustness.

Figure 16: System simulation results under complex wind conditions. (a) Wind speed. (b) System frequency
To solve the OPSA problem of DFIG when adopting a conventional FFRC strategy and the SFD problem during the rotor speed recovery, this paper first analyses the frequency response characteristics of the system when DFIG participates in FM to reveal the reason for the generation of OPSA, and proposes a variable parameter FFRC using fuzzy logic optimisation; Secondly, the influencing factors of SFD are analysed and an ES output power control strategy coupled with rotor speed is proposed; Finally, a combined wind-storage FM control strategy is established. The following main conclusions were drawn from the study:
(1) During the frequency support stage, the DFIG deviates from the point of maximum power operation, and the reference output power of the governor decreases in a cubic exponential with the rotor speed. Suppressing the output power of the WTG. The proposed variable parameter FFRC can increase the additional power and thus counteract the suppression effect while the power suppression becomes larger.
(2) During the rotor speed recovery stage, the active power derating of the DFIG causes an active power imbalance in the system, leading to the SFD phenomenon. The proposed ES-assisted FM control strategy can adjust the output power in real-time according to the variation of the rotor speed of the DFIG. It makes up for the active power deficit of the system while not releasing active power excessively, avoiding the SFD and reducing the overshooting phenomenon.
(3) The proposed combined wind-storage FM control strategy integrates the proposed DFIG variable-parameter FFRC and ES control strategies in this paper. It enhances DFIG’s FM capability and considers the SFD and rotor speed recovery performance problems.
Acknowledgement: None.
Funding Statement: This research was funded by Jilin Province Science and Technology Development Plan Projects (20230508157RC) and the National Natural Science Foundation of China (U2066208).
Author Contributions: Conceptualization, Writing—review & editing, Supervision, Funding acquisition: Weiru Wang; Writing, Original draft, Conceptualization, Methodology: Yulong Cao; Data curation, Visualization: Yanxu Wang; Investigation, Formal analysis: Jiale You, Guangnan Zhang and Yu Xiao. All authors reviewed the results and approved the final version of the manuscript.
Availability of Data and Materials: The data that support the findings of this study are available from the corresponding author, Yulong Cao, upon reasonable request.
Ethics Approval: Not applicable.
Conflicts of Interest: The authors declare that they have no conflicts of interest to report regarding the present study.
References
1. A. B. T. Attya and J. L. Dominguez-Garcia, “Insights on the provision of frequency support by wind power and the impact on energy systems,” IEEE Trans. Sustain. Energy, vol. 9, no. 2, pp. 719–728, Apr. 2017. doi: 10.1109/TSTE.2017.2759503. [Google Scholar] [CrossRef]
2. S. Wang and K. Tomsovic, “Fast frequency support from wind turbine generators with auxiliary dynamic demand control,” IEEE Trans. Power Syst., vol. 34, no. 5, pp. 3340–3348, Sep. 2019. doi: 10.1109/TPWRS.2019.2911232. [Google Scholar] [CrossRef]
3. J. Van de Vyver, J. D. de Kooning, B. Meersman, L. Vandevelde, and T. L. Vandoorn, “Droop control as an alternative inertial response strategy for the synthetic inertia on wind turbines,” IEEE Trans. Power Syst., vol. 31, no. 2, pp. 1129–1138, Mar. 2015. doi: 10.1109/TPWRS.2015.2417758. [Google Scholar] [CrossRef]
4. Y. Fu, X. Zhang, Y. Hei, and H. Wang, “Active participation of variable speed wind turbine in inertial and primary frequency regulations,” Elect. Power Syst. Res., vol. 147, pp. 174–184, Jun. 2017. doi: 10.1016/j.epsr.2017.03.001. [Google Scholar] [CrossRef]
5. National Grid, “Mandatory frequency response national grid,” 2016. Accessed: Feb. 5, 2024. [Online]. Available: https://www.nationalgridus.com [Google Scholar]
6. Z. Zhang et al, “Code on security and stability for power system,” (in Chinesein Power System Security and Stability Guidelines: GB 38755—2019. Beijing: China Standard Press, 2019. [Google Scholar]
7. H. Lao, L. Zhang, T. Zhao, and L. Zou, “Innovated inertia control of DFIG with dynamic rotor speed recovery,” CSEE J. Power Energy Syst., vol. 8, no. 5, pp. 1417–1427, Sep. 2020. doi: 10.17775/cseejpes.2020.03180. [Google Scholar] [CrossRef]
8. W. Bao et al., “Analytically derived fixed termination time for stepwise inertial control of wind turbines—Part I: Analytical derivation,” Int. J. Electrical Power Energy Syst., vol. 121, Oct. 2020, Art. no. 106120. doi: 10.1016/j.ijepes.2020.106120. [Google Scholar] [CrossRef]
9. Y. Fu, Y. Wang, and X. Zhang, “Integrated wind turbine controller with virtual inertia and primary frequency responses for grid dynamic frequency support,” IET Renew. Power Gener., vol. 11, no. 8, pp. 1129–1137, 19 Jan. 2017. doi: 10.1049/iet-rpg.2016.0465. [Google Scholar] [CrossRef]
10. J. Ouyang, M. Pang, M. Li, D. Zheng, T. Tang and W. Wang, “Frequency control method based on the dynamic deloading of DFIGs for power systems with high-proportion wind energy,” Int. J. Electrical Power Energy Syst., vol. 128, 2021, Jun. 2021, Art. no. 106764. doi: 10.1016/j.ijepes.2021.106764. [Google Scholar] [CrossRef]
11. Y. Nie, J. Liu, L. Gao, Y. Wu, and Z. Li, “Nonlinear rotor kinetic energy control strategy of DFIG-based wind turbine participating in grid frequency regulation,” Elect. Power Syst. Res., vol. 223, Oct. 2023, Art. no. 109678. doi: 10.1016/j.epsr.2023.109678. [Google Scholar] [CrossRef]
12. K. V. Vidyanandan and N. Senroy, “Primary frequency regulation by deloaded wind turbines using variable droop,” IEEE Trans. Power Syst., vol. 28, no. 2, pp. 837–846, 2012, May 2013. doi: 10.1109/TPWRS.2012.2208233. [Google Scholar] [CrossRef]
13. W. Yuan-Kang, L. Guan-Liang, and D. P. Quoc, “A review of frequency regulation of DFIG-based wind farms,” in IET Conf. Proc., The Institution of Engineering & Technology, Hong Kong, China, 11 Nov. 2018. doi: 10.1049/cp.2018.1766. [Google Scholar] [CrossRef]
14. J. Li, C. Song, and L. Fei, “Optimal control strategy of virtual inertia for wind turbine based on parameter fuzzy inference,” (in ChineseAutomat. Electr. Power Syst., vol. 47, no. 20, pp. 125–133, 2023. doi: 10.7500/AEPS20220913008. [Google Scholar] [CrossRef]
15. C. Pradhan, C. N. Bhende, and A. K. Samanta, “Adaptive virtual inertia-based frequency regulation in wind power systems,” Renew. Energy, vol. 115, pp. 558–574, Jan. 2018. doi: 10.1016/j.renene.2017.08.065. [Google Scholar] [CrossRef]
16. B. Peng, X. Ma, X. Ma, and C. Tian, “Fuzzy-based coordinated control and parameter correction strategy for speed controller of PMSG wind turbine in frequency response,” Energy Rep., vol. 9, pp. 558–566, May 2023. doi: 10.1016/j.egyr.2023.01.072. [Google Scholar] [CrossRef]
17. Y. K. Wu, W. H. Yang, Y. L. Hu, and P. Q. Dzung, “Frequency regulation at a wind farm using time-varying inertia and droop controls,” IEEE Trans. Ind. Appl., vol. 55, no. 1, pp. 213–224, Jan.–Feb. 2018. doi: 10.1109/TIA.2018.2868644. [Google Scholar] [CrossRef]
18. D. Yang, Z. Jin, T. Zheng, and E. Jin, “An adaptive droop control strategy with smooth rotor speed recovery capability for type III wind turbine generators,” Int. J. Electr. Power Energy Syst., vol. 135, Feb. 2022, Art. no. 107532. doi: 10.1016/j.ijepes.2021.107532. [Google Scholar] [CrossRef]
19. S. Tu, B. Zhang, and X. Jin, “Research on DFIG-ES system to enhance the fast-frequency response capability of wind farms,” Energies, vol. 12, no. 18, Sep. 2019, Art. no. 3581. doi: 10.3390/en12183581. [Google Scholar] [CrossRef]
20. Y. Cheng et al., “A consecutive power dispatch in wind farms to mitigate secondary frequency dips,” Int. J. Electr. Power Energy Syst., vol. 158, Jul. 2024, Art. no. 109939. doi: 10.1016/j.ijepes.2024.109939. [Google Scholar] [CrossRef]
21. D. Yang et al., “Temporary frequency support of a DFIG for high wind power penetration,” IEEE Trans. Power Syst., vol. 33, no. 3, pp. 3428–3437, May 2018. doi: 10.1109/TPWRS.2018.2810841. [Google Scholar] [CrossRef]
22. Q. Shi, F. Li, and H. Cui, “Analytical method to aggregate multi-machine SFR model with applications in power system dynamic studies,” IEEE Trans. Power Syst., vol. 33, no. 6, pp. 6355–6367, Nov. 2018. doi: 10.1109/TPWRS.2018.2824823. [Google Scholar] [CrossRef]
23. P. M. Anderson and M. Mirheydar, “A low-order system frequency response model,” IEEE Trans. Power Syst., vol. 5, no. 3, pp. 720–729, Aug. 1990. doi: 10.1109/59.65898. [Google Scholar] [CrossRef]
24. X. Wang and D. Yang, “Adaptive speed recovery strategy of doubly-fed induction generator based on variable PI control coefficient,” (in ChineseTrans. China Electrotechnical Soc., vol. 38, no. 15, pp. 4120–4129, Aug. 2023. doi: 10.19595/j.cnki.1000-6753.tces.220852. [Google Scholar] [CrossRef]
Cite This Article
 Copyright © 2024 The Author(s). Published by Tech Science Press.
This work is licensed under a Creative Commons Attribution 4.0 International License , which permits unrestricted use, distribution, and reproduction in any medium, provided the original work is properly cited.


 Submit a Paper
 Propose a Special lssue
 View Full Text
 Download PDF
 Downloads
 Citation Tools