 Open Access
ARTICLE
Modeling, Simulation, and Risk Analysis of Battery Energy Storage Systems in New Energy Grid Integration Scenarios
1 School of Electrical Engineering, Yanshan University, Qinhuangdao, 066004, China
2 Power System Department, Electric Power Research Institute, Beijing, 100192, China
* Corresponding Author: Xiaohui Ye. Email:
(This article belongs to the Special Issue: Advanced Modelling, Operation, Management and Diagnosis of Lithium Batteries)
Energy Engineering 2024, 121(12), 3689-3710. https://doi.org/10.32604/ee.2024.055200
Received 20 June 2024; Accepted 12 September 2024; Issue published 22 November 2024
Abstract
Energy storage batteries can smooth the volatility of renewable energy sources. The operating conditions during power grid integration of renewable energy can affect the performance and failure risk of battery energy storage system (BESS). However, the current modeling of grid-connected BESS is overly simplistic, typically only considering state of charge (SOC) and power constraints. Detailed lithium (Li)-ion battery cell models are computationally intensive and impractical for real-time applications and may not be suitable for power grid operating conditions. Additionally, there is a lack of real-time batteries risk assessment frameworks. To address these issues, in this study, we establish a thermal-electric-performance (TEP) coupling model based on a multi-time scale BESS model, incorporating the electrical and thermal characteristics of Li-ion batteries along with their performance degradation to achieve detailed simulation of grid-connected BESS. Additionally, considering the operating characteristics of energy storage batteries and electrical and thermal abuse factors, we developed a battery pack operational risk model, which takes into account SOC and charge-discharge rate (Cr), using a modified failure rate to represent the BESS risk. By integrating detailed simulation of energy storage with predictive failure risk analysis, we obtained a detailed model for BESS risk analysis. This model offers a multi-time scale integrated simulation that spans month-level energy storage simulation times, day-level performance degradation, minute-scale failure rate, and second-level BESS characteristics. It offers a critical tool for the study of BESS. Finally, the performance and risk of energy storage batteries under three scenarios—microgrid energy storage, wind power smoothing, and power grid failure response—are simulated, achieving a real-time state-dependent operational risk analysis of the BESS.Keywords
China’s 2030–2060 dual carbon goals aim to propel the proportion of renewable energy sources, such as wind and photovoltaic energy, which will gradually replace fossil fuel generation. However, with the rise in renewable energy resources, the issues brought about by their intermittency and volatility become increasingly prominent. Battery energy storage system (BESS) act as the primary means of renewable energy storage and an effective means to address the aforementioned volatility issue [1,2].
BESS have extensive applications within power systems: In terms of (i) generation, they can be used for rapid frequency regulation, smoothing out renewable energy fluctuations, and providing cold and hot standby; (ii) transmission and distribution networks, they can optimize the integration of renewable energy and the distribution of power flow; and (iii) load, they can improve power quality, provide distributed energy supply, and participate in market regulation through means such as electricity price arbitrage [3]. BESS can help develop a novel, low-carbon power system by significantly enhancing their ability to accommodate wind and photovoltaic energy. However, the high investment cost, frequent fire and explosion incidents [4], and poor reliability and safety of BESS are major bottlenecks for their widespread large-scale BESS application. Therefore, it is particularly important to conduct refined modeling, simulation, and risk analysis of BESS.
Unlike other operating scenarios, the application of BESS in the power grid involves complex multi-time scale dynamic characteristics, including second-level and minute-level frequency response, hour-level peak-cutting and valley-filling and load smoothing, as well as day-level renewable energy fluctuation smoothing [5,6]. In response to these characteristics, scholars have conducted multi-time scale modeling of energy storage batteries [7,8] and studied corresponding control strategies [9]. However, these studies mainly focus on the impact of BESS on the grid while neglecting the state and risk changes of the BESS itself.
Li-ion batteries experience a gradual performance degradation during the cycling process. The State of Health (SOH) and Remaining Useful Life (RUL) are critical indicators of batteries performance [10,11], with changes in capacity and internal resistance being the primary manifestations of its health status. Health status assessment methods based on capacity degradation and increased internal resistance are the most direct and effective means [12,13]. However, these methods primarily focus on changes in the external characteristics of energy storage batteries and often overlook the impact of various factors, such as temperature and charge-discharge rate. To address this issue, researchers have conducted extensive charge-discharge experiments on Li-ion batteries, taking into account the impact of charge-discharge rate, temperature, and the number of charge-discharge cycles on the capacity degradation of the batteries, and have established semi-empirical aging models for Li-ion batteries [14–16]. These models incorporate multiple factors affecting Li-ion batteries. Additionally, with the development of artificial intelligence (AI) techniques, methods such as the modified flower pollination algorithm-temporal convolutional network [17] and the multi-faceted health estimation method for lithium-sulfur batteries based on incremental capacity analysis and improved long short-term memory (LSTM) network [18] have begun to be applied to the state assessment of Li-ion batteries, achieving significant progress. The literature [19] has reviewed and summarized methods using machine learning and deep learning to predict the health status of batteries, indicating the potential of deep learning methods in estimating the health status of Li-ion batteries. The aforementioned model can effectively simulate the aging characteristics of energy storage batteries and offers advantages in batteries state monitoring. However, the evaluation of a single health state tends to focus on the steady-state analysis of long-term processes, making it insufficient to directly reflect the current risk of the energy storage batteries.
As the SOH of Li-ion batteries continues to decline, the possibility of internal short circuit and thermal runaway increases, with thermal abuse and electrical abuse being the primary triggers for most failures [20]. Thermal and electrical abuse can lead to a rapid rise in internal temperature, triggering a series of side reactions such as electrolyte decomposition and collecting fluid melting, which may result in battery failure or even fire and explosion [21,22]. To study the risk of Li-ion batteries under abusive conditions, scholars have conducted experiments on energy storage batteries focusing on high temperatures, over-charging, and other abuse behaviors, analyzing the process from abuse to failure [23]. These studies have revealed the relationship between internal short circuit and thermal runaway [24] and developed models such as a three-dimensional electric-thermal model describing the battery’s transition from normal to abuse conditions and eventually to thermal runaway [25], a geometric model based on over-charging experiments [26], a three-dimensional electrochemical-thermal coupling simulation model of thermal runaway under over-charging conditions [27], and an internal short circuit failure diagnosis algorithm based on the electrochemical-thermal coupling model [28]. These studies have made significant contributions to the risk analysis of Li-ion batteries, but they still face issues such as a focus on single factors, limited adaptability to various scenarios, and a lack of in-depth analysis of the internal failure mechanisms of Li-ion batteries. They are unable to comprehensively consider the integrated impact of performance degradation and real-time status on the risk of Li-ion batteries in grid-connected scenarios.
In recent years, numerous models have made significant advancements about Li-ion battery simulation technology, such as equivalent circuit model [29], electrochemical model [30], data-driven model [31], thermal model [32], and multi-physics coupling model [33]. These models comprehensively simulate the operational characteristics of individual battery cell and their related side reactions. In particular, the multi-physics coupling model, developed using the multiphysics simulation software (such as COMSOL), can simulate electrochemical and thermal coupling, along with related side reactions and thermal runaway phenomena [33]. However, grid-connected system simulations typically consider only SOC and power of the BESS, while ignoring other critical parameters. This limitation hampers the accurate assessment of the current state of BESS, hindering the real-time evaluation of safety risk. Detailed and complex simulation models of individual Li-ion cells tend to have slow simulation speeds, making them unsuitable for grid system simulations. Therefore, there is an urgent need to develop efficient BESS models suitable for system-level simulations that encompass a broader range of critical parameters.
To address the abovementioned concerns, in this study, we propose an improved equivalent circuit model for BESS by incorporating their thermal characteristics and performance degradation including capacity “diving” regularity, into a unified multi-time scale model. We established a thermal-electric-performance (TEP) coupling model to simulate the BESS in grid-connected scenarios with higher precision. We further analyzed the failure mechanisms of Li-ion batteries to propose a battery operation risk model considering the BESS failure risk. Risk analysis was performed using the parameters obtained from the TEP coupling model, comprehensively combining deterministic operational scenario simulation with predictive failure risk assessment.
The rest of the paper is arranged as follows: In Section 2, we provide a comprehensive overview of the entire model framework and the coupling relationships between its various components; in Sections 3 and 4, we provide a detailed introduction to the development of the TEP coupling model and the battery pack operational risk model, respectively; in Section 5, we conduct a performance and risk analysis of the BESS under three scenarios: microgrid energy storage, wind power smoothing, and power grid failure response. Finally, in Section 6, we present the principal conclusions of our study.
2 Model Structure and Coupling Framework
The factors leading to failures in energy storage batteries can be primarily categorized into electrical, thermal, and mechanical abuse [20]. As generally energy storage batteries are installed in a fixed position, they have a low risk of mechanical abuse due to external physical impacts and vibrations, making thermal and electrical abuse the primary causes of BESS failures. It is necessary to consider and model in detail the effects of charge-discharge behavior, electrothermal characteristics, and battery performance on the inherent battery safety risk.
We built on the electromechanical model [8] by considering the thermal characteristics and performance degradation of the BESS during the cycling processes (Fig. 1), establishing a TEP coupling model for a more detailed simulation of the operating conditions of the battery pack in grid-connected scenarios.
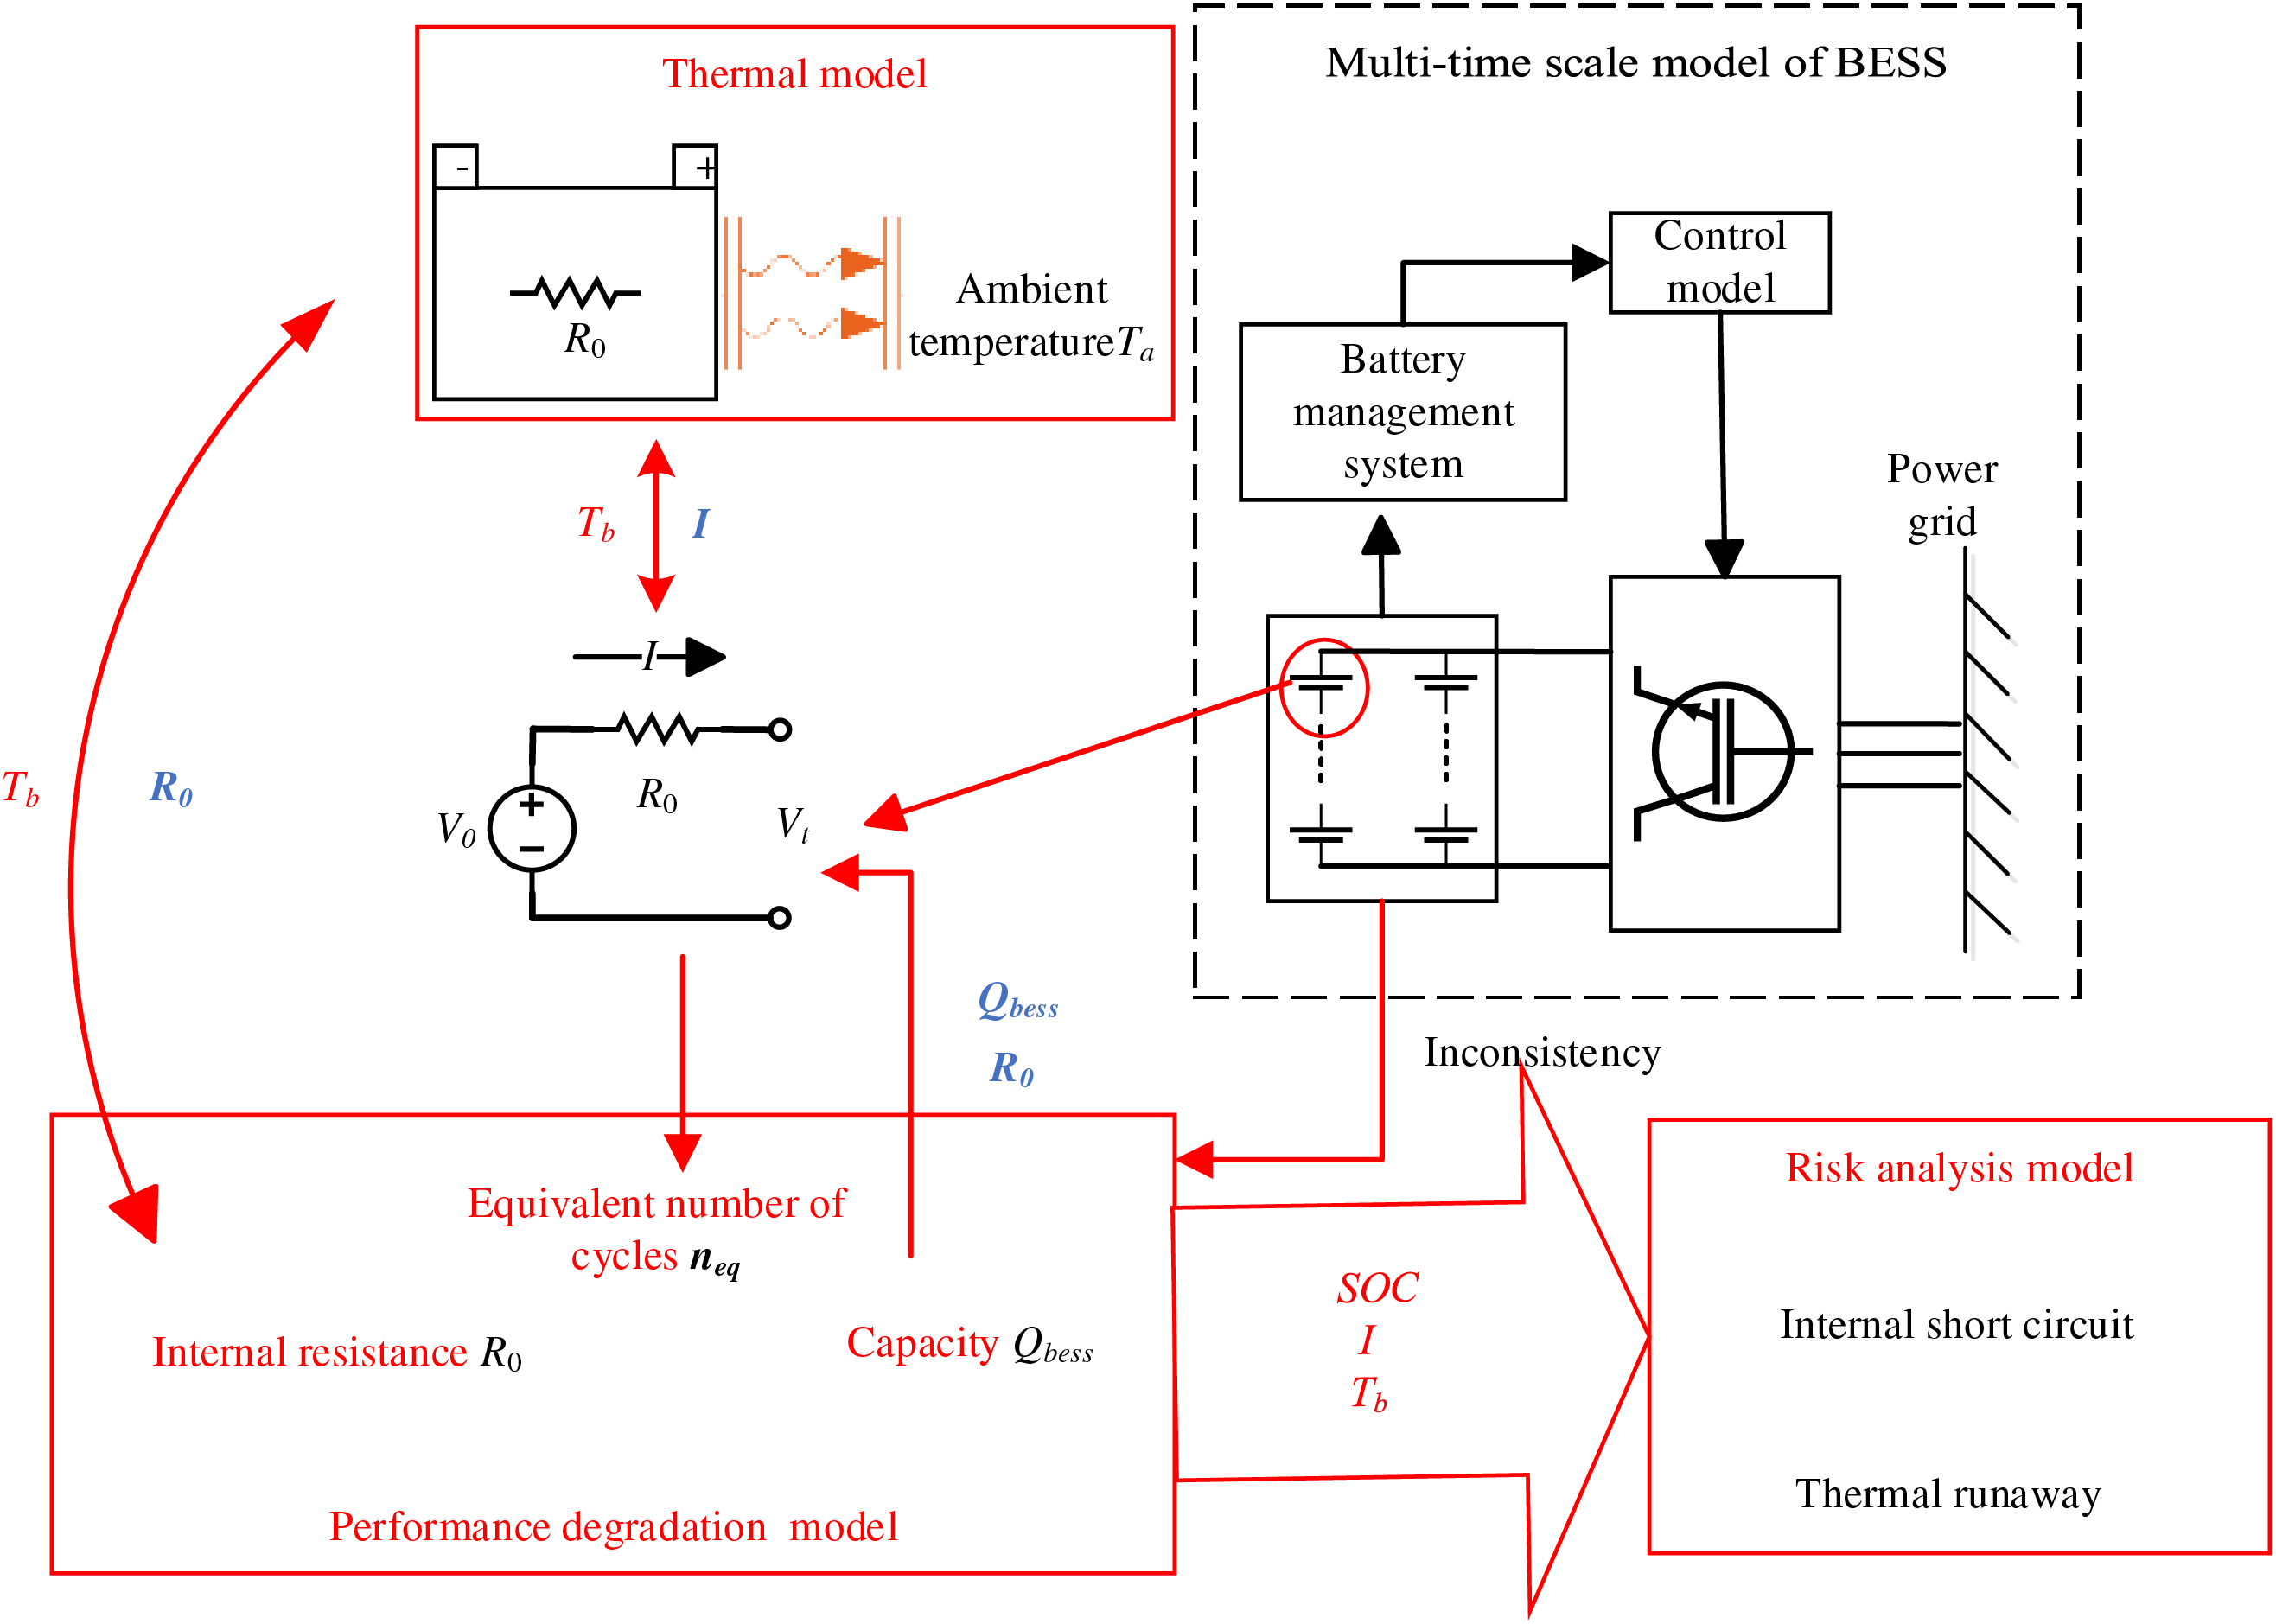
Figure 1: BESS whole framework based on detailed simulation
Based on the multi-time scale BESS model [8], our model accounts for the variations in battery open-circuit voltage (V0) and internal resistance (R0) of the battery with changes in its temperature (Tb) and state of charge (SOC); i.e., the ratio of the current charge of the battery to its maximum charge capacity, usually calculated using the ampere-hour integral method [34]; Tb is influenced by the heat generated from R0 and the current (I) flowing through the battery. Additionally, the electrical and thermal parameters of the battery affect its performance, leading to capacity degradation and increased internal resistance [35]. These irreversible changes will, in turn, impact its electrical and thermal characteristics.
By using the TEP coupling model for a detailed BESS simulation, we obtain parameters, such as SOC and charge-discharge rate (Cr) which calculated as the ratio of I to the rated current Irate using Eq. (1). Subsequently, we perform a risk analysis using the battery pack operational risk model. The various parts of this model are closely connected and mutually influential, necessitating detailed modeling to determine the coupling relationships. Based on the time scale requirements for different parameters, the simulation outputs include month-level simulation time, day-level performance degradation, minute-level failure rates, and second-level energy storage batteries characteristics in a multi-time scale simulation. This allows for a comprehensive analysis combining deterministic detailed simulation and predictive operational risk of the BESS.
3 Thermal-Electric-Performance Coupling Model
The TEP coupling model comprehensively considers the electrical characteristics, thermal characteristics, and performance degradation of the BESS. The models of various modules interact and operate synergistically, enabling a more realistic and detailed BESS simulation.
The electrical model included two parts: the grid-connected control model and the equivalent circuit model of the BESS. The grid-connected control model of the multi-time scale model of BESS has already been modeled in detail [8], and will not be elaborated here. It should be noted that when smoothing wind power fluctuations, the filter’s time constant τ can be set to 150 s. For the equivalent circuit model, V0 was considered as a function of temperature and SOC, expressed as
with
where Vini,T is the open-circuit voltage of the fully charged battery with no load, defined by the voltage rating; βT is the SOC correction factor; T1 is the rated temperature and Tb is current temperature of the battery; Vini is the open-circuit voltage of the fully charged battery at temperature T1; μV is the temperature correction factor for the voltage; β is the SOC correction factor at temperature T1; and μB is the temperature correction factor for β. Further, R0 can be expressed as a function of temperature as
where Rini is the internal resistance at T1; μR is the temperature correction factor for internal resistance; and βin,p is the resistance correction factor under performance degradation (detailed in Section 3.3.3).
We adopt a lumped parameter model to describe the thermal behavior of energy storage batteries as it is simple to establish and calculate, and can be used to study the overall battery performance and the related influencing factors. The lumped parameter model ignores the non-uniform heat generation within the battery, considering a uniform battery temperature, Tb, calculated using the following heat balance equation [36]
where M is the battery mass; cp is the specific heat capacity of the battery material; and qc and qs are the heat generation and transfer by the battery, respectively, defined as
where hv and A are the coefficient and area of convective heat transfer, respectively; and Ta is the ambient temperature. The battery primarily generates heat due to its internal resistance, while transfer it mainly through convective heat transfer with the environment.
3.3 Performance Degradation Model
During the cycling process, Li-ion batteries inevitably undergo certain irreversible side reactions. These include, but are not limited to, the formation of a solid electrolyte interphase (SEI) layer; structural changes in the electrode materials during insertion and extraction; loss of active material; and electrolyte decomposition. These side reactions lead to the loss of Li-ions and active electrode materials degradation, resulting in battery performance degradation, which manifests as capacity degradation and increased internal resistance [35].
For an accurate capacity degradation rate analysis, we used a Li-ion battery performance degradation model based on the Dakin degradation method [37]. This model combined calendar and cycle aging, while comprehensively considering the effects of temperature, discharge depth, and charge-discharge rate on capacity degradation. The overall capacity degradation rate, k, can be expressed as
where I0 = 1 A; R is the gas constant; and a, b, c, d, u, and z are fitting parameters. For Li-ion batteries of different models, the fitting parameters have different values. For simplicity, this paper uses the fitting results from [37], where the value of a is 8.314 J/(mol·K), b is 81.48 kJ/mol, c is 0.288 J/(mol·K), d is 158.28 J/(mol·K), u is 49.45 kJ/mol, z is −24.06.
Due to the direct application of the fitted parameters without differentiating between battery models, there may be a significant error when calculating BESS capacity degradation using Eq. (9). Therefore, we introduce an equivalent cycle factor, βcyc, to characterize the capacity degradation rate in grid-connected scenarios, expressed as
where k and kc,ave are the capacity degradation rate of Li-ion batteries during actual use and at 25°C under constant power condition, respectively. Once the battery model, capacity, and other parameters are determined, the kc,ave value becomes fixed.
Thus, the equivalent cycle number, neq, for the battery in a grid-connected BESS scenario, over a certain period, can be calculated as
where nc is the number of cycles under rated power charge and discharge conditions, calculated using the grid-connected energy storage charging energy, Ec, discharging energy, Ed, V0, and battery capacity, Qbess. The average equivalent cycle factor, βcyc,ave, is the average value of βcyc over the time interval Δt, where t in Eq. (13) represents time.
As the number of cycles increases, the capacity of Li-ion batteries gradually degrades. It is commonly believed that the capacity of individual Li-ion battery cell exhibits a linear degradation before capacity “diving” occurs [38]. However, due to the presence of inconsistencies in internal resistance, actual capacity, voltage, and other parameters among the cells within the battery pack, the battery performance deteriorates further. Research has found that [39], under the commonly used charge-discharge rate of 0.5 C, the presence of inconsistencies in capacity, state of charge (SOC), and internal resistance results in an additional capacity degradation of 0.148 per cycle. Based on this, the capacity correction factor, βlife, after neq cycles of grid-connected BESS can be calculated as
where, the total capacity degradation is the sum of the capacity degradation over n time intervals. κC,i is the capacity degradation proportion when the battery reaches the end of lifespan, and NC,i is the number of cycles corresponding to κC,i. βic is the inconsistency-accelerated degradation factor, with a value of 0.148.
In studies concerning the lifespan of Li-ion batteries in electric vehicles, the value of κC is typically set at 20%. However, this value is inappropriate for grid-connected energy storage batteries. Because batteries from electric vehicles can be repurposed for grid-connected energy storage batteries after some screening processes [40]. The true source of danger in batteries is the capacity “diving”, which is the rapid nonlinear degradation following the linear degradation phase. Hence, we consider the onset of capacity “diving” as the end of the battery’s lifespan, meaning that the value of κC is the capacity degradation proportion at the point of capacity “diving”.
Research has found that the κC and NC at which Li-ion batteries experience capacity “diving” is related to the charge-discharge rate of the batteries. The higher the charge-discharge rate, the fewer cycles are experienced before capacity “diving” occurs. Consequently, even with the same number of cycles, the resulting capacity degradation may differ. The capacity degradation under four different charge-discharge rates is provided in [41], including the capacity degradation proportion κC and the cycles number NC at which capacity “diving” occurs. However, since this discrete data can’t meet our requirement, we used a three degree polynomial to fit the data, obtaining the relationships between κC and NC with Cr. The fitting results are shown in Eq. (15).
Thus, assuming Q0 is the initial capacity of the battery, the battery capacity Qbess after neq cycles can be calculated as
3.3.3 Internal Resistance Model
As the battery performance degrades, R0 increases, correlating approximately linearly with capacity degradation, with a proportionality constant of 1.53, obtained through fitting [42]. Based on this, the resistance correction factor βin,p can be calculated as
4 Battery Pack Operation Risk Model
Battery failure scenarios mainly include internal short circuit and thermal runaway. In terms of electrical abuse, over-charging and over-discharging tend to increase the risk of internal short circuit, which can release a large amount of heat in a short period; this process is uncontrollable and irreversible. In terms of thermal abuse, rising battery temperature increases the risk of triggering thermal runaway. Therefore, we established a battery operation risk model based on the probabilities of internal short circuit caused by electrical abuse and thermal runaway triggered by thermal abuse, considering SOC and charge-discharge rate.
4.1 Electrical Failure Coefficient under Electrical Abuse
Electrical abuse of Li-ion batteries mainly include over-charging and over-discharging, and excessive charge-discharge rate. Over-charging and over-discharging can lead to the growth of copper (Cu) and Li dendrites on the electrode, which can pierce the separator and increase the risk of internal short circuit. Experimental statistics have shown that at a discharge rate of 1 Cr, the risk of internal short circuit can occur approximately 270 s after over-discharging [43] and approximately 660 s after over-charging [44]. The charge-discharge rate, Cr, affects the failure time under over-charging and over-discharging conditions, with an inverse proportionality [45,46].
Assuming that during charging and discharging, the Cu-ions and Li-ions generation rates are linear, the risk of internal short circuit becomes inversely linearly related to time. The electrical failure coefficient ηE for over-charging and over-discharging are assumed to be 1 at SOC = 80% and 20%, respectively.
Considering the SOC and charge-discharge rate effects, the electrical failure coefficient, ηE, can be expressed as (Fig. 2)
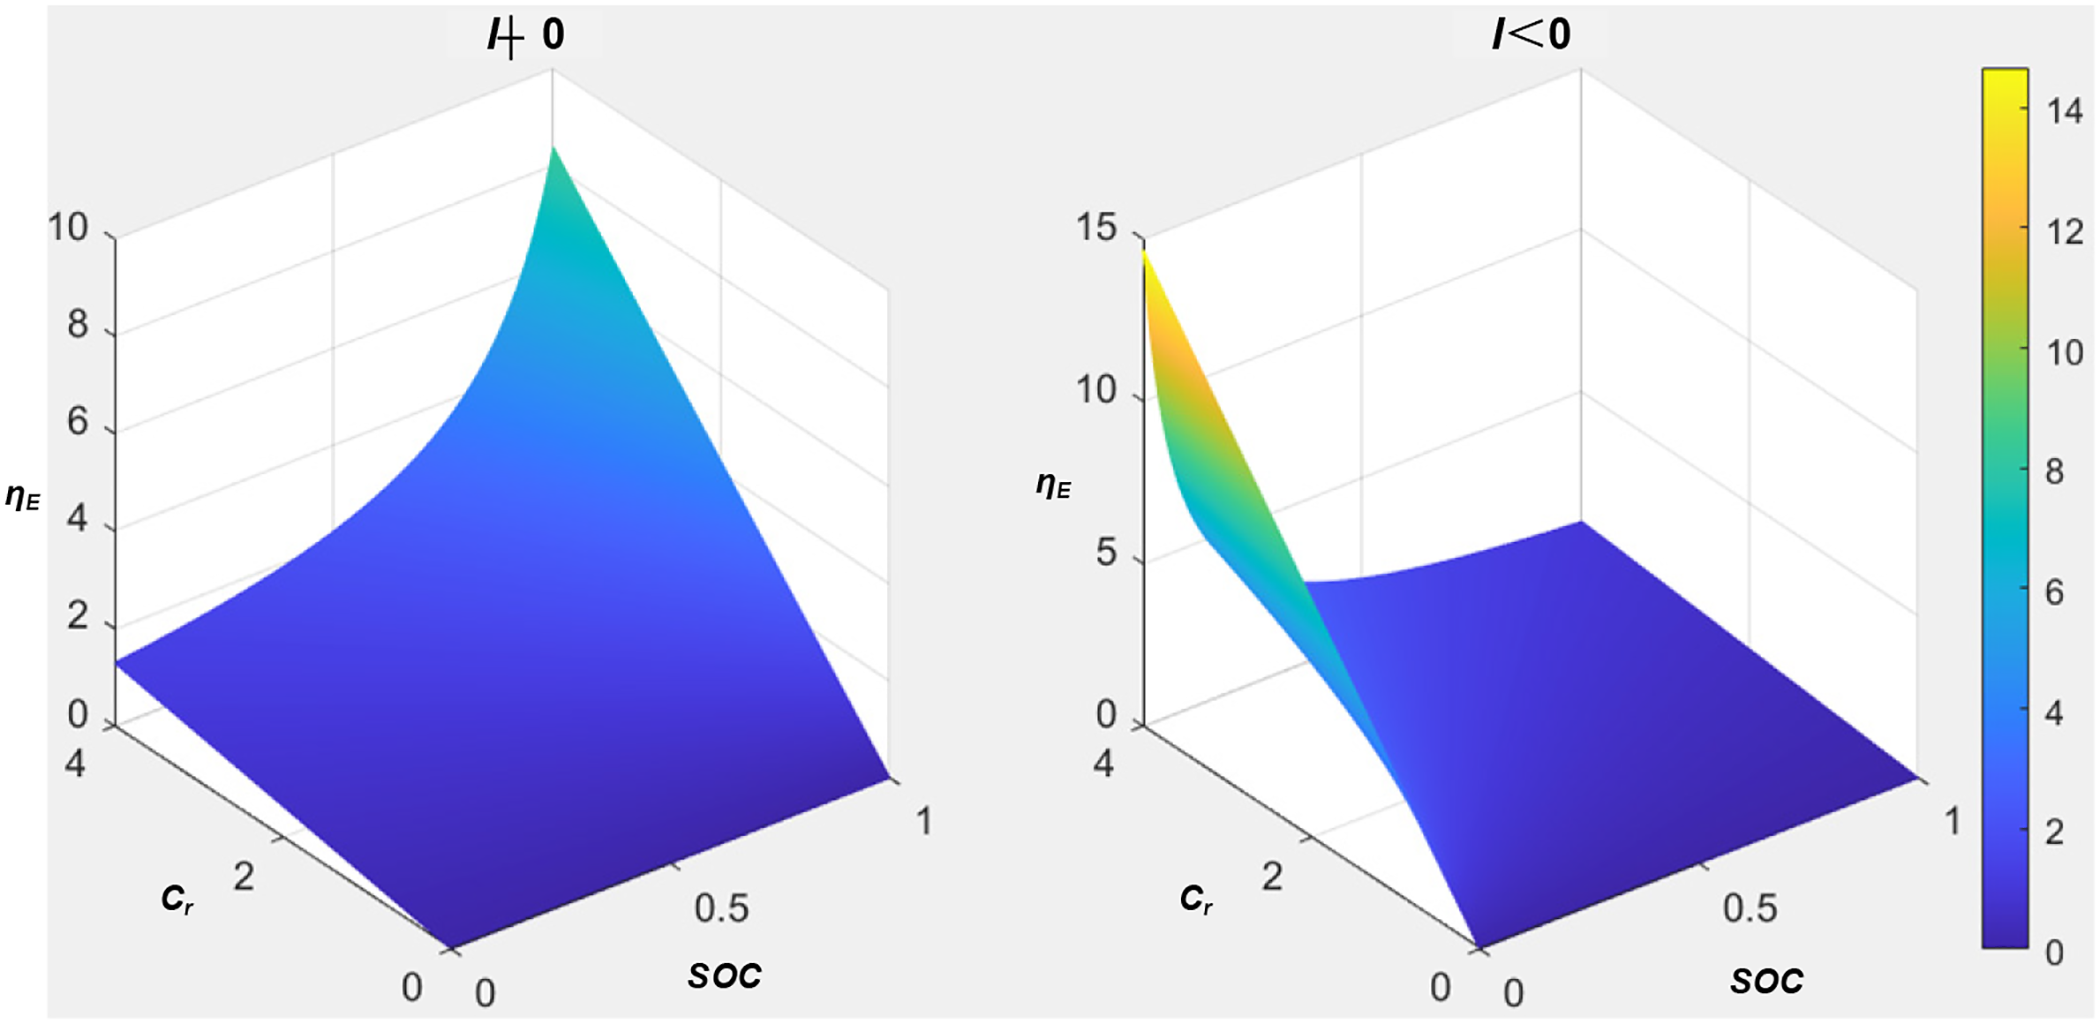
Figure 2: Relationship of electrical failure coefficient (ηE) vs. SOC
4.2 Thermal Failure Coefficient under Thermal Abuse
For Li-ion batteries, the conditions that trigger thermal runaway and the subsequent severity of the events differ under given heating conditions depending on the SOC. Specifically, batteries with a low SOC are less prone to thermal runaway as the internal chemical reactions are relatively weak due to a lower charge. Conversely, batteries with a high SOC have more active internal chemical reactions and can experience thermal runaway at relatively low temperatures, with more severe consequences. SOC is inversely proportional to the temperature at which thermal runaway is triggered, and directly proportional to the battery mass loss that represents the severity of thermal runaway; the higher the SOC, the lower the thermal runaway trigger temperature and the greater safety risk. To describe the relationship between SOC and thermal runaway failure under thermal abuse conditions more intuitively, we utilized the dataset obtained from the work of Wang et al. [46] on thermal runaway trigger temperature and mass loss at different SOC levels. Assuming the thermal failure coefficient, ηT, to be 1 for SOC = 50%, we can compute it for other SOC values as
where Ttr,SOC = 50% and ml,SOC = 50% are the thermal runaway trigger temperature and mass loss at SOC = 50%, respectively, and Ttr,SOC = j and ml,SOC = j are the thermal runaway trigger temperature and mass loss at SOC = j, respectively.
We calculated ηT at different SOC levels (Table 1) and fitted the ηT-SOC curve (Fig. 3) using a double exponential function to obtain the relationship between ηT with SOC as

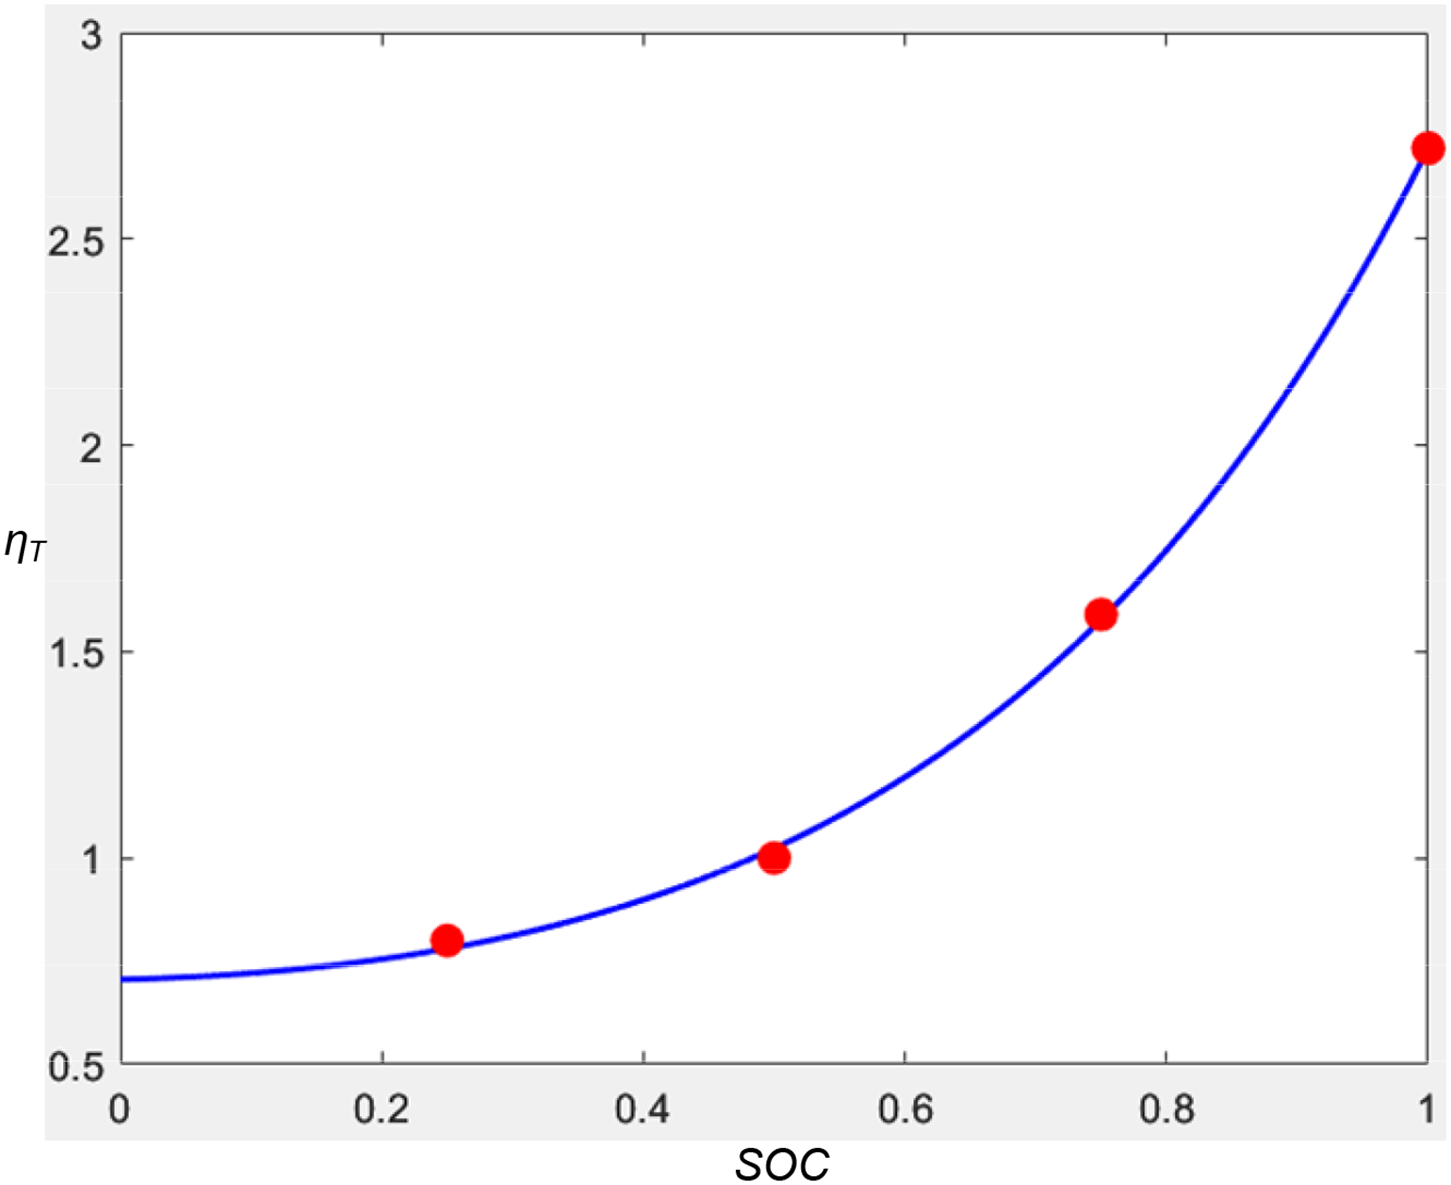
Figure 3: Thermal failure coefficient (ηT) - SOC fitting curve
Thorough and accurate evaluation of energy storage batteries failure coefficients requires a comprehensive consideration of electrical and thermal abuse factors, reflecting the overall battery failure risk. Furthermore, the health status of the battery is influenced by the difference between the capacity of the last cycle and the current capacity, that is, the impact of the capacity degradation rate [47]. As the battery is used, its performance continuously degrades, with the loss of available Li-ions and active materials of the positive and negative electrodes, and the risk of failure increases. Therefore, the equivalent cycle factor, βcyc, is used to correct the electrical failure coefficient ηE and the thermal failure coefficient ηT, to obtain the comprehensive time-varying failure coefficient η of the battery, as shown in the following equation:
For a more precise reflection of the actual operation conditions, we adjusted the battery pack failure rate, λ, using time-varying failure coefficient η as
where λ is the time-varying failure rate of the battery pack; s is the number of cells in the battery pack; and λ0 is the single-cell failure rate, with its value typically taken as 1 × 10⁻⁷ failures per year (f/y).
5 Dynamic Risk Analysis of BESS
We will conduct simulation analyses for three scenarios: microgrid energy storage, wind power smoothing, and power grid failure response. The batteries used in this study are lithium iron phosphate (LiFePO4) batteries, with specific parameters shown in Table 2.

In this section, a microgrid system including wind, solar, and BESS located in a residential area in Eastern China was taken as the research subject. The dual-layer optimization model for energy storage batteries capacity configuration and operational economic benefits of the wind-solar-storage microgrid system, as constructed in Reference [48], was used to determine the energy storage batteries capacity configuration and charge-discharge power. Subsequently, a BESS risk analysis model based on detailed simulation was employed to compare with the traditional energy storage model which assumed a constant failure rate and considered SOC to be influenced solely by power, to analyze the real-time risk probability.
According to the BESS study by Zhou [48], we configured the BESS with an energy storage capacity of 842.1 kWh and analyzed the typical daily output curve (Fig. 4).
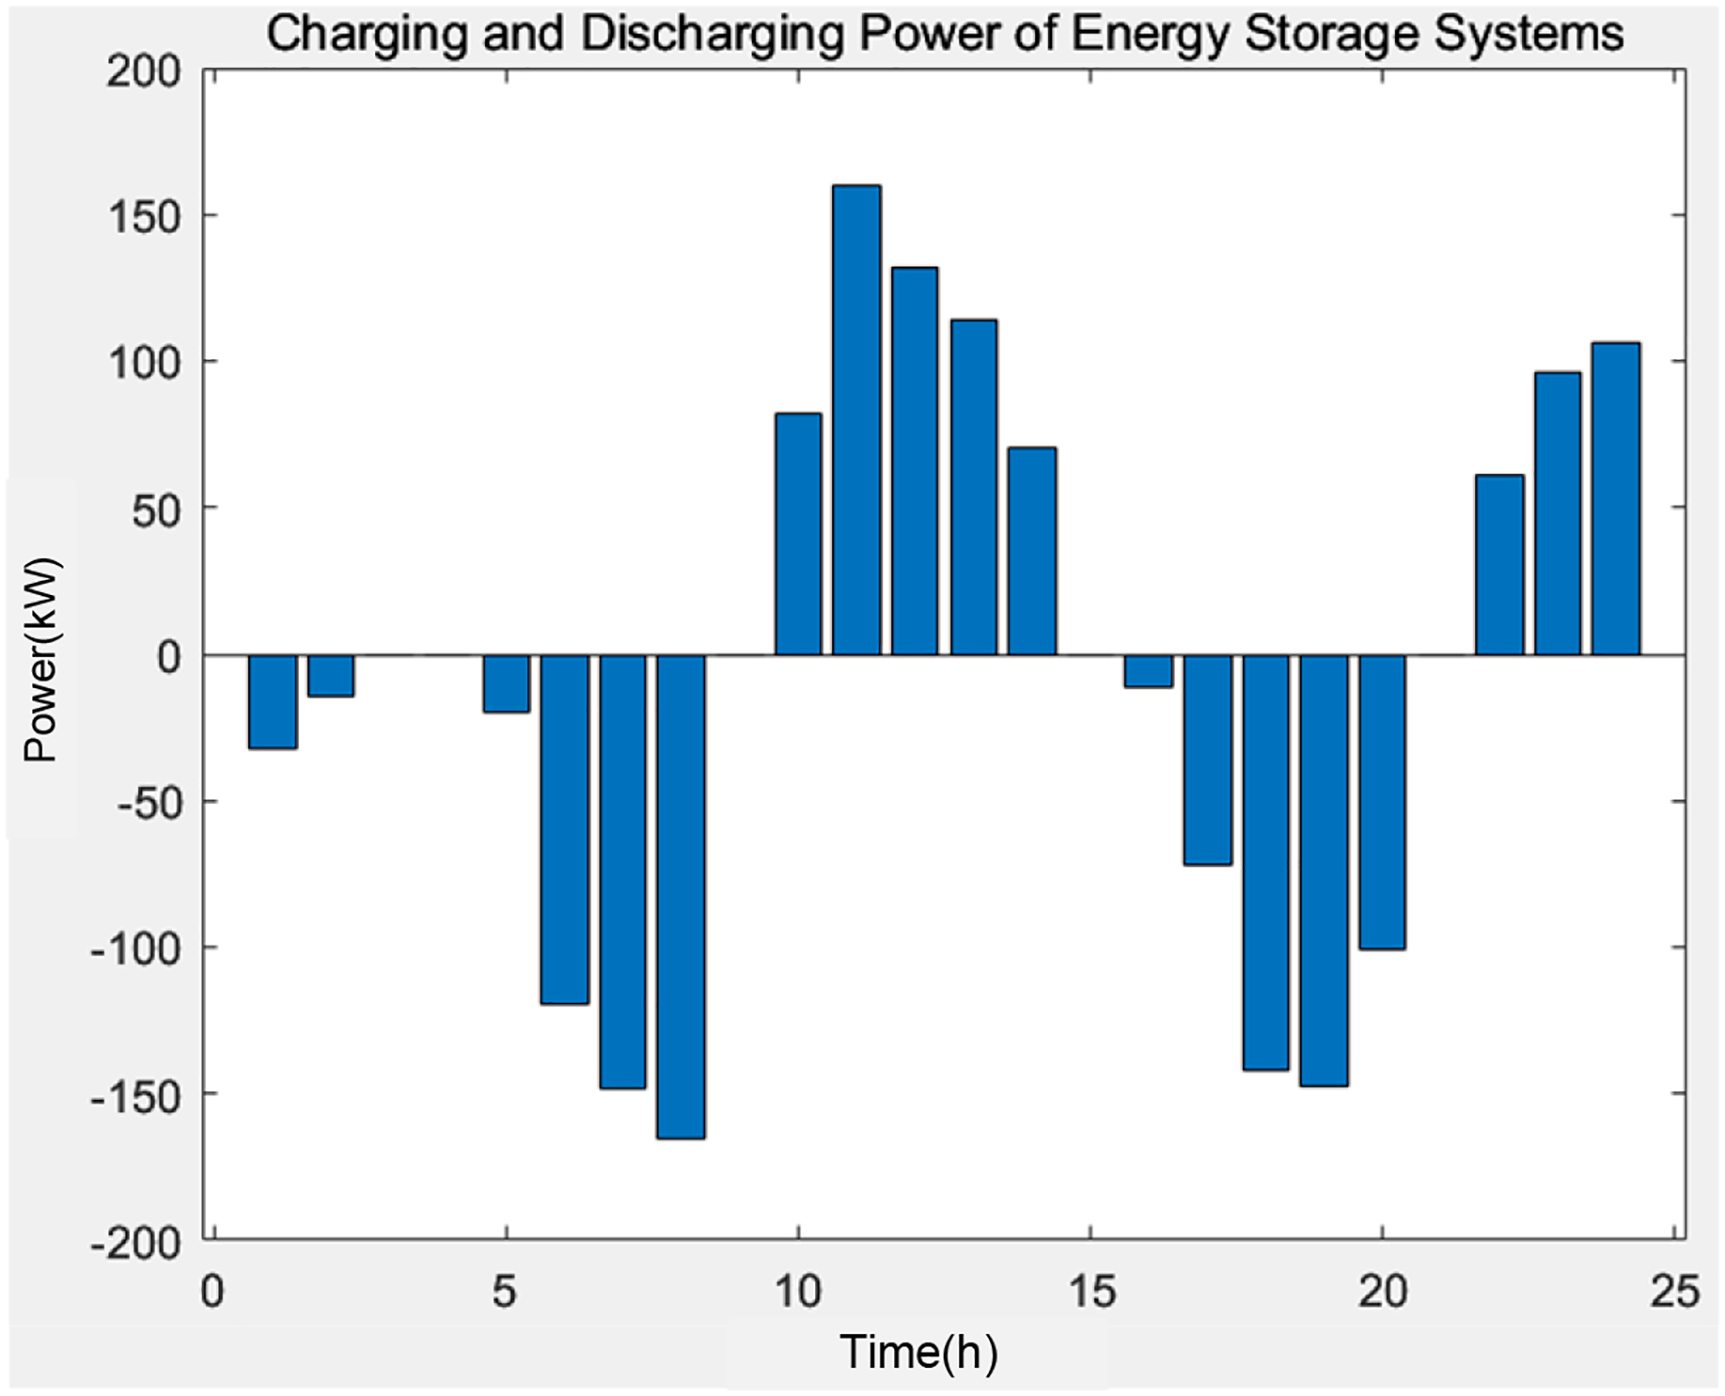
Figure 4: Typical daily charging and discharging power of BESS in microgrid
The BESS consisted of 439 cells. Under an ambient temperature of 30°C, we compared the SOC and failure rate curves for the traditional model (considering only the BESS power and SOC); the proposed model at SOH = 1; and the proposed model at SOH = 0.8 (Figs. 5 and 6).
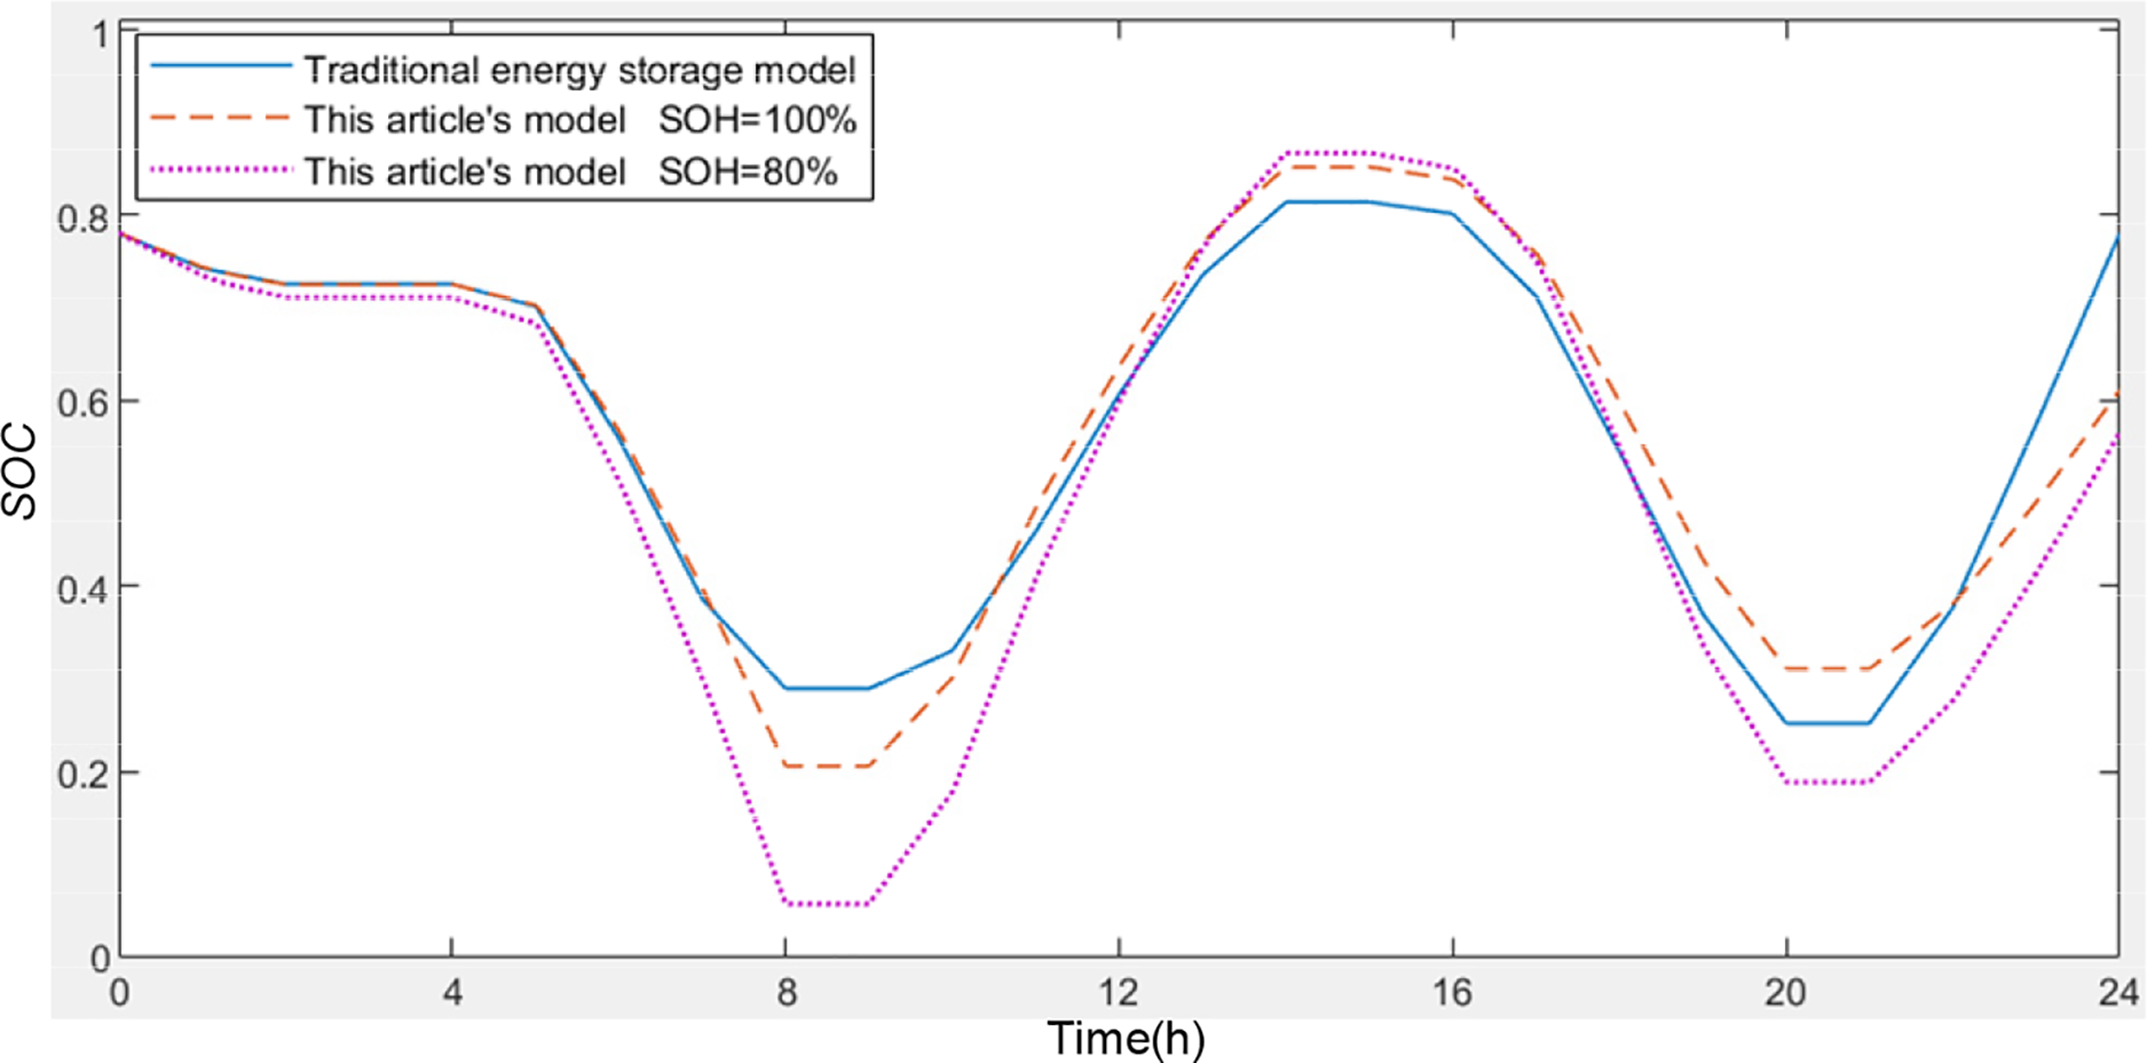
Figure 5: Typical daily SOC curves for the different BESS models in microgrid
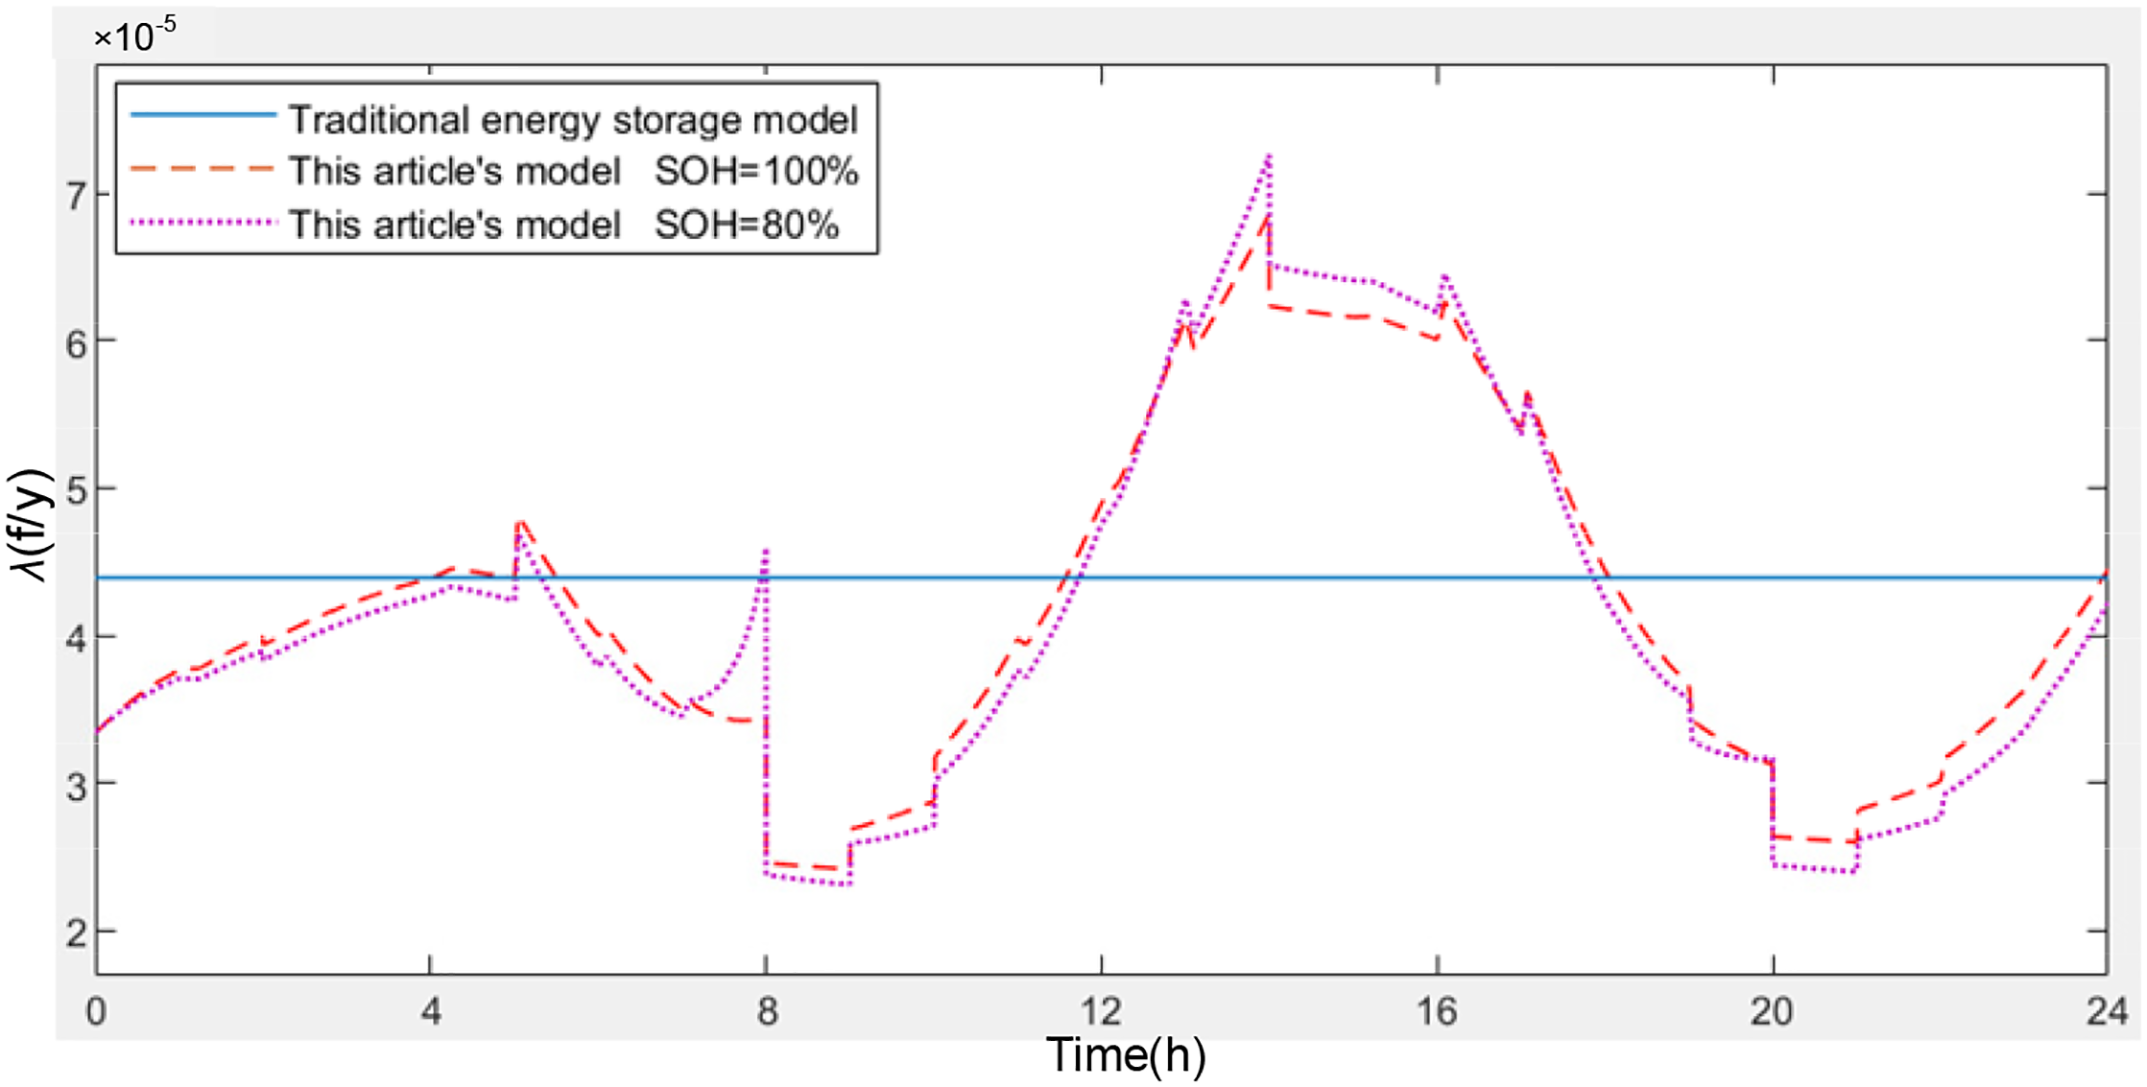
Figure 6: Typical daily failure rate curves for the different BESS models in microgrid
As shown in Fig. 5, compared to the traditional model, the proposed model in this study comprehensively considers external factors and the impact of aging on the BESS as the SOH decreases. It provides a more detailed description of the behavior of SOC changes, effectively preventing SOC from exceeding limits.
The traditional model assumes a constant failure rate for Li-ion battery pack throughout the day, which is evidently inaccurate (Fig. 6). The proposed model can evaluate the Li-ion battery pack failure rate at different times based on the real-time state. Around 13 h, the failure rate reaches its peak due to the large SOC resulting from several hours of continuous charging, coupled with the continued high charging power applied to the energy storage battery pack. This effect is of significant importance as it allows for a clearer understanding of the real-time risk associated with energy storage battery pack, enabling personnel to take appropriate measures.
Using wind power output data from a wind power station in Gansu, China, as the basis for calculation, a month’s wind power data was selected, as shown in Fig. 7.
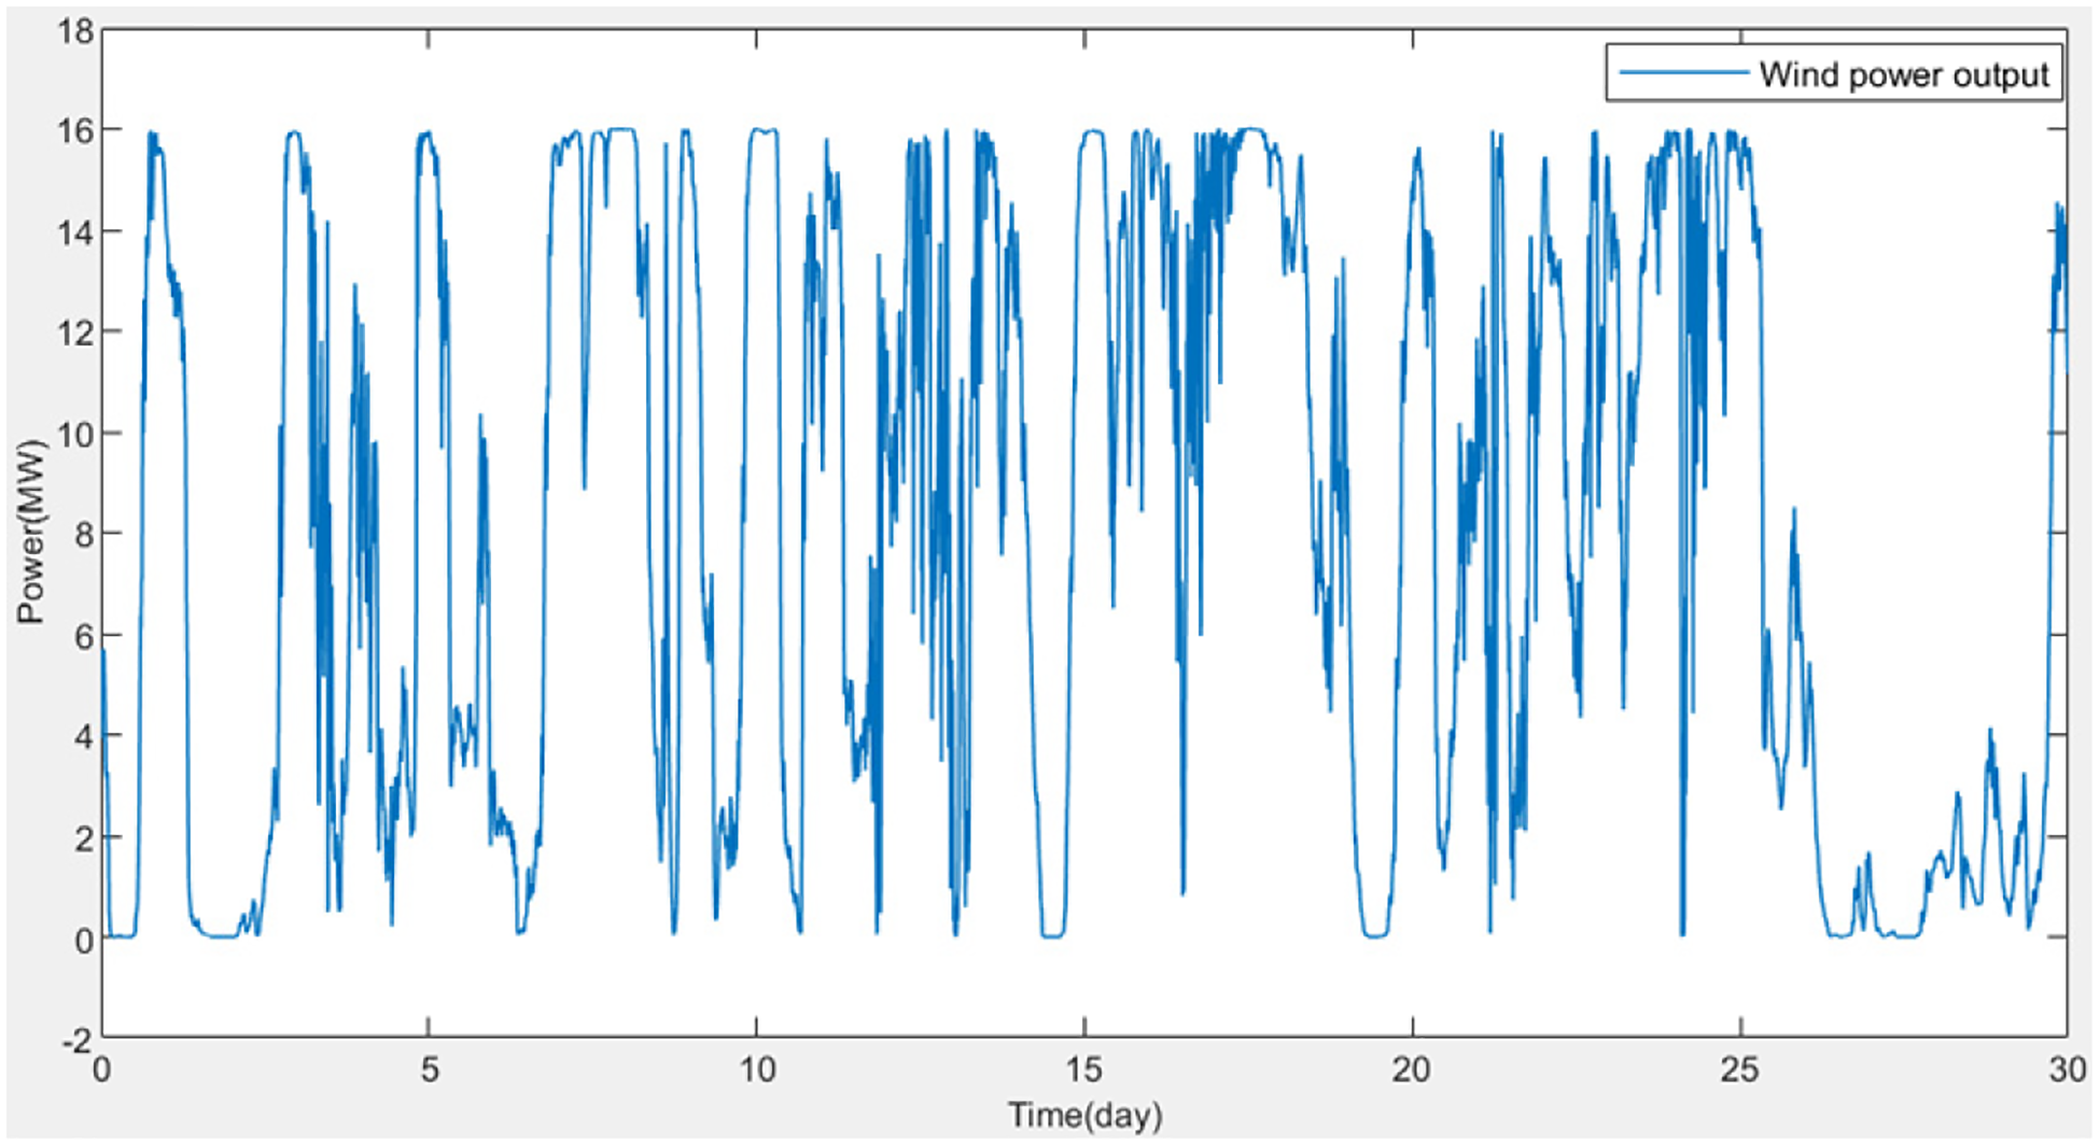
Figure 7: Active wind power curve over time for Gansu data
Using medium- to long-term simulation programs, we simulated the BESS with the filter time constant of the power smoothing control model set to τ = 150 and computed the output curve (Fig. 8).
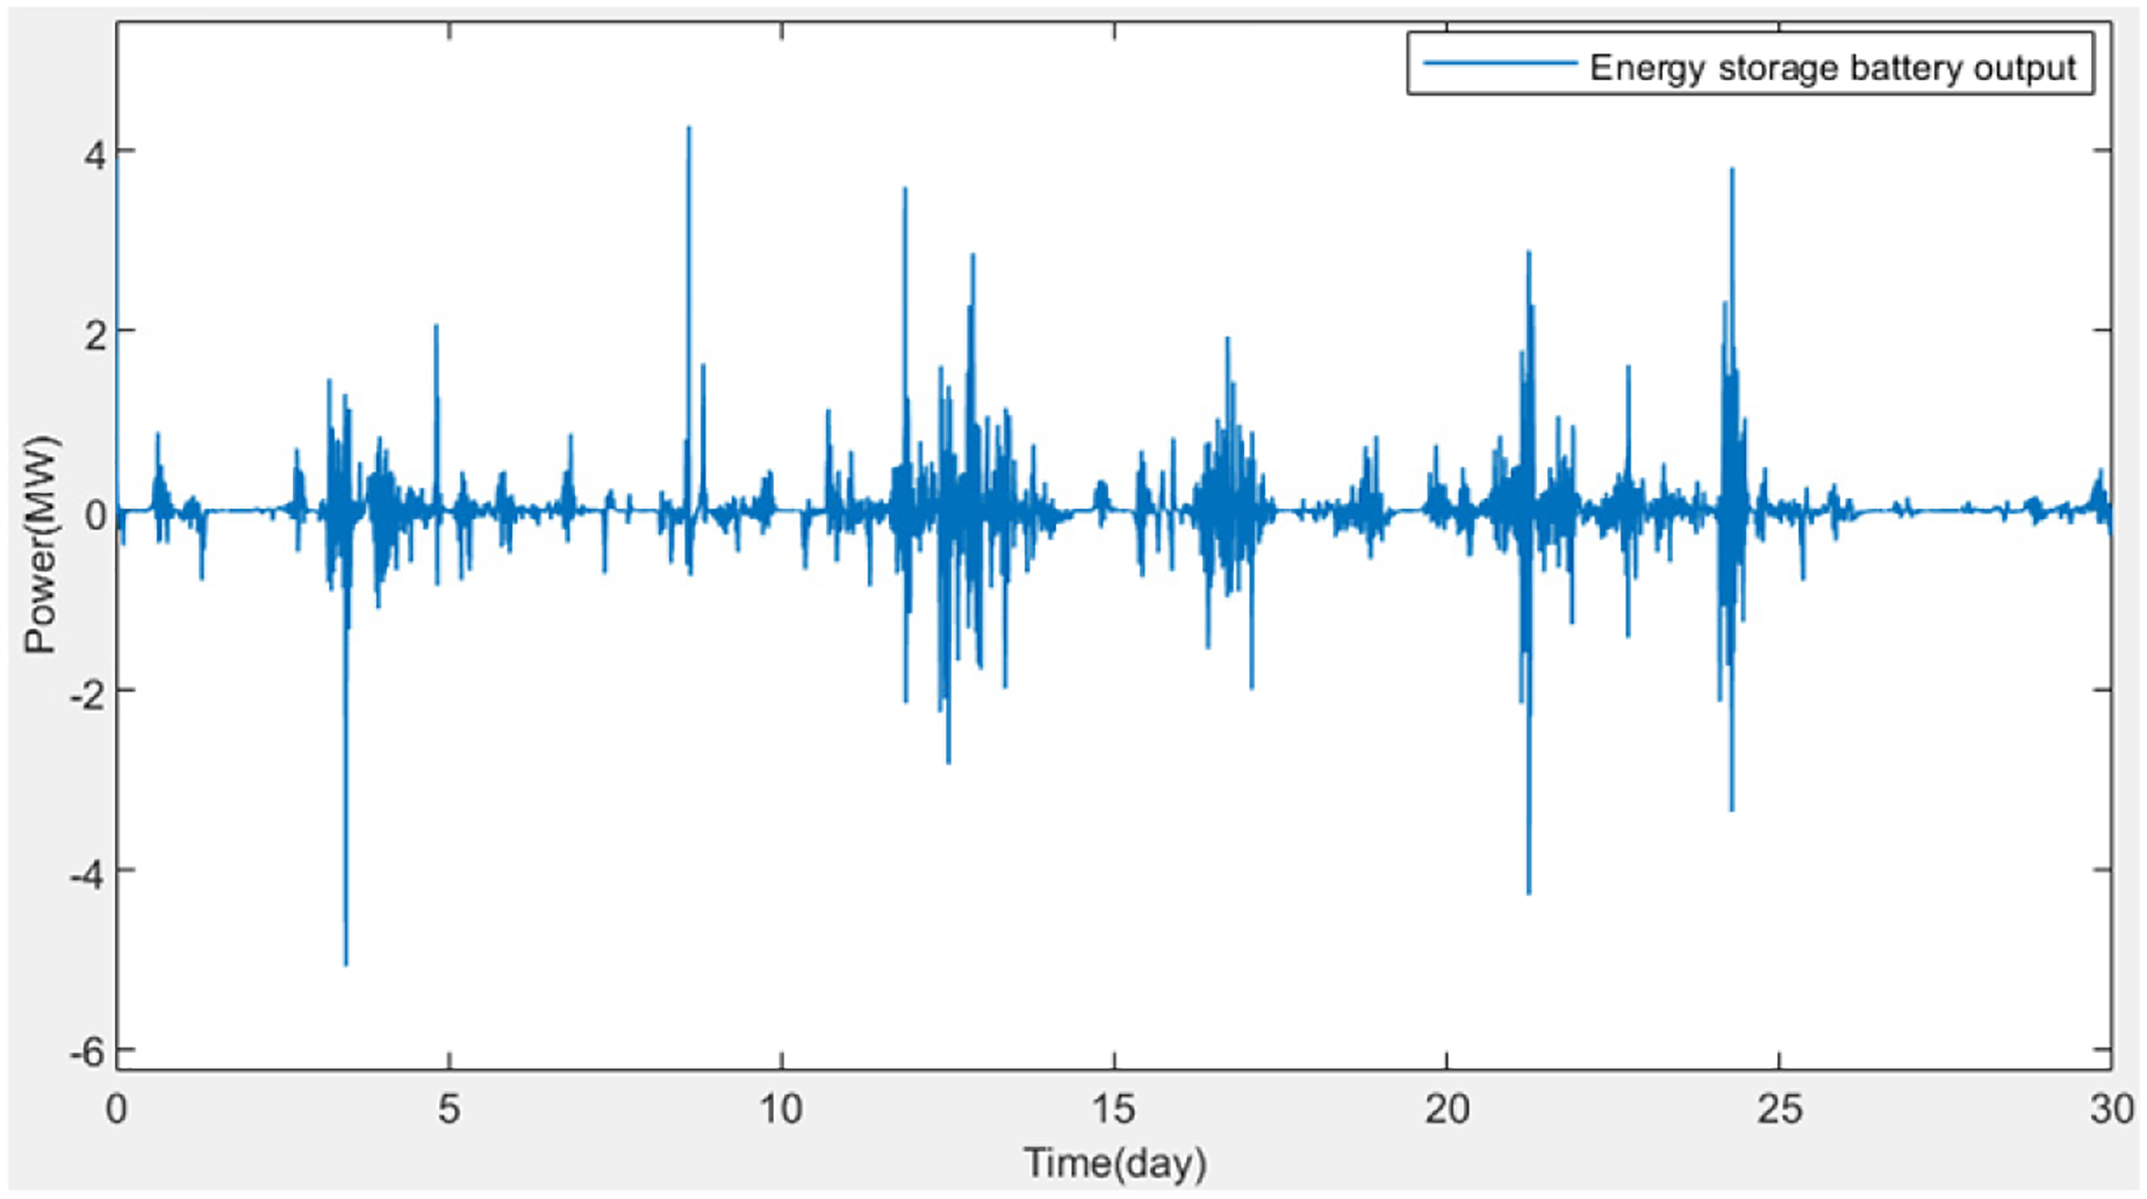
Figure 8: Charging and discharging power curve of the proposed BESS for the Gansu wind power data
To prevent energy storage batteries from exceeding their operational limits, the capacity is set according to the expected energy storage output curve, with an average charge-discharge rate of 0.5 Cr. The maximum charge-discharge rate is capped at 2 Cr, and the SOC is maintained within a range of 0.05 to 0.95. Should these constraints be exceeded, the power grid is utilized to mitigate the surplus wind power. The performance parameters of the model are provided in Table 3.

where the calculation formula for Et is
To investigate the effects of performance degradation, ambient temperature, and random output on BESS, we conducted simulations for the following seven cases studies, as described in Table 4. Case A represents normal operation; Case B and Case C simulate conditions after 6 and 12 months of operation, with the SOH reduced to 0.918 and 0.837, respectively. Case D and Case E correspond to ambient temperatures of 40°C and 55°C, respectively. Case F and Case G involve constant power operation, with Case F limiting the SOC range to 0–1 and Case G limiting the SOC range to 0.2–0.8.

Based on the specified conditions, simulations were conducted to obtain BESS related parameters, as shown in Table 5. To enhance the clarity of the images, the results are divided into three groups. Fig. 9 presents the simulation results for Cases A, B, and C, which are used to study the impact of performance degradation. Fig. 10 displays the results for Cases A, D, and E, focusing on the effects of ambient temperature. Fig. 11 shows the results for Cases A, F, and G, comparing the influence of random output vs. constant power output on BESS.

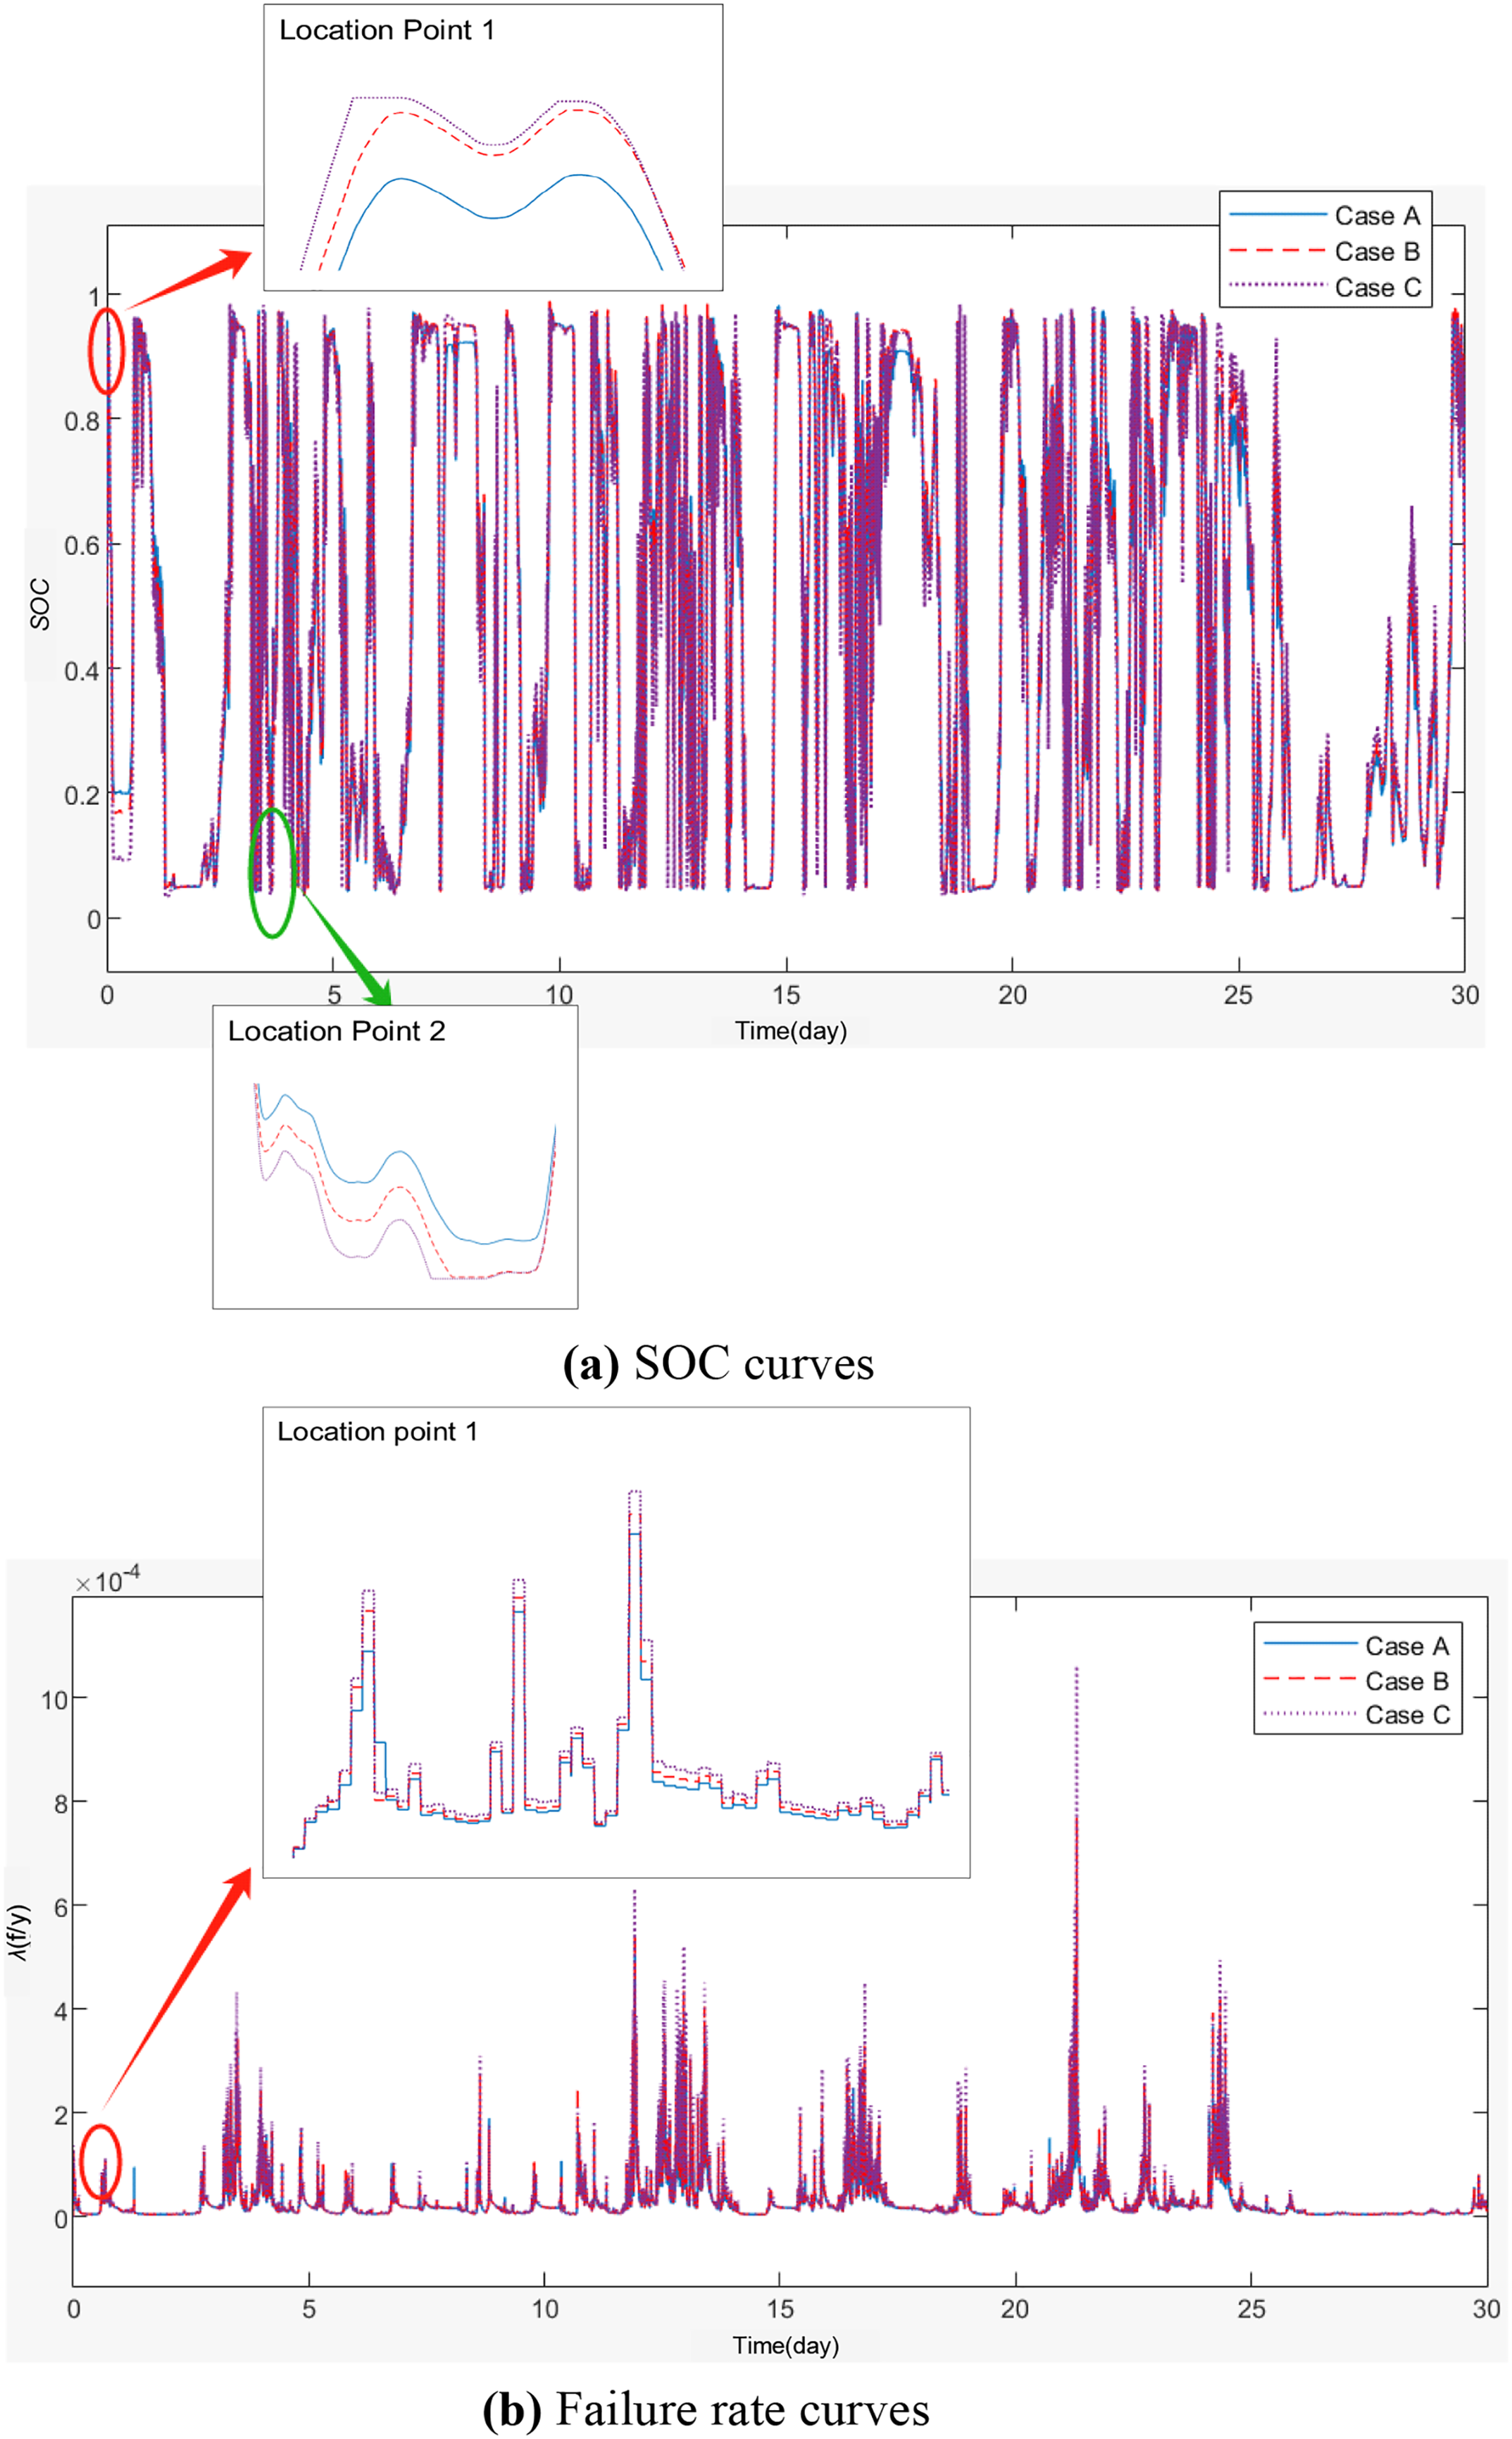
Figure 9: Simulation results under different performance degradation levels
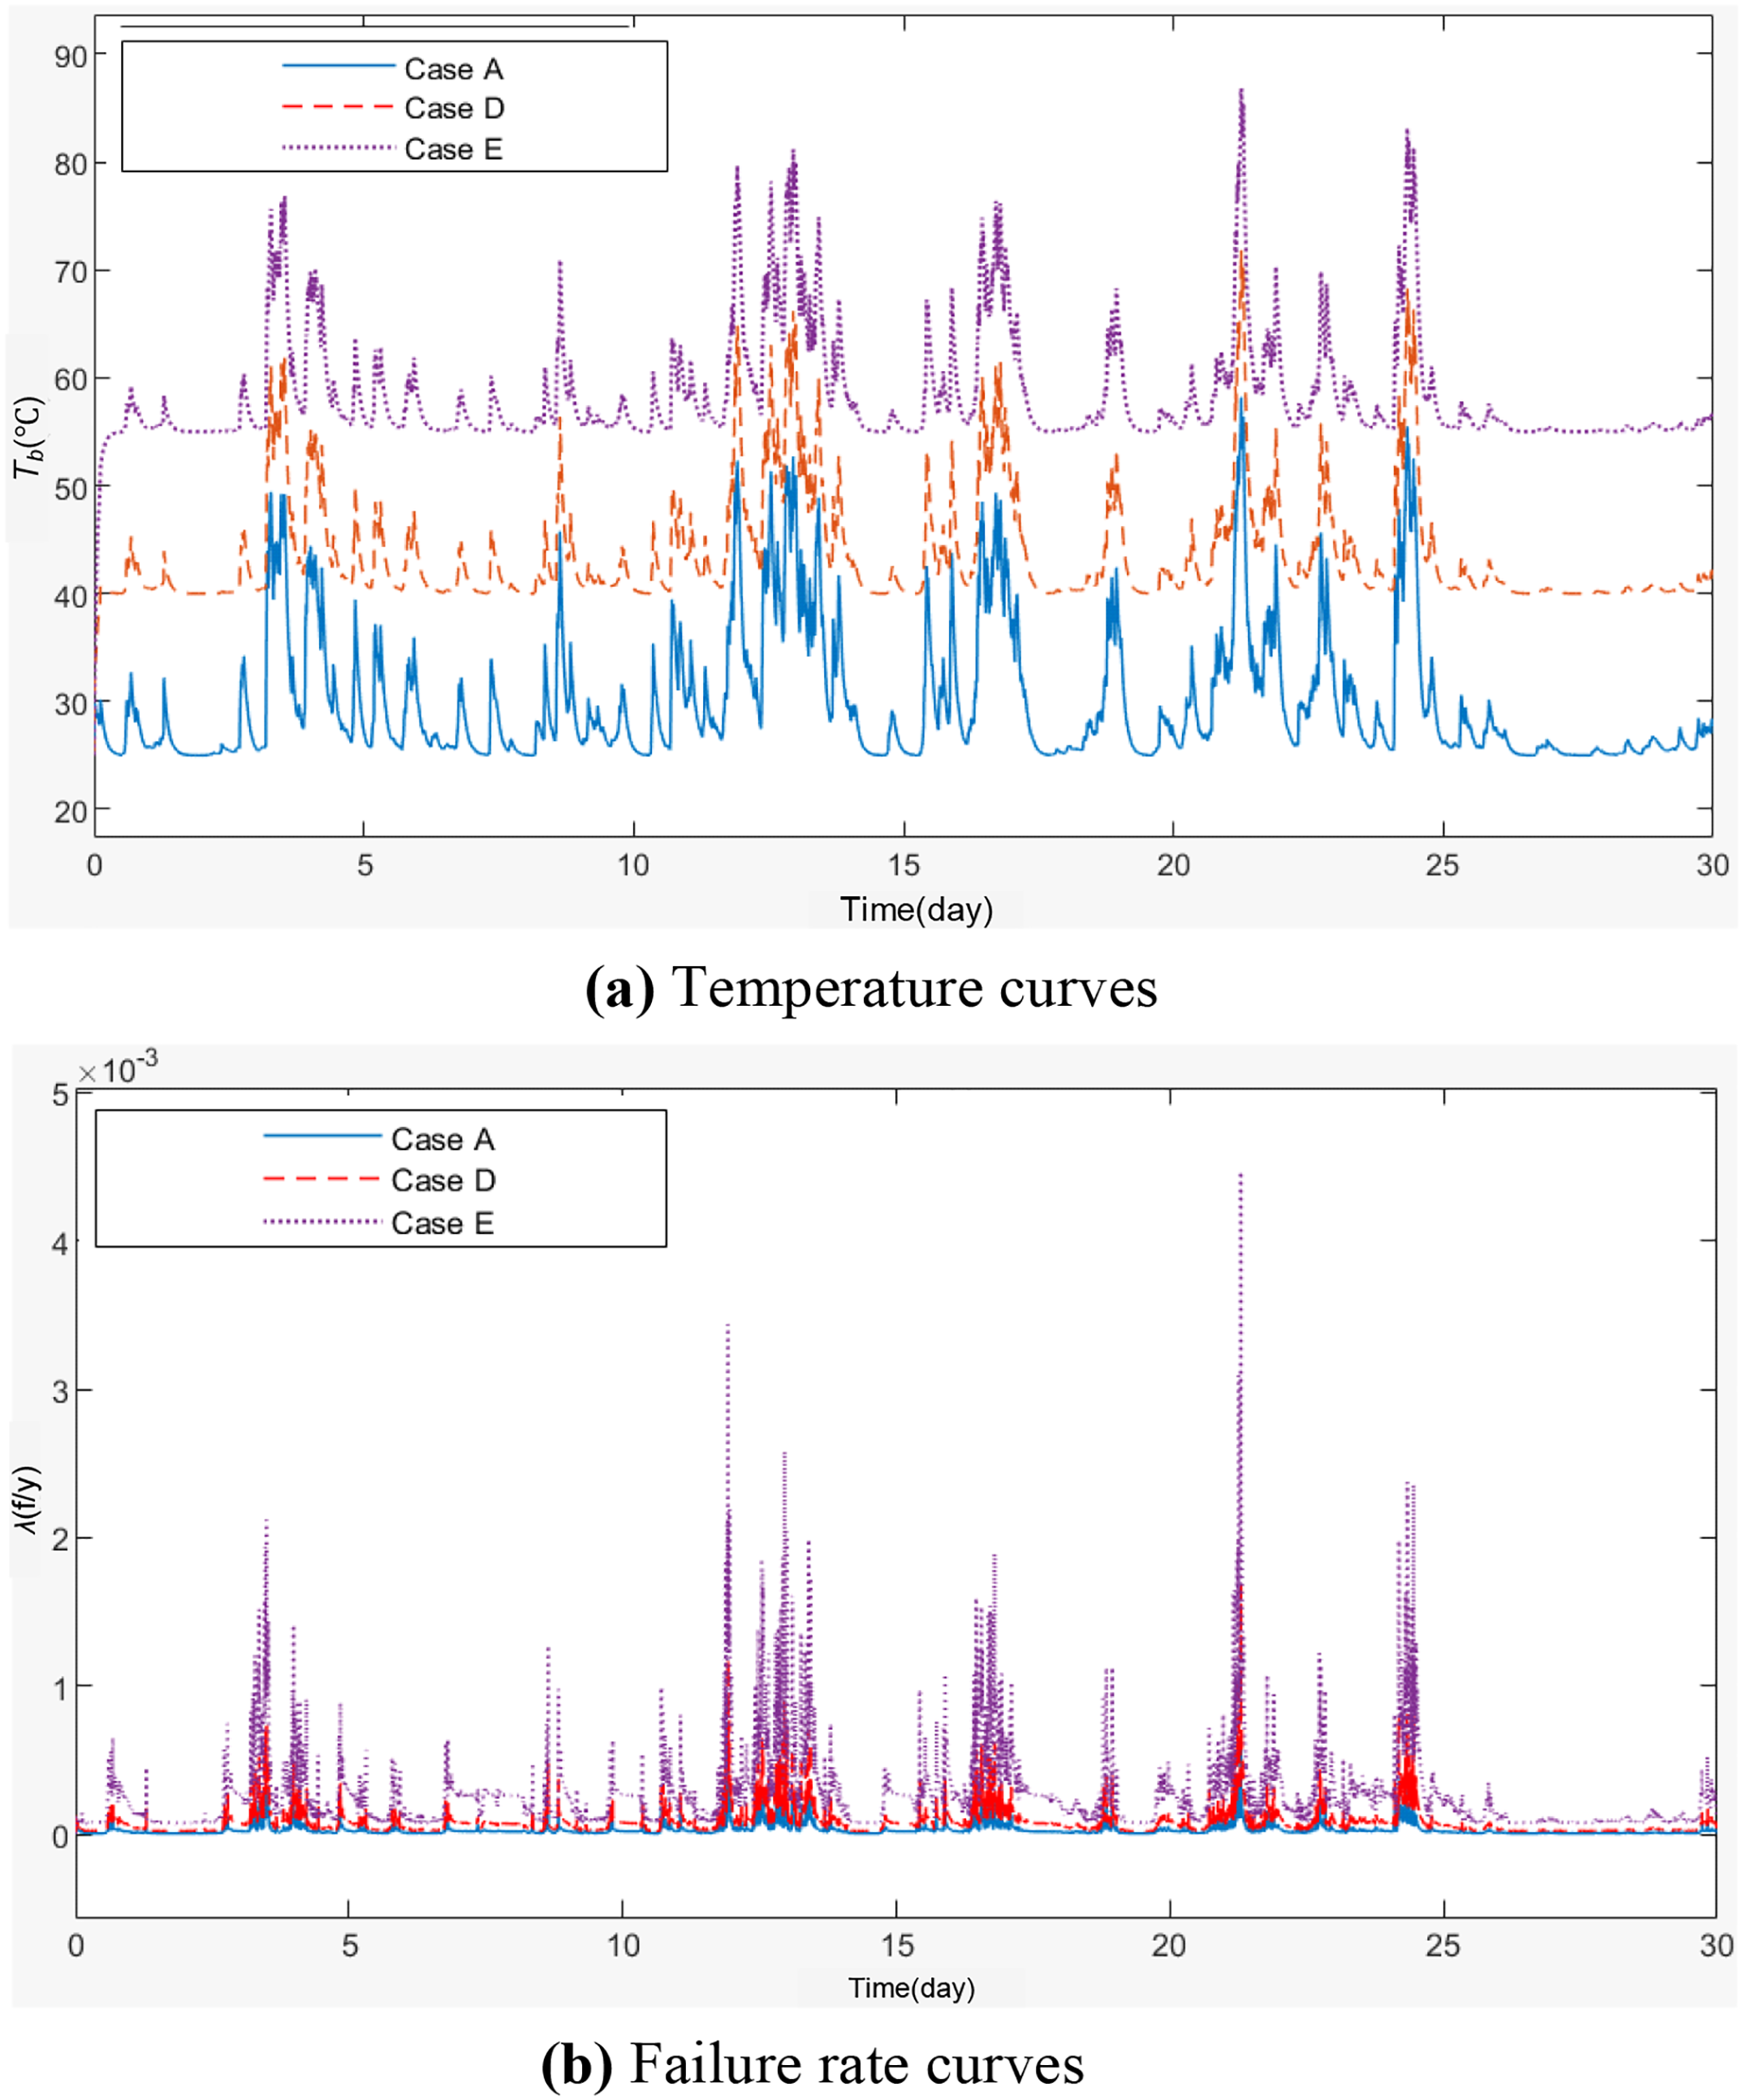
Figure 10: Simulation results under different ambient temperatures
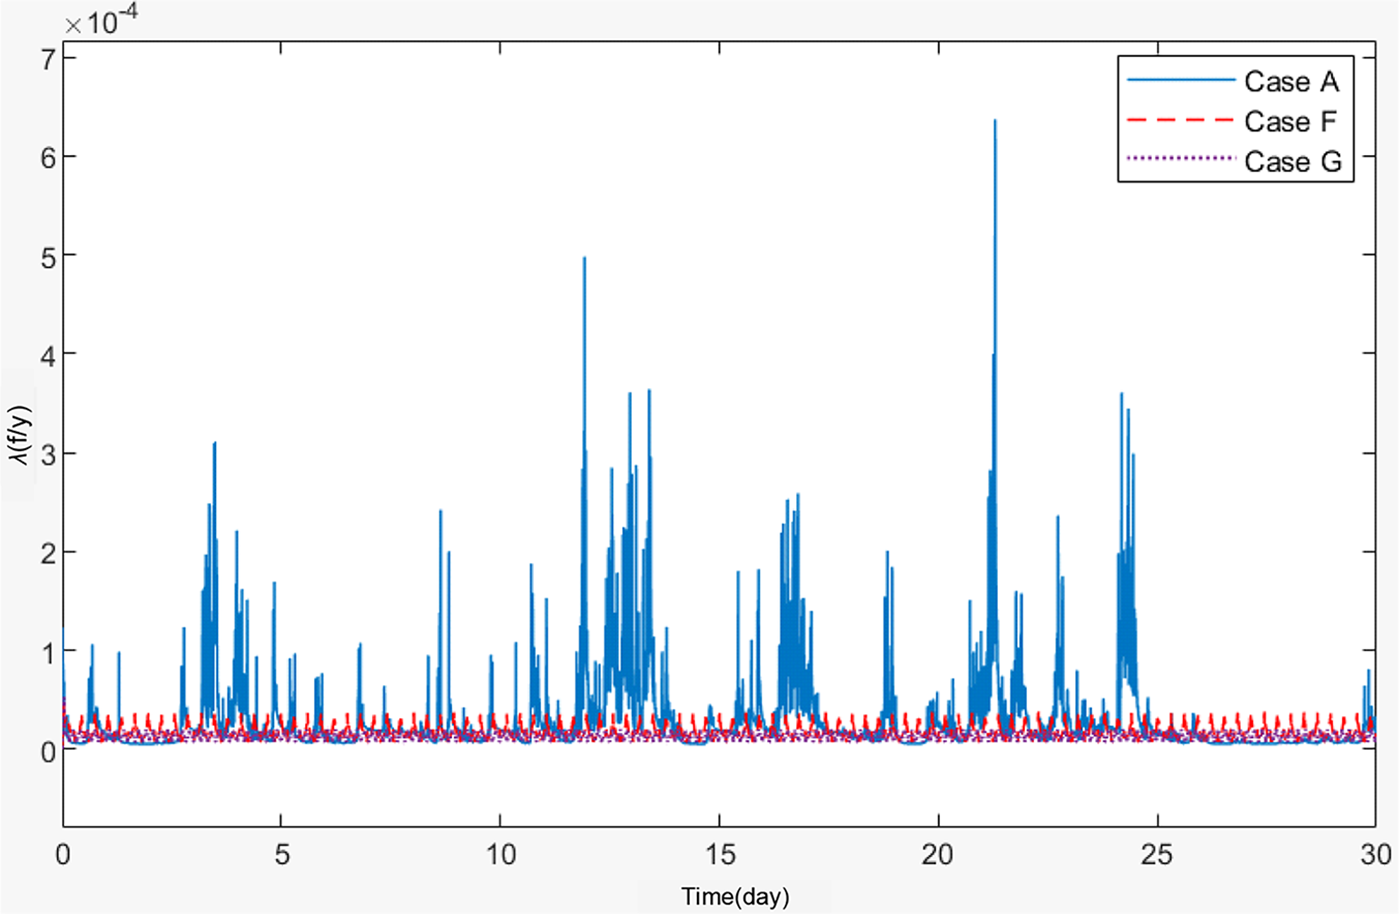
Figure 11: Failure rate curves under different kinds of output
From the results, it is evident that compared to constant power operation, random output under grid-connected scenarios accelerates energy storage batteries aging and increases failure risk. Additionally, both increased temperature and performance degradation accelerate the capacity degradation of BESS, thereby raising the likelihood of failures. The specific analysis is as follows:
Comparing Cases B and C with Case A, it can be observed that performance degradation results in a gradual increase in the equivalent cycle factor. This is because the rate of performance degradation does not significantly change before the occurrence of capacity “diving”. Due to capacity degradation, the SOC fluctuation range is larger in Cases B and C (Fig. 9a). Location Points 1 and 2 (Fig. 9a) illustrate this phenomenon, leading to more frequent SOC boundary reaches and operational shutdowns in Cases B and C. At Location Point 1 (Fig. 9a), Case C experiences a shutdown due to an elevated SOC, while Cases A and B do not encounter this issue. Notably, Case A maintains a significant safety margin. This explains the reduced ability of energy storage to smooth wind power fluctuations as capacity degrades and the corresponding decrease in amount of smoothed energy. As the capacity of the energy storage batteries degrades, its failure rate gradually increases, with the maximum failure rate rise being particularly noticeable (Fig. 9b). The maximum failure rate in Case C is 1.062 × 10⁻³ f/y, which is 1.69 times that of Case A.
Comparing Cases D and E with Case A, it is evident that ambient temperature has a significant impact on the energy storage temperature (Fig. 10a), which in turn greatly affects performance degradation and failure risk. As the temperature increases, the rate of performance degradation of the Li-ion battery accelerates significantly, and the failure rate increases accordingly. The time-varying failure rates in descending order are Cases E, D, and A, with Case E having the highest failure rate, reaching a maximum of 4.466 × 10⁻³ f/y (Fig. 10b). The acceleration of performance degradation and the increase in failure rate exhibit a nonlinear aggravation trend with temperature, indicating that elevated temperatures have an exponentially negative impact on battery performance degradation and the increase in failure rate. Simultaneously, due to the temperature’s impact on battery performance, the BESS’s ability to smooth wind power slightly decreases as the temperature rises, since BESS is more likely to reach the SOC limit boundary under high temperatures.
Comparing Cases F and G with Case A, it can be seen that under grid-connected scenarios, for the same amount of charge and discharge energy, the average equivalent cycle factor of the energy storage battery is higher than that under constant power output, leading to a faster performance degradation rate. The failure rate follows a similar rule to the equivalent cycle factor; under grid-connected scenarios, the average failure rate is more than twice that under constant power output, with the maximum failure rate exceeding 10 times. This is due to the high charge-discharge rate required at certain moments in grid-connected scenarios, although such high-risk points are relatively infrequent (Fig. 11). It is clear that grid-connected scenarios significantly accelerate the performance degradation of energy storage batteries and greatly increase the failure rate.
5.3 Power Grid Failure Response
During the process of wind power smoothing by the BESS, it is assumed that on the 23rd day at around 1 o’clock in the morning, a failure occurs in the system, requiring additional support from the BESS. The BESS provides an additional output of 405.6 kW, sustaining it for 15 min. Through simulation calculations, the SOC curve and the failure rate curve for the energy storage on the 23rd day, when participating in power grid failure response, are obtained and compared with the relevant parameters of the energy storage when not participating in power grid failure response, as shown in Figs. 12–13.
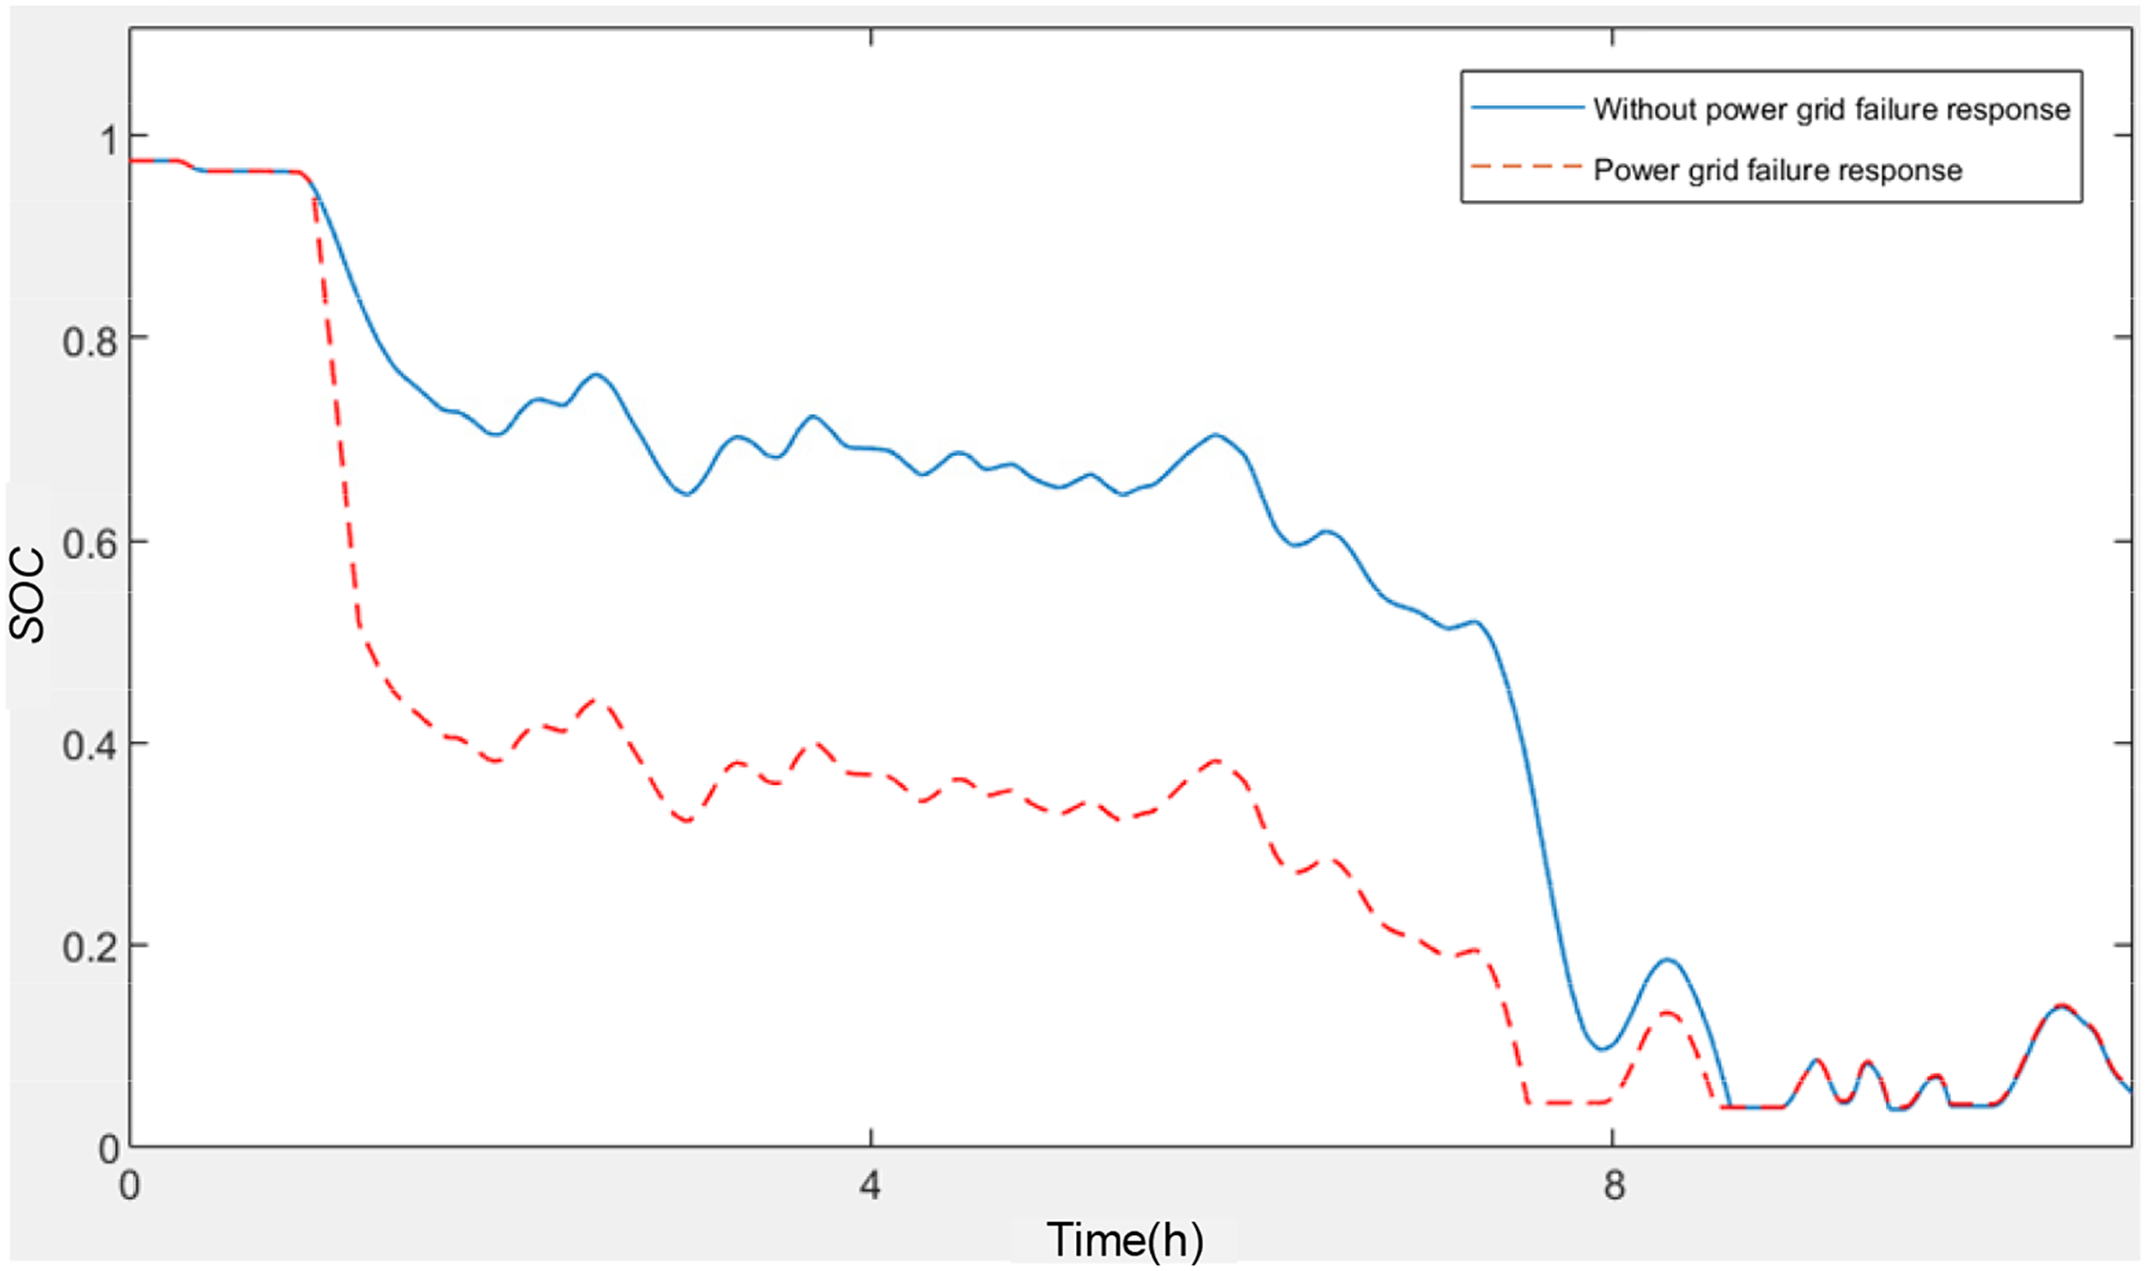
Figure 12: The SOC curves of BESS with and without power grid failure response
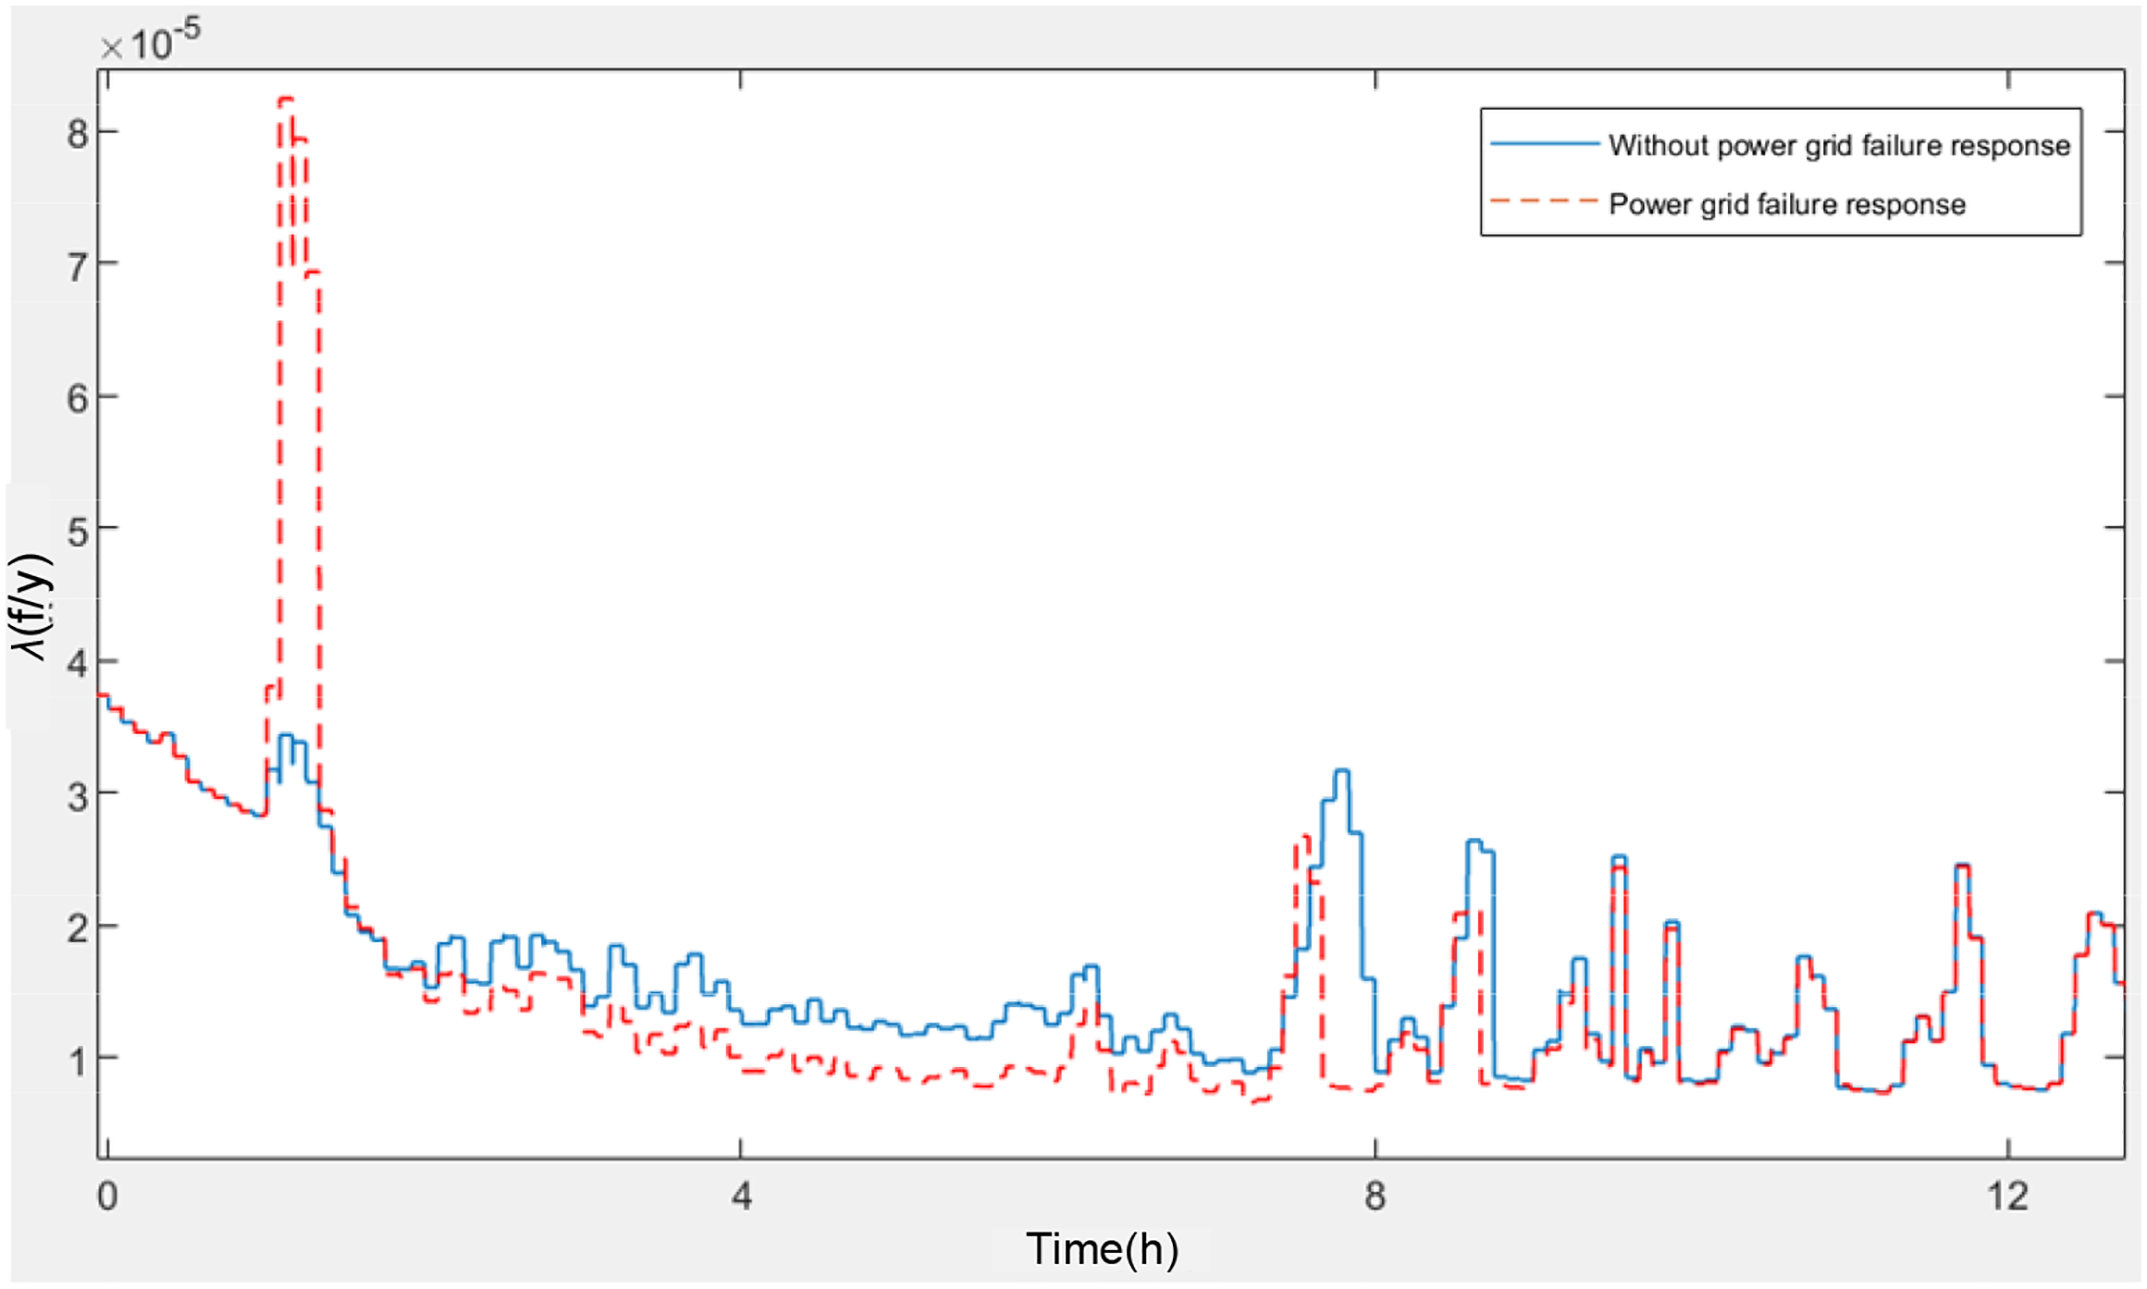
Figure 13: The failure rate curves of BESS with and without power grid failure response
It can be observed that when the BESS is involved in power grid failure response, the SOC significantly decreases (Fig. 12). At the completion of the power grid failure response, the SOC is 0.516, which is a reduction of 0.433 compared to the 0.949 when not involved in power grid failure response. Concurrently, during the power grid failure response period, the failure rate increases substantially due to the increased charge-discharge rate and a drop in SOC (Fig. 13), reaching a peak of 8.247 × 10⁻⁵ f/y, which is an increase of 4.807 × 10⁻⁵ f/y compared to the 3.440 × 10⁻⁵ f/y when not involved in power grid failure response, indicating a multi-fold increase in the risk of failure.
After the power grid failure response is concluded, for a period, the SOC of the BESS remains below the level when not involved in power grid failure response due to the energy consumed during the power grid failure response (Fig. 12). It reaches the lowest SOC limit around 7:30 in the morning and remains there for approximately 25 min, during which the system is unable to participate in wind power smoothing. This situation does not occur when not involved in power grid failure response, and thus, participation in power grid failure response has a certain negative impact on the BESS’s ability to smooth wind power. In terms of the failure rate, after the power grid failure response ends, the charge-discharge rate decreases, leading to a reduction in the failure rate (Fig. 13). However, it remains higher than the situation when not involved in power grid failure response. Nevertheless, during the subsequent charging phase, when the SOC is low, both the electrical failure coefficient and the thermal failure coefficient are smaller, resulting in a lower failure rate for the BESS during the charging phase when involved in power grid failure response compared to normal operation.
This article addresses the risk analysis of BESS in new energy grid-connected scenarios by establishing a detailed simulation model of the TEP coupling of energy storage batteries and a battery pack operation risk model. These models can be used for comprehensive analysis of different working conditions in the medium- to long-term response of grid-connected energy storage. The specific contributions and innovations are as follows:
(1) Considering the degradation pattern of energy storage batteries, this study proposes an equivalent cycle factor and a cycle life related to the charge-discharge rate based on the mechanism of capacity diving. By integrating a lumped thermal model, a TEP coupling model for energy storage is established, enabling detailed simulation of grid-connected BESS.
(2) By integrating electrical and thermal abuse factors, time-varying failure coefficients are proposed based on battery SOC and charge rate. These coefficients are corrected using an equivalent cycle factor that characterizes performance degradation, leading to the development of a battery pack operational risk model. This model, combined with the TEP coupling model, enables extensive analysis through deterministic operational scenario simulations and predictive failure risk calculations, providing a valuable tool for the study of energy storage batteries.
(3) Through case studies, the performance and risk of BESS in microgrid energy storage, wind power smoothing, and power grid failure response scenarios are analyzed. The results demonstrate that the model proposed in this paper comprehensively considers the impact of various factors in different grid-connected scenarios. While maintaining simulation efficiency, it achieves real-time assessment of failure risk, which is of significant importance for the safety analysis of grid-connected BESS.
The model established in this study is deterministic simulation model. In future research, methods such as artificial intelligence can be integrated to further develop predictive models.
Acknowledgement: The authors acknowledge the reviewers for providing valuable comments and helpful suggestions to improve the manuscript.
Funding Statement: Supported by Open Fund of National Key Laboratory of Power Grid Safety (No. XTB51202301386).
Author Contributions: The authors confirm contribution to the paper as follows: study conception and design: Xiaohui Ye, Fucheng Tan; data collection and formal analysis: Shaohang Hao; methodology and software: Xiaohui Ye, Xinli Song; analysis and interpretation of results: Fucheng Tan, Hanyang Dai; draft manuscript preparation: Xia Li, Shixia Mu. All authors reviewed the results and approved the final version of the manuscript.
Availability of Data and Materials: The original contributions presented in the study are included in the article, further inquiries can be directed to the corresponding author.
Ethics Approval: Not applicable.
Conflicts of Interest: The authors declare that they have no conflicts of interest to report regarding the present study.
References
1. W. Wang, X. Cheng, J. Li, H. Zheng, and M. Li, “Role of renewable energy and storage in low-carbon power systems,” Front. Energy Res., vol. 12, Aug. 2024, Art. no. 1442144. doi: 10.3389/fenrg.2024.1442144. [Google Scholar] [CrossRef]
2. M. A. Basit, S. Dilshad, R. Badar, and S. M. Sami ur Rehman, “Limitations, challenges, and solution approaches in grid-connected renewable energy systems,” Int. J. Energy Res., vol. 44, no. 6, pp. 4132–4162, Jan. 2020. doi: 10.1002/er.5033. [Google Scholar] [CrossRef]
3. X. Xie, N. Ma, W. Liu, W. Zhao, P. Xu and H. Li, “Functions of energy storage in renewable energy dominated power systems: Review and prospect,” Proc. CSEE, vol. 43, no. 1, pp. 158–169, Apr. 2023. [Google Scholar]
4. J. Wang, “State of health estimation of li-ion battery based on least squares support vector machine error compensation mode,” (in ChineseChina Emerg. Manag., no. 5, pp. 10–13, May 2021. [Google Scholar]
5. C. Zhao, P. B. Andersen, C. Træholt, and S. Hashemi, “Grid-connected battery energy storage system: A review on application and integration,” Renew. Sustain. Energ. Rev., vol. 182, Aug. 2023, Art. no. 113400. doi: 10.1016/j.rser.2023.113400. [Google Scholar] [CrossRef]
6. T. Chen et al., “Applications of lithium-ion batteries in grid-scale energy storage systems,” Trans. Tianjin Univ., vol. 26, no. 3, pp. 208–217, Feb. 2020. doi: 10.1007/s12209-020-00236-w. [Google Scholar] [CrossRef]
7. L. Xie, A. A. Thatte, and Y. Gu, “Multi-time-scale modeling and analysis of energy storage in power system operations,” in IEEE 2011 Energy Tech, May 2011, pp. 1–6. doi: 10.1109/EnergyTech.2011.5948502. [Google Scholar] [CrossRef]
8. X. Ye, T. Liu, G. Wu, Z. Su, W. Zhong and X. Song, “Multi-time scale simulation modeling and characteristic analysis of large-scale grid-connected battery energy storage system,” Proc. CSEE, vol. 35, no. 11, pp. 2635–2644, Jun. 2015. [Google Scholar]
9. R. Zafar and H. R. Pota, “Multi-timescale coordinated control with optimal network reconfiguration using battery storage system in smart distribution grids,” IEEE Trans. Sustain. Energy, vol. 14, no. 4, pp. 2338–2350, Oct. 2023. doi: 10.1109/TSTE.2023.3262565. [Google Scholar] [CrossRef]
10. X. Li, C. Yuan, X. Li, and Z. Wang, “State of health estimation for Li-ion battery using incremental capacity analysis and Gaussian process regression,” Energy, vol. 190, Jan. 2020, Art. no. 116467. doi: 10.1016/j.energy.2019.116467. [Google Scholar] [CrossRef]
11. Z. Wang, J. Ma, and L. Zhang, “State-of-health estimation for lithium-ion batteries based on the multi-island genetic algorithm and the Gaussian process regression,” IEEE Access, vol. 5, no. 5, pp. 21286–21295, Oct. 2017. doi: 10.1109/ACCESS.2017.2759094. [Google Scholar] [CrossRef]
12. L. Chen, Z. Lü, W. Lin, J. Lin, and H. Pan, “A new state-of-health estimation method for lithium-ion batteries through the intrinsic relationship between ohmic internal resistance and capacity,” Measurement, vol. 116, pp. 586–595, Nov. 2018. doi: 10.1016/j.measurement.2017.11.016. [Google Scholar] [CrossRef]
13. P. Ren, S. L. Wang, M. He, Y. Fan, W. Cao and W. Xie, “State of health estimation of Li-ion battery based on dual calibration of internal resistance increasing and capacity fading,” (in ChineseEnergy Storage Sci. Technol., vol. 10, no. 2, pp. 738–743, Mar. 2021. doi: 10.19799/j.cnki.2095-4239.2020.0395. [Google Scholar] [CrossRef]
14. J. Wang et al., “Cycle-life model for graphite-LiFePO4 cells,” J. Power Sources, vol. 196, no. 8, pp. 3942–3948, Apr. 2011. doi: 10.1016/j.jpowsour.2010.11.134. [Google Scholar] [CrossRef]
15. M. Shi, X. Shi, Z. Li, X. Wang, S. Ren and F. Di, “Study on the aging characteristics of li-ion battery based on the electro-thermal and aging joint simulation platform,” in 2020 IEEE/IAS Ind. Commer. Power Syst. Asia (I&CPS Asia), IEEE Jul. 2020, pp. 257–261. doi: 10.1109/ICPSAsia48933.2020.9208456. [Google Scholar] [CrossRef]
16. A. J. Torregrosa, A. Broatch, A. Olmeda, and L. Agizza, “A semi-empirical model of the calendar ageing of lithium-ion batteries aimed at automotive and deep-space applications,” J. Energy Storage, vol. 80, Mar. 2024, Art. no. 110388. doi: 10.1016/j.est.2023.110388. [Google Scholar] [CrossRef]
17. H. Zhang, J. Gao, L. Kang, Y. Zhang, L. Wang and K. Wang, “State of health estimation of lithium-ion batteries based on modified flower pollination algorithm-temporal convolutional network,” Energy, vol. 283, Nov. 2023, Art. no. 128742. doi: 10.1016/j.energy.2023.128742. [Google Scholar] [CrossRef]
18. H. Zhang, H. Sun, L. Kang, Y. Zhang, L. Wang and K. Wang, “Prediction of health level of multiform lithium sulfur batteries based on incremental capacity analysis and an improved LSTM,” Prot. Control Mod. Power Syst., vol. 9, no. 2, pp. 21–31, Mar. 2024. doi: 10.23919/PCMP.2023.000280. [Google Scholar] [CrossRef]
19. G. Nuroldayeva, Y. Serik, D. Adair, B. Uzakbaiuly, and Z. Bakenov, “State of health estimation methods for lithium-Ion Batteries,” Int. J. Energy Res., vol. 2023, no. 1, Mar. 2023, Art. no. 4297545. doi: 10.1155/2023/4297545. [Google Scholar] [CrossRef]
20. X. Feng, M. Ouyang, X. Liu, L. Lu, Y. Xia and X. He, “Thermal runaway mechanism of lithium ion battery for electric vehicles: A review,” Energy Storage Mater., vol. 10, no. 3, pp. 246–267, Jan. 2018. doi: 10.1016/j.ensm.2017.05.013. [Google Scholar] [CrossRef]
21. Z. Zhou, M. Li, X. Zhou, L. Li, X. Ju and L. Yang, “Investigating thermal runaway triggering mechanism of the prismatic lithium iron phosphate battery under thermal abuse,” Renew. Energy, vol. 220, Jan. 2024, Art. no. 119674. doi: 10.1016/j.renene.2023.119674. [Google Scholar] [CrossRef]
22. C. J. Wang et al., “Thermal runaway behavior and features of LiFePO4/graphite aged batteries under overcharge,” Int. J. Energy Res., vol. 44, no. 7, pp. 5477–5487, Mar. 2020. doi: 10.1002/er.5298. [Google Scholar] [CrossRef]
23. S. Xie, Y. Gong, X. Ping, J. Sun, X. Chen and Y. He, “Effect of overcharge on the electrochemical and thermal safety behaviors of LiNi0.5Mn0.3Co0.2O2/graphite lithium-ion batteries,” J. Energy Storage, vol. 46, Feb. 2022, Art. no. 103829. doi: 10.1016/j.est.2021.103829. [Google Scholar] [CrossRef]
24. D. Ren et al., “Investigating the relationship between internal short circuit and thermal runaway of lithium-ion batteries under thermal abuse condition,” Energy Storage Mater., vol. 34, pp. 563–573, Jan. 2021. doi: 10.1016/j.ensm.2020.10.020. [Google Scholar] [CrossRef]
25. P. Ping, Q. Wang, Y. Chung, and J. Wen, “Modelling electro-thermal response of lithium-ion batteries from normal to abuse conditions,” Appl. Energy, vol. 205, pp. 1327–1344, Nov. 2017. doi: 10.1016/j.apenergy.2017.08.073. [Google Scholar] [CrossRef]
26. Y. Jin et al., “Explosion hazards study of grid-scale lithium-ion battery energy storage station,” J. Energy Storage, vol. 42, Oct. 2021. doi: 10.1016/j.est.2021.102987. [Google Scholar] [CrossRef]
27. Z. Yu, G. Meng, X. Xie, Y. Zhao, and Y. Cheng, “Simulation Research on overcharge thermal runaway of lithium iron phosphate energy storage battery,” J. Electr. Eng., vol. 17, no. 3, pp. 30–39, Sep. 2022. [Google Scholar]
28. X. Feng, Y. Pan, X. He, L. Wang, and M. Ouyang, “Detecting the internal short circuit in large-format lithium-ion battery using model-based fault-diagnosis algorithm,” J. Energy Storage, vol. 18, pp. 26–39, Aug. 2018. doi: 10.1016/j.est.2018.04.020. [Google Scholar] [CrossRef]
29. S. Zhang, D. Li, J. Zhang, and G. Liu, “Equivalent time-varying internal resistance model of lithium-ion batteries with its applications,” Chinese J. Sci. Instrum., vol. 45, no. 5, pp. 1–10, Jul. 2024. [Google Scholar]
30. Z. Xu, J. Wang, P. D. Lund, and Y. Zhang, “Co-estimating the state of charge and health of lithium batteries through combining a minimalist electrochemical model and an equivalent circuit model,” Energy, vol. 240, 2022, Art. no. 122815. doi: 10.1016/j.energy.2021.122815. [Google Scholar] [CrossRef]
31. S. Khaleghi et al., “Developing an online data-driven approach for prognostics and health management of lithium-ion batteries,” Appl. Energy, vol. 308, Jan. 2022, Art. no. 118348. doi: 10.1016/j.apenergy.2021.118348. [Google Scholar] [CrossRef]
32. L. Chen, M. Hu, K. Cao, S. Li, Z. Su and G. Jin, “Core temperature estimation based on electro-thermal model of lithium-ion batteries,” Int. J. Energy Res., vol. 44, no. 7, pp. 5320–5333, Mar. 2020. doi: 10.1002/er.5281. [Google Scholar] [CrossRef]
33. Q. Xia et al., “Multiphysical modeling for life analysis of lithium-ion battery pack in electric vehicles,” Renew. Sustain. Energ. Rev., vol. 131, Oct. 2020, Art. no. 109993. doi: 10.1016/j.rser.2020.109993. [Google Scholar] [CrossRef]
34. X. Zhang, J. Hou, Z. Wang, and Y. Jiang, “Study of SOC estimation by the ampere-hour integral method with capacity correction based on LSTM,” Batteries, vol. 8, Oct. 2022, Art. no. 170. doi: 10.3390/batteries8100170. [Google Scholar] [CrossRef]
35. M. Naumann, F. B. Spingler, and A. Jossen, “Analysis and modeling of cycle aging of a commercial LiFePO4/graphite cell,” J. Power Sources, vol. 451, Mar. 2020, Art. no. 227666. doi: 10.1016/j.jpowsour.2019.227666. [Google Scholar] [CrossRef]
36. J. Xie, Z. Li, J. Jiao, and X. Li, “Lumped-parameter temperature evolution model for cylindrical Li-ion batteries considering reversible heat and propagation delay,” Measurement, vol. 173, Mar. 2021, Art. no. 108567. doi: 10.1016/j.measurement.2020.108567. [Google Scholar] [CrossRef]
37. I. Baghdadi, O. Briat, J. Y. Delétage, P. Gyan, and J. M. Vinassa, “Lithium battery aging model based on Dakin’s degradation approach,” J. Power Sources, vol. 325, pp. 273–285, Sep. 2016. doi: 10.1016/j.jpowsour.2016.06.036. [Google Scholar] [CrossRef]
38. Z. Wang, F. Sun, and C. Lin, “An analysis on the influence of inconsistencies upon the service life of power battery packs,” (in ChineseTrans. Beijing Inst. Technol., no. 7, pp. 577–580, 2006. [Google Scholar]
39. L. Kong, “Effect of lithium-ion battery parameters variation on performance aging of battery pack,” M.S. thesis. Dept. Electron. Eng., Tsinghua Univ., Beijing, China, 2021. [Google Scholar]
40. W. Yu, Y. Zheng, and Y. Zhang, “Carbon emission reduction by echelon utilization of retired vehicle power batteries in energy storage power stations,” World Electr. Veh. J., vol. 13, no. 8, Aug 2022, Art. no. 144. doi: 10.3390/wevj13080144. [Google Scholar] [CrossRef]
41. X. G. Yang, Y. Leng, G. Zhang, S. Ge, and C. Y. Wang, “Modeling of lithium plating induced aging of lithium-ion batteries: Transition from linear to nonlinear aging,” J. Power Sources, vol. 360, pp. 28–40, Aug. 2017. doi: 10.1016/j.jpowsour.2017.05.110. [Google Scholar] [CrossRef]
42. Q. Zhu, Q. Wu, Y. Xu, X. Yu, and R. Huang, “Aging of nickel-cobalt-aluminum lithium-ion battery in different SOC intervals,” (in ChineseJ. Zhejiang Univ. (Eng. Sci.), vol. 57, no. 4, pp. 666–674, Mar. 2023. [Google Scholar]
43. C. Zhang, Z. Wang, S. Liu, L. Jin, and Q. Yang, “Detection method of overdischarge-induced internal short circuit in lithium-ion batteries based on electrochemical impedance spectroscopy,” (in ChineseTrans. China Electr. Society, vol. 38, no. 23, pp. 6279–6291+6344, Dec. 2023. [Google Scholar]
44. T. Dong et al., “Thermal behavior analysis of safety faults evolution for li-ion battery,” J. Eng. Thermophys., vol. 44, no. 1, pp. 175–182, Jan. 2023. [Google Scholar]
45. X. He, “Experimental study on thermal runaway characteristics of large capacity NCM lithium-ion batteries under the electrothermic interaction,” M.S. thesis. Dept. Electron. Eng., Univ. of Sci. Technol. of China, China, 2023. [Google Scholar]
46. D. Wang et al., “Effects of overdischarge rate on thermal runaway of NCM811 Li-ion batteries,” Energies, vol. 13, no. 15Jul. 2020, Art. no. 3885. doi: 10.3390/en13153885. [Google Scholar] [CrossRef]
47. Y. Zhu, T. Wang, X. Gu, L. Hou, and Y. Shang, “Personalized retiring and assessing methods for lithium-ion batteries within the full lifespan,” J. Electr. Eng., vol. 19, no. 1, pp. 79–86, Mar. 2024. [Google Scholar]
48. C. Zhou, “Research on the optimization of energy storage capacity configuration in wind-PV-storage microgrids,” M.S. thesis. Dept. Electron. Eng., Nanjing Univ. of Inf. Sci. Technol., Nanjing, China, 2023. [Google Scholar]
Cite This Article
 Copyright © 2024 The Author(s). Published by Tech Science Press.
This work is licensed under a Creative Commons Attribution 4.0 International License , which permits unrestricted use, distribution, and reproduction in any medium, provided the original work is properly cited.


 Submit a Paper
 Propose a Special lssue
 View Full Text
 Download PDF
 Downloads
 Citation Tools